methods for enhancing the high field in vivo sensitivity ... · spektroskopie (mrs) und...
TRANSCRIPT

POUR L'OBTENTION DU GRADE DE DOCTEUR ÈS SCIENCES
acceptée sur proposition du jury:
Prof. H. Rønnow, président du juryProf. A. Comment, Prof. R. Gruetter, directeurs de thèse
Prof. J.-Ph. Ansermet, rapporteur Prof. P. Tordo, rapporteur
Dr B. van den Brandt, rapporteur
Methods for Enhancing the High Field in vivo Sensitivity of Long-T1 Nuclear Spins via Dynamic Nuclear Polarization
THÈSE NO 5756 (2013)
ÉCOLE POLYTECHNIQUE FÉDÉRALE DE LAUSANNE
PRÉSENTÉE LE 31 mAI 2013
À LA FACULTÉ DES SCIENCES DE BASEGROUPE COmmENT
PROGRAmmE DOCTORAL EN PHYSIQUE
Suisse2013
PAR
Tian CHENG


Love doesn’t mean anything if you’re not willing to make a commitment;
You have to think not only about what you want, but about what she wants.
Not just now, but in the future.
—— Nicholas Sparks, Safe Haven
To those I love. . .


AcknowledgmentsAs time flies, four years PhD study in CIBM becomes a very special part of my memories.
During this period, colleagues, friends and family members brought me valuable life experi-
ence which encourages me to finish the study. Therefore I would like to express my deepest
appreciation to them.
To Prof. Arnaud Comment, my thesis supervisor. Thank you for offering me this great
opportunity to do PhD with you in the DNP field. Without your guide and your interesting
ideas I would not experience all these wonderful technologies and studies about DNP.
To Prof. Rolf Gruetter, my thesis co-supervisor. Thank you for giving me valuable
suggestions and advices to my work, presentations and writings.
To Dr. Ben van den Brandt and Dr. Patrick Hautle, my collaborators in PSI. Thank you for
sharing your wide range of knowledges with me and for kindly treating me as a group member.
To Ms. Jessica Bastiaansen, Mr. Riccardo Balzan and Mr. Andrea Capozzi, my teammates
and also polarized friends. Thank you for bringing me lots of happiness not only in the lab
with your efficient work but also with the beers after work .
To Dr. Arthur Magill and Mr. Yves Pilloud, my teachers in the RF lab. Thank you so much
for always being patient to teach me how to design, simulate and improve the RF circuits.
To Dr. Najat Salameh and Dr. Mor Mishkovsky, my teammates for the DNP projects.
Thank you for helping me to set up the experiment protocols, to modify imaging sequences
and even to translate my thesis.
To Dr. Yuhei Takado, Dr. Lijing Xin and Dr. Hongxia Lei, my listeners. Thank you for
teaching me, encouraging me and sharing your happiness with me as a big family.
To my sister and parents. Thank you for always supporting my "selfish" ideas, giving me
maximal freedom and letting me be independent ten years ago. I am so proud of you.
Last but not the least to my wife, Yu Xia. Thank you for always accompanying and
supporting me. Without you I definitely cannot make all these happen.
Lausanne, 12 May 2013 T.C.
v


AbstractDissolution dynamic nuclear polarization (DNP) became a very powerful technique for
enhancing nuclear magnetic resonance (NMR) signals of insensitive nuclear spins for ana-
lytical chemistry and biomedical research. In this thesis we describe methods and hardware
developments to maximize the NMR signals of substrates of biological interest containing
insensitive nuclear spins with long longitudinal relaxation time T1. The overall aim was to
extend the acquisition time window of in vivo metabolic studies.
The dissolution and transfer procedures of the hyperpolarized molecules from the po-
larizer to the imager prior to in vivo measurements lead to unavoidable losses in nuclear
polarization which are difficult to evaluate once the solution has been injected into an animal.
We proposed a method to measure the polarization of the hyperpolarized molecules inside
the imager bore, 3s following dissolution, at the time of the injection. Our method includes
a radical scavenging process that does not lead to reduced sample concentration and takes
place within a couple of seconds following the dissolution in order to minimize the losses due
to the presence of paramagnetic polarizing agent in the infusate.
The stable radicals used as polarizing agents in the solid-state DNP process become
undesirable in the liquid-state, following dissolution, due to the paramagnetic relaxation effect
on the hyperpolarized nuclear spins and their toxicity to biological tissues. We demonstrated
the feasibility of preparing hyperpolarized alcohol aqueous solutions free of stable radicals by
using spin-labeled thermoresponsive hydrophilic polymer networks. We applied this method
to hyperpolarize tert-butanol, which has been recently shown to be a promising contrast
agent for perfusion imaging, and ethanol, which is an interesting substrate for probing liver
metabolism.
Extensive DNP studies on bio-compatible molecules labeled with 15N and 89Y, which
have exceptionally long-T1, have been carried out to maximize their polarization for in vivo
metabolic and perfusion hyperpolarized MR studies. We designed an in vivo protocol for
investigating the normal brain uptake of choline via injection of hyperpolarized 15N-choline
into rats. We successfully performed the first in vivo hyperpolarized 89Y experiments using
bio-compatible Y[DOTA]− compounds.
Sensitivity and B1 homogeneity are two essential factors for magnetic resonance spec-
troscopy (MRS) and magnetic resonance imaging (MRI). As the magnetic field strength in-
creases, NMR probes become increasingly difficult to design. The main challenges are the
limited probe size, radiation and sample losses caused by the reduced wavelengths as well
as B1 field inhomogeneity. We designed and built surface and birdcage coils for in vivo MR
vii

Abstract
measurements in ultra high magnetic field. Bench tests and in vivo imaging data recorded
with these surface and birdcage coils at 9.4T and 14.1T showed that the surface coil loops had
to have a limited diameter due to sensitivity issue and radiofrequency (RF) power limitation.
For birdcage coils the major losses were not inside the sample or via radiation, but rather
caused by the low filling factor.
keywords: dissolution dynamic nuclear polarization (DNP), nuclear magnetic resonance
(NMR), in vivo magnetic resonance spectroscopy (MRS) and imaging (MRI), longitudinal
relaxation time, radical scavenging, spin-labeled hydrophilic polymer network(SL-hydrogel),
birdcage coil.
viii

ZusammenfassungDie dynamische Kernspinpolarisation (DNP) mit einem Auflösungsverfahren, ist mittlerweile
eine vielversprechende Technik der analytischen Chemie und biomedizinischen Forschung
zur Erhöhung kernmagnetischer Resonanzsignale (NMR) unempfindlicher Kernspins. In die-
ser Arbeit werden die Methoden und Systemteile dargestellt, welche zur die Maximierung der
NMR Signale von Substanzen mit unempfindlichen und lange longitudinale Relaxationszeiten
T1 beinhaltenden Kernspins benutzt wurden.
Die Auflösungs- und Übertragungsverfahren der hyperpolarisierten Moleküle vom Polarisator
zum Scanner vor der eigentlichen in vivo Messung führen zu unvermeidlichen Verluste in
Kernpolarisation, die nach der Injektion ins Tier schwierig zu beurteilen sind. Wir haben eine
Methode vorgeschlagen, bei welcher die Polarisation der hyperpolarisierten Moleküle im Ma-
gnet 3 Sekunden nach der Auflösung zum Zeitpunkt der Injektion gemessen wird. Zusätzlich
ist eine radikalfangende Methode beschrieben, die die Konzentration der hyperpolarisierten
Flüssigkeit nicht reduziert und innerhalb weniger Sekunden nach der Auflösung erledigt, um
Verluste bedingt durch der Anwesenheit paramagnetischer Zentren im Infusat zu minimieren.
Die stabilen freien Radikale, die als polarisierendes Mittel durch chemische Dotierung wäh-
rend des DNP Prozesses verwendet werden, sind im auflösten Zustand aufgrund der parama-
gnetischen Relaxation der hyperpolarisierten Nukleonen und der Toxizität für biologisches
Gewebe unerwünscht. Wir konnten die Herstellung von hyperpolarisierten Alkohollösungen
frei von stabilen Radikalen durch die Verwendung spinmarkierter thermoreagierender hydro-
philer Polymernetzwerke zeigen. Diese Methode wurde angewandt auf die Polarisation des
tert-Butanols, einem vielversprechenden Kontrastmittel für die Perfusion, und des Ethanols,
einem interessanten Substrat zur Untersuchung des Leberstoffwechsels.
Ausführliche DNP Studien über biokompatiblen Verbindungen markiert mit den Isotopen 15N
und 89Y, die eine außergewöhnlich lange Relaxationszeit T1 aufweisen, wurden durchgeführt,
um eine maximierte Polarisation für in vivo Stoffwechsel- und Perfusionsstudie. Wir entwickel-
ten ein in vivo-Protokoll zur Untersuchung der normalen Cholinaufnahme des Gehirns nach
Injektion von hyperpolarisiertem 15N-Cholin. Wir haben das erste in vivo 89Y Experiment mit
biokompatible Y[DOTA] durchgeführt.
Empfindlichkeit und B1 Homogenität sind zwei wesentliche Faktoren der Magnetresonanz-
Spektroskopie (MRS) und -Tomographie (MRT). Bei zunehmender Magnetfeldstärke wird
die Konstruktion der Hochfrequenzspule schwieriger. Die Hauptherausforderungen dabei
sind die begrenzte Größe der Spulen als auch die Strahlungs- und Probenverluste, welche
durch die reduzierten Wellenlängen sowie die B1 Feldinhomogenität verursacht werden. Wir
ix

Zusammenfassung
entwarfen und konstruierten verschiedene Oberflächen- und Vogelkäfigspulen für in vivo MR-
Messungen im Ultrahochfeld. Laborversuche und in vivo Tomographiedaten aufgenommen
mit eben diesen Oberflächen- und Vogelkäfigspulen bei 9,4T und 14,1T zeigten einerseits,
dass Oberflächenspulen mit kleinerem Durchmesser weniger Empfindlichkeitsprobleme und
Hochfrequenz Leistungsbegrenzungen aufwiesen, und andererseits, dass bei den Vogelkäfig-
spulen die großen Verluste weder in der Probe noch durch die Strahlung, sondern durch den
geringen Füllfaktor verursacht wurden.
Stichwörter: Dynamische Kerspinpolarisation (DNP) mit Auflösungsverfahren; kernmagneti-
sche Resonanz (NMR); in vivo Magnetresonanzspektroskopie (MRS) und -tomographie (MRT);
longitudinale Relaxationszeit; Abfang freier Radikale; spinmarkierte thermoreagierende hy-
drophile Polymernetzwerke(SL-hydrogel); Vogelkäfigspule.
x

RésuméLa polarisation dynamique nucléaire (Dynamic Nuclear Polarization - DNP) est une
technique puissante qui permet d’augmenter le signal obtenu par résonance magnétique
nucléaire (RMN) provenant de noyaux à faible sensibilité. Cette technique ouvre ainsi le champ
des possibles en chimie analytique et dans le cadre de la recherche biomédicale. Dans cette
thèse, nous décrivons les développements méthodologiques et instrumentaux nécessaires à
maximiser les signaux RMN de substrats d’intérêt biologique contenant des spins nucléaires
de faible sensibilité avec de longs temps de relaxation longitudinale T1. Le but global était
d’élargir la fenêtre temporelle d’acquisition pour pouvoir effectuer des études métaboliques
in vivo.
La dissolution ainsi que les procédures de transfert des molécules hyperpolarisées du
polariseur vers l’imageur en amont des mesures in vivo mènent inévitablement à des pertes de
la polarisation nucléaire qui demeurent difficiles à évaluer une fois que la solution est injectée
dans l’animal. Dans ce contexte, nous proposons une méthode pour mesurer la polarisation
des molécules hyperpolarisées à l’intérieur du tunnel de l’imageur, 3s après la dissolution, au
moment de l’injection. Notre méthode comprend un processus de neutralisation des radicaux
n’entraînant pas de réduction de la concentration de l’échantillon et prenant place dans
les deux secondes qui suivent la dissolution afin de minimiser les pertes dues à la présence
d’agent polarisant paramagnétiques dans la solution infusée.
Les radicaux libres utilisés comme agents polarisants pour les processus de DNP à l’état
solide deviennent indésirables lors du transfert à l’état liquide, après la dissolution, en raison
des effets de relaxation paramagnétique des spins nucléaires hyperpolarisés et de leur toxicité
pour les tissues biologiques. Nous avons alors montré la faisabilité de préparer des solutions
hyperpolarisées à base d’eau et d’alcool, dépourvues de tout radical libre, en utilisant des
réseaux de polymères hydrophiles et thermo-sensible aux spins. Nous avons utilisé cette
méthode pour polariser du tert-butanol qui a récemment été utilisé comme agent de contraste
prometteur pour l’imagerie de perfusion, mais également l’éthanol qui représente un substrat
d’intérêt pour suivre le métabolisme hépatique.
Par ailleurs, des études extensives par DNP sur des molécules biocompatibles marquées
au 15N et 89Y, dont les T1 sont particulièrement longs, ont été menées pour maximiser leur
polarisation et pouvoir effectuer des recherches in vivo sur le métabolisme et la perfusion.
Nous avons mis en place un protocole expérimental pour étudier in vivo la consommation
cérébrale en choline en injectant de la choline marquee au 15N chez le rat. Nous avons par
la suite également effectué avec succès la première étude in vivo avec du 89Y en utilisant des
xi

Résumé
composés biocompatibles de Y[DOTA].
Finalement, la sensibilité et l’homogénéité du champ B1 sont deux facteurs essentiels
pour la spectroscopie et l’imagerie par résonance magnétique (SRM et IRM, respectivement).
Quand l’intensité du champ magnétique principal augmente, les sondes RMN (ou résonateurs)
deviennent de plus en plus difficiles à construire. Les défis principaux sont leur taille, la
radiation et les pertes provenant de l’échantillon, ces dernières étant causées par des longueurs
d’onde réduites, aussi bien que les inhomogénéités de champ B1. Malgré ces contraintes, nous
avons conçu et construit des résonateurs de surface et en cage d’oiseau pour les mesures RMN
in vivo à très haut champ. Des expériences de faisabilité, ainsi que des données d’imagerie
acquises in vivo effectuées avec ces sondes de surface et en cage d’oiseau à 9,4 T et 14,1 T
ont montré que les bobines constituant la sonde de surface doivent avoir un diamètre limité
en raisons de contraintes dues à la sensibilité et à la limitation de puissance radiofréquence
utilisable. En ce qui concerne les sondes en cage d’oiseau, les pertes principales ne provenaient
pas de l’échantillon ou de la radiation, mais plutôt du faible facteur de remplissage de ce
résonateur.
Mots clés : Polarisation dynamique nucléaire (PDN) ; Résonance magnétique nucléaire (RMN) ;
Spectroscopie magnétique nucléaire (SMN) ; Imagerie par résonance magnétique (IRM) ; tech-
nique de dissolution rapide ; temps de relaxation longitudinale ; neutralisation des radicaux ;
le sonde en cage d’oiseau.
xii

ContentsAcknowledgments v
Abstract (English/Deutsch/Français) vii
Table of contents xv
Introduction 1
1 Basics about NMR and DNP 5
1.1 Fundamental of Spins . . . . . . . . . . . . . . . . . . . . . . . . . . . . . . . . . . 6
1.1.1 Spins . . . . . . . . . . . . . . . . . . . . . . . . . . . . . . . . . . . . . . . . 6
1.1.2 Polarization . . . . . . . . . . . . . . . . . . . . . . . . . . . . . . . . . . . . 7
1.2 Pulsed NMR . . . . . . . . . . . . . . . . . . . . . . . . . . . . . . . . . . . . . . . . 8
1.2.1 Bloch equation and relaxation processes . . . . . . . . . . . . . . . . . . . 11
1.3 Dynamic Nuclear Polarization (DNP) . . . . . . . . . . . . . . . . . . . . . . . . . 13
1.3.1 Global mechanism of DNP . . . . . . . . . . . . . . . . . . . . . . . . . . . 14
1.3.2 Spin temperature . . . . . . . . . . . . . . . . . . . . . . . . . . . . . . . . . 16
1.3.3 Overhauser Effect . . . . . . . . . . . . . . . . . . . . . . . . . . . . . . . . . 17
1.3.4 Solid Effect . . . . . . . . . . . . . . . . . . . . . . . . . . . . . . . . . . . . . 18
1.3.5 Thermal mixing . . . . . . . . . . . . . . . . . . . . . . . . . . . . . . . . . . 20
1.4 Other hyperpolarization methods . . . . . . . . . . . . . . . . . . . . . . . . . . . 21
1.4.1 Spin-Exchange Optical Pumping(SEOP) . . . . . . . . . . . . . . . . . . . 21
1.4.2 ParaHydrogen Induded Polarization(PHIP) . . . . . . . . . . . . . . . . . . 22
1.5 Methods to determine the longitudinal relaxation time T1 . . . . . . . . . . . . . 23
1.5.1 Magnetization recovery schemes . . . . . . . . . . . . . . . . . . . . . . . . 23
1.5.2 Polarization decay scheme . . . . . . . . . . . . . . . . . . . . . . . . . . . 24
2 In vivo DNP-enhanced MR experiment protocol 29
2.1 Standard experimental protocol for dissolution DNP . . . . . . . . . . . . . . . . 30
2.1.1 Dissolution DNP setup . . . . . . . . . . . . . . . . . . . . . . . . . . . . . . 30
2.1.2 NMR probes . . . . . . . . . . . . . . . . . . . . . . . . . . . . . . . . . . . . 30
2.1.3 DNP sample preparation . . . . . . . . . . . . . . . . . . . . . . . . . . . . 33
2.1.4 DNP experiment protocol . . . . . . . . . . . . . . . . . . . . . . . . . . . . 35
2.2 Method to minimize and monitor in situ the polarization losses . . . . . . . . . 35
xiii

Contents
2.3 Discussion . . . . . . . . . . . . . . . . . . . . . . . . . . . . . . . . . . . . . . . . . 39
3 Producing radical-free hyperpolarized solutions for in vivo MR 45
3.1 Introduction . . . . . . . . . . . . . . . . . . . . . . . . . . . . . . . . . . . . . . . . 46
3.2 Materials and Methods . . . . . . . . . . . . . . . . . . . . . . . . . . . . . . . . . . 47
3.2.1 Thermoresponsive spin-labeled hydrogel . . . . . . . . . . . . . . . . . . . 47
3.2.2 DNP procedure . . . . . . . . . . . . . . . . . . . . . . . . . . . . . . . . . . 48
3.2.3 balanced Steady State Free Precession (b-SSFP) sequence . . . . . . . . . 48
3.3 Results . . . . . . . . . . . . . . . . . . . . . . . . . . . . . . . . . . . . . . . . . . . 50
3.4 Discussion . . . . . . . . . . . . . . . . . . . . . . . . . . . . . . . . . . . . . . . . . 50
3.5 Conclusion . . . . . . . . . . . . . . . . . . . . . . . . . . . . . . . . . . . . . . . . . 52
4 Preliminary results on 15N and 89Y labeled tracers for in vivo hyperpolarized NMR 57
4.1 Introduction . . . . . . . . . . . . . . . . . . . . . . . . . . . . . . . . . . . . . . . . 58
4.2 15N choline . . . . . . . . . . . . . . . . . . . . . . . . . . . . . . . . . . . . . . . . . 59
4.3 89Y chloride and DOTA . . . . . . . . . . . . . . . . . . . . . . . . . . . . . . . . . . 61
5 MR probes for in vivo MRS and MRI at ultra high magnetic field 65
5.1 Introduction . . . . . . . . . . . . . . . . . . . . . . . . . . . . . . . . . . . . . . . . 66
5.2 Surface coil . . . . . . . . . . . . . . . . . . . . . . . . . . . . . . . . . . . . . . . . . 68
5.2.1 Design of the surface coil . . . . . . . . . . . . . . . . . . . . . . . . . . . . 69
5.2.2 Results . . . . . . . . . . . . . . . . . . . . . . . . . . . . . . . . . . . . . . . 70
5.3 Birdcage coil . . . . . . . . . . . . . . . . . . . . . . . . . . . . . . . . . . . . . . . . 71
5.3.1 Resonance modes of the birdcage coil . . . . . . . . . . . . . . . . . . . . . 71
5.3.2 RF design of HP birdcage coil . . . . . . . . . . . . . . . . . . . . . . . . . . 73
5.3.3 Results and Discussions . . . . . . . . . . . . . . . . . . . . . . . . . . . . . 75
5.3.4 Preparation of BP birdcage coil and preliminary test results . . . . . . . . 77
5.3.5 Conclusions . . . . . . . . . . . . . . . . . . . . . . . . . . . . . . . . . . . . 80
Conclusions and future perspectives 83
Appendix A DNP performance of biradicals 87
Appendix B X-ray induced radicals 89
Appendix C Optimization of dissolution parameters 91
Appendix D Polarization level determination 93
D.1 Classical polarization determination . . . . . . . . . . . . . . . . . . . . . . . . . 93
D.2 Polarization build-up simulation . . . . . . . . . . . . . . . . . . . . . . . . . . . . 94
D.3 Polarization calculation through build-up . . . . . . . . . . . . . . . . . . . . . . 95
D.3.1 varying flip angle . . . . . . . . . . . . . . . . . . . . . . . . . . . . . . . . . 96
D.3.2 varying time interval . . . . . . . . . . . . . . . . . . . . . . . . . . . . . . . 96
D.3.3 Summary . . . . . . . . . . . . . . . . . . . . . . . . . . . . . . . . . . . . . . 97
xiv

Contents
Curriculum Vitae
xv


Introduction
Magnetic resonance imaging (MRI) and magnetic resonance spectroscopy (MRS) are
non-invasive techniques based on nuclear magnetic resonance (NMR) and widely used in
medicine for acquiring anatomic and metabolic information about diseased tissues. 1H, as a
spin-1/2 element with the largest nuclear gyromagnetic ratio γ, is the nucleus of choice for in
vivo NMR due to the large signal related to its high natural isotopic (99.99%) and biological
abundance (63% for human). However, 1H spectra are often limited by the strong water
signal and the relatively small spectral dispersion due to the narrow resonance frequency
range. 13C, 15N and 31P, are biologically relevant spin-1/2 nuclei involved in a wide range of
metabolic processes. Their γ is substantially lower than that of 1H and their natural isotopic
and biological abundance is very low. These characteristics indicate relatively low NMR
sensitivity on one hand, but little MRS and MRI background signals on the other hand. How
to efficiently improve the MR sensitivity of these nuclei recently became a very important field
of research, in particular in the context of metabolic studies.
The Dynamic Nuclear Polarization (DNP) method, based on the saturation of the elec-
tron spin resonance (ESR) transition of free radicals to transfer the unpaired electron spin
polarization to the surrounding nuclear spins in solid samples, was theoretically and exper-
imentally studied since 1950s to produce polarized targets for nuclear and particle physics
research. Large polarizations were observed not only for proton but also for deuteron, lithium
and other nuclei. Recently, a novel technique consisting in the dissolution of DNP-enhanced
solid samples to obtain a nuclear spin polarization up to four orders of magnitude larger
than the room-temperature thermal polarization in liquids was applied to MRS and MRI. It
became a prominent technique not only for chemical analysis but also for visualizing in vivo
the bio-distribution of hyperpolarized substrates and their downstream metabolites. The
intrinsic limitation of the technique is the finite life time of the hyperpolarized state of the
molecule, which is determined by the longitudinal relaxation time of the nuclei of interest. The
hyperpolarized state cannot be recovered once the magnetization is destroyed and therefore,
although it is very intense, the signal is only available for a limited amount of time. Hence,
the strategy for DNP becomes to find biologically relevant substrates with long T1 nuclear
spins and maximize their polarization for in vivo metabolic studies. Low-γ nuclear spins
with spin-1/2 can have usually long T1, in particular 13C, 15N and 89Y spins on molecular sites
with no direct bond to protons, e.g. carboxyl group and trimethyl-ammonium cation etc., are
1

Contents
excellent candidates for DNP and exhibit a remarkably long T1 of at least 50s and up to several
hundred seconds.
In order to improve the sensitivity of hyperpolarized MRS and MRI, a large effort has
been so far devoted to the optimization of the sample preparation (e.g. choice of radicals 1;2,
solvents 3, adjunction of Gd(III) complexes 4;5) and hardware developments 1;6;7, to maximize
the solid-state nuclear spin polarization. A hardware characteristic of dissolution DNP is that
the DNP and the MRS/MRI are done in separate magnets, at different fields. The dissolved
sample is usually transported from one to the other by blowing it through a thin plastic tube.
However, little has been done to minimize the polarization losses once the sample is dissolved.
Losses due to relaxation can be essentially minimized by, on one hand, alleviating relaxation
pathways through cancellation of some interactions between the nuclear spins of interest and
their environment and, on the other hand, reducing the time delay between the dissolution
step and the injection into the subject under investigation. The use of deuterated solvents
to dissolve the samples can significantly reduce the dipolar relaxation but in most cases the
residual paramagnetic centers (polarizing agents and Gd3+ ions used during the solid-state
polarization process) will be the main source of relaxation. In addition, the toxicity issue due
the presence of a few mM of free radical in the hyperpolarized solution has to be addressed
and so far this problem has been largely overlooked.
Another important aspect of hyperpolarized MRS and MRI is that the acquisitions are
essentially single-shot experiment. Since it is impossible to perform signal averaging, it is
important to have highly sensitive NMR probes. For in vivo experiments, surface coils are the
most adapted for obtaining the higher local signal-to-noise ratio (SNR).
Scope of the thesis
The results presented in this thesis were obtained using a home-built 5T polarizer. The
main goals was to optimize the DNP enhancement in samples containing long-T113C, 15N,
and 89Y spins in molecules that can be used for in vivo metabolic studies and molecular
imaging. The aim was to first, optimize the polarization both in solid-state and liquid-state,
and to reduce the polarization losses during the sample transfer; second, investigate how to
efficiently scavenge or trap the radicals used for the DNP process and therefore increase the
longitudinal relaxation time and acquisition window for in vivo studies; third, build sensitive
MR probes for in vivo metabolic studies in ultra high field NMR scanner. Low toxicity, larger
polarization and longer longitudinal relaxation time in the liquid state are three requirements
for improved hyperpolarized MRS and MRI experiments that we attempted to meet.
In chapter 1, a brief overview on pulsed NMR will be given to introduce the basic con-
cepts of NMR and relaxation mechanisms of nuclear spins. The principles and mechanisms
of the different DNP processes will then be briefly described. To highlight the diversity of
hyperpolarization techniques other methods, such as parahydrogen induced polarization
(PHIP) and spin-exchange optical pumping (SEOP), will also be introduced. The chapter will
2

References
end with a discussion of the three different methods usually used to determine longitudinal
relaxation time.
A short description of the DNP setup used for this work will be presented in the first part
of chapter 2. Various recipes and strategies for optimal sample preparation will be discussed.
The second part of the chapter will focus on the development of a unique protocol for in vivo
hyperpolarized MRS and MRI experiments comprising in situ polarization measurement prior
to injection. The protocol was used in the frame of a metabolic study in rat skeletal muscle.
Methods to efficiently scavenge the residual nitroxyl radicals present in the hyperpolarized
liquids using deuterated ascorbate are presented at the end of the chapter.
Chapter 3 introduces a novel method to hyperpolarize liquids using thermoresponsive
spin-labeled hydrogel. Since the radicals are covalently attached to the hydrogel, it was
possible to prepare radical-free hyperpolarized 13C-labeled tert-butanol and ethanol solutions
following dissolution with adapted dissolution parameters. This method was used to obtain13C imaging in a mouse brain.
Results of hyperpolarized 15N for determining in vivo choline uptake in rat brain and
preliminary results of hyperpolarized 89Y complexes are shown in chapter 4.
Chapter 5 first introduces the design of surface coils used for in vivo MRS measurements.
RF circuit analysis, bench test results and results of in vitro experiments are presented. In the
second part of the chapter, the performances of two high-pass birdcage coils designed for
NMR experiments at 9.4T and 14.1T and one band-pass coil developed for the 14.1T scanner
are discussed. These coils were optimized to obtain a highly homogeneous B1 field for in vivo
MRS/MRI experiments at ultra high magnetic field.
At the end of the thesis an overall conclusion is drawn and some future perspectives
related to this thesis are highlighted.
References
[1] J. H. Ardenkjaer-Larsen, B. Fridlund, A. Gram, G. Hansson, L. Hansson, M. H. Lerche, R. Servin, M. Thaning,and K. Golman. Increase in signal-to-noise ratio of > 10,000 times in liquid-state nmr. Proceedings of theNational Academy of Sciences of the United States of America, 100(18):10158–10163, 2003.
[2] L. Lumata, S. J. Ratnakar, A. Jindal, M. Merritt, A. Comment, C. Malloy, A. D. Sherry, and Z. Kovacs. Bdpa: Anefficient polarizing agent for fast dissolution dynamic nuclear polarization nmr spectroscopy. Chemistry-aEuropean Journal, 17(39):10825–10827, 2011.
[3] F. Kurdzesau, B. van den Brandt, A. Comment, P. Hautle, S. Jannin, J. J. van der Klink, and J. A. Konter. Dynamicnuclear polarization of small labelled molecules in frozen water-alcohol solutions. Journal of Physics D-AppliedPhysics, 41(15), 2008.
[4] J. H. Ardenkjaer-Larsen, S. Macholl, and H. Johannesson. Dynamic nuclear polarization with trityls at 1.2 k.Applied Magnetic Resonance, 34(3-4):509–522, 2008.
3

Contents
[5] L. Lumata, M. E. Merritt, C. R. Malloy, A. D. Sherry, and Z. Kovacs. Impact of gd3+ on dnp of [1-13c]pyruvatedoped with trityl ox063, bdpa, or 4-oxo-tempo. J Phys Chem A, 116(21):5129–38, 2012.
[6] J. H. Ardenkjaer-Larsen, A. M. Leach, N. Clarke, J. Urbahn, D. Anderson, and T. W. Skloss. Dynamic nuclearpolarization polarizer for sterile use intent. Nmr in Biomedicine, 24(8):927–932, 2011.
[7] S. Jannin, A. Comment, F. Kurdzesau, J. A. Konter, P. Hautle, B. van den Brandt, and J. J. van der Klink. A 140 ghzprepolarizer for dissolution dynamic nuclear polarization. Journal of Chemical Physics, 128(24), 2008.
4

1 Basics about NMR and DNP
Abstract
NMR is a non-invasive technique to probe the magnetic properties of the molecules in the
solid-state, liquid state and in vivo. In particular, information relative to the chemical structure
and the environment of the molecules can be extracted from frequency spectrum obtained
by Fourier transforming the temporal response of the nuclear spins excited by RF pulses.
Since the signal intensity of conventional pulsed NMR depends on the thermal polarization
of the nuclear spins, which is usually very small at ambient temperature, DNP can lead to
tremendous SNR ratio enhancement of insensitive nuclear spins with low gyromagnetic ratio
and low natural isotropic abundance. An overview of the basics of pulsed NMR and DNP
mechanisms is given in this chapter.
5

Chapter 1. Basics about NMR and DNP
1.1 Fundamental of Spins
1.1.1 Spins
NMR technique probes molecules magnetic properties through the intrinsic nuclear
angular momentum~J , a momentum combination of the constituents of nucleus, protons and
neutrons, and their orbital momentum. This angular momentum can be expressed as,
J = I ·~ (1.1)
where ~ is the reduced Planck’s constant, also known as the Dirac’s constant, and I is the total
nuclear spin momentum. The spin quantum number I, measurable quantity of I , can only
be a multiple of half-integer as protons and neutrons have the same spin quantum number
of 1/2 and the orbital quantum number is an integer. The magnetic quantum number of the
spin, mI represents the spin state which can take a value from −I to I in a step of 1. The total
spin can be zero which leads to a non-magnetic atom. All nuclei in the periodic table can be
categorized into three types according to their total spin number:
a) Non-magnetic nuclei with |I | = 0;
b) Nuclei with |I | = 1/2;
c) Quadrupolar nuclei with |I | > 1/2.
As this thesis concentrates on the DNP of long-T1 nuclei with spin-1/2, for sake of simplicity
only nuclear spins with |I | = 1/2 will be treated and discussed. Table 1.1 shows all NMR-
detectable nuclei that will be discussed in this thesis. Note that only elements with spins |I | 6= 0
can be detected by NMR.
Nucleus Net spin γ [MHz/T] N.A. [%]
1H 1/2 42.58 99.9852H 1 6.54 0.01513C 1/2 10.71 1.1115N 1/2 -4.32 0.3731P 1/2 17.25 10089Y 1/2 0.8 100
129X e 1/2 0.8 75.1
Table 1.1: List of the nuclear species relevant for the DNP-enhanced NMR experiments treatedin the present thesis along with their gyromagnetic ratio and natural abundance.
The magnetic property of a nuclear spin with angular momentum ~J is defined by its
magnetic moment~µ given by,
~µ= γ~J = γ~~I . (1.2)
6
1.1. Fundamental of Spins
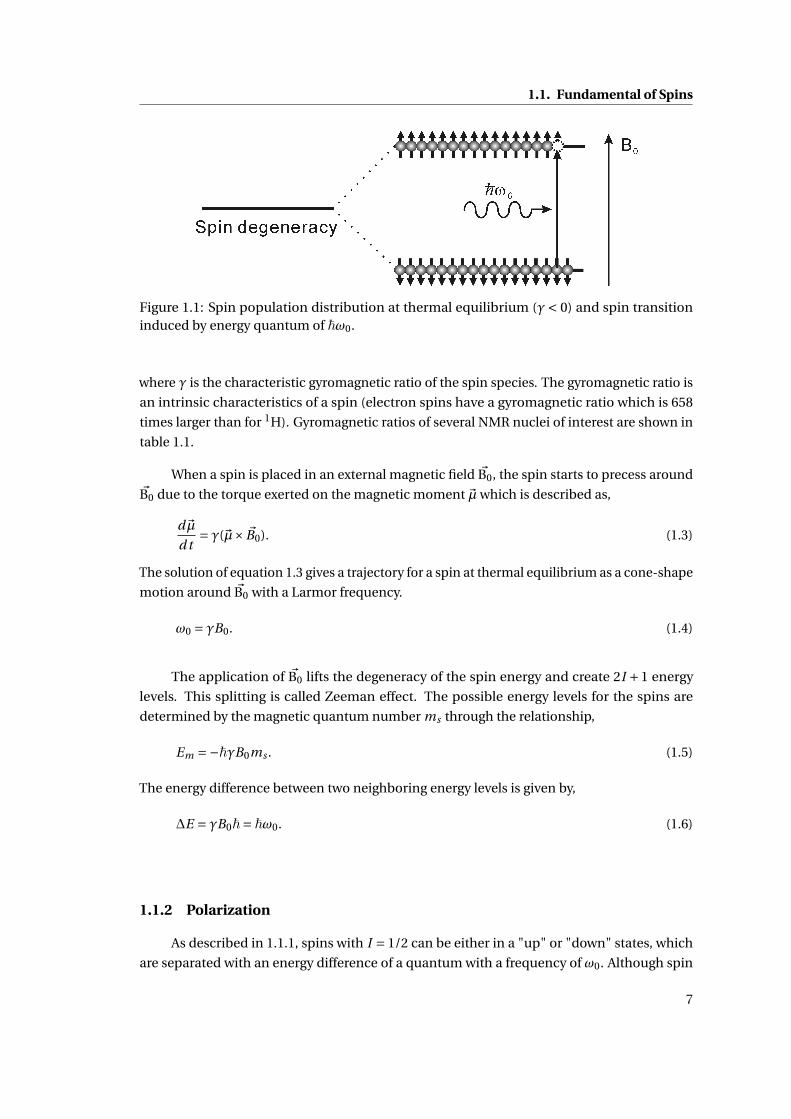
Figure 1.1: Spin population distribution at thermal equilibrium (γ< 0) and spin transitioninduced by energy quantum of ~ω0.
where γ is the characteristic gyromagnetic ratio of the spin species. The gyromagnetic ratio is
an intrinsic characteristics of a spin (electron spins have a gyromagnetic ratio which is 658
times larger than for 1H). Gyromagnetic ratios of several NMR nuclei of interest are shown in
table 1.1.
When a spin is placed in an external magnetic field ~B0, the spin starts to precess around~B0 due to the torque exerted on the magnetic moment~µ which is described as,
d~µ
d t= γ(~µ× ~B0). (1.3)
The solution of equation 1.3 gives a trajectory for a spin at thermal equilibrium as a cone-shape
motion around ~B0 with a Larmor frequency.
ω0 = γB0. (1.4)
The application of ~B0 lifts the degeneracy of the spin energy and create 2I +1 energy
levels. This splitting is called Zeeman effect. The possible energy levels for the spins are
determined by the magnetic quantum number ms through the relationship,
Em =−~γB0ms . (1.5)
The energy difference between two neighboring energy levels is given by,
∆E = γB0~= ~ω0. (1.6)
1.1.2 Polarization
As described in 1.1.1, spins with I = 1/2 can be either in a "up" or "down" states, which
are separated with an energy difference of a quantum with a frequency of ω0. Although spin
7

Chapter 1. Basics about NMR and DNP
transitions induced by thermal fluctuations continuously take place, the population ratio
between the two spin states stays constant at thermal equilibrium. As nuclear spins are
fermion, the population on both energy levels follows Boltzmann distribution and is described
as,
N↑N↓
= e−∆EkT (1.7)
where N↑ and N↓ represent the spin population of the spin up and spin down states, respec-
tively. T is the sample temperature and k is the Boltzmann constant. The polarization P is
defined as,
P = N↓−N↑N↓+N↑
=1− N↑
N↓
1+ N↑N↓
= tanh~γB0
2kT(1.8)
an indirect quantity which reflects the spin states population. A null polarization means that
the spin population on both energy levels is equal. A unity polarization corresponds to the case
in which the spins are all located in one of two energy levels. A positive polarization expresses
the fact that the population of the low energy level is larger than that of the higher energy
level, which is the case at thermal equilibrium. On the contrary, if the population of the high
energy level is larger the polarization is negative. With the high-temperature approximation
(γB0~2kT ¿ 1), the expression for the polarization can be simplified as,
P ≈ γB0~2kT
(1.9)
From equation 1.9, we see that the polarization at thermal equilibrium depends on two
external factors: the applied magnetic field ~B0 and the temperature T. At ambient temperature
and in a magnetic field of 9.4 T, 1H polarization is around 0.0032% and 13C polarization is
around 0.0008%. Due to its large gyromagnetic ratio, the electron spin polarization is much
higher, around 2.11%. If the temperature is decreased to 1 K, the 1H polarization increases to
1%, and the electron spin polarization is almost 100%.
1.2 Pulsed NMR
Section 1.1 described the spin behavior in an external magnetic field at thermal equi-
librium and introduced the definition of polarization. The detectable quantity in NMR is the
magnetization M, the sum of all the magnetic moments of the spins. Although the number
of spins in a sample is usually very large, the net magnetization is in fact rather small due to
the small nuclear spin polarization. Therefore, NMR is considered as an insensitive method
compared to other spectroscopy methods.
Unlike current or voltage which can be directly measured, magnetization can only be
indirectly measured. According to the Maxwell equations shown in equation 1.10, a fluctuating
8

1.2. Pulsed NMR
Figure 1.2: (a)Schematics of the spin excitation and NMR signal received through a loop;(b)Nuclear spin magnetization following the application of a RF pulse with a flip angle of θ.
magnetic field~B generates electric field~E inducing current across a conducting loop, e.g. RF
coil, and the electric displacement field~D in a conductor generates magnetic field ~H around it.
So the basic idea of NMR is to perturb the thermal equilibrium state of the spin system and
measure the alternative magnetic signals generated in the sample. The maximal NMR signal
is detected when the detecting surface is perpendicular to the magnetic flux (figure 1.2a). For
convenience we define the laboratory frame with the magnetic field ~B0 along the Z axis and
the main RF coil axis inside the XY plane.
∇×~E =−∂~B
∂t
∇× ~H = ~J0 − ∂~D
∂t(1.10)
To detect the nuclear magnetization, two prerequisites need to be fulfilled: first, an
additional magnetic field, B1 field should be applied orthogonal to B0, to create an alternative
magnetic flux; second, the NMR signal which is generated by the disturbed spin system, needs
to be transformed into a measurable electrical signal. In practice, as shown in figure 1.2b, one
conducting loop representing the RF coil is implemented perpendicular to the XY plane to
generate the B1 field by injecting a high-power current into the loop and then used to detect
the NMR signal shortly after switching off the excitation current. The measured NMR signal is
dependent not only on the magnetization of the sample, but also on the sensitivity of the RF
coil. Details about the RF coils used in this work will be given in chapter 5.
Rotating frame
Since the spins precess around ~B0 with a Larmor frequency ω0, it is convenient to set
up a new frame of reference called the rotating frame, which rotates around the Z axis of the
laboratory frame. The rotating frequency of the new frame is set to Ω=ωRF −ω0, which is
9

Chapter 1. Basics about NMR and DNP
called offset frequency, where ωRF is the excitation frequency. Combined with the B1 field
created by the RF coil, the effective magnetic field Beff acting on the spins is given by,
Be f f =√
B 21 +
Ω
γ
2
(1.11)
If the offset frequencyΩ is tuned to zero, Beff is equal to B1, perpendicular to ~B0 and it is static
in the rotating frame. This situation is called on-resonance.
RF pulses
RF pulses are used in NMR for quantitatively perturbing spin ensembles. If we apply a
RF pulse on-resonance (Ω= 0) in a coil surrounding the sample, the torque created on the
spins by the B1 field forces the spins to rotate by a flip angle (or rotating angle) of θ, which is
given by,
θ =−γ ·B1 ·τP (1.12)
where τP refers to the RF pulse length and the negative sign in the front reflects the counter-
clockwise rotation direction. By increasing the pulse length τP, the flip angle will increase
linearly. The detectable NMR signal corresponds to the magnetization in the XY plane, which
is given by (see figure 1.2),
MX Y = M0si nθ (1.13)
Therefore, the NMR signal is maximized when θ = 90+nπ and minimized when θ = nπ (n
is an integer). As 90 and 180 pulses are essential in NMR experiments, it is necessary to
calibrate the pulses before each experiment.
Free induction decay (FID) and Fourier transformed NMR
RF coils only detect the magnetization of spin ensembles evolving in the transverse plane.
After the application of a RF pulse, the detectable NMR signal in the transverse plane oscillates
around ~B0 with a frequency ofΩ and decreases to zero after a time characterized by a time
constant T∗2 due to the transverse relaxation processes. This phenomenological oscillation is
called free induction decay (FID).
The FID acquired from the spin system in the time domain following a RF pulse is usually
complex and composed by several different single decays. To separate all the components
from the FID, a Fourier transformation is applied to the temporal signal f (t ):
F (ω) =∫ inf
− inff (t )exp(−iωt )d t (1.14)
10

1.2. Pulsed NMR
with
F (ω) = Re(F (ω))+ Im(F (ω)) (1.15)
Re(F (ω)) =∫ inf
− inff (t )cos(−iωt )d t (1.16)
Im(F (ω)) =∫ inf
− inff (t )sin(−iωt )d t (1.17)
In practice, both real and imaginary parts are measured using a quadrature phase detector.
The line width of the Fourier-transformed signal at half maximum (FWHM) is representative
of the field inhomogeneity and is related to T∗2 by FWHM = 1
πT∗2
. It is important to note that
the acquired signal does not cover all the frequencies since the applied RF pulse has a finite
length τP in the time domain only covers a spectrum width of ∆= 12τP
.
Chemical shift
The chemical shift is defined as the relative frequency offset of the detected NMR signal
from a given reference. It depends on the chemical structure of the molecules in which the
nuclear spins of interest are located and is given by,
δ= ω−ω0
ω0·106ppm (1.18)
For 1H and 13C, TMS (tetramethylsilane) is used as the zero reference. As we can see from
equation 1.18, the chemical shift is a relatively value and it is independent of the magnetic field~B0, but the higher the magnetic field the larger the spectral resolution. This frequency shift is
caused by the local magnetic field generated by the electron clouds orbiting around the nuclear
spins. Chemical shift are used in NMR spectroscopy for analyzing chemical compositions.
1.2.1 Bloch equation and relaxation processes
After applying a RF pulse to disturb the spin ensemble, the system relaxes back to its
thermal equilibrium state with a nuclear magnetization along the Z direction. This evolution
can be semi-classically described in the rotating frame by the Bloch equations 1 as following,
d
d t~M(t ) = γ · ~M(t )×~B(t )+R(~M(t )− ~M0), (1.19)
where the magnetic field vector ~B(t ) = (~B1cos(ω0t ), ~B1si n(ω0t ), ~B0) and the relaxation matrix
R = (1/T2,0,0;0,1/T2,0;0,0,1/T1). T1 and T2 are the longitudinal and transversal relaxation
11

Chapter 1. Basics about NMR and DNP
time, respectively. Solving all three time-dependent differential Bloch equations gives,
MZ (t ) = M0(1−e−t/T1 )+MZ (t0)e−t/T1
MX ,Y (t ) = MX ,Y (t0)e−t/T2 (1.20)
where MX,Y and MZ represent the transverse and longitudinal magnetization, respectively.
From equations 1.20, we see that the longitudinal relaxation time corresponds to the time
constant needed by the spin ensemble to recover its thermal equilibrium magnetization
and that the transverse relaxation time is the time constant relative to the dephasing of the
magnetization in the XY plane. As MXY(t) or MZ(t) can be measured by NMR, the solution of
the Bloch equations is used for determining T1 and T2. In this work we mainly focused on T1
measurements and various methods for determining T1 are presented in section 1.5.
NMR relaxation mechanisms were first explained by the BPP (Bloemberg Purcell Pound)
theory 2 by considering the motion and rotation of the spins influenced by the environment.
Longitudinal relaxation, also called spin-lattice relaxation, is mainly caused by the vibration
and rotation of the local magnetic field of the environment (lattice) of the nuclear spins. T1
relaxation describes the tendency of the spins to reorient themselves with the applied static
magnetic field ~B0.
Transverse relaxation indicates the loss of coherence in the transverse plane within the
spin ensemble caused by the spin-spin interactions. These spin-spin interactions influence
the precession speed of the spins around ~B0 and thus lead to a dephasing of the initial coherent
motion of the spins to finally cancel the net magnetization MX,Y in the XY plane. T2 is usually
much shorter than T1.
To understand the concepts behind both relaxation processes and to evaluate the in-
fluence of molecular motion at a certain frequency omega in the local magnetic field, a
fluctuation spectral density function J(ω) is usually introduced in the form of,
J (ω) = τc
1+ω2τc2 (1.21)
where τc is the correlation time related to the random motions. For a homonuclear spin
system with I = 1/2, the two relaxation times can be described as,
1
T1= K [J (ω0)+4J (2ω0)]
1
T2= K
2[3J (0)+5J (ω0)+2J (2ω0)] (1.22)
where K, which represents a constant related to the spin species and the average distance r
12

1.3. Dynamic Nuclear Polarization (DNP)
between two spins, is given by,
K =(µ0
4π
)2· 3
10· ~
2γ4
r 6 . (1.23)
From equations 1.22, several situations can be considered:
a) When the correlation time is extremely short such as to have the condition ω02τc
2 ¿ 1,
T2 tends to be the same as T1;
b) When the correlation time is long enough such as to have the condition ω02τc
2 À 1, T2
tends to be much shorter than T1;
c) Between these two extreme cases, there is a range of τc values for which, T1 reaches a
minimum, but T2 continuously decreases with increasing τc because of the J(0) term.
The main sources of relaxation are paramagnetic species, dipolar interaction, and chem-
ical shift anisotropy. More detailed descriptions of these mechanisms can be found in many
references 2–4.
1.3 Dynamic Nuclear Polarization (DNP)
The intensity of the NMR signal is directly dependent on the nuclear polarization which
varies with the magnetic field and temperature (see equation 1.9). Since this polarization is
on the order of 10−5 at room temperature (see sectoom 1.1.2), a large number of spins are
required to have a substantial NMR signal. To overcome this drawback, important technical
improvements were achieved to increase the magnetic field of the superconducting magnet
and sensitivity of the RF coils. Hyperpolarization techniques have been developed to improve
NMR sensitivity. The idea is to create an out of equilibrium nuclear spin polarization that is far
beyond the thermal equilibrium polarization. One of the hyperpolarization methods proposed
so far is DNP. Continuous microwave irradiation is applied to saturate the polarization of the
unpaired electrons of paramagnetic impurities embedded in a sample containing the nuclear
spins of interest. Through dipolar-dipolar hyperfine interactions the polarization can be
transferred from the electron spins to the nuclear spins. The MR sensitivity of nuclear spins can
thus be significantly enhanced. This section starts with a description of several fundamental
spin transition processes that play an important role in DNP. After the introduction of spin
temperature, three important DNP mechanisms, the Overhauser effect, the solid effect and
the thermal mixing, will be discussed. Finally, some other hyperpolarization methods will be
briefly introduced.
13

Chapter 1. Basics about NMR and DNP
Figure 1.3: Global mechanism of DNP: Microwave source saturates the ESR transition atcertain frequency and then polarization is transferred through flip-flop electron-nuclear spintransition from electron spin to nuclear spin. Besides fast relaxation process of electron spinwhich helps electron spin quickly back to the thermal equilibrium makes the polarizationprocess more efficiently.
1.3.1 Global mechanism of DNP
The general mechanism of DNP is depicted in figure 1.3. To polarize the nuclear spins
efficiently, the electron spin transition is saturated by microwave irradiation at a specific
frequency ω which is around the Larmor frequency of the electron spins ωe . The electron spin
population of both energy levels becomes identical and the electron spins are forced to make
electron-nuclear spin flip-flop transitions. The exchange of energy between the electron and
the nuclear spins through electron-nuclear interactions typically involves one nuclear spin
and one or more electron spins.
It is of the uttermost importance to note that the electron spins can on one hand help
polarize the nuclear spins but on the other hand are paramagnetic centers inducing the
relaxation of the nuclear spins back to thermal equilibrium. It is thus necessary for the
polarized nuclear spins to be rather well isolated from the electron spins, at least for the major
part of the time of the DNP experiment. For this reason, it is necessary to carefully choose
the ratio between nuclear spin and electron spin density. These densities also depend on
the ratio between the nuclear and electron spin longitudinal relaxations, a ratio which is
highly influenced by the applied magnetic field ~B0 and the temperature of the sample. As a
rule of thumb, A. Abragam and M. Goldman stated that to effectively enhance the nuclear
polarization of solid dielectric samples via DNP the following condition should be fulfilled 15:
(NI T1,e )/(NST1,n) << 1 (1.24)
where NI and NS are respectively the number of nuclear and electron spins in the sample.
14

1.3. Dynamic Nuclear Polarization (DNP)
Figure 1.4: (a)One-spin system consisting of an electron spin; (b)Flip-flop process in a two-spinsystem composed of one electron spin (large) and nuclear spin(small); (c)Flip-flop process ina three-spin system consisting of two electron spins (large) with different Zeeman energy andone nuclear spin (small).
In the liquid-state (as well as in metals), the DNP process involves moving electrons
and the interaction, which will involve only one nuclear spin and one electron spin, is only
effective during a very short "contact" time between the moving electrons and the the nuclear
spins. In dielectric solids, spin diffusion (via nuclear spin-nuclear spin dipolar interactions)
will lead to the polarization of remote nuclear spins (the nuclear spins in close contact with the
electron spins will experience a large number of flip-flop transitions and will effectively not be
polarized). The spin diffusion mechanism involves both dipolar spin diffusion and Zeeman
spin diffusion. Reports have shown that dipolar spin diffusion is much faster than Zeeman
spin diffusion 5;6. This suggests that cooling the dipolar reservoir efficiently can accelerate the
spin diffusion process and thus reduce the polarization time.
Fundamental spin transitions in DNP
The spin transitions involving both electron spins and nuclear spins are the essential
processes leading to the transfer of polarization in DNP. The fundamental transitions can be
visualized using a simplified pictorial representations involving one, two or three spins and
electromagnetic perturbation.
One-spin systems. The simplest spin system is composed of one electron spin or one nuclear
spin, and therefore represents the standard electron spin or nuclear spin resonance transitions.
In the case of an electron spin, the absorption of microwave tuned to the electron
resonance frequency can either pump the electron spin from the lower energy state (spin up)
to the higher energy state (spin down), or stimulate the electron spin from the higher energy
state down to the lower energy state with emission of one (or more) phonon with the same
energy. The transition probability is identical for both processes. If the irradiation power is
large enough, the population of both energy levels will equalize and thus the electron spin
polarization become zero.
Two-spins systems. Three different types of two-spin systems associated with three types of
transitions are involved in DNP: homonuclear transitions, electron-nuclear transitions and
electron-electron transitions.
15

Chapter 1. Basics about NMR and DNP
Homonuclear transitions are at the origin of T2 relaxation and spin diffusion mechanisms.
Two nuclear spins with different orientation simultaneously change their orientation due to
dipolar-dipolar interaction. Extending this process to a multiple homonuclear spins system,
the polarization of a local spin ensemble can therefore "diffuse" to surrounding spins in the
solid sample.
When both electron spins have the same transition energy, electron-electron transitions
are allowed due to the energy and angular momentum conservation. This type of transition is
depicted in figure 1.4: one of the two electron spins flips (or flops) and the emitted energy will
be absorbed by the other electron spin to complete the flopping (or flipping) process. These
flip-flop transitions are at the origin of electron T2 relaxation.
Due to the large difference in Zeeman energy, the electron-nuclear transitions involving
one electron spin and one nuclear spin are forbidden transitions. With the involvement of
microwaves, the nuclear spin can flip (or flop) simultaneously when the electron spin flops
(or flips). Thanks to the hyperfine interaction between electron and nuclear spins, Zeeman
energy can thus flow from the nuclear spins system to the electron spins system and vice-versa.
Two-spin electron-nuclear transition are at the origin of the Overhauser and the solid effects,
which will be discussed in details in following sections.
Three spin system. The transitions involving three-spin systems compose of two electron spins
with different Zeeman energy and one nuclear spin are the fundamental transitions leading
to the thermal mixing and the cross effect. A flip-flop transition of both electron spins can
induce a flip (or a flop) of the nuclear spin. This process is possible when the ESR linewidth is
larger than the nuclear resonance frequency, so that flip-flop transition between two electron
spins with a Zeeman energy difference equal to a nuclear resonance frequency can take place.
As cross effect (ωe1 −ωe2 =ωn) can be described as a particular case of thermal mixing, only
thermal mixing will be discussed in the following.
1.3.2 Spin temperature
To understand the DNP processes, it is useful to introduce the concept of the spin
temperature TS. Each nuclear spin population distribution is linked to a temperature through
the Boltzmann distribution as described in equation 1.7 since the nuclear spin system is
relatively well isolated from the lattice in the dielectric solids of interest for DNP (long T1,n), it
is possible to create a nuclear spin population distribution that is far from thermal equilibrium
with the sample (lattice) temperature TL. This population distribution can nevertheless be
associated with a temperature called spin temperature TS which is different from TL and is
defined as,
N↑N↓
= e− ~ω0
kTS (1.25)
= e−βω0 (1.26)
16

1.3. Dynamic Nuclear Polarization (DNP)
Figure 1.5: (Schematics of the energy levels and transitions of a two-spin system consisting ofa nuclear spin and a electron spin: W 0 and W 2 are the relaxation rates for zero quantum anddouble quantum transitions, respectively; W 1 represents the NMR relaxation rate and W 1′
theESR relaxation rate.
where
β= ~kTS
. (1.27)
β is the so-called inversed temperature. At thermal equilibrium, TS = TL. From equation 1.26
it is easy to link the nuclear spin polarization to the spin temperature which gives with high
temperature approximation,
P = 1
2βω0 (1.28)
A positive polarization is characterized by a positive spin temperature whereas a negative
polarization will give a negative spin temperature.
1.3.3 Overhauser Effect
A.W. Overhauser was the first one to predict that nuclear spins can be polarized by
the electron spins7. It was shown experimentally that not only metals8, but also insulators
doped with paramagnetic impurities9 can be polarized by DNP. It is based on the spin flip-
flop transitions in two-spin systems consisting of one electron spin and one nuclear spin. A
microwave irradiation is applied at the frequency of the electron spin resonance in order to
saturate the ESR transitions (see figure 1.5). During the electron spin relaxation the nuclear
spins will be polarized through hyperfine coupling.
By solving the rate equations established by Solomon3, the enhancement of the Over-
17
Chapter 1. Basics about NMR and DNP
hauser effect can be written as,
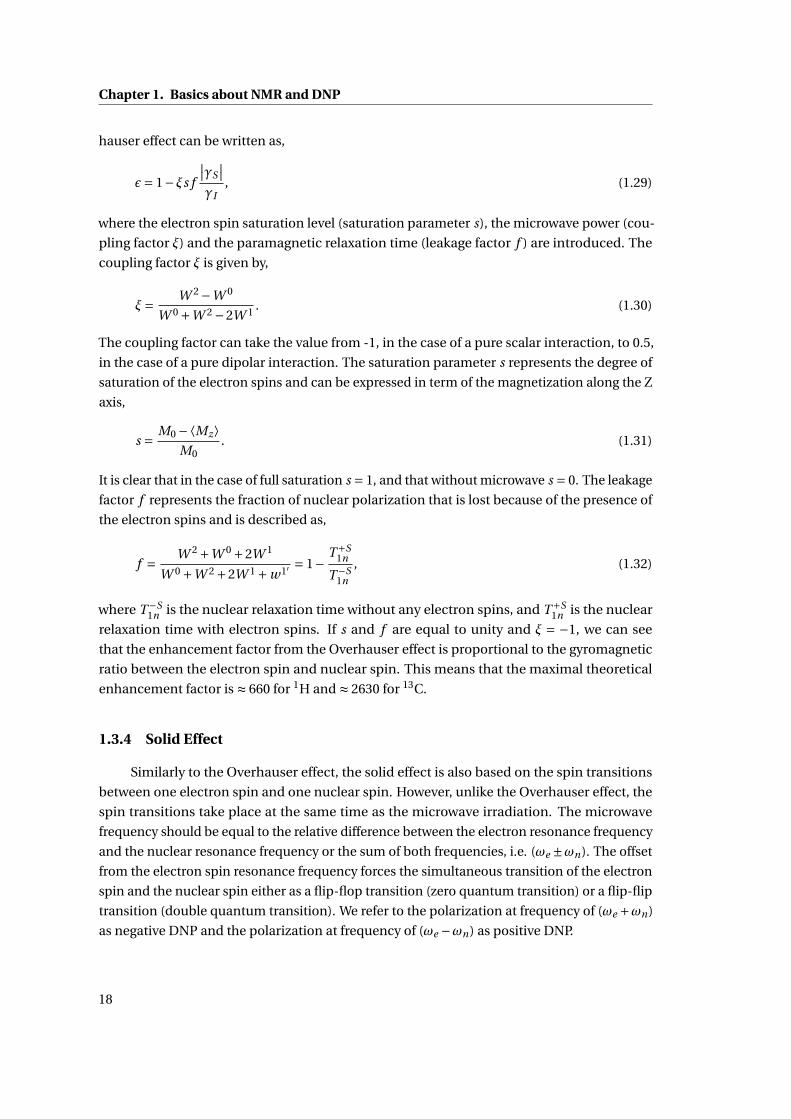
ε= 1−ξs f
∣∣γS∣∣
γI, (1.29)
where the electron spin saturation level (saturation parameter s), the microwave power (cou-
pling factor ξ) and the paramagnetic relaxation time (leakage factor f ) are introduced. The
coupling factor ξ is given by,
ξ= W 2 −W 0
W 0 +W 2 −2W 1 . (1.30)
The coupling factor can take the value from -1, in the case of a pure scalar interaction, to 0.5,
in the case of a pure dipolar interaction. The saturation parameter s represents the degree of
saturation of the electron spins and can be expressed in term of the magnetization along the Z
axis,
s = M0 −⟨Mz⟩M0
. (1.31)
It is clear that in the case of full saturation s = 1, and that without microwave s = 0. The leakage
factor f represents the fraction of nuclear polarization that is lost because of the presence of
the electron spins and is described as,
f = W 2 +W 0 +2W 1
W 0 +W 2 +2W 1 +w1′ = 1− T +S1n
T −S1n
, (1.32)
where T −S1n is the nuclear relaxation time without any electron spins, and T +S
1n is the nuclear
relaxation time with electron spins. If s and f are equal to unity and ξ = −1, we can see
that the enhancement factor from the Overhauser effect is proportional to the gyromagnetic
ratio between the electron spin and nuclear spin. This means that the maximal theoretical
enhancement factor is ≈ 660 for 1H and ≈ 2630 for 13C.
1.3.4 Solid Effect
Similarly to the Overhauser effect, the solid effect is also based on the spin transitions
between one electron spin and one nuclear spin. However, unlike the Overhauser effect, the
spin transitions take place at the same time as the microwave irradiation. The microwave
frequency should be equal to the relative difference between the electron resonance frequency
and the nuclear resonance frequency or the sum of both frequencies, i.e. (ωe ±ωn). The offset
from the electron spin resonance frequency forces the simultaneous transition of the electron
spin and the nuclear spin either as a flip-flop transition (zero quantum transition) or a flip-flip
transition (double quantum transition). We refer to the polarization at frequency of (ωe +ωn)
as negative DNP and the polarization at frequency of (ωe −ωn) as positive DNP.
18

1.3. Dynamic Nuclear Polarization (DNP)
Figure 1.6: Heat flow chart describing the solid effect: the nuclear spin temperature is loweredthrough the electron Zeeman reservoir by electron-nuclear spin flip-flop (or flip-flip) process.
The Hamiltonian of the solid effect can be written as,
H =−ωe SZ −ωn IZ +2ω1e Sx cosωt +S×A× I (1.33)
The first and second terms of the equation are the Zeeman terms. The third term is the
microwave irradiation term and the last term is the hyperfine interaction term with A, the
hyperfine interaction tensor. By using perturbation theory, the transition rate of flip-flop or
flip-flip can be obtained as11,
W + = 2πω2
1e
∣∣14 Az+
∣∣ω2
0n
δ(ω0e +ω0n −ω)W − = 2πω2
1e
∣∣14 Az+
∣∣ω2
0n
δ(ω0e −ω0n −ω) (1.34)
where operator Az+ = Azx + i Az y . δ-function indicates that the transition is maximized when
the microwave frequency ω fits the condition ω=ω0e ±ω0n . For the zero quantum transition
(ω=ω0S +ω0I ), the rate equations for all possible transitions can be summarized as,
∂ρS+ρI−∂t
=−W +(ρS+ρ
I−−ρS
−ρI+) (1.35)
∂ρS+ρI+∂t
= 0 (1.36)
∂ρS−ρI−∂t
= 0 (1.37)
∂ρS−ρI+∂t
=W +(ρS+ρ
I−−ρS
−ρI+) (1.38)
where ρS±ρ
I± represents the probability of the corresponding spin state. Then by recombining
19

Chapter 1. Basics about NMR and DNP
Figure 1.7: Heat flow chart describing the thermal mixing: the electron dipolar reservoir iscooled by the electron Zeeman reservoir using off-resonance irradiation. Thermal contactbetween the electron dipolar reservoir and the nuclear Zeeman reservoir lowers the nuclearspin temperature.
the equations as well as by using the definition of electron spin and nuclear spin polarization,
we can get,
∂
∂t(PS +PI ) =−2W +(PS +PI ) (1.39)
∂
∂t(PS −PI ) = 0 (1.40)
The solution of above equations shows that the nuclear spin polarization PI exponentially
grows towards the negative electron spin polarization −PS with a time constant of (2W +)−1. In
the case of double quantum transition (ω=ω0S −ω0I ), the nuclear polarization exponentially
grows towards +PS with a time constant of (2W −)−1.
1.3.5 Thermal mixing
Thermal mixing can be described using the three-spin systems introduced in section
1.3.1. Compared to the solid effect, the electron spin concentration in samples experiencing
thermal mixing is larger and the dipolar interactions are thus non- negligible. Due to the local
magnetic field Bl caused by the electron spins dipolar field, the width of the electron Zeeman
energy levels becomes non-negligible. In other words, there is a high probability that there
exists two electron spins ensembles with a difference in Zeeman energy that matches the
Zeeman energy of surrounding nuclear spins.
For understanding thermal mixing it is necessary to use the spin temperature formalism
and to define several thermal reservoirs: the Electron Zeeman Reservoir (EZR), the Electron
Dipolar Reservoir (EDR) and the Nuclear Zeeman reservoir (NZR) shown in figure 1.7. EZR
or NZR include the Zeeman energy of the electron or nuclear spins ensembles, respectively
and EDR includes the dipolar energy of the electron spins ensemble. Each reservoir has
its own spin temperature, TZ for EZR, TSS for EDR and TI for NZR. At thermal equilibrium
TZ = TSS = TL means that all spin temperatures are equal to the lattice temperature.
20

1.4. Other hyperpolarization methods
Thermal mixing can be understood as a two-step process, namely dynamic cooling and
thermal mixing13–15. The dynamic cooling process consists in lowering the spin temperature
of EDR, TSS . The final spin temperature can be estimated from the intensity of the local
magnetic field Bl as,
T f∼= Bl
BiTi (1.41)
where Bi , Ti represents the initial magnetic field and temperature of the system.
Through continuous RF irradiation with an off-resonance frequencyω, the effective local
magnetic field Be f f is reduced by a factor,
Be f f
B0= ω0 −ω
ω0= ∆
ω0. (1.42)
Depending on the resonance offset, ∆=ω0 −ω, the spin temperature can be either positive or
negative. The Zeeman spin temperature under microwave irradiation, T′Z , is reduced by the
same factor and is given by,
T′Z = ∆
ω0TL . (1.43)
In this case, electron Zeeman energy at local magnetic field is lowered and comparable to the
transition energy needed for dipolar interaction so that energy exchange between EZR and
EDR is possible.
The thermal mixing process consists in lowering the NZR spin temperature through
thermal contact with the EDR. This contact is inherent to the spin system and depends on
the radical concentration. The leakage factor f represents the direct relaxation from NZR to
lattice.
1.4 Other hyperpolarization methods
1.4.1 Spin-Exchange Optical Pumping(SEOP)
The spin-exchange optical pumping method is based on the transfer of the angular
momentum of polarized optical electromagnetic waves to polarize the valence electron shell
of alkali metal atoms. The nuclear spin polarization of noble gases can be enhanced through
the collisions (dipolar interactions) between the polarized alkali vapors and the nuclear spins
of the surrounding noble gas atom. Almost all alkali atoms can be used for SEOP due to
their single free valence electron, but Rubidium is usually used. To increase the probability
of collision and therefore the nuclear spin polarization, the pressure of the noble gas is
maintained at a level of several bars and the temperature of the polarizing cell is set up to be
high enough to create saturated rubidium atom vapor. The typical achievable polarization
21

Chapter 1. Basics about NMR and DNP
level by SEOP is five orders of magnitude, up to 70% 16;17.
Most biomedical applications of SEOP have been focused on lungs18;19 since nuclear
spins of noble gas, i.e. 3He and 129Xe, have several advantages for MR detection: first, noble
gases can enter the lung without any harm to the biological tissues; second, the relaxation
time of noble gas is relative long, around several hundreds of seconds 20;21; third, they give the
best contrast for MR imaging due to their zero biological natural abundance.
To explore the potential of hyperpolarized gas for other organs, the relatively high solu-
bility of Xe gas in the blood plays an important role22;23. Hyperpolarized 129Xe was used to
measure diffusion and perfusion in different tissues in both human and rodents24–26 after
intravenous injection. Recently, more progresses in pharmaceutical field allowed the design
of different carriers of hyperpolarized 129Xe 27–30 which targets specific diseased tissues and
thus broadens the application range of hyperpolarized gas in molecular imaging field.
1.4.2 ParaHydrogen Induded Polarization(PHIP)
Hydrogen is a very interesting element for MR technique since it is a spin-1/2 element
and possesses the largest gyromagnetic ratio among nuclear spins. Moreover it can be ther-
mally forced into its singlet spin state, the so-called parahydrogen state. Its other state is the
orthohydrogen which has a total spin of 1 and an energy degeneracy of 3 31;32. Transitions
between ortho- and para- hydrogen are normally forbidden due to the state symmetry. To
increase the population of the parahydrogen, one can pump the hydrogen gas simply through
a catalyst at very low temperature (∼ 20K) 33.
A specific PHIP method, called Parahydrogen And Synthesis Allow Dramatically En-
hanced Nuclear Alignment (PASADENA), is based on the hydrogenation reactions of parahy-
drogen with substrates containing a particular type of carbon double bond 34. The two protons
of parahydrogen will be separated and attached to both side of the double bond. The hydro-
genation reactions used for PASADENA method are usually carried out at high magnetic field
where the magnetic symmetry of parahydrogen is broken while a spin-spin coupling between
them remains. Several applications for MR metabolic studies and imaging have already been
reported. [1-13C] diethyl-succinate was polarized to a level of 17% in vitro35 and used for in
vivo imaging 36.
Another PHIP method, called SABRE, is based on the fast magnetization transfer from
parahydrogen to a substrate without hydrogenation process37.It has been reported that sub-
strates labeled with 13C can be polarized by SABRE 38.
PHIP is an interesting method to increase the MR sensitivity since it is much faster than
DNP to prepare highly polarized substrates. It has benn used to study catalytic chemistry, drug
developments and has a great potential for biomedical applications.
22

1.5. Methods to determine the longitudinal relaxation time T1
1.5 Methods to determine the longitudinal relaxation time T1
Several methods can be used to determine the longitudinal relaxation time T1 in solid-
state or liquid-state sample. The standard methods are based on magnetization recovery
schemes that are widely used in high resolution NMR spectroscopy and in vivo MRI T1 map-
ping. The T1 of DNP-enhanced solid samples and hyperpolarized nuclei can be determined
using a polarization decay scheme. For instance, in vitro DNP experiments can be performed
to study the influence of the external conditions on the liquid-state 13C T1 of biomolecules of
interest.
1.5.1 Magnetization recovery schemes
The longitudinal relaxation time T1 is a time constant which characterizes the exponen-
tial recovery of the spin magnetization along the direction of the applied static magnetic field.
To measure T1 the Z-magnetization must be forced out of equilibrium using a preparation
pulse (or series of pulses) in the XY plane. The evolution of the magnetization back to thermal
equilibrium can be followed by applying a π/2 pulse in the XY plane at different time intervals
following the preparation pulse (or series of pulses). Here we present the two most common
magnetization recovery schemes used to measure T1.
Inversion recovery scheme
Figure 1.8: Inversion recovery pulses sequence along with a sketch of the evolution of themagnetization(left) as well as the magnetization recovery along the Z direction(right).
The preparation pulse is a π pulse which inverts the Z-magnetization from +M0 to −M0.
The longitudinal relaxation process leads to the magnetization recovery back to +M0, the
thermal equilibrium position. After a recovering time Tr following the preparation pulse,
the recovered magnetization will be flipped into the XY plane and measured immediately
afterwards (shown in figure 1.8).
The evolution of the magnetization observed using the inversion recovery scheme can be
calculated by using the solution of the Bloch equation in the Z-direction described in section
1.3. After imposing the initial and final conditions for the Z-magnetization, M(0) = Mz (Tr =0) =−M0 and M(∞) = Mz (Tr =∞) = M0, the recovered magnetization MI R can be described
23

Chapter 1. Basics about NMR and DNP
Figure 1.9: Saturation recovery pulses sequence along with a sketch of the evolution of themagnetization (left) as well as the magnetization recovery along the Z direction(right).
as,
MI R = M0 ·(1−2e−Tr /T1
)(1.44)
A series of measurements with different Tr values within the range [0, 5T1] are necessary to
extract T1.
Saturation recovery scheme
In the saturation recovery scheme, the magnetization is saturated by a long RF pulse or a
series of short pulses replacing the π pulse used as preparation pulse in the inversion recovery
scheme. The series of pulses aim at dephasing the magnetization in the X,Y, and Z directions
so that the final net magnetization of the sample is equal to zero. The measurements following
the recovery time Tr are done exactly the same way as in the inversion recovery scheme. The
signal intensity of the saturation recovery scheme can be theoretically deduced from Bloch
equation with the initial conditions of M(0) = Mz (Tr = 0) = 0 and M(∞) = Mz (Tr =∞) = M0
and is described as,
MSR = M0(1−e−Tr /T1 ) (1.45)
The advantage of the saturation recovery scheme compared to the inversion recovery
scheme is that the total measuring time is shorter since the sequence can be repeated just
after the acquisition whereas in the inversion recovery sequence cannot be repeated until the
magnetization has fully recovered (typically 5T1). The drawback of the saturation recovery
scheme lies in the resolution of the recovery curve as the magnetization recovers from −M to
+M in the inversion recovery scheme and only from 0 to +M in saturation recovery scheme.
1.5.2 Polarization decay scheme
The magnetization of DNP-enhanced spins is much larger than their thermal equilibrium
magnetization. Since hyperpolarized spins are in an out of equilibrium state, they relax
24

References
Figure 1.10: Polarization measurements with small flip angle α (left) as well as the magnetiza-tion recovery along the Z direction(right) back to thermal equilibrium M0.
towards their thermal equilibrium with a time constant corresponding to T1. To determine
the relaxation time small flip angle RF pulses are used to measure the magnetization every TR
which can thus be written as,
M = M P0 (e−Tr /T1 ) · si nθ, (1.46)
where M P0 represents the initial DNP-enhanced magnetization. Let us assume that the initial
enhancement of liquid-state pyruvate following dissolution DNP is 16500 (13% polarization
level) and that the longitudinal relaxation time T1 is around 50 s. It will take around 490 s for the
polarization to return back to thermal equilibrium according to the equation 1.46. In practice
the measurement time for this experiment is less than 490 s due to the polarization loss from
the RF pulses and the sensitivity limit of the spectrometer associated with the typically low
concentration of hyperpolarized substrates. By applying a series of small flip angle RF pulses
with the same repetition time TR, the T1 can be determined in one measurement. To obtain
the correct T1 value, it is necessary to correct for the effect of the RF pulses. The unperturbed
magnetization can be recalculated from,
M ′(n ·T R) = M(n ·T R)/(cosθ)n−1. (1.47)
References
[1] F. Bloch, W. W. Hansen, and M. Packard. Nuclear induction. Physical Review, 69(3-4):127–127, 1946.
[2] N. Bloembergen, E. M. Purcell, and R. V. Pound. Relaxation effects in nuclear magnetic resonance absorption.Physical Review, 73(7):679–712, 1948.
[3] I. Solomon. Relaxation processes in a system of 2 spins. Physical Review, 99(2):559–565, 1955.
[4] L. Helm. Relaxivity in paramagnetic systems: Theory and mechanisms. Progress in Nuclear MagneticResonance Spectroscopy, 49(1):45–64, 2006.
[5] W. Zhang and D. G. Cory. First direct measurement of the spin diffusion rate in a homogenous solid. PhysicalReview Letters, 80(6):1324–1327, 1998.
25

Chapter 1. Basics about NMR and DNP
[6] G. S. Boutis, D. Greenbaum, H. Cho, D. G. Cory, and C. Ramanathan. Spin diffusion of correlated two-spinstates in a dielectric crystal. Physical Review Letters, 92(13), 2004.
[7] A. W. Overhauser. Polarization of nuclei in metals. Physical Review, 91(2):476–476, 1953.
[8] T. R. Carver and C. P. Slichter. Polarization of nuclear spins in metals. Physical Review, 92(1):212–213, 1953.
[9] A. Abragam. Overhauser effect in nonmetals. Physical Review, 98(6):1729–1735, 1955.
[10] K. H. Hausser and D. Stehlik. Dynamic nuclear polarization in liquids. Adv. Magn. Reson., 3:79–139, 1968.
[11] W. T. Wenckebach. Dynamic nuclear polarization using strong microwave fields, 2012.
[12] W. T. Wenckebach. The solid effect. Applied Magnetic Resonance, 34(3-4):227–235, 2008.
[13] S. T. Goertz. The dynamic nuclear polarization process. Nuclear Instruments & Methods in Physics ResearchSection a-Accelerators Spectrometers Detectors and Associated Equipment, 526(1-2):28–42, 2004.
[14] M. Goldman. Overview of spin temperature, thermal mixing and dynamic nuclear polarization. AppliedMagnetic Resonance, 34(3-4):219–226, 2008.
[15] A. Abragam and M. Goldman. Principles of dynamic nuclear-polarization. Reports on Progress in Physics,41(3):395–467, 1978.
[16] M. S. Albert, G. D. Cates, B. Driehuys, W. Happer, B. Saam, C. S. Springer, and A. Wishnia. Biological magnetic-resonance-imaging using laser polarized xe-129. Nature, 370(6486):199–201, 1994.
[17] H. Middleton, R. D. Black, B. Saam, G. D. Cates, G. P. Cofer, R. Guenther, W. Happer, L. W. Hedlund, G. A.Johnson, K. Juvan, and J. Swartz. Mr-imaging with hyperpolarized he-3 gas. Magnetic Resonance in Medicine,33(2):271–275, 1995.
[18] X. J. Chen, H. E. Moller, M. S. Chawla, G. P. Cofer, B. Driehuys, L. W. Hedlund, and G. A. Johnson. Spatiallyresolved measurements of hyperpolarized gas properties in the lung in vivo. part i: diffusion coefficient.Magn Reson Med, 42(4):721–8, 1999.
[19] X. J. Chen, H. E. Moller, M. S. Chawla, G. P. Cofer, B. Driehuys, L. W. Hedlund, J. R. MacFall, and G. A. Johnson.Spatially resolved measurements of hyperpolarized gas properties in the lung in vivo. part ii: T *(2). MagnReson Med, 42(4):729–37, 1999.
[20] A. K. Venkatesh, L. Zhao, D. Balamore, F. A. Jolesz, and M. S. Albert. Evaluation of carrier agents for hyperpo-larized xenon mri. Nmr in Biomedicine, 13(4):245–52, 2000.
[21] A. Bifone, Y. Q. Song, R. Seydoux, R. E. Taylor, B. M. Goodson, T. Pietrass, T. F. Budinger, G. Navon, and A. Pines.Nmr of laser-polarized xenon in human blood. Proc Natl Acad Sci U S A, 93(23):12932–6, 1996.
[22] B. M. Goodson, Y. Song, R. E. Taylor, V. D. Schepkin, K. M. Brennan, G. C. Chingas, T. F. Budinger, G. Navon,and A. Pines. In vivo nmr and mri using injection delivery of laser-polarized xenon. Proc Natl Acad Sci U S A,94(26):14725–9, 1997.
[23] G. Duhamel, P. Choquet, E. Grillon, L. Lamalle, J. L. Leviel, A. Ziegler, and A. Constantinesco. Xenon-129 mrimaging and spectroscopy of rat brain using arterial delivery of hyperpolarized xenon in a lipid emulsion.Magn Reson Med, 46(2):208–12, 2001.
[24] J. Wolber, D. J. McIntyre, L. M. Rodrigues, P. Carnochan, J. R. Griffiths, M. O. Leach, and A. Bifone. In vivohyperpolarized 129xe nmr spectroscopy in tumors. Magn Reson Med, 46(3):586–91, 2001.
[25] B. Driehuys, H. E. Moller, Z. I. Cleveland, J. Pollaro, and L. W. Hedlund. Pulmonary perfusion and xenon gasexchange in rats: Mr imaging with intravenous injection of hyperpolarized 129xe. Radiology, 252(2):386–93,2009.
26

References
[26] B. Driehuys, S. Martinez-Jimenez, Z. I. Cleveland, G. M. Metz, D. M. Beaver, J. C. Nouls, S. S. Kaushik, R. Firszt,C. Willis, K. T. Kelly, J. Wolber, M. Kraft, and H. P. McAdams. Chronic obstructive pulmonary disease: safety andtolerability of hyperpolarized 129xe mr imaging in healthy volunteers and patients. Radiology, 262(1):279–89,2012.
[27] M. M. Spence, S. M. Rubin, I. E. Dimitrov, E. J. Ruiz, D. E. Wemmer, A. Pines, S. Q. Yao, F. Tian, and P. G. Schultz.Functionalized xenon as a biosensor. Proc Natl Acad Sci U S A, 98(19):10654–7, 2001.
[28] M. M. Spence, E. J. Ruiz, S. M. Rubin, T. J. Lowery, N. Winssinger, P. G. Schultz, D. E. Wemmer, and A. Pines.Development of a functionalized xenon biosensor. J Am Chem Soc, 126(46):15287–94, 2004.
[29] G. K. Seward, Q. Wei, and I. J. Dmochowski. Peptide-mediated cellular uptake of cryptophane. BioconjugChem, 19(11):2129–35, 2008.
[30] J. M. Chambers, P. A. Hill, J. A. Aaron, Z. Han, D. W. Christianson, N. N. Kuzma, and I. J. Dmochowski.Cryptophane xenon-129 nuclear magnetic resonance biosensors targeting human carbonic anhydrase. J AmChem Soc, 131(2):563–9, 2009.
[31] D. M. Dennison. A note on the specific heat of the hydrogen molecule. Proceedings of the Royal Society ofLondon Series a-Containing Papers of a Mathematical and Physical Character, 115(771):483–486, 1927.
[32] K. F. Bonhoeffer and P. Harteck. Experiments on para-hydrogen and ortho-hydrogen. Naturwissenschaften,17:182–182, 1929.
[33] S. B. Duckett and N. J. Wood. Parahydrogen-based nmr methods as a mechanistic probe in inorganicchemistry. Coordination Chemistry Reviews, 252(21-22):2278–2291, 2008.
[34] C. R. Bowers and D. P. Weitekamp. Para-hydrogen and synthesis allow dramatically enhanced nuclearalignment. Journal of the American Chemical Society, 109(18):5541–5542, 1987.
[35] E. Y. Chekmenev, J. Hovener, V. A. Norton, K. Harris, L. S. Batchelder, P. Bhattacharya, B. D. Ross, and D. P.Weitekamp. Pasadena hyperpolarization of succinic acid for mri and nmr spectroscopy. Journal of theAmerican Chemical Society, 130(13):4212–+, 2008.
[36] Niki M. Zacharias, Henry R. Chan, Napapon Sailasuta, Brian D. Ross, and Pratip Bhattacharya. Real-timemolecular imaging of tricarboxylic acid cycle metabolism in vivo by hyperpolarized 1-13c diethyl succinate.Journal of the American Chemical Society, 134(2):934–943, 2011.
[37] R. W. Adams, J. A. Aguilar, K. D. Atkinson, M. J. Cowley, P. I. P. Elliott, S. B. Duckett, G. G. R. Green, I. G. Khazal,J. Lopez-Serrano, and D. C. Williamson. Reversible interactions with para-hydrogen enhance nmr sensitivityby polarization transfer. Science, 323(5922):1708–1711, 2009.
[38] Lyrelle S. Lloyd, Ralph W. Adams, Michael Bernstein, Steven Coombes, Simon B. Duckett, Gary G. R. Green,Richard J. Lewis, Ryan E. Mewis, and Christopher J. Sleigh. Utilization of sabre-derived hyperpolarization todetect low-concentration analytes via 1d and 2d nmr methods. Journal of the American Chemical Society,134(31):12904–12907, 2012.
27


2 In vivo DNP-enhanced MR experimentprotocol
Abstract
In vivo hyperpolarized MR via dissolution DNP necessitates the transfer of the hyperpo-
larized solutions from the DNP polarizer to the imager prior to in vivo measurements. This
process leads to unavoidable losses in polarization which are difficult to evaluate once the
solution is infused into the animal. We propose a method to measure the polarization of the
hyperpolarized solutions inside the imager bore at the time of the infusion and quantify the
concentration after infusion. This in situ calibration allows for decoupling potential problems
linked to the hyperpolarization and transfer processes from in vivo acquisition issues and can
lead to accurate analyses of in vivo SNR. In addition, we propose a method to scavenge the
radicals a few seconds following the dissolution in order to minimize the losses due to the
presence of polarizing agent in the infusate.
Partially adapted from:
T. Cheng, M. Mishkovsky, J. Bastiaansen, O. Ouari, P. Hautle,
P. Tordo, B. van den Brandt and A. Comment
Methods to minimize and monitor in situ the polarization losses in hyperpolarized
biomolecules prior to in vivo NMR experiments
Manuscript submitted
29

Chapter 2. In vivo DNP-enhanced MR experiment protocol
2.1 Standard experimental protocol for dissolution DNP
2.1.1 Dissolution DNP setup
The complexity of dissolution DNP, which includes cryogenics, microwaves and magnetic
resonance technique makes the DNP experimental setup quite sophisticated. The dissolution
DNP method and its associated instrumentation was first introduced by Ardenkjaer-Larsen
et al1. Unlike the commercially available polarizer HypersenseTM, the polarizer used in the
frame of this work is based on a separate cryostat sitting inside the bore of a standard room-
temperature wide-bore superconducting magnet2;3. To achieve a working temperature of
1 K, a 3-stage pump system with a total pumping volume of 1000 m3 is connected to the
cryostat. The cryostat is cooled and refilled from an external helium dewar which can be
replaced weekly without stopping operation. To allow continuous operations, a donut-shaped
separator is placed between the external helium dewar and sample space to separate the liquid
helium from the helium gas. The separated gas is pumped out through a membrane pump and
is used to keep the central tube of the cryostat cold. To position the sample in the isocenter of
the magnet, a main insert equipped with a NMR circuit is used. A commercially available 140
GHz millimeter wave source (VCOM-06/140/0.5/50-DD, ELVA-1, St. Petersburg, Russia) with a
maximum power output of 60 mW is coupled to a waveguide inserted inside the main insert
and designed to saturate ESR transition of the unpaired electron spins incorporated inside the
sample.
The principle of dissolution DNP is to quickly bring the ultra-cold DNP-enhanced sample
to room temperature and therefore to allow for liquid-state or in vivo NMR experiments.
This is accomplished by warming up a solvent, typically water, under high pressure to a
temperature between 180C and 200C. Afterwards the hyperpolarized solution containing
dissolved polarized sample is pushed out from the cryostat by highly pressurized helium
gas and transferred into a home-built separator/infusion pump for collection. The pump is
located inside the MR scanner dedicated for MRS and 4 m away from the polarizer.
DNP polarizers usually operate at 3.35 T, but recent studies showed that at higher mag-
netic field the maximum achievable polarization is larger 3;4. On the other hand, lower operat-
ing temperature also leads to an increasing polarization. The lowest reported temperature
used for dissolution DNP is around 0.8 K, achieved by using a closed-cycle sorption pump
cryostat. Note that in this thesis all the studies were performed using a DNP polarizer operat-
ing at 5 T , i.e. 140 GHz, and 1.05 K. Detailed information about the polarizer hardware can be
found in previous dissertations and will not be discussed here 5;6.
2.1.2 NMR probes
Low temperature solid-state NMR probes For low-temperature solid-state NMR measure-
ments, a probe containing two sets of capacitors connected through a stainless steel coaxial
cable (for low thermal conductivity) was implemented: The low-temperature coil was tuned
30
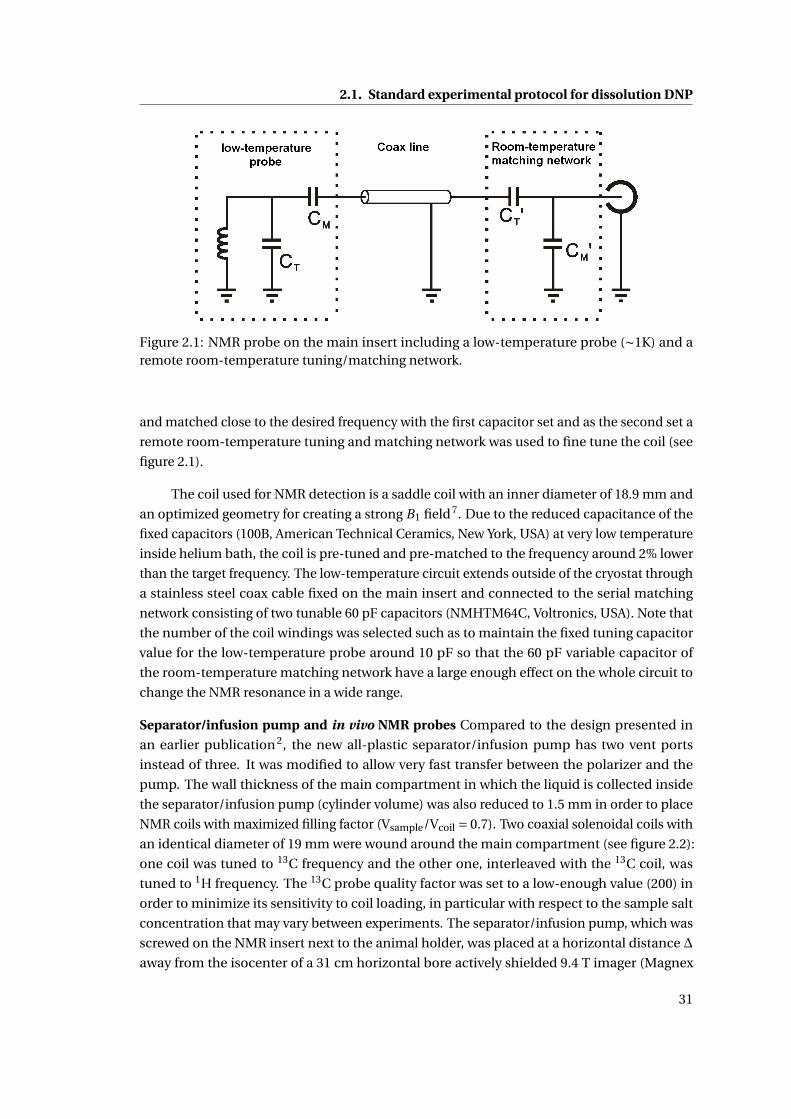
2.1. Standard experimental protocol for dissolution DNP
Figure 2.1: NMR probe on the main insert including a low-temperature probe (∼1K) and aremote room-temperature tuning/matching network.
and matched close to the desired frequency with the first capacitor set and as the second set a
remote room-temperature tuning and matching network was used to fine tune the coil (see
figure 2.1).
The coil used for NMR detection is a saddle coil with an inner diameter of 18.9 mm and
an optimized geometry for creating a strong B1 field 7. Due to the reduced capacitance of the
fixed capacitors (100B, American Technical Ceramics, New York, USA) at very low temperature
inside helium bath, the coil is pre-tuned and pre-matched to the frequency around 2% lower
than the target frequency. The low-temperature circuit extends outside of the cryostat through
a stainless steel coax cable fixed on the main insert and connected to the serial matching
network consisting of two tunable 60 pF capacitors (NMHTM64C, Voltronics, USA). Note that
the number of the coil windings was selected such as to maintain the fixed tuning capacitor
value for the low-temperature probe around 10 pF so that the 60 pF variable capacitor of
the room-temperature matching network have a large enough effect on the whole circuit to
change the NMR resonance in a wide range.
Separator/infusion pump and in vivo NMR probes Compared to the design presented in
an earlier publication2, the new all-plastic separator/infusion pump has two vent ports
instead of three. It was modified to allow very fast transfer between the polarizer and the
pump. The wall thickness of the main compartment in which the liquid is collected inside
the separator/infusion pump (cylinder volume) was also reduced to 1.5 mm in order to place
NMR coils with maximized filling factor (Vsample/Vcoil = 0.7). Two coaxial solenoidal coils with
an identical diameter of 19 mm were wound around the main compartment (see figure 2.2):
one coil was tuned to 13C frequency and the other one, interleaved with the 13C coil, was
tuned to 1H frequency. The 13C probe quality factor was set to a low-enough value (200) in
order to minimize its sensitivity to coil loading, in particular with respect to the sample salt
concentration that may vary between experiments. The separator/infusion pump, which was
screwed on the NMR insert next to the animal holder, was placed at a horizontal distance ∆
away from the isocenter of a 31 cm horizontal bore actively shielded 9.4 T imager (Magnex
31

Chapter 2. In vivo DNP-enhanced MR experiment protocol
Figure 2.2: Sketch of the experimental setup inside the 31 cm diameter magnet bore. Thedistance between the axis of the 13C coil wound around the pump (filled circles) and theanimal 13C surface coil center was set to ∆=6 cm for in vivo skeletal muscle metabolic studies.A 1H coil (hollow circles) was added to perform the shimming procedure required to reducethe magnetic field inhomogeneity inside the separator/infusion pump. The field homogeneity∆B/B0 inside the pump as a function of the distance from the magnet isocenter is shown inthe inset. The 1H coils used for shimming the volume of interest of the animal are not drawnfor simplicity.
Scientific, Abingdon, UK) coupled to a Direct Drive spectrometer (Agilent, Palo Alto, CA, USA)
(see figure 2.2). To determine the maximum distance ∆ at which the field homogeneity ∆B/B0
was high enough to perform NMR measurements inside the pump, the insert was moved
along the magnet bore axis and the 13C signal of a 1 M [1-13C]acetate solution (2.5 mL) was
measured each 1 cm for values between -12 and +12 cm. The field homogeneity over the
volume of interest was determined from the 13C spectral line width and it was observed that
it is nearly constant for all ∆ between -8 and +8 cm (see figure 2.2 inset). For larger ∆ it was
not possible to adequately compensate the field inhomogeneity within the volume of interest
with the imager shim coils.
The in vivo measurements were performed with a home-built dual 1H/13C probe con-
sisting of two 13 mm diameter 1H coils in quadrature and a 10 mm diameter 13C coil placed
over the area of interest of the rodent which is placed at the isocenter of the imager. Details
about the probe designed for in vivo applications are given in Chapter 5.
13C probes switching scheme The goal was to design a setup allowing to perform consecutive13C NMR measurements on two different probes with a single low-band channel spectrom-
eter. Both 13C probes are connected to the same spectrometer channel via a RF network
allowing switching between the probe located on the separator/infusion pump for in vitro
measurements and the probe placed on the animal for in vivo measurements (see figure 2.3).
A highly-isolated TTL-triggered RF broadband switch (Type ZX80-DR230-S+, Minicircuits,
Munich, Germany) is connected to the low-band transmitter output of the spectrometer and
32

2.1. Standard experimental protocol for dissolution DNP
Figure 2.3: Home-built RF net-work to switch between two 13Cprobes connected to a singlelow-band channel spectrome-ter (Varian, Palo Alto, CA, USA)
placed in front of the two power amplifiers used to generate the high-power RF pulses for
the animal coil (350 W amplifier; Varian, Palo Alto, CA, USA) and for the pump coil (100 W
amplifier; Tomco, Australia). The NMR signals are preamplified through two separated 30
dB low-noise amplifiers (Varian, Palo Alto, CA, USA)) before being fed into the spectrometer
receiver through a second identical TTL-triggered RF switch. The time required to switch the
electronics paths from one probe to the other is less than 5 µs. Due to the switches insertion
losses (0.8 dB at 100.67 MHz) and the losses in the additional coaxial cables (1-2 dB), RF pulses
power has to be adjusted for both coils following the insertion of the RF network. The high
isolation level (-78 dB) of the RF switches strongly limited signal contamination between the
two 13C electronics paths.
2.1.3 DNP sample preparation
DNP samples usually consist of three parts: substrates containing nuclear spins of
interest, radicals used as a source of unpaired electron spins and solvent mixture (usually
water mixed with a glassy agent such as ethanol or glycerol) to dissolve the substrates and
radicals. The prepared solution may need to be warmed up and has to be visually checked for
unwanted precipitation.
The radicals used for DNP can be classified into two categories: the stable free radicals
and radiation induced radicals (note that photo-excited triplet states have also been used as
source of electron spins in pentacene and naphthalene). The commercially available stable
radicals include TEMPO (2,2,6,6-Tetramethyl-1-piperidinyloxy) with its derivatives and trityl
33

Chapter 2. In vivo DNP-enhanced MR experiment protocol
Figure 2.4: Chemical structures of (a)TEMPO radical and (b)trityl radical OX063.
radicals as OX063 as well as Finland (chemical structures see figure 2.4). The radiation induced
radicals are defects produced inside a frozen sample by soft and hard x-rays. This technique
was used for creating polarized targets with alcohols8. Both radical species have their own
advantages and disadvantages. For stable radicals, it is easy to control their concentration in
the sample, but they are potentially toxic to the biological tissues even at low concentration
and their paramagnetism shortens the nuclear spins relaxation time. On the contrary, the
radiation-induced radicals recombine themselves once the frozen samples are melted, but the
numbers, structures and production efficiency of the radicals are difficult to control. In this
thesis nitroxyl radicals were used in most of the experiments and some results related to x-ray
induced radicals are summarized in the appendix B.
Several solvent mixtures matrices can be chosen for preparing DNP samples including
deuterated or protonated water/EtOD as well as water/glycerol. The criteria for selecting
optimal solvent mixture includes the solubility of the substrate and the radicals, the amount
of glassy agent needed for the preparation and the deuteration level of the solvents. Regarding
to the polarization time increased magnetic field and deuteration level lead to larger build
up time constant; on the contrary, increased concentration of either nuclear spins or radicals
leads to shorten build up time.
The solution containing the substrate is usually frozen into small transparent beads by
plunging droplets in liquid nitrogen using a syringe and a needle. The main advantages of
preparing beads as compared to a large block of sample are: first, to ensure good absorption of
microwave by reducing the sample size over skin depth ratio; second, to ensure good cooling
performance by the helium bath around 1 K and last but not least, also to ensure a large
contact surface to hot water for the dissolution procedure. After mixing all the compound
check the transparency of the beads and store them in a labeled sample container. The bead
volume can be adjusted by using different size of needle and is normally around 10-15 µL.
34

2.2. Method to minimize and monitor in situ the polarization losses
2.1.4 DNP experiment protocol
Hyperpolarization process, transfer, and in vitro measurements 300 µL of sample in the
form of glassy frozen beads are loaded and dynamically polarized at 5 T and 1.02±0.03 K using
the hardware described in section 2.1.1. The 13C solid-state polarization is then monitored
by applying a 5 flip angle pulse every 5 minutes using the probe for low temperature solid-
state NMR described in section 2.1.2. Reasonably small flip angles and long time intervals
are chosen to avoid large polarization losses due to the RF pulses (more analyses is shown
in appendix D). Once the polarization level has reached plateau, the sample will be rapidly
dissolved in 5 mL of superheated D2O. Immediately after dissolution, a pressure differential is
created for 2 s across a 5 m long and 2 mm inner diameter PTFE tube using pressurized helium
gas. The optimal pressure for the transfer has been determined to be 6 bar. With this pressure,
maximal 2.4±0.1 mL is transferred through 5 m of tube in 2 s. The hyperpolarized solution is
then collected in the separator/infusion pump connected at the end of the tube and positioned
inside the imager bore. A 1 s delay between the end of the application of the high-pressure gas
and the injection is set to allow the solution to settle at the bottom of the pump, where the 13C
coil and the injection port are located (see figure 2.2). The 13C signal from the hyperpolarized
solution is then measured inside the separator/infusion pump. To determine T1, series of 5
pulses are applied with a repetition time of 3s. For in vivo experiments, a single 5 flip angle
pulse is applied at the time the infusion started, i.e., 3 s after dissolution.
in vivo measurements protocol Once the animal is positioned inside the imager magnet,
10 image slices in axial direction with 1 mm thickness are acquired using a gradient echo
sequence (TR = 50 ms, TE = 3 ms, field of view = 30× 30 mm2, matrix = 128 × 128, flip angle =
30 from the selected volume of interest (VOI). The static magnetic field is homogenized in
a 600 µL (6×10×10 mm3) voxel to reduce the localized proton line width to 20 Hz using the
FASTESTMAP shimming protocol9. A pre-selected volume of the dissolved hyperpolarized
solution through combining various limit rings is injected within 9 s. Series of single-pulse13C acquisitions are sequentially recorded starting 12 s after dissolution using 30 adiabatic
RF pulses (BIR4) applied every 3 s with 1H decoupling during acquisition (WALTZ) (a typical
spectrum is shown in figure 2.7C). The adiabatic pulses offset and power are set such as to
ensure a homogeneous 30 excitation of substrate and metabolite resonances within the
entire VOI. Since the pump and the animal are located at a distance∆ from one to another, two
different sets of shim parameters determined and saved prior the dissolution and injection
are used to perform the consecutive NMR measurements in the pump and in vivo respectively.
The shim current values are changed during the injection (this is performed in a few seconds
by the imager control electronics).
2.2 Method to minimize and monitor in situ the polarization losses
To quantify and possibly minimize the polarization losses, it is necessary to accurately
measure the polarization following the transfer from the polarizer to the imager. The in vivo
35

Chapter 2. In vivo DNP-enhanced MR experiment protocol
signal enhancement is however difficult to estimate since the thermal equilibrium signal
needed to determine the polarization is too small to be detected once the solution has been
injected. Measuring the polarization ex situ by inserting part of the hyperpolarized solution
in a dedicated NMR setup (sometimes referred to as "polarimeter") is also inaccurate since
the hyperpolarized solution is subject, during the transfer between polarizer and imager on
one side, and polarizer and polarimeter on the other, to unequal dramatic time variations
in magnetic field which may strongly affect nuclear spin relaxation. A precise quantification
of the polarization at the time of the injection would allow for distinguishing between signal
modulations related to variations in the nuclear polarization prior to injection and signal
modulations related to physiological processes such as tissue perfusion.
It has already been shown that nitroxyl radicals that are used for DNP can be scavenged
by ascorbate10, but the proposed method leads to strongly reduced concentrations of hy-
perpolarized molecules following dissolution since the frozen droplets of ascorbate solution
placed inside the polarizer take a large part of the available sample space. It is thus not optimal
for biomedical applications. Note that an additional proposed solution to reduce the nuclear
spin polarization losses due to relaxation is to create singlet states which have a much longer
life time but it can only be applied to specific types of molecules11–15.
This study was performed using DNP sample containing 4.5 M sodium [1-13C]acetate
and 33 mM TEMPO radicals. The solvent mixture was a combination of D2O and EtOD in a
ratio of 2:1. This method was applied to in vivo metabolic studies of rat skeletal muscle.
Scavenging nitroxyl radicals inside the separator/ infusion pump The nitroxyl radicals scav-
enging process took place inside the separator/infusion pump at the bottom of which 1 mL
of L-ascorbate sodium (NaAsc) or L-ascorbic acid (AA) (Sigma-Aldrich, Buchs, Switzerland)
aqueous (D2O) solution at different concentrations was loaded prior to dissolution. The tem-
perature inside the separator/infusion pump was monitored and maintained by blowing hot
air into the imager bore. The concentration of the vitamin C (NaAsc and AA) aqueous (D2O)
solutions introduced inside the separator/infusion pump prior to dissolution experiments
ranged from 0.1 M to 2 M. The temperature of the separator/infusion pump was stabilized at
33C. Following the transfer of the hyperpolarized solution and after rapid mixing with the
aqueous solution introduced inside the pump, the final vitamin C concentration of the infusate
was ranging from 40 mM to 800 mM. It was observed that the temperature of the infusate
is always within 5C of the pump temperature at the end of the transfer and consecutively
stabilizes at the pump temperature within 3±0.5 minutes. The longitudinal relaxation times
of [1-13C]acetate were deduced from fitting the 13C signal decays measured in the infusion
pump with a mono-exponential decaying function after having corrected for the effect of
the RF pulses on the signal intensities. The 13C values were measured for several vitamin C
infusate concentrations (hollow symbols in figure 2.5).
The 13C T1 of thermally polarized 0.2 M sodium [1-13C]acetate aqueous (D2O) solutions
containing various concentrations of vitamin C were independently measured on a vertical
36

2.2. Method to minimize and monitor in situ the polarization losses
Figure 2.5: In vitro 13C T1 measurements of sodium [1-13C]acetate in aqueous (D2O) solu-tions at 33C as a function of NaAsc (circles), AA (squares), or deuterated NaAsc (triangles)concentration. Experiments with 0.25±0.05 M hyperpolarized acetate solutions containing2±0.3 mM TEMPO were performed following dissolution and mixing with vitamin C in theseparator/infusion pump placed in the 9.4 T imager (hollow symbols). The vertical errors barsoriginate from the 5C uncertainty on the solutions temperature. The thermally polarized0.2 M acetate solutions (without added nitroxyl radicals) were measured in a vertical 9.4 Thigh-resolution system (full symbol).
9.4 T high-resolution system (Bruker BioSpin SA, Fallanden, Switzerland) using a standard
saturation recovery pulse sequence (full symbols in figure 2.5). The solutions did not contain
nitroxyl radicals and they were deoxygenated by bubbling nitrogen gas at the bottom of the 5
mm NMR tubes for 15 minutes.
Partially deuterated L-NaAsc was prepared by lyophilizing a solution containing normal
sodium ascorbate and D2O placed in a dark environment for at least two weeks. The 1H
spectra of natural abundance and partially deuterated sodium ascorbate solutions (1 M) in
D2O were compared to determine the deuteration level in the extracted salt. 30 minutes after
having dissolved the natural abundance salt in D2O, most of the four exchangeable protons
from the ascorbate hydroxyl groups were substituted by deuterons leading to a largeH2O
signal. The H2O signal integral was compared to the one measured in the partially deuterated
sodium ascorbate solution. The result showed that 89% of the exchangeable protons had
been replaced by deuterons in the partially deuterated sodium ascorbate salt. The 13C T1 of
sodium [1-13C]acetate in aqueous (D2O) solutions containing 0.4-0.8 M of partially deuterated
NaAsc are also determined through both a dissolution DNP experiment, including a nitroxyl
scavenging step inside the separator/infusion pump as described above, and a standard
saturation recovery experiment performed in a vertical 9.4 T high-resolution MR system. The
resulting T1 values are reported in figure 2.5 (triangles). The 13C signal integral decay measured
in a 0.4 M deuterated NaAsc solution after the dissolution DNP experiment is reported in
37

Chapter 2. In vivo DNP-enhanced MR experiment protocol
Figure 2.6: 13C signal decay of hyperpolarized sodium [1-13C]acetate with () and without (4)deuterated NaAsc (1 M); the polarization was about 9% larger at the end of the infusion whenthe nitroxyl radicals were scavenged inside the pump as proposed herein.
figure 2.6 along with the 13C signal integral decay measured following a dissolution DNP
experiment performed without radical scavenging molecules. A loss of polarization resulting
from the transfer between the polarizer and the imager is unavoidable but our fast transfer
scheme limits it to 2−5% for hyperpolarized [1-13C]acetate solutions. Once the solution has
been transferred into the imager bore, the polarization losses can be strongly reduced by
scavenging the radicals inside the separator/infusion pump. In the case of hyperpolarized
[1-13C]acetate, we showed that, if the pump was prefilled with a 1 M deuterated NaAsc solution,
we could reduce the 13C polarization losses by roughly 1% per second corresponding to a gain
of about 9% of polarization by the end of the 9 s-long injection (see figure 2.6). Note that the
substantial gain in polarization also leads to an extension of the time window available for in
vivo measurements.
In situ polarization quantification and in vivo measurements The 13C polarization after
2 hours of microwave irradiation was estimated to be 12±1% in all experiments (n=5) by
comparing the polarized 13C signal with the 1 K 13C thermal equilibrium signal of the same
sample measured separately. The 13C solid-state DNP polarization build-up time constant of
[1-13C]acetate was 1900±50 s. The liquid-state polarization was determined by comparing
the hyperpolarized signal (figure 2.7B) with either the signal from a thermally polarized
reference sample of known concentration when the solution was injected, or the thermal
equilibrium signal when the solution was kept inside the pump to perform T1 measurements.
We measured an enhancement factor of 15500±1000, which corresponds to a polarization of
12±1%. The in vivo acquisition started 3 s after the beginning of the 9 s-long injection. The
large [1-13C]acetate signal was readily detected and, in agreement with Jensen et al.16, we
observed the formation of the metabolic product [1-13C]acetylcarnitine 8.7 ppm upfield (see
figure 2.7C). A characteristic in vivo decay time of around 16±1 s was determined for acetate
38

2.3. Discussion
Figure 2.7: Three consecutive single-shot low-flip angle 13C measurements during a metabolicstudy: A. 5 T/1 K solid-state signal in the polarizer B. Liquid-state signal inside the pump atthe time the infusion started C. in vivo [1-13C]acetate and [1-13C]acetylcarnitine signals in therat skeletal muscle.
and the in vivo metabolite acetylcarnitine in the skeletal muscle was observed over a time
period of 30 s.
2.3 Discussion
In-line in situ polarization measurements Throughout the in vivo hyperpolarized NMR ex-
periments presented herein, the 13C signal of the same polarized [1-13C]acetate sample was
measured at three different stages (see figure 2.7): in the solid-state, about 1 min prior to
dissolution, in the liquid-state, 3 s after dissolution after having been transferred inside the
imager bore, and finally in vivo in skeletal muscle, a few seconds after the injection started.
Since the in vitro liquid-state measurement is performed at the beginning of the injection, lasts
less than 1 s, and can be performed with a very low flip-angle RF pulse, it has no substantial
effect on the in vivo measurements. Most notably, this additional NMR measurement does not
increase the delay between dissolution and injection and negligibly affect the in vivo signals
intensity.
Accurately measuring the nuclear polarization prior to injection can greatly facilitate the
interpretation of in vivo results. In case the in vivo signals intensity in a specific experiment is
substantially different from the average value, the polarization measurement will provide a
way to decouple issues linked to the hyperpolarization and transfer processes from problems
related to the injection or animal physiology. The variations in substrate and metabolites
signals intensity are linked to differences in tissue perfusion and a quantitative comparison
across subjects should be possible if the intensities are rescaled by the polarization level
measured at the time of the injection. Accurate in situ polarization measurements are also of
great importance when several substrates are polarized and injected at the same time18. To
be meaningful, the relative intensities between the different substrates and their metabolites
have to be weighted by the polarization level at the time of infusion. This is particularly
39

Chapter 2. In vivo DNP-enhanced MR experiment protocol
essential if the low-field T1 is dramatically different for the different substrates as is the case
for [1-13C]pyruvic acid and [1-13C]urea.
We demonstrated the applicability of our method to in vivo hyperpolarized NMR experi-
ments in the framework of a skeletal muscle metabolic study. The method is also compatible
with other types of in vivo applications such as cerebral or cardiac metabolic studies although
the pump might have to be placed farther away from the isocenter due to the animal and
surface coil location. The field homogeneity in the 9.4 T imager used for the present studies
was sufficient up to about 10 cm away from the isocenter and additional shim coils could be
added around the separator if larger distances were required.
Radicals scavenging The strong influence of TEMPO on the 13C carboxyl T1 of acetate has
already been determined in a previous publication19. Therefore, as expected 10, the addition
of vitamin C in [1-13C]acetate aqueous (D2O) solutions containing 2±0.3 mM TEMPO led to
an increase in 13C T1 (see figure 2.5, filled symbols). To increase the kinetics of the scavenging
process, large concentrations (M range) need to be used. The increase in 13C T1 with increasing
vitamin C concentration observed in the dissolution DNP experiments indeed demonstrate
the strong influence of the scavenger concentration on the kinetics and the near-unity R
values (R>0.999) observed for all vitamin C concentrations larger than 0.2 M (see example
on figure 2.6) show that a large fraction of the radicals are rapidly scavenged. However, the
concentrations used in our dissolution DNP experiments do not seem to be large enough
to completely cancel out the effect of the radicals on the 13C relaxation since even with the
largest concentrations (0.8 M) the observed T1’s do not quite match the values measured in
thermally polarized solutions (see figure 2.5). Our results also show that the addition of large
quantities of vitamin C lead to a substantial shortening of the 13C T1’s. The effect was clearly
more pronounced with AA than with NaAsc as confirmed by the T1 measurements performed
on thermally polarized solutions (see figure 2.5, hollow symbols). Following the observation
that T1 was not substantially affected by the pH of the solution (data not shown), we deduced
from the comparison between the 13C longitudinal relaxation obtained in solutions containing
either AA, NaAsc, deuterated AA (data not shown), or deuterated NaAsc that the concentration
of exchangeable protons added to the solutions through the incorporation of vitamin C was
the cause of the additional relaxation. This was confirmed by measuring the 13C T1 of [1-13C]acetate in aqueous (D2O) solutions (0.2 M) containing either 1 M AA and 1 M NaCl or
1 M NaAsc and 1M HCl (both solutions had the same pH of 3.4). The carboxyl 13C T1 of
acetate was identical in both solutions (45±1s). As was already observed in [1-13C]glycine
aqueous solutions 20, the stronger dipolar fields induced by protonated water as compared to
deuterated water strongly reduce the long T1 of the carboxyl 13C spins. Since vitamin C is a
diprotic acid with pKa values of 4.21 and 11.79, the amount of protons exchanged with the
solvent within the time course of an experiment is much larger in AA solutions than in NaAsc
solutions (see figure 2.8).
We deduced that the optimal aqueous (D2O) scavenging solution to be inserted inside
the separator/infusion pump should contain 1-2 M of deuterated NaAsc (much higher con-
40

2.3. Discussion
Figure 2.8: Effect of proton exchange between vitamin C and water molecules on the magneticenvironment of acetate molecules in aqueous (D2O) solutions.
Figure 2.9: In vitro 13C T1 measurements of [1-13C]sodium acetate in aqueous (D2O) solutionsat 33C (black) and 17C (grey) as a functionof NaAsc (circles) or AA (squares) concentra-tion. No aminoxyl radicals were added to thesolutions.
centrations are not possible due to the solubility threshold of sodium ascorbate in D2O ( 2.5 M
at 25C)), which corresponds to a final infusate concentration of 0.4-0.8 M. A signal intensity
gain of 9% was observed at the end of the 9 s infusion in a 0.4 M solution. The gain in signal
would be even larger for longer injection times. Similar T1 measurements were performed at
17C, which is the base temperature of the separator/infusion pump inside the imager if the
hot air is turned off. Although the same behavior was observed when the concentration of
vitamin C is increased (see figure 2.9), it showed that the T1 values are significantly lower at
17C. Besides the significant increase in T1, two additional reasons lead to the use of hot air to
maintain the infusion pump at 33C: first, the scavenging reaction kinetics is faster at higher
temperature and second, the temperature of the hyperpolarized solution is nearly at body
temperature at the time of injection since it is within 5C of the pump temperature after its
transfer into the pump.
In summary, the method presented herein allows (a) to precisely determine the infusate13C polarization inside the imager at the time of the injection without additional delay between
dissolution and injection, (b) to scavenge the radicals used as polarizing agents without the
41

Chapter 2. In vivo DNP-enhanced MR experiment protocol
cost of reducing the final infusate concentration, and (c) to start the injection of hyperpolarized
solutions into live animals as rapidly as 3 s following dissolution. This automated protocol
leads to highly reproducible experiments and can facilitate the quantitative analysis of in vivo
hyperpolarized NMR experiments while minimizing the signal losses.
References
[1] J. H. Ardenkjaer-Larsen, B. Fridlund, A. Gram, G. Hansson, L. Hansson, M. H. Lerche, R. Servin, M. Thaning,and K. Golman. Increase in signal-to-noise ratio of > 10,000 times in liquid-state nmr. Proceedings of theNational Academy of Sciences of the United States of America, 100(18):10158–10163, 2003.
[2] A. Comment, B. van den Brandt, K. Uffmann, F. Kurdzesau, S. Jannin, J. A. Konter, P. Hautle, W. T. H. Wencke-bach, R. Gruetter, and J. J. van der Klink. Design and performance of a dnp prepolarizer coupled to a rodentmri scanner. Concepts in Magnetic Resonance Part B-Magnetic Resonance Engineering, 31B(4):255–269, 2007.
[3] S. Jannin, A. Comment, F. Kurdzesau, J. A. Konter, P. Hautle, B. van den Brandt, and J. J. van der Klink. A 140ghz prepolarizer for dissolution dynamic nuclear polarization. Journal of Chemical Physics, 128(24), 2008.
[4] H. Johanneson, S. Macholl, and J. H. Ardenkjaer-Larsen. Dynamic nuclear polarization of [1-c-13]pyruvicacid at 4.6 tesla. Journal of Magnetic Resonance, 197(2):167–175, 2009.
[5] S. Jannin. Dynamic nuclear polarization techniques for magnetic resonance imaging and particles targetsexperiments. PhD thesis, 2009.
[6] F. Kurdzesau. Some methods of dynamic nuclear polarization for use in metabolic imaging. PhD thesis, 2009.
[7] D. M. Ginsberg and M. J. Melchner. Optimum geometry of saddle shaped coils for generating a uniformmagnetic field. Review of Scientific Instruments, 41(1):122–123, 1970.
[8] S. T. Goertz, J. Harmsen, J. Heckmann, C. Hess, W. Meyer, E. Radtke, and G. Reicherz. Highest polariza-tions in deuterated compounds. Nuclear Instruments & Methods in Physics Research Section a-AcceleratorsSpectrometers Detectors and Associated Equipment, 526(1-2):43–52, 2004.
[9] R. Gruetter. Automatic, localized in vivo adjustment of all first- and second-order shim coils. MagneticResonance in Medicine, 29(6):804–11, 1993.
[10] P. Mieville, P. Ahuja, R. Sarkar, S. Jannin, P. R. Vasos, S. Gerber-Lemaire, M. Mishkovsky, A. Comment, R. Gruet-ter, O. Ouari, P. Tordo, and G. Bodenhausen. Scavenging free radicals to preserve enhancement and extendrelaxation times in nmr using dynamic nuclear polarization. Angewandte Chemie-International Edition,49(43):7834–7834, 2010.
[11] M. Carravetta, O. G. Johannessen, and M. H. Levitt. Beyond the t-1 limit: Singlet nuclear spin states in lowmagnetic fields. Physical Review Letters, 92(15), 2004.
[12] P. R. Vasos, A. Comment, R. Sarkar, P. Ahuja, S. Jannin, J. P. Ansermet, J. A. Konter, P. Hautle, B. van den Brandt,and G. Bodenhausen. Long-lived states to sustain hyperpolarized magnetization. Proceedings of the NationalAcademy of Sciences of the United States of America, 106(44):18469–18473, 2009.
[13] W. S. Warren, E. Jenista, R. T. Branca, and X. Chen. Increasing hyperpolarized spin lifetimes through truesinglet eigenstates. Science, 323(5922):1711–1714, 2009.
[14] M. C. Tayler, I. Marco-Rius, M. I. Kettunen, K. M. Brindle, M. H. Levitt, and G. Pileio. Direct enhancement ofnuclear singlet order by dynamic nuclear polarization. J Am Chem Soc, 134(18):7668–71, 2012.
42

References
[15] C. Laustsen, G. Pileio, M. C. Tayler, L. J. Brown, R. C. Brown, M. H. Levitt, and J. H. Ardenkjaer-Larsen.Hyperpolarized singlet nmr on a small animal imaging system. Magnetic Resonance in Medicine, 2012.
[16] P. R. Jensen, T. Peitersen, M. Karlsson, R. In ’t Zandt, A. Gisselsson, G. Hansson, S. Meier, and M. H. Lerche.Tissue-specific short chain fatty acid metabolism and slow metabolic recovery after ischemia from hyperpo-larized nmr in vivo. J Biol Chem, 284(52):36077–82, 2009.
[17] M. Mishkovsky, A. Comment, and R. Gruetter. In vivo detection of brain krebs cycle intermediate by hyperpo-larized magnetic resonance. J Cereb Blood Flow Metab(accepted), 2012.
[18] D. M. Wilson, K. R. Keshari, P. E. Larson, A. P. Chen, S. Hu, M. Van Criekinge, R. Bok, S. J. Nelson, J. M.Macdonald, D. B. Vigneron, and J. Kurhanewicz. Multi-compound polarization by dnp allows simultaneousassessment of multiple enzymatic activities in vivo. Journal of Magnetic Resonance, 205(1):141–7, 2010.
[19] A. Comment, J. Rentsch, F. Kurdzesau, S. Jannin, K. Uffmann, R. B. van Heeswijk, P. Hautle, J. A. Konter,B. van den Brandt, and J. J. van der Klink. Producing over 100 ml of highly concentrated hyperpolarizedsolution by means of dissolution dnp. Journal of Magnetic Resonance, 194(1):152–5, 2008.
[20] H. Pearson, D. Gust, I. M. Armitage, H. Huber, J. D. Roberts, R. E. Stark, R. R. Vold, and R. L. Vold. Nuclearmagnetic resonance spectroscopy: reinvestigation of carbon-13 spin-lattice relaxation time measurements ofamino acids. Proc Natl Acad Sci U S A, 72(4):1599–601, 1975.
43


3 Producing radical-free hyperpolarizedsolutions for in vivo MR
Abstract
Dissolution DNP allows achieving tremendous gain in SNR in NMR experiments. Once
the polarized sample is dissolved, the stable radicals used as polarizing agents become un-
desirable since their presence is an additional source of nuclear spin relaxation and their
toxicity might be an issue. We demonstrate here that by using spin-labeled thermoresponsive
hydrophilic polymer networks it is possible to prepare hyperpolarized solutions free of stable
radicals immediately after dissolution. We applied this method to hyperpolarize 13C-labeled
tert-butanol which has been recently shown to be a promising contrast agent for perfusion
imaging.
Partially adapted from:
T. Cheng, M. Mishkovsky, J. N. Junk, D. Hinderberger
K. Muennemann and A. Comment
Producing radical-free hyperpolarized solutions for in vivo magnetic resonance
Manuscript in preparation
45

Chapter 3. Producing radical-free hyperpolarized solutions for in vivo MR
3.1 Introduction
Dissolution DNP has become the most attractive technique for enhancing the sensitivity
of NMR and its associated imaging methods because of its versatility. The nuclear polarization
of protons, 13C and 15N spins can be enhanced by 3 to 4 orders of magnitude to give tremen-
dous gain in SNR in in vivo NMR experiments. To perform DNP, it is necessary to introduce
paramagnetic centers inside the sample containing the nuclear spins to be polarized. For
liquid-state NMR, MRS and MRI, there are two main issues linked to the presence of stable
radicals in the samples: (a) for in vivo applications in animals or humans, radical species have
to be filtered out for toxicity issues; due to this procedure, the time delay between preparation
and injection of the hyperpolarized molecules is increased and lead to losses in polarization
as a consequence of nuclear spin relaxation. It also introduces the risk of contamination and
thus requires pharmacological tests that further increase the delay; (b) the radicals have an
adverse effect on the lifetime of the DNP-enhanced nuclear polarization through nuclear spin
relaxation, both in the solid-state and in the liquid-state. It is thus necessary to rapidly warm
up and dilute the sample to transform the frozen samples containing about 10-100 mM of
stable radicals into a liquid with a largely reduced radical concentration, typically less than 1
mM.
Most dissolution DNP studies performed with the commercial DNP polarizer HyperSenseTM
used trityl radicals, OX063, Finland and their derivatives, as polarizing agents. These rad-
icals have an extremely narrow ESR linewidth and they were shown to efficiently polarize13C-labeled biomolecules, especially pyruvic acid 1–3 for in vivo small animal experiments4;5.
It has been reported that trityl radicals can be removed by using mechanical filter and a final
radical concentration after filtering can be controlled around 1µM6 which is far lower than
the median lethal dose (LD50) value of 7mmol/Kg 7 for OX063.
The other type of polarizing agent currently used in dissolution DNP is the nitroxyl
radicals including TEMPO and its derivatives. Unlike the trityl radicals, nitroxyl radicals
usually have a broad ESR inhomogeneous line width. The maximum 13C polarization at a
given field and temperature is thus usually lower than with trityl radicals, but all nuclear
spins can be polarized, in particular protons 8–10. Due to the large LD50 value of ∼600 mg /K g ,
nitroxyl radicals were also used for in vivo DNP studies11–13. Another advantage of nitroxyl
radical which has been extensively discussed in chapter 2, is that it is feasible to scavenge
them to a non-paramagnetic molecule using vitamin C.
Radiation-induced radicals created in solid samples at low temperature were reported to
be highly efficient for polarizing specific nuclei in polarized targets 14;15. Unlike stable radicals,
radiation-induced radicals are quenched through recombinations when the sample is melted
and therefore no radical is left in the liquid-state sample. The drawback of this technique is
that several types of radicals are created and if the sample is composed of several compounds
the ESR line width will become prohibitively large. Instead of radiolysis, Kumada et al. showed
the possibility of using precursor molecules transformed in radicals through UV photolysis for
46

3.2. Materials and Methods
DNP16. Similarly to radiation-induced radicals, UV-induced radicals will recombine during
the warming process of the sample. Moreover, the yield of radical creation can be several folds
higher by accelerating the photolysis process through addition of a photosensitizer.
The idea of producing radical-free DNP-enhanced molecules was developed for Over-
hauser DNP techniques. The immobilization of radicals using water-soluble polymer networks,
on which stable radicals are chemically bound, was successfully implemented17;18. Since
Overhauser DNP takes place at at room-temperature, this strategy makes steady-state injec-
tion and detection of polarized tracer possible and attractive for further development and
potential clinical applications. Recently, a similar type of polymer network named thermore-
sponsive spin-labeled hydrophilic polymer networks (SL-hydrogel) was developed to polarize1H spins 19. In this study we used the same kind of hydrogel to hyperpolarize 13C in samples
via dissolution DNP. We demonstrate that by using spin-labeled thermoresponsive hydrogel,
it is possible to prepare hyperpolarized solutions free of stable radicals immediately after
dissolution.
3.2 Materials and Methods
3.2.1 Thermoresponsive spin-labeled hydrogel
A thermoresponsive hydrogel is a special polymer network soluble in water and contains
temperature sensitive part and radical-linked part. Upon heating, the hydrogel quickly shrinks
and the solvent is expelled from the polymer network (see figure 3.1). Since the radicals
are covalently bound to the hydrogel and therefore immobilized in the gel, the extracted
hyperpolarized solutions do not contain stable radicals. Thermoresponsive spin-labeled
hydrogel is synthesized through polymerization of N,N-ethylmethylacrylamids (EMAAm)
and amino-functionalized nitroxide linked Methacrylic acid (MAA). The former is working
as thermoresponsive unit which can bear a critical solution temperature of 63C and the
percentage of the latter in a sample determines the average radical concentration under
swollen state.
Figure 3.1: Principle of how a thermoresponsive SL-hydrogel works20.
47

Chapter 3. Producing radical-free hyperpolarized solutions for in vivo MR
3.2.2 DNP procedure
d10-tert-butanol (99%, Sigma-Aldrich, Switzerland) was mixed with D2O in a ratio of
9:1(v/v) and then 500 µL of the solvent mixture was mixed with 35 mg of 15% SL-hydrogel
to achieve an equivalent radical concentration of 6.8 mM. Due to the high viscosity all the
samples were loaded directly into sample cup and rapidly frozen in liquid nitrogen. The frozen
sample was then transferred in a 5 T custom-designed DNP polarizer21 and dynamically
polarized at 1±0.05 K by irradiating microwave at 140.18 GHz with a power of 35 mW. The
solid-state polarization build-up was monitored by applying a 5 pulse in the RF saddle coil
placed around the sample every 5 minutes. Once the polarization reached maximum after
about 5 hours, the sample was rapidly dissolved with 5 mL D2O heated up to 9 bars and
transferred within 2 s into a home-built separator/infusion pump located in the isocenter of
the in-house 9.4 T scanner. The characteristic decay time of the 1-13C signal of tert-butanol
was measured using a custom-built solenoid probe installed around the separator/infusion
pump (see chapter 2). RF pulses with a small flip angle of 5 were applied every 3 s. For
comparison, samples prepared with the same solvent mixture were polarized using 33 mM
TEMPOL instead of SL-hydrogel, dissolved and measured in the same conditions.
Figure 3.2: Chemical structure and labeling of tert-butanol
3.2.3 balanced Steady State Free Precession (b-SSFP) sequence
With the rapid development of the dissolution DNP technique, hyperpolarized 13C mag-
netic resonance spectroscopic imaging has become more and more interesting for acquiring
metabolic information. Although the magnetic field gradient requirements for 13C imaging
limits the maximal spatial image resolution by a factor of 4 compared to 1H imaging due
to the gyromagnetic ratio difference, the low image background noise, large chemical shift
distribution, and the large SNR enhancement provide a solid basis for imaging hyperpolarized13C-labeled substrates.
Due to the relatively long T1 of hyperpolarized 13C labeled substrates, different metabolic
imaging strategies have been used in practice, which include chemical shift imaging22;23,
compressed sensing accelerated imaging24–27 and imaging with multiband spectral-spatial
48

3.2. Materials and Methods
RF excitation pulse28. The first two methods are usually used for single time point image of
metabolites as the imaging time is relatively long. The latter one uses selective RF pulse to
excite the metabolites of interest with various flip angles so that the SNR of the metabolites
can be greatly improved. Another approach is the use of balanced SSFP based sequence
with single- or multi-echo readout29;30. Several overviews of imaging sequences used with
hyperpolarized substrate can be found elsewhere 31;32.
With the extraordinary long in vitro and in vivo T1 and T2 reported for hyperpolarized
tert-butanol used for in vivo brain perfusion experiment 33, b-SSFP method has been chosen
for in vivo perfusion imaging using radical-free hyperpolarized 13C-labeled tert-butanol. The
b-SSFP sequence was prepared by modifying a standard 3D gradient echo (GE3D) sequence
by adding a preparation pulse with a flip angle of α/2 and TR/2 away from the first excitation
pulse with a flip angle of α, alternating the phase of the excitation pulses for each TR (α and
−α), and balancing all the gradients after the readout (see figure 3.3). The main purpose of
adding a preparation pulse was to directly bring the magnetization close to its steady state
position and thus strongly reduce the magnetization fluctuations caused by the upcoming
excitation pulses34. The balanced gradient refocuses the spins back together so that the
net transverse magnetization was maximized and recycled in the beginning of each TR as
opposed to conventional gradient echo sequence. In order to reduce the RF depletion, after
the whole 3D image acquisition a flip back pulse with a flip angle of α/2 was added so that the
magnetization can be preserved in the Z direction. The in vivo images were acquired using
the modified b-SSFP sequence (α= 60 FA, 5 mm slice thickness, TR/TE =10/5 ms, axial FOV:
30×30×15 mm3, 64×64×2 matrix).
Figure 3.3: b-SSFP sequence based on a 3D gradient echo sequence with a α/2 preparationpulse.
49

Chapter 3. Producing radical-free hyperpolarized solutions for in vivo MR
3.3 Results
The characteristic 13C solid-state build-up time constant was measured to be 5600±290 s
in samples (n=2) polarized with SL-hydrogel matrices. The solid-state enhancement was 20±1
for all samples, corresponding to a room-temperature liquid-state enhancement of 6000±300.
The 13C longitudinal relaxation time of both 13C labeling (see figure 3.2) was deduced from
the decay of the signal as a function of time (see figure 3.4). The [1−13 C] T1 of 112±2 s and
[2−13 C] T1 of 28±1 s was determined for natural abundance tert-butanol polarized with the
SL-hydrogel. For comparison, samples containing TEMPO radicals were polarized (τBuildup
time of 2200 s) and the dissolution results showed a much shorter [1−13 C] T1 of 29±0.1 s (not
shown here).
To test the b-SSFP sequence image series of the separator/infusion pump were taken
after the hyperpolarized [1-13C] acetate solution was transferred into the pump (see figure 3.5).
A maximum image SNR of 120 was detected. Strong banding artifacts were observed in the
image in addition.
3.4 Discussion
The fact that the 13C polarization buildup in tert-butanol samples prepared with SL-
hydrogel was much slower than in the samples prepared with nitroxyl radicals can be explained
by the fact that the radical concentration was suboptimal and that the 13C spin concentration
was low (∼ 0.1 M). The usage of 13C-labeled tert-butanol should increase the polarization
speed.
A large T1 difference between [1-13C]- and [2-13C]-d10-tert-butanol measured in the DNP
experiments (shown in 3.4) was observerd. To explain this the dipolar interaction of C-H bond
in the methyl group of tert-butanol cannot be neglected. The [1-13C] T1 of d10-tert-butanol
was also measured in thermally polarized (degassed and non-degassed) 9:1 d10-tert-butanol /
D2O (v/v) samples in a high-resolution 9.4T (Bruker) system using a saturation recovery pulse
sequence (see figure 1.9). The long T1s acquired from the high-resolution NMR measurements
not only confirmed that the solution localized in the infusion/separator pump and ready
to be infused is free of stable radical, but also demonstrated that the solution is free of any
paramagnetic species and in particular dissolved oxygen in the solution.
The choice of tert-butanol for testing 13C polarization was made by considering both
the perspectives of in vivo applications and the good compatibility with the hydrogel. Note
that the hydrogel collapses if mixed with salt even at very low concentration. Due to the
spin labeling with nitroxyl radicals and their instability in low pH solutions, the typical pure
acids used in DNP applications such as pyruvic acid are not suitable for the hydrogel sample
preparation. Taking all these considerations into account, our current method is only suitable
with alcohols as substrate. Similar experiments were also performed using d6-EtOD. An in vitro
[1-13C] T1 of 90 s was measured and fit to the T1 value measured with degassed d6-EtOD in high
50

3.4. Discussion
Figure 3.4: (a) Low temperature (1 K) buildup of 13C polarization signal from natural 13Cabundance d10-butanol; (b) Low temperature (1 K) buildup of 13C polarization signal from nat-ural 13C abundance d6-ethanol; (c) in vitro relaxation signal of hyperpolarized [1-13C](black)and [2-13C] (grey) of d10-butanol using hydrogel preparation; (d) in vitro relaxation signal ofhyperpolarized [1-13C] d6-ethanol using hydrogel preparation (black) and TEMPO prepara-tion (grey); T1 measurements at 25C using saturation recovery of d10-tert-butanol (e) andd6-ethanol (f) in D2O solute with degassing shows that the hyperpolarized solutions was freeof paramagnetic impurities.
51

Chapter 3. Producing radical-free hyperpolarized solutions for in vivo MR
Figure 3.5: 13C images of separator/infusion pump taken by b-SSFP sequence. Strong bandingartifacts were observed in the images.
resolution NMR at the same magnetic field (see figure 3.4). One of the advantages of ethanol
lies in the fact that it can be dissolved at relatively low temperature since ethanol has a low
melting point of -90C. Mixture of ethanol and water can thus be easily melt at temperature
close to room-temperature. A dissolution pressure of 8 bars allowed for recollection and reuse
of the SL-hydrogel.
The inhomogeneous 13C signal distribution in the images detected by b-SSFP sequence
was mainly originated from the inhomogeneous B1 field in the vertical direction created
by the 13C solenoid coil on the pump. The observed strong banding artifacts is known for
b-SSFP sequence since b-SSFP sequence is very sensitive to the T∗2 , or the magnetic field
inhomogeneity in other words. This effect is especially strong in ultra high magnetic field.
To reduce the banding effect in the DNP-enhanced MRI it is suggested to have a α/2 pulse
at the end of readout such that the spins could be flipped back to Z direction and thus the
images would be more T2 sensitive instead of T∗2 sensitive. The preliminary test of the b-
SSFP sequence contained a lot of information which could help for improving the sequence
performance and more tests have been scheduled for preparing the imaging experiments
involved with SL-hydrogel.
3.5 Conclusion
We demonstrated that spin-labeled thermoresponsive hydrogel allows for producing
radical-free hyperpolarized solutions via dissolution DNP. This method has a high potential
for future clinical applications of DNP since it not only leads to reduce polarization losses but
it also directly solve the question of toxicity linked to the presence of radicals in the hyperpo-
larized solutions. We applied this method to hyperpolarize 13C-labeled tert-butanol which
has been recently shown to be a promising contrast agent for in vivo perfusion imaging33.
52

References
References
[1] J. H. Ardenkjaer-Larsen, B. Fridlund, A. Gram, G. Hansson, L. Hansson, M. H. Lerche, R. Servin, M. Thaning,and K. Golman. Increase in signal-to-noise ratio of > 10,000 times in liquid-state nmr. Proceedings of theNational Academy of Sciences of the United States of America, 100(18):10158–10163, 2003.
[2] J. H. Ardenkjaer-Larsen, S. Macholl, and H. Johannesson. Dynamic nuclear polarization with trityls at 1.2 k.Applied Magnetic Resonance, 34(3-4):509–522, 2008.
[3] H. Johanneson, S. Macholl, and J. H. Ardenkjaer-Larsen. Dynamic nuclear polarization of [1-c-13]pyruvicacid at 4.6 tesla. Journal of Magnetic Resonance, 197(2):167–175, 2009.
[4] S. E. Day, M. I. Kettunen, F. A. Gallagher, D. E. Hu, M. Lerche, J. Wolber, K. Golman, J. H. Ardenkjaer-Larsen,and K. M. Brindle. Detecting tumor response to treatment using hyperpolarized 13c magnetic resonanceimaging and spectroscopy. Nat Med, 13(11):1382–7, 2007.
[5] F. A. Gallagher, M. I. Kettunen, and K. M. Brindle. Biomedical applications of hyperpolarized (13)c magneticresonance imaging. Progress in Nuclear Magnetic Resonance Spectroscopy, 55(4):285–295, 2009.
[6] J. H. Ardenkjaer-Larsen, A. M. Leach, N. Clarke, J. Urbahn, D. Anderson, and T. W. Skloss. Dynamic nuclearpolarization polarizer for sterile use intent. Nmr in Biomedicine, 24(8):927–932, 2011.
[7] M. C. Krishna, S. English, K. Yamada, J. Yoo, R. Murugesan, N. Devasahayam, J. A. Cook, K. Golman, J. H.Ardenkjaer-Larsen, S. Subramanian, and J. B. Mitchell. Overhauser enhanced magnetic resonance imagingfor tumor oximetry: Coregistration of tumor anatomy and tissue oxygen concentration. Proceedings of theNational Academy of Sciences of the United States of America, 99(4):2216–2221, 2002.
[8] M. Pluckthun, C. Bradtke, H. Dutz, R. Gehring, S. Goertz, J. Harmsen, P. Kingsberry, W. Meyer, and G. Reicherz.Polarization measurements of tempo-doped butanol targets. Nuclear Instruments & Methods in PhysicsResearch Section a-Accelerators Spectrometers Detectors and Associated Equipment, 400(1):133–136, 1997.
[9] A. Comment, S. Jannin, J. N. Hyacinthe, P. Mieville, R. Sarkar, P. Ahuja, P. R. Vasos, X. Montet, F. Lazeyras, J. P.Vallee, P. Hautle, J. A. Konter, B. van den Brandt, J. P. Ansermet, R. Gruetter, and G. Bodenhausen. Hyper-polarizing gases via dynamic nuclear polarization and sublimation. Physical Review Letters, 105(1):018104,2010.
[10] A. B. Barnes, G. De Paepe, P. C. A. van der Wel, K. N. Hu, C. G. Joo, V. S. Bajaj, M. L. Mak-Jurkauskas, J. R. Sirigiri,J. Herzfeld, R. J. Temkin, and R. G. Griffin. High-field dynamic nuclear polarization for solid and solutionbiological nmr. Applied Magnetic Resonance, 34(3-4):237–263, 2008.
[11] R. B. van Heeswijk, K. Uffmann, A. Comment, F. Kurdzesau, C. Perazzolo, C. Cudalbu, S. Jannin, J. A. Konter,P. Hautle, B. van den Brandt, G. Navon, J. J. van der Klink, and R. Gruetter. Hyperpolarized lithium-6 as asensor of nanomolar contrast agents. Magn Reson Med, 61(6):1489–93, 2009.
[12] C. Cudalbu, A. Comment, F. Kurdzesau, R. B. van Heeswijk, K. Uffmann, S. Jannin, V. Denisov, D. Kirik, andR. Gruetter. Feasibility of in vivo 15n mrs detection of hyperpolarized 15n labeled choline in rats. PhysicalChemistry Chemical Physics, 12(22):5818–23, 2010.
[13] M. Mishkovsky, A. Comment, and R. Gruetter. In vivo detection of brain krebs cycle intermediate by hyperpo-larized magnetic resonance. J Cereb Blood Flow Metab(accepted), 2012.
[14] S. Goertz, C. Bradtke, H. Dutz, R. Gehring, W. Meyer, M. Pluckthun, G. Reicherz, K. Runkel, and A. Thomas.Investigations in high-temperature irradiated (lih)-li-6,7 and (lid)-li-6, its dynamic nuclear-polarization andradiation-resistance. Nuclear Instruments & Methods in Physics Research Section a-Accelerators SpectrometersDetectors and Associated Equipment, 356(1):20–28, 1995.
53

Chapter 3. Producing radical-free hyperpolarized solutions for in vivo MR
[15] S. T. Goertz, J. Harmsen, J. Heckmann, C. Hess, W. Meyer, E. Radtke, and G. Reicherz. Highest polariza-tions in deuterated compounds. Nuclear Instruments & Methods in Physics Research Section a-AcceleratorsSpectrometers Detectors and Associated Equipment, 526(1-2):43–52, 2004.
[16] T. Kumada, Y. Noda, T. Hashimoto, and S. Koizumi. Dynamic nuclear polarization study of uv-irradiatedbutanol for hyperpolarized liquid nmr. Journal of Magnetic Resonance, 201(2):115–120, 2009.
[17] E. R. McCarney and S. Han. Spin-labeled gel for the production of radical-free dynamic nuclear polarizationenhanced molecules for nmr spectroscopy and imaging. Journal of Magnetic Resonance, 190(2):307–15, 2008.
[18] B. C. Dollmann, A. L. Kleschyov, V. Sen, V. Golubev, L. M. Schreiber, H. W. Spiess, K. Munnemann, and D. Hin-derberger. Spin-labeled heparins as polarizing agents for dynamic nuclear polarization. Chemphyschem,11(17):3656–63, 2010.
[19] B. C. Dollmann, M. J. Junk, M. Drechsler, H. W. Spiess, D. Hinderberger, and K. Munnemann. Thermore-sponsive, spin-labeled hydrogels as separable dnp polarizing agents. Physical Chemistry Chemical Physics,12(22):5879–82, 2010.
[20] MatthiasJ N. Junk. Thermoresponsive spin-labeled hydrogels as separable dnp polarizing agents. In Assessingthe Functional Structure of Molecular Transporters by EPR Spectroscopy, Springer Theses, pages 133–148.Springer Berlin Heidelberg, 2012.
[21] A. Comment, B. van den Brandt, K. Uffmann, F. Kurdzesau, S. Jannin, J. A. Konter, P. Hautle, W. T. Wenckebach,R. Gruetter, and J. J. van der Klink. Principles of operation of a dnp prepolarizer coupled to a rodent mriscanner. Applied Magnetic Resonance, 34(3-4):313–319, 2008.
[22] K. Golman, R. in’t Zandt, and M. Thaning. Real-time metabolic imaging. Proceedings of the National Academyof Sciences of the United States of America, 103(30):11270–11275, 2006.
[23] Alessandra Flori, Francesca Frijia, Vincenzo Lionetti, JanH Ardenkjaer-Larsen, Vincenzo Positano, GiulioGiovannetti, RolfF Schulte, Florian Wiesinger, FabioA Recchia, Luigi Landini, MariaF Santarelli, MassimoLombardi, and Luca Menichetti. Dnp methods for cardiac metabolic imaging with hyperpolarized [1-13c]pyruvate large dose injection in pigs. Applied Magnetic Resonance, 43(1-2):299–310, 2012.
[24] P. E. Z. Larson, R. Bok, A. B. Kerr, M. Lustig, S. Hu, A. P. Chen, S. J. Nelson, J. M. Pauly, J. Kurhanewicz, and D. B.Vigneron. Investigation of tumor hyperpolarized [1-c-13]-pyruvate dynamics using time-resolved multibandrf excitation echo-planar mrsi. Magnetic Resonance in Medicine, 63(3):582–591, 2010.
[25] S. Hu, M. Lustig, A. P. Chen, J. Crane, A. Kerr, D. A. C. Kelley, R. Hurd, J. Kurhanewicz, S. J. Nelson, J. M. Pauly,and D. B. Vigneron. Compressed sensing for resolution enhancement of hyperpolarized c-13 flyback 3d-mrsi.Journal of Magnetic Resonance, 192(2):258–264, 2008.
[26] M. Lustig, D. Donoho, and J. M. Pauly. Sparse mri: The application of compressed sensing for rapid mrimaging. Magnetic Resonance in Medicine, 58(6):1182–1195, 2007.
[27] P. E. Z. Larson, S. Hu, M. Lustig, A. B. Kerr, S. J. Nelson, J. Kurhanewicz, J. M. Pauly, and D. B. Vigneron.Fast dynamic 3d mr spectroscopic imaging with compressed sensing and multiband excitation pulses forhyperpolarized c-13 studies. Magnetic Resonance in Medicine, 65(3):610–619, 2011.
[28] P. E. Z. Larson, A. B. Kerr, A. P. Chen, M. S. Lustig, M. L. Zierhut, S. Hu, C. H. Cunningham, J. M. Pauly,J. Kurhanewicz, and D. B. Vigneron. Multiband excitation pulses for hyperpolarized c-13 dynamic chemical-shift imaging. Journal of Magnetic Resonance, 194(1):121–127, 2008.
[29] J. Svensson, S. Mansson, E. Johansson, J. S. Petersson, and L. E. Olsson. Hyperpolarized c-13 mr angiographyusing truefisp. Magnetic Resonance in Medicine, 50(2):256–262, 2003.
[30] J. Leupold, O. Wieben, S. Mansson, O. Speck, K. Scheffler, J. S. Petersson, and J. Hennig. Fast chemical shiftmapping with multiecho balanced ssfp. Magnetic Resonance Materials in Physics Biology and Medicine,19(5):267–273, 2006.
54

References
[31] R. E. Hurd, Y. F. Yen, A. Chen, and J. H. Ardenkjaer-Larsen. Hyperpolarized 13c metabolic imaging usingdissolution dynamic nuclear polarization. Journal of Magnetic Resonance Imaging, 36(6):1314–1328, 2012.
[32] K. M. Brindle, S. E. Bohndiek, F. A. Gallagher, and M. I. Kettunen. Tumor imaging using hyperpolarized c-13magnetic resonance. Magnetic Resonance in Medicine, 66(2):505–519, 2011.
[33] A. K. Grant, E. Vinogradov, X. E. Wang, R. E. Lenkinski, and D. C. Alsop. Perfusion imaging with a freelydiffusible hyperpolarized contrast agent. Magnetic Resonance in Medicine, 66(3):746–755, 2011.
[34] K. Scheffler and S. Lehnhardt. Principles and applications of balanced ssfp techniques. European Radiology,13(11):2409–2418, 2003.
55


4 Preliminary results on 15N and 89Y
labeled tracers for in vivo hyperpolar-ized NMR
Abstract
Extraordinarily long T1’s were measured in molecules containing either a 15N-labeled
quaternary ammonium ion or a 89Y nuclear spin. After having optimized the preparation of
hyperpolarized 15N-labeled choline and hyperpolarized 89Y(DOTA)− complexes by performing
solid-state DNP studies and in vitro measurements, in vivo measurements were carried out in
the rat brain and kidney. A non-negligible amount of choline was taken up by the brain during
the time window of the experiment showing that it should be possible to detect its downstream
metabolites and possibly use hyperpolarized 15N-choline as a biomarker for cancer research.
Bio-compatible hyperpolarized 89Y solutions for in vivo experiments were prepared using89Y(DOTA)− complexes and it was shown for the first time that 89Y can be detected in vivo.
57

Chapter 4. Preliminary results on 15N and 89Y labeled tracers for in vivo hyperpolarizedNMR
4.1 Introduction
So far, most in vivo studies performed with DNP-enhanced solutions have been done
using 13C-labeled molecules, and in particular with 13C-labeled pyruvate. Carboxyl 13Cs
usually have a long longitudinal relaxation time, even in vivo (about 30-50 seconds). We aimed
at implementing in vivo hyperpolarized NMR experiments with substrates labeled with very
long T1 nuclear spins.
Figure 4.1: Chemical structure of choline chloride (left) and Y[DOTA]− (right).
Nitrogen is a common and essential element in biological tissues that is found in amino
acid and thus proteins and in deoxyribonucleic and ribonucleic acids. Both nitrogen isotopes
are NMR active but the most abundant, 14N, has a spin 1 and cannot be highly polarized
due to the large line width at higher magnetic field. 15N, a spin-1/2 element with a natural
abundance of 0.4%, can have an extremely longitudinal relaxation time (T1), up to several
hundreds of seconds, in room-temperature liquids if it is not directly bound to protons. It is
the case in molecules containing a quaternary ammonium ion like carnitine and choline 1;2.
These molecules are suitable for hyperpolarized NMR and can be used as substrates to study
the dynamics of essential metabolic pathways. It has been observed that in many cancer cells
the total choline level increases. Choline (see figure 4.1) is thus an important biomarker that is
attractive for tumor diagnosis and treatment response via MRS 3. Already several in vitro DNP
experiments have been performed with 15N-choline in cell culture 4;5. We know from previous
studies that hyperpolarized 15N-choline can be detected in vivo and that the observed T1 is
on the order of 100 s6. The signal was detected in the rat brain but no metabolites could be
detected and improved polarization levels would be greatly beneficial for such studies. One
of the open issues was whether the observed 15N choline signal was originating from blood
or from brain tissue. In the first section of this chapter, an in vivo protocol was designed to
investigate the spatial origin of hyperpolarized 15N choline signal in the rat brain by selectively
acquiring localized spectra from different spatial locations in the brain.
The yttrium isotope 89Y has a spin-1/2 and a natural abundance of 100%. Its NMR
58
4.2. 15N choline
sensitivity is unfortunately quite low since 89Y has a very small gyromagnetic ratio, about 20
times smaller than proton. It however turns out that 89Y in Y3+ complexes also has an unusually
long longitudinal relaxation time (up to about 500s in ex vivo Y[DOTA]− 7) (see figure 4.1).
One of its attractive features is that it has the same valence as gadolinium and can therefore
substitute Gd3+ in FDA-approved contrast agents such as Gd(DOTA)− (the radioactive yttrium
isotope 90Y based complex 90Y[DOTATOC] is also a FDA-proven PET tracer that is being
tested for detecting somatostatin receptor positive tumor8). Moreover, the resonance of 89Y
is quite sensitive to its surroundings through its large chemical shift range, and could hence
bring information on the local environment of the hyperpolarized molecules. Various Y3+
complexes have been tested by our collaborators from the UT Southwestern Medical Center
(Dallas, Texas), which is one of the world leading MRI research centers in the field of contrast
agents 7, and they designed Y(DOTA)− probes with a very large dependence of the pH on the89Y chemical shift 9. Recently, 89Y signal enhancement over 60,000 were reported for optimized
samples containing Y(DOTA)− complexes 10. These results demonstrate the great potential of
these complexes for probing the pH of diseased tissues in vivo.
In this chapter, preliminary DNP and hyperpolarized MR experiments including in vivo
results obtained with 15N-labeled choline and 89Y[DOTA]− will be presented.
4.2 15N choline
The samples were prepared in the form of frozen beads from a 6M 15N labeled choline
chloride solution in D2O/d8 −glycerol 2:3(v/v) doped with 50mM TEMPO radicals. A dozen of
beads (∼ 50µL) were polarized in the 5T polarizer at 140.18GHz and 1.05±0.05K. The DNP
parameters such as the microwave power and frequency were kept identical to those used
to polarize 13C-labeled substrates (this was motivated by the fact that the ESR linewidth
of TEMPO is much larger than the nuclear resonance frequency of 15N). A buildup time
constant τBui ldup for 15N at 5 T of 3812±55 s was determined by monitoring the NMR signal
every 10 minutes with calibrated 10 RF pulses (see figure 4.2) and a maximal 15N solid-state
polarization of about 5% was achieved after 3.5 hours of microwave irradiation. Following
dissolution, the concentration of 15N choline in the hyperpolarized aqueous solutions was
around 90 mM, as confirmed by high-resolution NMR measurements performed subsequently.
A liquid-state 15N polarization level of 5% was determined through in vitro experiments
performed on hyperpolarized choline solutions injected into a phantom placed underneath
the 15N surface coil used for in vivo experiments. Since all nuclear spins should reach the
same spin temperature at the end of the solid-state DNP process, such polarization level is
consistent with the typical maximum 13C polarization we observed taking into account the
fact that the gyromagnetic ratio of 15N is 2.5 times lower than the one of 13C .
Following the preliminary in vitro measurements, 15N-labeled choline chloride samples
were used for in vivo localized 15N MRS experiments to confirm that the major contribution to
59

Chapter 4. Preliminary results on 15N and 89Y labeled tracers for in vivo hyperpolarizedNMR
the signal measured in the rat brain was coming from brain tissue rather than from the blood
pool. Two voxels were selected on the proton anatomical images of the rat brain, one with a
size of 5×8×8mm3 (n=5) and the other with a size of 3×4×6mm3 (n=2). The major brain
blood vessels were excluded from the voxels of interest. After having carefully homogenized
the static magnetic field in the two voxels using the shim coils and the FASTESTMAP protocol,
a bolus of 2 mL of 90 mM choline chloride solution was injected in one of the rat femoral veins.
The signal localization was done using an outer volume suppression sequence (SIRENE) which
was calibrated with a reference bubble containing 15N-labeled urea and placed on top of the
surface coil to avoid signal contamination from the surrounding tissue. In vivo hyperpolarized
signals in the rat brain were acquired with a 3 ms BIR4.10 pulse and a repetition time of 3 s.
Figure 4.2: Buildup of polarized 15N -choline signal.
As expected the in vivo SNR measured in the smaller voxels were lower than the ones
measured in the larger voxels. In all measurements, the localized characteristic signal decay
exhibited a bi-exponential distribution composed of a very fast component (11±5s) dom-
inating the signal during the first ∼ 10 seconds superimposed to a slowly decaying signal
(83±12s). This observation is consistent with the results previously measured in a similar in
vivo study performed using a 3.35 T polarizer 6. The fast decaying signal was assigned to the
contribution of the blood pool (small capillaries) to the signal and the slowly decaying to the
signal originating from the brain. Unfortunately, a precise determination of tissue choline
uptake could not be estimated from the data so far.These results, however, confirm that a
non-negligible amount of choline was taken up by the brain during the time window of the
experiment and that it should be possible to detect downstream metabolites and possibly use
hyperpolarized 15N-choline as a biomarker for cancer research.
60

4.3. 89Y chloride and DOTA
4.3 89Y chloride and DOTA
Yttrium DNP experiments were first performed with water-soluble yttrium chloride,
YCl3, in order to determine the appropriate polarization parameters. Due to its strong hy-
drophilic properties, yttrium chloride (Sigma-Aldrich, Switzerland) was rapidly mixed under
the ventilated laboratory hood with a D2O/d6 −EtOD 2:1(v/v) solvent mixture doped with
50 mM TEMPO radicals. To prevent the formation of yttrium hydroxide, a few drops of 1M
hydrochloric acid (HCl) were added into the solution. The final 89Y concentration of the DNP
sample was calculated to be around 2.5 M. For solid-state DNP experiments, a volume of
350 µL of the yttrium chloride solution was carefully introduced into a sample cup and then
quickly frozen in liquid nitrogen as a block instead of the standard beads to avoid toxicity
issues. The sample was then loaded and polarized in the 5 T polarizer at 140.18 GHz and
1.05±0.05 K. The build-up of the polarized NMR signal detected at 10.40 MHz was monitored
by applying a 25 pulse every 45 minutes (a low-frequency short-ringing time coil had to be
designed to performed these measurements). The build-up time constant was determined to
be around 16’000 s, which is almost 8 times longer than the standard build-up times measured
on 13C. The solid-state yttrium signal consisted of a sharp single resonance with a FWHM of
1.5 kHz, a linewidth that is only one tenth of the average width observed on 13C. This implies
that the solid-state 89Y T2 in these samples is unusually long (T1 was also prohibitively long to
be measured in a reasonably time at 5 T and 1 K).
Figure 4.3: Buildup of polarized 89Y signal
Bio-compatible hyperpolarized 89Y solutions for in vivo experiments were prepared
using 89Y[DOTA]− complexes provided by our collaborators from the UT Southwestern Med-
ical Center (Dallas, Texas). The concentration of the initial frozen solution was 0.183M in
D2O/d6 −EtOD 2:1(v/v). To accelerate the polarization process, the radical concentration
(TEMPO) was increased from our standard value of 33 mM to 50 mM. Frozen beads were
polarized and dissolved using the standard protocol used for 13C-labeled samples (see chapter
2). A dedicated dual 1H/89Y probe with a 13mm diameter 89Y surface coil based on the design
described in chapter 5 was designed and built for this study. A hollow glass sphere reference
61

Chapter 4. Preliminary results on 15N and 89Y labeled tracers for in vivo hyperpolarizedNMR
bubble containing 120 µL of saturated YCl3 solution and doped with 5 mM of Dotarem con-
trast agent to reduce the T1 of the solution to about 10 s was used as a reference for the 89Y
signal. The pulses were calibrated using the reference and a phantom containing yttrium
chloride placed underneath the surface coil.
In vivo experiments were performed by placing the surface coil on the rat right flank, just
above the kidney (see figure 4.4). Following dissolution, 2.4 mL of hyperpolarized 89Y[DOTA]−
solution was injected into the rat femoral vein using the protocol described in chapter 2. Signal
acquisition started 1s after the end of the injection and a series of consecutive 89Y spectra were
acquired with a repetition time of 14 s using adiabatic BIR4 10 pulses. The 89Y enhancement
was determined to be at least 3250 by comparing the hyperpolarized signal to accumulated
thermal equilibrium signals. The in vivo signal decay measured in the rat kidney was around
50±10s, which is shorter than the T1 values measured in vitro (around 70 s) and much shorter
than the T1 of pure YCl3 (typically 600 s). A possible explanation for this discrepancy could be
the residual radical concentration accumulated in the kidney which leads to a dramatically
shortened T1. Another possibility is that since the Q value of the coil was very large, a small
change of the coil loading during the experiment, possibly due to animal motion, led to a
change in the coil performance.
Figure 4.4: In vivo 89Y spectrum measured in the rat kidney area following a 10 adiabaticpulse (left) and decay of the hyperpolarized 89Y signal in rat kidney (right). The measured invivo T1 is much shorter than the one measured in vitro. We suspect that it is because of theradicals which accumulate in the kidney and shorten T1.
Although many improvements will have to be made to be able to perform pH imaging
using hyperpolarized 89Y[DOTA]−, these preliminary results showed for the first time that 89Y
can be detected in vivo.
62

References
References
[1] C. Gabellieri, S. Reynolds, A. Lavie, G. S. Payne, M. O. Leach, and T. R. Eykyn. Therapeutic target metabolismobserved using hyperpolarized 15n choline. J Am Chem Soc, 130(14):4598–9, 2008.
[2] R. Sarkar, A. Comment, P. R. Vasos, S. Jannin, R. Gruetter, G. Bodenhausen, H. Hall, D. Kirik, and V. P. Denisov.Proton nmr of n-15-choline metabolites enhanced by dynamic nuclear polarization. Journal of the AmericanChemical Society, 131(44):16014–+, 2009.
[3] K. Glunde and N. J. Serkova. Therapeutic targets and biomarkers identified in cancer choline phospholipidmetabolism. Pharmacogenomics, 7(7):1109–23, 2006.
[4] H. Allouche-Arnon, M. H. Lerche, M. Karlsson, R. E. Lenkinski, and R. Katz-Brull. Deuteration of a molecularprobe for dnp hyperpolarization–a new approach and validation for choline chloride. Contrast Media MolImaging, 6(6):499–506, 2011.
[5] H. Allouche-Arnon, A. Gamliel, C. M. Barzilay, R. Nalbandian, J. M. Gomori, M. Karlsson, M. H. Lerche, andR. Katz-Brull. A hyperpolarized choline molecular probe for monitoring acetylcholine synthesis. ContrastMedia Mol Imaging, 6(3):139–47, 2011.
[6] C. Cudalbu, A. Comment, F. Kurdzesau, R. B. van Heeswijk, K. Uffmann, S. Jannin, V. Denisov, D. Kirik, andR. Gruetter. Feasibility of in vivo 15n mrs detection of hyperpolarized 15n labeled choline in rats. PhysicalChemistry Chemical Physics, 12(22):5818–23, 2010.
[7] M. E. Merritt, C. Harrison, Z. Kovacs, P. Kshirsagar, C. R. Malloy, and A. D. Sherry. Hyperpolarized y-89 offersthe potential of direct imaging of metal ions in biological systems by magnetic resonance. Journal of theAmerican Chemical Society, 129(43):12942–+, 2007.
[8] M. de Jong, R. Valkema, F. Jamar, L. K. Kvols, D. J. Kwekkeboom, W. A. P. Breeman, W. H. Bakker, C. Smith,S. Pauwels, and E. P. Krenning. Somatostatin receptor-targeted radionuclide therapy of tumors: Preclinicaland clinical findings. Seminars in Nuclear Medicine, 32(2):133–140, 2002.
[9] A. K. Jindal, M. E. Merritt, E. H. Suh, C. R. Malloy, A. D. Sherry, and Z. Kovacs. Hyperpolarized y-89 complexesas ph sensitive nmr probes. Journal of the American Chemical Society, 132(6):1784–+, 2010.
[10] L. Lumata, A. K. Jindal, M. E. Merritt, C. R. Malloy, A. D. Sherry, and Z. Kovacs. Dnp by thermal mixing underoptimized conditions yields > 60 000-fold enhancement of y-89 nmr signal. Journal of the American ChemicalSociety, 133(22):8673–8680, 2011.
63


5 MR probes for in vivo MRS and MRIat ultra high magnetic field
Abstract
An essential feature of MR probes for magnetic resonance spectroscopy and imaging
is the ability to generate uniform B1 excitation in a volume of interest. When the magnetic
field strength is increased, leading to an increase in resonance frequency, the constraints on
the MR probes size, the sample size and the associated radiation losses caused by conductor
elements are higher. In this chapter, concepts and RF designs of custom-designed surface coils
and volume coils tested in ultra high magnetic field are produced. Bench tests and imaging
obtained with surface coils and birdcage coils operating at 9.4 T and 14.1 T were carried out
and analyzed.
Partially adapted from:
Tian Cheng, Jennifer Jung, Arnaud Comment, Hongxia Lei
Arthur W. Magill and Rolf Gruetter
Performance Comparison of Birdcage Coils at 9.4 T and 14.1 T
Manuscript in preparation
65

Chapter 5. MR probes for in vivo MRS and MRI at ultra high magnetic field
Figure 5.1: An inductive loop (dark gray) posi-tioned as a surface coil (left) or a volume coil(right) to probe the same sample (light gray)with a different geometry.
5.1 Introduction
MRI is one of the most powerful non-invasive biomedical imaging method which plays
an increasingly important role in clinical and research environments. To create high resolution
anatomical images in a limited time period, RF coils have to be designed and optimized.
The signal-to-noise (SNR) ratio measured by a RF coil is proportional to 1,
SN R ∝ B1VSpPT Tn
, (5.1)
where B1 represents the transverse rotating magnetic field, VS is the effective volume of the
sample, PT is the transmitter power and Tn is the temperature at which the thermal noise is
defined. It is obvious that by decreasing the coil temperature the noise is reduced and the SNR
will be enhanced. This led to the development of cryocoils often used for room-temperature
high-resolution NMR2;3. For given values of PT , Tn and VS , the B1 field generated by a RF
coil is the only factor influencing the SNR and therefore determines the sensitivity of a coil as
expressed in the reciprocity theorem.
The simplest form of a RF coil is a closed loop tuned to the Larmor frequency of the
nuclear spins of interest, ω0. Depending on the position of the sample, the coil can be treated
as a surface coil or a volume coil, the two common geometries of RF coils used in MRI and
MRS (see figure 5.1). The internal volume of a volume coil is usually larger than the sample in
order to entirely excite and probe the sample. When the volume of interest is small compared
to the sample, the large distance between the coil and the volume of interest as well as the
large noise induced by the whole sample and picked up by the coil might strongly reduce the
SNR measured by a volume coil. In addition, high excitation energy is necessary due to the
larger coil size. A surface coil is usually smaller than the sample itself and is placed in contact
or in close proximity with the sample. This configuration leads to larger SNR from the volume
of interest.
Images acquired by volume coils are uniform due to the homogeneous B1 field generated
in the coil center and can offer detailed morphological information over the entire sample
volume. Solenoid coils were the most common used volume coils for NMR research in the early
days. They were used in conjunction with electromagnets because this type of coil is easy to
66

5.1. Introduction
build and can be oriented such as to have a B1 field direction orthogonal to main magnetic field
B0. The most important advantage is that the B1 field generated in the solenoid coil is relatively
strong and homogeneous 4. With the development of high-field superconducting magnets the
solenoid coil was gradually substituted by another type of commonly used volume coil, the
saddle coil. The saddle coil is geometrically open and consists in two sets of solenoids creating
a magnetic field in the same direction as the Helmholtz coil. Saddle coils are widely used in
conjunction with superconducting magnets due to the orthogonality between the B1 field and
the opening of the coil which is convenient for sample loading. But their drawbacks include
the B1 field inhomogeneity generated in the effective volume of the coil and their relatively
poor SNR 4;5. To improve the SNR associated with volume coils, the focus has been placed on
the reduction of the electrical losses, i.e. the reduction of the coil inductance. A good example
is the Alderman-Grant (AG) coil, which is similar to the saddle coil and was introduced in high-
field MR mainly for solving heating problem created by lossy samples during decoupling 6. As
its coil inductance is low, the AG design is usually used for solid-state 1H MRS and limited to
heteronuclear applications. Apart from the solenoid coil, the saddle coil and the AG coil, the
birdcage (BC) coil developed by Hayes et al 7 initially for low-field MRI is another widely used
coil, especially for in vivo MRI. Several theoretical analyses were described elsewhere8–10 to
highlight the different resonance modes and the field homogeneities of the birdcage coil. A
great challenge when building birdcage coil for ultra high magnetic field is the low capacitance
required for generating high-frequency resonances. Transverse electromagnetic (TEM) coils
based on microstrip technology were recently developed to transceive RF signal through
shielded microstrips and showed remarkable results for human applications at high magnetic
field up to 8 T 11–14. Theoretically TEM coils can work at very high frequency, but the complexity
of the data acquisition and image reconstruction procedures as well as the compact resonance
spectrum at high magnetic field limits the applications for small animal MR research. A
common problem of volume coils operating at ultra high magnetic field is the dielectric
resonance effect which leads to an inhomogeneous B1 field in the sample when the sample
size is comparable to the wavelength 15, and the radiation losses caused by the coil conductive
elements when their size is comparable to the wavelength.
Compared with a volume coil, the B1 field of a surface coil is highly inhomogeneous
and decreases dramatically as distance to the sample increases16. This characteristics of the
surface coil leads to a limited view of the sample in the acquired image. But unlike a volume
coil, the sensitivity in the VOI close to a surface coil increases greatly due to a larger B1 field,
larger filling factor and moreover less noise related to the small FOV. Surface coils are mainly
used in localized MRS with small animal. To compensate for B1 inhomogeneity, adiabatic RF
pulses are often used in conjunction with surface coils 17.
Single-loop surface coils can also be arranged with some specific geometry as a coil array,
usually called phase array coil 18–20. To be able to measure the MR signal, all the single-loop
elements are inductively or capacitively decoupled by adjusting the overlapping area among
them. The main advantage of the phase array coil is the large covered VOI of the sample
combined with the high sensitivity associated with the use of surface coils. This property
67

Chapter 5. MR probes for in vivo MRS and MRI at ultra high magnetic field
makes the phase array coil a highly performant receiving coil.
To greatly improve the SNR and reduce power deposition, two linearly polarized coils are
positioned orthogonal to each other and driven by currents of same intensity but with 90 de-
grees phase shift (quadrature-driven mode) 21;22. With this arrangement a SNR enhancement
ofp
2 is theoretically expected. The main issues related to ultra high magnetic field RF coils,
are the low capacitance value needed for tuning the coil and the short wavelength causing
more radiation.
In this chapter, surface and volume coils designed and tested for DNP-enhanced MRS
and MRI experiments, especially the 1H/13C surface coil and the 1H birdcage coil, will be
introduced and discussed.
5.2 Surface coil
As started in the reciprocity theorem23, the sensitivity of a coil is dependent on the
generated B1 field. The larger the B1 field, the more sensitive the coil. Assuming that the
surface coil has a radius of a, the transverse magnetic field B1 can be described according to
the Biot-Savart law as 16;24,
B1 = µ0I
2
a2
(d 2 +a2)3/2, (5.2)
where d is the distance along the coil main axis between the loop center and the plan con-
taining the point of interest inside the sample. This formula shows that first, for a constant
current I , B1 field reduces dramatically as the distance to the coil plane increases; second, B1
field decreases when the loop size a increases; last but not least, with a fixed coil size B1 field
can be enhanced by injecting more currents into the coil, either by using a more powerful RF
amplifier or using superconducting wires to reduce the wire resistance at low temperature and
therefore increase the coil-driving current 25–28. Since the thermal noise is proportional top
T ,
cooling the coil will also reduce the noise. Recently several in vivo MRS and MRI applications
with cryocoils showed that it is possible to obtain a strong B1 field and improve the SNR29;30.
Another aspect influencing the RF coil performance is the noise created by the sample.
The sample resistance in a circular surface coil can be expressed as,
r = g ·ω20 · f (a) ∝ω2
0 ·a3, (5.3)
where g is the sample resistivity, ω0 the operating frequency of the scanner, and f (a) is a
function related to the coil radius a ( f (a) increases as the radius increases)31. When the
operating frequency increases and the coil size becomes larger, the sample resistance picked
up by the surface coil increases and dominates the noise contribution at ultra high magnetic
field. After combining the two equations above it is easy to find out that the coil size and
current in the coil are the two most important factor influencing the coil performance.
68

5.2. Surface coil
Figure 5.2: Schematics of the 13C sur-face coil used for small animal MRSexperiment.
Table 5.1: Summary of surface coils built for in vivo experiments. Unloaded quality factors areshown in parenthesis.
Nuclei I νI [MHz] CT [pF] CM1 [pF] CM2 [pF] Q Pπ/2 [dB]
1H 400.22 - 2 1 49(65) 4613C 100.67 6.8 10 6.8 69(86) 4689Y 19.519 35 10 6.8 169(247) 42
5.2.1 Design of the surface coil
The schematics of a typical surface coil used in this thesis is presented in figure 5.2
where L represents the inductance of the loop, r is the sample loading and the coil intrinsic
resistance, CT and CM the fixed tuning and matching capacitors, C′T and C′
M the variable tuning
and matching capacitors, respectively. To balance the circuit, matching capacitance is divided
into two parts so that electrical impedance is symmetric from both sides 32. To effectively tune
and match the circuit with selected non-magnetic variable capacitors (NMKJ10HV, Voltronics,
USA), the winding of the coil was determined by using CT with a value close to half of the
maximal capacitance of variable tuning capacitors. The capacitor values of all built surface
coils are shown in table 5.1.
Surface coils used in experiments were usually equipped with dual channels including
both 1H and another heteronucleus since 1H was very useful for positioning the sample and
decoupling for the heteronucleus. Depending on the requirements of the experiment, one of
the two channels can be operated in quadrature mode. Here only the surface coil with single
loop 13C and quadrature 1H will be introduced and for other nuclei the coil can be deduced by
analogy.
The circuit structure for three channels(two for 1H and one for 13C) was designed in
EAGLE software(Cadsoft computer GmbH, Germany) and then printed on a PCB board (1.6
mm FR4, 12 µm Cu). A large common ground plate for all three channels was integrated
into the board to reduce the influence of eddy currents. To reduce RF power for all channels,
69

Chapter 5. MR probes for in vivo MRS and MRI at ultra high magnetic field
the loops of surface coil were limited to a diameter of 13 mm and 1H and 13C loops had 1-
and 3-turns winding, respectively. Fixed capacitors CT and CM for all three channels were
determined by tuning and matching the circuits to targeted frequencies: ν(1H) = 400.2MHz
and ν(13C ) = 100.7MHz with a -30dB level. To minimize the coupling of the loops two 1H
loops are inductively decoupled by adjusting overlapping area and the angle formed between
both loops till the coupling decreases at least to -15dB level.
The quality factor of a coil with equivalent parallel RLC circuit is given by,
Q = r
ω0L(5.4)
where r is the coil resistance, ω0 the nuclear frequency and L the loop inductance. Quality
factors (also called Q-values) were measured on the bench with and without loading a saline
phantom (0.5 M NaCl solution prepared in D2O) by dividing the central frequency by the
bandwidth measured with a network analyzer (4096B, Agilent, USA) at -7 dB after tuning and
matching the coil33. The quality factor of the 1H/13C coil with 13 mm diameter is shown in
5.1.
To test the coil performance with adiabatic pulse, a phantom containing 0.2 M [1-13C]
acetate sodium and 0.5 mM Gd 3+ contrast agent was positioned under the coil. After tuning
and matching the coil, the minimum RF power required to reach the plateau in signal intensity
was determined by performing unlocalized single pulse acquisition with 3 ms BIR4.90 pulse.
5.2.2 Results
In table 5.1 all the capacitor values, quality factors measured on the bench and calibrated
RF power by performing localized MRS with hard pulses for different surface coils are shown.
It is known that for a loop with a radius of R, its inductance is proportional to R2 and its
resistance is proportional to R. If the dimensions of the loop are kept unchanged, tuning
to higher frequency leads to a drop of the quality factor. This is evidenced by the Q-value
change measured with the surface coils (shown in table 5.1). Smaller coils (down to 8 mm
diameter) were also developed and tested for in vivo mouse experiments. A 60% improvement
in unloaded Q-value for 1H and 13C (to around 90 and 145 respectively) proved that reducing
the coil size increases the Q-value. In practice, a compromise should be made between a high
Q-value and a large FOV as a function of the experimental requirements. To evaluate the RF
coil sensitivity, unloaded Q-values were also measured on the bench. Through comparing
the loaded and unloaded Q-values, one can also determine if the resistivity of the RF coil was
comparable to the resistivity of the phantom. Therefore, in the practice, a RF coil with a large
loaded to unloaded Q-value ratio is preferred.
70

5.3. Birdcage coil
5.3 Birdcage coil
The birdcage coil was first developed to acquire homogeneous whole body human im-
ages at relatively low magnetic field (1.5 T) several decades ago7. Since then high-pass (HP)
and low-pass (LP) types birdcage coil have already been studied with different theoretical
models8;34;35 and are widely used in MR research. With the recent advent of ultra high mag-
netic field magnets the design of HP and LP birdcage coils have become more technically
challenging since the proton resonance frequency increases and the required capacitor value
decreases. On the other hand, the wavelength of the RF signal becomes shorter in air, and
even shorter in biological tissue due to its high dielectric constant, which leads to a bright
spot in the middle of the image when the sample size is comparable to the wavelength. This
is called the dielectric resonance effect15;36;37. RF radiation losses can also not be neglected
anymore due to a comparable conductor length to a fraction of corresponding wavelength
(normally λ/20)23. Band-pass (BP, also called hybrid) type, a mixture of HP and LP types,
has capacitors implemented both on rungs and end rings which practically breaks down
the conductor length and becomes an alternative choice for UHF applications38;39. In this
study two HP type and one BP type birdcage coils with same dimensions adapted for small
animal MRI at 9.4 T and 14.1 T were simulated, constructed and tested both in vitro and in
vivo. After RF power calibration, B+1 field mapping and SNR measurements were carried out
to characterize the coils. In vivo mouse brain images were acquired using all coils and then
compared.
5.3.1 Resonance modes of the birdcage coil
Birdcage coils are classified into three different types according to the position of the
capacitors and distribution of their resonance mode: HP type when the capacitors are only
on the end rings, LP type when the capacitors are only on the rungs and BP type when the
capacitors are located on both the end rings and the rungs. To analyze the resonance mode of
the birdcage coil with 2n rungs, a classic simple way is to treat the birdcage coil as a RF circuit
containing 2n meshes of lumped elements with a current distribution on the 2n rungs in a
way of cosine function,
Im = I0 cos(θm +φ), (5.5)
where θm is the relative angle position of m-th rung and is given by,
θm = mπ/N . (5.6)
B1 field in the center of the coil can be calculated and given by 40,
B1 = 2µ0I0
πd
lpl 2 +d 2
ζ (5.7)
71

Chapter 5. MR probes for in vivo MRS and MRI at ultra high magnetic field
Figure 5.3: HP resonator of thecoil with tuning and matchingnetwork.
where d and l is the diameter and length of the coil, respectively and ζ is the geometry factor
dependent on the number of the rungs. Note that this calculation is performed without
considering the return current through the rungs. By applying Kirchhoff law with equation 5.5
and RLC tank circuit equation to all 2n cells the resonance frequency of m-th mode is given
by,
(ωHP
m
)2 = 1
4LC sin2(mπ/2n),m ∈ (0,2n −1) (5.8)
for HP birdcage coil and
(ωLP
m
)2 = 4sin2(mπ/2n)
LC,m ∈ (0,2n −1) (5.9)
for LP birdcage coil. A birdcage coil with 2n rungs has n+1 modes in total and the distribution
of the modes is symmetric as birdcage is symmetric. For MR, only one mode of the birdcage
coil (m = 1) is able to generate a homogeneous B1 field. In case of HP coil, since the mode
m = 0 is actually the resonance of the two end rings, the next mode m = 1 has the second
largest resonance frequency and also the most homogeneous field distribution which is useful
for MR imaging. The same argument for LP coil is also that the useful mode is m = 1 and has in
this case the lowest frequency since mode m=0 has a null frequency. The resonance modes of
bandpass birdcage coils are sophisticated in comparison with HP or LP birdcage coils. Tropp
pointed out that the resonance modes of BP are concentrated in a certain frequency range
and the ratio between end ring capacitor and rung capacitor determines the degeneracy of
resonance modes 38.
72

5.3. Birdcage coil
5.3.2 RF design of HP birdcage coil
RF design and simulations of HP birdcage coils for small animal use
The birdcage coil was designed for imaging small animal using hyperpolarized substrates,
especially in brain region, so that a coil size covering a mouse or a small rat brain was chosen.
Note that from the theoretical calculation, the B1 field becomes maximized when the ratio
between length and diameter of the coil isp
2 40, but in practice a shorter birdcage coil (L<OD)
was considered due to the RF power limitation. A HP birdcage coil with a 16 rungs HP resonator
(OD=50 mm, L=32 mm, Drung=2 mm, Dring=3 mm) and a RF shield (OD=94 mm, L=70 mm)
was chosen.
A RF model including the HP birdcage coil shown in figure 5.3 with dimensions men-
tioned above and a phantom (L=80 mm, elec. cond. 0.5 S/m) were built: Quadrature-driven
transceiver mode integrated with one variable tuning capacitor for each channel was selected
to increase the sensitivity of the coil and to tune the coil to proper frequency; A variable bal-
ancing capacitor placed symmetrically between both channels was implemented to minimize
the coupling between both ports; two matching capacitors (one variable and one fixed) for
each channel were directly connected to the end ring and geometrically located opposite to
the tuning capacitor 41. After roughly calculating the tuning capacitor with Birdcage Builder 42,
the RF model was simulated in 3D EM simulation software (CST Microwave Studio, Darmstadt,
Germany) to precisely approach the desired HP mode (m = 1) at two frequencies of interest,
400 MHz and 600 MHz, respectively. Hexahedral mesh with 60 lines per wavelength was set to
simulate the electrical and magnetic field distribution of the RF model with an accuracy of
-40dB in the transient solver. After fine tuning and matching both channels were decoupled at
the desired frequencies by altering the balancing capacitor values. All calculated capacitor
values were kept and used for building the coil prototype.
The conducting structures of the coil prototypes were manufactured from flexible
PCB(0.1 mm FR4, 35 µm Cu) and then fixed on the inner support tube with an outer di-
ameter of 50 mm (PMMA, Angst-Pfister, Switzerland). Ceramic chip capacitors (ATC-100B,
American Technical Ceramics, USA) with the values properly simulated and five variable
capacitors (NMKJ10HV, Voltronics, New York, USA) were used to tune birdcage coils to proper
frequencies. 50Ω coaxial cables (Huber-Suhner, Switzerland) with pre-tuned bazooka baluns 40
were attached to the matching network of the coil to transmit/receive RF signals. RF shield
of the coil was constructed by printing coaxial copper strips with small gap on both sides
to reduce the eddy current43 and then taped inside the outer support tube with an inner
diameter of 94 mm (PMMA, Angst-Pfister, Switzerland). The two support tubes were coaxially
fixed by two plastic cover plates and non-magnetic screws. The whole coil holder including
the animal fixation system is illustrated in figure 5.4.
73

Chapter 5. MR probes for in vivo MRS and MRI at ultra high magnetic field
Figure 5.4: Bird cage coil holder including animal fixation system
Bench tests of HP birdcage coils
To test the bench performance of HP coils, a cylindrical phantom (OD=27 mm, L=100
mm) containing physiological saline solution (Sigma-Aldrich, USA) was fixed in the center
of the coils. A plastic tube (L=250 mm, OD=120 mm) covered by copper sheet was used to
cover the birdcage coil and simulate the magnet bore. Q-values were measured with a network
analyzer (E5071C, Agilent, USA), with and without loading the phantom, by dividing the
central frequency by the bandwidth measured at -7 dB 33 after tuning and matching two coils.
Note that all the Q-values shown in this study were measured on-resonance with a -30 dB
matching level.
Imaging and B+1 field mapping
All necessary calibrations and images were acquired on in-house 9.4 T and 14.1 T imagers
(Agilent, USA) with 31 cm magnet bore. RF power calibration was carried out using STEAM
sequence 44 with 2 ms Gaussian pulses. The maximum water peak intensity implied 90 power,
Pπ/2.
SNRs of the phantom images were determined by comparing the average intensity of
multi-slice gradient echo (GRE) images with 90 flip angle in 5 different regions within a circle
of 5 mm diameter with the noise acquired in the same areas after switching off the RF power
amplifier. In vivo SNR maps at both field strengths were generated by using 60 GRE images
through comparing the signal of each pixel to the standard deviation of noise in the artifact
free corner region. Both SNR maps were rescaled by the maximum SNR value calculated. To
maintain the thermal noise for both field strengths at the same level, spectral bandwidth of 69
kHz was set for both images.
74

5.3. Birdcage coil
To generate B+1 field maps, the double angle method46;47 was used. As the MR signal
generated after a RF pulse with a flip angle θ is proportional to sinθ, the flip angle (FA) θ can
be calculated through comparing the signals acquired using two different FAs, θ and 2θ, and
is given by,
θ = arccos(I2
2I1) (5.10)
where I1 and I2 represent the signal intensity from pixels at the same position in both images.
Images for calculating B+1 field maps were acquired by taking axial gradient echo (GRE) images
at the imager isocenter with flip angle of 60 and 120 (imaging parameters shown in table 5.2).
A long enough repetition time of 20s was set to recover the proton magnetization. The
region of interest (ROI) in both phantom and in vivo measurements were shimmed using
the fastestmap method45. Both images were post-processed using a MATLAB script which
calculated the image intensity ratio from both acquisitions performed with different FAs and
further determined the ratio pixel by pixel. An image mask was created by zero filling all the
pixels with intensity less than 10% of the maximal pixel intensity and used to filter out noise
on the B+1 distribution map.
5.3.3 Results and Discussions
RF simulation and bench tests
For both HP coils the capacitor values used in practice (Cring = 20.6 pF and 8.2 pF for
9.4T and 14.1T respectively) fit to the simulated capacitor values (Cring = 20.5 pF and 8.5 pF
for 9.4 T and 14.1 T respectively) very well. The small error comes from the stray capacitance
caused by the matching network which was simulated separately in the CST Design Studio and
not accounted for in the CST Microwave Studio simulation. This also explains the different
matching capacitor values used in practice. In figure 5.6, RF simulation of the B+1 field in
cylindrical phantom positioned in the center of both HP coils are shown. It is apparent that
the higher the frequency, the less homogeneous the B+1 field.
Table 5.3 shows the measured Q-values of the built HP coils and their relative sensitivities.
The low relative sensitivity in small animals was related to the small size of the brain causing a
relatively low loading factor. Assuming the mouse brain has a cylindrical form with a diameter
of 15 mm, the filling factor is a only around (12/50)2 = 9%.
Table 5.2: MRI sequence parameters used for coil performance tests
TR/TE [ms] FOV [mm2] Resolutions
B+1 mapping, phantom 20,000/2.83 40×40 128×128B+
1 mapping, in vivo 20,000/3.31 20×20 128×128
75

Chapter 5. MR probes for in vivo MRS and MRI at ultra high magnetic field
The coils were driven in quadrature mode and good isolation between both channels
(around -18 dB) for both loaded HP coils was determined through bench measurements.
SNR and B+1 field
The RF power calibration normalized to 2 ms 90 Gaussian pulse and the measured FAs
are shown in table 5.3. The reason for requiring more power with the HP coil working at 14.1
T is the larger B+1 needed to reach the desired FA at higher magnetic field. This point can be
demonstrated by looking at the difference of 30% in B+1 field intensity calculated in the RF
simulations of both coils.
Since the SNR values depend not only on the field strength but also on the thermal noise
created by the object 4, same acquisition bandwidth and slice thickness were used to maintain
the thermal noise at the same level for different images. The SNR values measured in the
phantom by the 14.1 T HP coil was 1.7 times higher than the one measured by the 9.4 T HP coil
(shown in table 5.3), which is slightly higher than what is expected and is mainly due to the
B+1 field inhomogeneity. It should be mentioned that the coaxial cables used to connect the
coil to the preamplifier, which is normally located on the magnet leg and 3-4 m away from the
coil, led to a signal loss of 2-3 dB (according to the coaxial cable specification sheet). Similar
results were obtained in in vivo GRE imaging and shown in the SNR maps (see figure 5.5). A
50% higher intensity was observed in the whole brain region.
B+1 field mapping of both HP coils in axial planes was performed with a saline phantom
and in vivo in mouse brains both at 9.4 T and at 14.1 T. Similar to the simulated results, the
B+1 field measured in the phantom was quite homogeneous in the HP coil at 9.4 T, but a hot
spot was observed for the HP coil at 14.1 T and only the coil center had the correct FA. Taking
the relative electric permittivity ε=80 and conductivity σ= 0.5 S/m from the biological tissue
into account, the wavelength in the tissue is reduced to 84 mm at 9.4 T and 56 mm at 14.1
T, respectively. This implies that the hot spot was related to the dielectric resonance effect.
Differences were also observed in the in vivo B+1 field maps. At 9.4 T most part of the mouse
brain was uniformly excited, but at 14.1 T only the central part had the nominal FA and the
rest of the brain had a smaller FA.
Table 5.3: Summary of bench measurements and in vitro calibration of unloaded/loadedbirdcage coils
Qunloaded Qloaded Relative sensitivity Pπ/2[dB] FA [] SNR
9.4T, HP 300 220 0.51 34 60±1 1305±3914.1T,HP 200 176 0.35 42 51±6 2207±25214.1T,BP 364 242 0.58 44 55±5 2369±232
76

5.3. Birdcage coil
Figure 5.5: in vivo GRE images acquired by 9.4 T (a) and 14.1 T (b) HP birdcage coils in theisocenter with same image scale and calculated SNR maps (c) and (d), respectively.
5.3.4 Preparation of BP birdcage coil and preliminary test results
A bandpass (BP) birdcage coil with the same dimensions as the one used in the HP model
was simulated and built in the same way as described above for the HP type. Due to the
presence of the capacitors on the rungs in the BP model, an additional gap (w=2 mm) was
added in the middle of the rungs. It has been reported previously that the BP mode distribution
is dependent on the ratio Cr ung /Cr i ng : when Cr ung /Cr i ng À 1 the BP coil behaves as a HP
coil; when Cr ung /Cr i ng ¿ 1 the BP coil tends to be a LP coil38. For the intermediate case
between these two extreme cases, all the modes will be compressed in the spectrum, which
makes the mode differentiation difficult. Series of simulations with different values of Cr ung
were performed to understand the relationship between the frequency of the mode and the
Cr ung /Cr i ng ratio. Figure 5.7 shows the BP mode degeneracy when Cr ung /Cr i ng is modified.
In practice Cr ung =2 pF was chosen for building the BP coil so that the capacitor value on the
end rings could be within the range of available values.
In figure 5.8, in vitro B+1 field maps from HP and BP were compared and both coils
showed typical bright spots in the center either in axial or in coronal direction. The main
reasons behind the fact that the BP coil did not exhibit a large difference compared to the
HP coil, are linked to the length of the coil and the sample size. As mentioned before, the
constructed coils are designed for brain imaging and a normal mouse brain has a volume of
5×7×7 mm3. The short distance between both end rings makes stronger field interference
and, as a consequence, the shape of the B+1 field in both HP and BP was spherical. Other HP
and BP birdcage models with long rungs were simulated and results (shown in figure 5.9)
77

Chapter 5. MR probes for in vivo MRS and MRI at ultra high magnetic field
Figure 5.6: HP coil performance comparison (Results acquired at 9.4 T is shown in first rowand at 14.1 T in second row): a) RF simulation (scaled from 0 to 20 A/m); b) B+
1 mappingwith a saline phantom using double angle method; c) in vivo B1 mapping of mouse brains.Imaging parameters are given in table 5.2. A homogeneous B+
1 field was measured at 9.4 T, butat 14.1 T, due to the dielectric resonance of the phantom, only the central part can be taken ashomogeneous.
Figure 5.7: RF simulations about resonance frequency difference between required mode(m = 1) and other two close mode (m = 2,3). BP mode m = 1 of all the models was tuned,matched to 600 MHz
78

5.3. Birdcage coil
Figure 5.8: Comparison between HP (left) and BP (right) coil at 14.1T: B+1 mapping showed a
better B+1 field for BP coil compared to the HP coil in spite of the bright spot acquired in the
isocenter and caused by the dielectric resonance effect. This result fits to the RF simulation.
Figure 5.9: RF simulation of a BP type birdcage coil in axial (left) or coronal (right) direction at14.1T with longer rung (L=70 mm): B+
1 mapping showed a more homogeneous B+1 field for BP
coil along coronal direction.
79

Chapter 5. MR probes for in vivo MRS and MRI at ultra high magnetic field
indicated improved B+1 field homogeneity than with the short ones (L=30 mm), but at the
cost of lower B+1 field intensity. The dielectric resonance effect still dominated in the image
acquired with the BP coil at 14.1 T, with a slightly better B+1 field homogeneity at the isocenter.
Overall, the improved B+1 field generated by the BP coil indicates that, although at ultra high
magnetic field the radiation losses contribute to the RF losses, the sample losses (dielectric
resonance effect) are still the dominant RF losses.
5.3.5 Conclusions
In this study we demonstrated that it was possible to build transceiver birdcage coils
suitable for small animal brain MRI at both 9.4 T and 14.1 T. The RF simulations proved to
be a powerful tool for selecting the appropriate resonance mode and can be used for further
developments of the birdcage coils. The B+1 homogeneity of the HP coil used at 9.4 T was
better than the one of the HP coil used at 14.1 T due to the strong dielectric resonance effect
in high magnetic field. This effect remained with the 14.1 T BP coil, but the field homogeneity
and image SNR with the BP coil became slightly better than those obtained with the HP type
as the RF radiation was minimized by more segmentation on the rungs. With the increase of
the physical size and the working frequency of the coil, BP birdcage coil is an alternative for
ultra high magnetic field small animal imaging, but the combination of the capacitors used on
both end rings and rungs should be carefully selected to avoid mode degeneracy. In spite of
the relative low sensitivity, birdcage coils are interesting for small animal imaging at ultra high
magnetic field. Based on this study, birdcage coil can also be designed for imaging insensitive13C nuclei, the population of which can be highly enhanced through dissolution DNP.
References
[1] F. D. Doty, G. Entzminger, J. Kulkarni, K. Pamarthy, and J. P. Staab. Radio frequency coil technology forsmall-animal mri. Nmr in Biomedicine, 20(3):304–325, 2007.
[2] P. Styles, N. F. Soffe, C. A. Scott, D. A. Cragg, F. Row, D. J. White, and P. C. J. White. A high-resolution nmrprobe in which the coil and preamplifier are cooled with liquid-helium. Journal of Magnetic Resonance,60(3):397–404, 1984.
[3] M. Jeroschherold and R. K. Kirschman. Potential benefits of a cryogenically cooled nmr probe for room-temperature samples. Journal of Magnetic Resonance, 85(1):141–146, 1989.
[4] D. I. Hoult. The nmr receiver: A description and analysis of design. Progress in Nuclear Magnetic ResonanceSpectroscopy, 12(1):41 – 77, 1978.
[5] D. M. Ginsberg and M. J. Melchner. Optimum geometry of saddle shaped coils for generating a uniformmagnetic field. Review of Scientific Instruments, 41(1):122–123, 1970.
[6] D. W. Alderman and D. M. Grant. An efficient decoupler coil design which reduces heating in conductivesamples in superconducting spectrometers. Journal of Magnetic Resonance, 36(3):447–451, 1979.
80
References
[7] C. E. Hayes, W. A. Edelstein, J. F. Schenck, O. M. Mueller, and M. Eash. An efficient, highly homogeneousradiofrequency coil for whole-body nmr imaging at 1.5-t. Journal of Magnetic Resonance, 63(3):622–628,1985.
[8] J. Tropp. The theory of the bird-cage resonator. Journal of Magnetic Resonance, 82(1):51–62, 1989.
[9] M. C. Leifer. Resonant modes of the birdcage coil. Journal of Magnetic Resonance, 124(1):51–60, 1997.
[10] J. Tropp. Dissipation, resistance, and rational impedance matching for tem and birdcage resonators. Conceptsin Magnetic Resonance, 15(2):177–188, 2002.
[11] J. T. Vaughan, H. P. Hetherington, J. O. Otu, J. W. Pan, and G. M. Pohost. High frequency volume coils forclinical nmr imaging and spectroscopy. Magn Reson Med, 32(2):206–18, 1994.
[12] J. T. Vaughan, M. Garwood, C. M. Collins, W. Liu, L. DelaBarre, G. Adriany, P. Andersen, H. Merkle, R. Goebel,M. B. Smith, and K. Ugurbil. 7t vs. 4t: Rf power, homogeneity, and signal-to-noise comparison in head images.Magn Reson Med, 46(1):24–30, 2001.
[13] N. Zhang, M. Roos, J. Vaughan, and T. Budinger. Head coil b1 field inhomogeneity and snr performance at8-10t. Proceedings of the International Society for Magnetic Resonance in Medicine, 1996(S1):252, 1996.
[14] T. Vaughan, L. DelaBarre, C. Snyder, J. Tian, C. Akgun, D. Shrivastava, W. Liu, C. Olson, G. Adriany, J. Strupp,P. Andersen, A. Gopinath, P. F. van de Moortele, M. Garwood, and K. Ugurbil. 9.4t human mri: preliminaryresults. Magn Reson Med, 56(6):1274–82, 2006.
[15] J. Tropp. Image brightening in samples of high dielectric constant. Journal of Magnetic Resonance, 167(1):12–24, 2004.
[16] J. J. H. Ackerman, T. H. Grove, G. G. Wong, D. G. Gadian, and G. K. Radda. Mapping of metabolites in wholeanimals by p-31 nmr using surface coils. Nature, 283(5743):167–170, 1980.
[17] R. A. Degraaf, Y. Luo, M. Terpstra, H. Merkle, and M. Garwood. A new localization method using an adiabaticpulse, bir-4. Journal of Magnetic Resonance Series B, 106(3):245–252, 1995.
[18] P. B. Roemer, W. A. Edelstein, C. E. Hayes, S. P. Souza, and O. M. Mueller. The nmr phased array. Magn ResonMed, 16(2):192–225, 1990.
[19] D. I. Hoult, G. Kolansky, D. Kripiakevich, and S. B. King. The nmr multi-transmit phased array: a cartesianfeedback approach. Journal of Magnetic Resonance, 171(1):64–70, 2004.
[20] X. Zhang and A. Webb. Design of a capacitively decoupled transmit/receive nmr phased array for high fieldmicroscopy at 14.1t. Journal of Magnetic Resonance, 170(1):149–55, 2004.
[21] C. N. Chen, D. I. Hoult, and V. J. Sank. Quadrature detection coils - a further square-root2 improvement insensitivity. Journal of Magnetic Resonance, 54(2):324–327, 1983.
[22] J. S. Hyde, A. Jesmanowicz, T. M. Grist, W. Froncisz, and J. B. Kneeland. Quadrature detection surface coil.Magn Reson Med, 4(2):179–84, 1987.
[23] C. N. Chen and D. I. Hoult. Biomedical magnetic resonance technology. Hilger, 1989.
[24] U. S. Inan and A. S. Inan. Engineering electromagnetics. Addison-Wesley, Menlo Park, Calif., 1999.
[25] A. S. Hall, N. M. Alford, T. W. Button, D. J. Gilderdale, K. A. Gehring, and I. R. Young. Use of high-temperature su-perconductor in a receiver coil for magnetic-resonance-imaging. Magnetic Resonance in Medicine, 20(2):340–343, 1991.
[26] R. D. Black, T. A. Early, P. B. Roemer, O. M. Mueller, A. Mogrocampero, L. G. Turner, and G. A. Johnson. A high-temperature superconducting receiver for nuclear-magnetic-resonance microscopy. Science, 259(5096):793–795, 1993.
81

Chapter 5. MR probes for in vivo MRS and MRI at ultra high magnetic field
[27] R. D. Black, T. A. Early, and G. A. Johnson. Performance of a high-temperature superconducting resonator forhigh-field imaging. Journal of Magnetic Resonance Series A, 113(1):74–80, 1995.
[28] J. C. Ginefri, L. Darrasse, and P. Crozat. High-temperature superconducting surface coil for in vivo microimag-ing of the human skin. Magnetic Resonance in Medicine, 45(3):376–382, 2001.
[29] A. C. Wright, H. K. Song, and F. W. Wehrli. In vivo mr micro imaging with conventional radiofrequency coilscooled to 77 degrees k. Magnetic Resonance in Medicine, 43(2):163–169, 2000.
[30] D. Ratering, C. Baltes, J. Nordmeyer-Massner, D. Marek, and M. Rudin. Performance of a 200-mhz cryogenicrf probe designed for mri and mrs of the murine brain. Magnetic Resonance in Medicine, 59(6):1440–1447,2008.
[31] M. D. Harpen. Sample noise with circular surface coils. Medical Physics, 14(4):616–8, 1987.
[32] Joseph Murphy-Boesch and Alan P. Koretsky. An in vivo nmr probe circuit for improved sensitivity. Journal ofMagnetic Resonance (1969), 54(3):526–532, 1983.
[33] A. Haase, F. Odoj, M. Von Kienlin, J. Warnking, F. Fidler, A. Weisser, M. Nittka, E. Rommel, T. Lanz, B. Kalusche,and M. Griswold. Nmr probeheads for in vivo applications. Concepts in Magnetic Resonance, 12(6):361–388,2000.
[34] R. J. Pascone, B. J. Garcia, T. M. Fitzgerald, T. Vullo, R. Zipagan, and P. T. Cahill. Generalized electrical analysisof low-pass and high-pass birdcage resonators. Magn Reson Imaging, 9(3):395–408, 1991.
[35] T. S. Ibrahim, R. Lee, B. A. Baertlein, and P. M. L. Robitaille. B-1 field homogeneity and sar calculations for thebirdcage coil. Physics in Medicine and Biology, 46(2):609–619, 2001.
[36] P. Roschmann. Radiofrequency penetration and absorption in the human-body - limitations to high-fieldwhole-body nuclear-magnetic-resonance imaging. Medical Physics, 14(6):922–931, 1987.
[37] J. W. Carlson. Radiofrequency field propagation in conductive nmr samples. Journal of Magnetic Resonance,78(3):563–573, 1988.
[38] J. Tropp. The hybrid bird cage resonator. Proceedings of the International Society for Magnetic Resonance inMedicine, 1992(Supplement S2):4009, 1992.
[39] P. Pimmel and A. Briguet. A hybrid bird cage resonator for sodium observation at 4.7-t. Magnetic Resonancein Medicine, 24(1):158–162, 1992.
[40] J. Mispelter, M. Lupu, and A. Briguet. NMR probeheads for biophysical and biomedical experiments: theoreticalprinciples & practical guidelines. Imperial College Press, London, 2006.
[41] J. Murphy-Boesch. Double-tuned birdcage coils: Construction and tuning. In Encyclopedia of MagneticResonance. John Wiley & Sons, Ltd, 2007.
[42] C. L. Chin, C. M. Collins, S. Z. Li, B. J. Dardzinski, and M. B. Smith. Birdcagebuilder: Design of specified-geometry birdcage coils with desired current pattern and resonant frequency. Concepts in Magnetic Resonance,15(2):156–163, 2002.
[43] G. X. Shen. Double-sided stripline rf shield. In Proceedings of the International Society for Magnetic Resonancein Medicine, volume 1992, page 4048, 1992.
[44] J. Frahm, K. D. Merboldt, and W. Hanicke. Localized proton spectroscopy using stimulated echoes. Journal ofMagnetic Resonance, 72(3):502–508, 1987.
[45] R. Gruetter. Automatic, localized in vivo adjustment of all first- and second-order shim coils. MagneticResonance in Medicine, 29(6):804–11, 1993.
[46] R. Stollberger, P. Wach, G. McKinnon, E. Justich, and F. Ebner. Rf-field mapping in vivo. In Proceedings of theInternational Society for Magnetic Resonance in Medicine, volume 1988, page 106, San Francisco, 1988.
[47] E. K. Insko and L. Bolinger. B1 mapping. In Proceedings of the International Society for Magnetic Resonance inMedicine, volume 1992, page 4302, 1992.
82

Conclusions and future perspectives
Methods to minimize the polarization losses and related hardware
designs
13C labeled sodium acetate was successfully polarized at 5 T and after dissolution a
liquid-state polarization level of 13% was measured just before the injection for in vivo studies
in rodents. By using a home-built RF switching network the in vitro polarization determination
and in vivo experiment can be successively carried out without delaying the in vivo injection.
The solenoid coil around the separator/infusion pump tuned to 13C frequencies not only
facilitates the longitudinal relaxation time measurements inside the magnet bore, but it
also extends the function of the separator/infusion pump. This setup can of course also
be tuned to other nuclear resonance frequencies, e.g. 15N and 89Y so that the longitudinal
relaxation time determination and a liquid-state polarization transfer from highly polarized
nuclear spins to low-γ nuclear spins can be realized in the future. To extend the longitudinal
relaxation time of 13C spins, we used sodium ascorbate to scavenge nitroxyl radicals, but a
decrease in T1 with increasing sodium ascorbate concentration indicated that the protons
attached to the ascorbate molecules influence the T1 of 13C spins. After having partially
deuterated sodium ascorbate, the observed dramatic T1 extension from 35 s to 73 s shows that
deuterated ascorbate can help extending the time measurement window in hyperpolarized
NMR experiments.
Radical-free hyperpolarized alcohol via SL-hydrogel
In the pilot study performed with SL-hydrogel, we managed to get a 13C polarization of
0.05% in natural 13C abundance deuterated tert-butanol. The most important result was that
the 13C signal decay measured in the hyperpolarized sample following dissolution was as long
as the longitudinal relaxation time measured in degassed pure tert-butanol at thermal equilib-
rium in a high-resolution NMR spectrometer. Similar results were obtained with deuterated
ethanol. These results demonstrated that the hyperpolarized solution after dissolution of the
solid sample polarized via SL-hydrogel was radical free.
Due to the hydrophilic characteristics of the hydrogel only water or alcohols which
83

Conclusions and future perspectives
are liquid at ambient temperature can be hyperpolarized using this method. Tert-butanol
was considered as an interesting candidate due to the possible application for perfusion
imaging. To improve the signal enhancement of tert-butanol for in vivo applications, 13C
spin concentration can be increased by using 13C labeled tert-butanol. It has indeed already
been reported that a higher spin concentration in the solid sample leads to improved 13C spin
diffusion and therefore to higher 13C polarization. It would also be necessary to increase the
radical labeling concentration in the hydrogel.
DNP of long-T1 nuclear spins
For in vivo MRS study of choline brain uptake, a liquid-state 15N polarization level of
5% was obtained after 4h of polarization with the same microwave settings as for 13C labeled
substrates. The long polarization time is consistent with the fact that 15N has a very low-γ. We
expect that polarization transfer methods will play an important role in future improvement
of hyperpolarized 15N metabolic studies. A 1H−15 N double tuned coil should be considered
for solid-state cross polarization to reduce the polarization time of 15N spins and increase its
polarization level. In addition, in situ 15N−1 H polarization transfer could enhance the in vivo1H MRS signal of choline metabolites while keeping the long time window offered by the long
T1 of 15N.
Due to the low solubility of Y[DOTA]−, solid-state calibrations of DNP-enhanced 89Y
was carried out with concentrated water soluble yttrium chloride samples. After 7 hours of
solid-state polarization, hyperpolarized 89Y signals from Y[DOTA]− complexes polarized using
TEMPO radicals were readily detected. As mentioned before, from the general observation
that all nuclear spins eventually reach the same spin temperature, we could have expected
a 89Y polarization of 1.3%, which is almost four times higher than what we obtained in our
in vitro tests. To improve the 89Y DNP, a big obstacle lies in the low 89Y concentration in the
Y[DOTA]− sample (0.18 M in our case), which is much lower than the 13C concentration in
typical samples used for hyperpolarized 13C NMR experiments. A possible was to improve the89Y polarization would be to transfer the polarization from highly polarizable nuclear spins
such as 1H or 13C to 89Y spins, either in the solid-state or in the liquid-state.
Birdcage coil for in vivo MRI
Birdcage coils are very useful to homogeneously excite the spins in MRI experiments, but
their intrinsic low sensitivity due to the large volume and associated low filling factor make
them unpopular for in vivo MRS. Thanks to the tremendous SNR increase obtained using
dissolution DNP, the sensitivity of NMR experiments is increased but complex fast sequences
have to be developed and although surface coils are still preferred for detection, birdcage coils
are a good choice for spin excitation. In this thesis two high-pass birdcage coils working at 9.4
T and 14.1 T and one bandpass birdcage coil working at 14.1 T were designed, simulated and
84

Conclusions and future perspectives
built for small animal 1H imaging. The calculated B+1 field for the 9.4 T high-pass coil was much
more homogeneous than that for the 14.1T high-pass coil. This reflects the strongly dominant
dielectric resonance effect at higher magnetic field. Meanwhile the relative low sensitivity of
all three coils (∼0.5) shown in bench tests and the simulated results of the high-pass coil with
long rungs (80 mm) show that the sample losses and radiation losses are not the dominant
losses for the high field birdcage coils. After considering all these issues, bandpass coil built
for 14.1 T showed a slightly improved B+1 field due to the possible reduced radiation losses.
The birdcages were originally designed for in vivo DNP-enhanced MRS/MRI experiments.
Due time constraints and the lack of a proper setup to hold the animals inside the coil, we
did not manage to perform any DNP experiment using these coils. We however expect that
there should not be any major problems to run such experiments using hyperpolarized 1H
(in partially deuterated water) in the future after having properly addressed the problem
linked to animal positioning and defined the associated injection protocol for hyperpolarized
substrates. Another interesting improvement, already highlighted in chapter 5, could be to
build and test a birdcage coil with longer rungs for improved B+1 field homogeneity in the
coronal direction (this was found through simulations). A further development would be
the implementation of a 13C birdcage coil for hyperpolarized NMR experiments since the
most promising applications are in vivo metabolic studies using hyperpolarized 13C-labeled
substrates.
85


A DNP performance of biradicals
Solutions for solid-state samples were composed of 1-13C acetate dissolved in a mixture
of d6-ethanol and D2O (1:2 v/v) containing biradicals provided by Dr. Oliver Quari and Prof.
Paul Tordo from the Universités d’Aix-Marseille. Since the solubility in D2O of some of the
biradicals tested was poor, the mixing ratio of the solvent between d6-ethanol and D2O was
increased to 2:1 for most samples. Two test samples (sample B and C) containing two different
nitroxyl biradicals, bTbK and dCdO (chemical structure is shown in the figure A.1), were
prepared as described above. All DNP experiments on all samples were performed at 140
GHz using 40 mW power and the NMR signals were acquired with the detection parameters
described in 2.1. The enhancement factor was determined by calculating the ratio between
polarized signal at 1K and thermal equilibrium signal at 3.2K. The results are summarized
in table A.1 along with the results obtained on a reference sample (sample A) containing the
mononitroxyl TEMPO. Note that TEMPO can lead to even higher enhancement if the ethanol
to water ratio is further reduced, in agreement with a previous study. The larger the biradical
concentration is, the faster the polarization builds up. As shown in a comparable study
related to tritylbiradicals, TEMPO-based biradicals are not more efficient than the TEMPO
monoradicals in DNP experiments performed at liquid helium temperture.
(a) dCdO (b) bTbK
Figure A.1: Molecular structure of the two biradicals used in the present study: dCdO andbTbk.
87

Appendix A. DNP performance of biradicals
Table A.1: Property and DNP results of each measured samples: A: 2M 1-13C NaAc + TEMPO +ethanol/D2O (2:1 v/v); B: 2M 1-13C NaAc + dCdO + ethanol/D2O (2:1 v/v); C: 2M 1-13C NaAc +bTbK + ethanol/D2O (2:1 v/v)
Sample Radical conc. [mM] e-e distance [A] Buildup time constant [s] ε T1
A 30 - 2252±64 75 18164±5B 30 8.23 1625±59 24 10498±802B 15 8.23 9126±1433 - -C 30 12.95 1485±78 20 4798±452C 15 12.95 1733±135 16 6000C 7.5 12.95 3064±237 10 9000
88

B X-ray induced radicals
Radiation-induced radicals were introduced in chapter 2. To test the creation efficiency of
radiation-induced radicals in biologically compatible samples, a new radiation experimental
setup based on x-ray source with maximal intensity of 40 kV was built to irradiate frozen
sample. Those samples were prepared in bead form and contained 3M sodium acetate
dissolved in a solvent mixture of ethanol and distilled water. For each experiment, 20-25
beads were collected and placed on a custom-designed sample cup made of copper (3×3cm2)
with continuously cooling of liquid nitrogen (see Figure B.1(a)). The distance between the
sample cup and the source was kept constant (3 cm) during the entire irradiation process and
to avoid x-ray absorption no liquid nitrogen was kept inside the sample cup. To check that
the temperature of the sample stayed around 100K, a calibrated temperature probe (thermal
couple) was fixed on the copper sample cup.
Samples with different ethanol/D2O ratios were irradiated several hours and afterwards
9 beads were quickly loaded into a pre-cooled 5mm ESR tube for the ESR measurements.
The main reason of not preparing 100% EtOH beads and with small fraction of D2O instead
Figure B.1: (a) X-ray irradiation setup;(b) Luminescence of the EtOH sample doping with LiCl
89

Appendix B. X-ray induced radicals
Table B.1: Summary of parameters used for x-ray irradiated samples
No. Sample Time [h] Ratio(D2O/EtOH) Radical density[·1017spi ns/cm3]
1 TEMPO (liq.) - 2:1 -2 Ethanol (liq.) - 2:1 -3 TEMPO (beads) - 2:1 1804 Ethanol (beads) 5h 2:1 1.824 Ethanol (beads) 10h 2:1 2.174 Ethanol (beads) 2nd day 2:1 1.905 Ethanol (beads) 4h 1:2 4.365 Ethanol (beads) 6h 1:2 3.45
of the H2O is due to the low melting temperature of EtOH and the strong x-ray attenuation
of protonated water. Immediately after irradiation, all samples had turned light purple(see
Figure B.1(b)) and the color bleached after 5-10 minutes. ESR spectra were acquired at 100 K on
a commercial X-band spectrometer (Bruker). The radical concentration created was obtained
by comparing the peak integral between the sample and a reference containing 30mM TEMPO
and weighing the beads to normalize the radical density. The radical concentration for all
samples is shown in the Table B.1. We concluded that after an average irradiation time of about
4 h, the maximum achievable radical concentration was reached and a higher EtOH to water
ratio led to increased radical concentration. The biggest radical concentration created in this
type of sample was around 4.36 ·1017/cm3. After having stored the samples in liquid nitrogen
for about 12 h, no significant radical recombination was observed. To demonstrate that the
x-ray induced radicals will be eliminated after dissolution, beads were melted in the ESR tube
and room-temperature ESR measurements (liquid state) were performed. The results showed
that in all cases there was no radical left.
90

C Optimization of dissolution parame-ters
The separator/infusion pump was designed to achieve automatic quick transfer of hyper-
polarized liquids from the polarizer to the scanner, and precise injection of the liquids to the
animals used for in vivo MR experiments in a relatively short time period without the influence
of personnels. The critical part which needs to be controlled is actually the minimized trans-
fer time and reproducible injection volume (or concentration). To achieve this goal several
parameters can be optimized. The schematics of a typical dissolution procedure is shown in
figure C.1 and detailed explanation of the whole protocol has been introduced in chapter 2. To
reduce the dimension of the optimization processes, the dissolution time Tdi ssoluti on , delay
time Tdel ay and injection time Ti n j ect i on were fixed with previous experience to 0.8s, 1s and
8.6s, respectively. This means the optimization processes were carried out in the section of
sample transfer by altering the transferring pressure Ppush and transferring time Tpush to get
maximum volume of liquids. The optimization was performed by using similar samples and
exact same experimental condition as for in vivo experiments with various combination of
Ppush ranged from 4 to 6 bar and Tpush from 1.9s up to 3.6s. The results in figure C.1(right)
showed, first, a maximum volume of 2.45mL hyperpolarized liquids could be gathered in the
infusion pump; second, with the increase of the transferring pressure up to 6bar the transfer-
ring time was able to be reduced to 1.9s, but the dynamic range for obtaining a stable liquid
volume was strongly reduced due to the turbulent flow created by the high pressure helium
gas through the long thin plastic tube used as transfer line. As fast transfer time and stable
liquid volume are the two vital requirements for the in vivo experiments, the combination of
transferring pressure of 6bar and transferring time of 2s has been chosen to be part of standard
parameters in the dissolution protocol.
91

Appendix C. Optimization of dissolution parameters
Figure C.1: Dissolution parameter optimization. Left side: Schematics of dissolution proce-dures including dissolution(1), transfer(2), settling(3) and infusion(4); Right side: Test resultsof transferred liquid volume measured inside the infusion pump by altering pressure andduration of the helium gas.
92
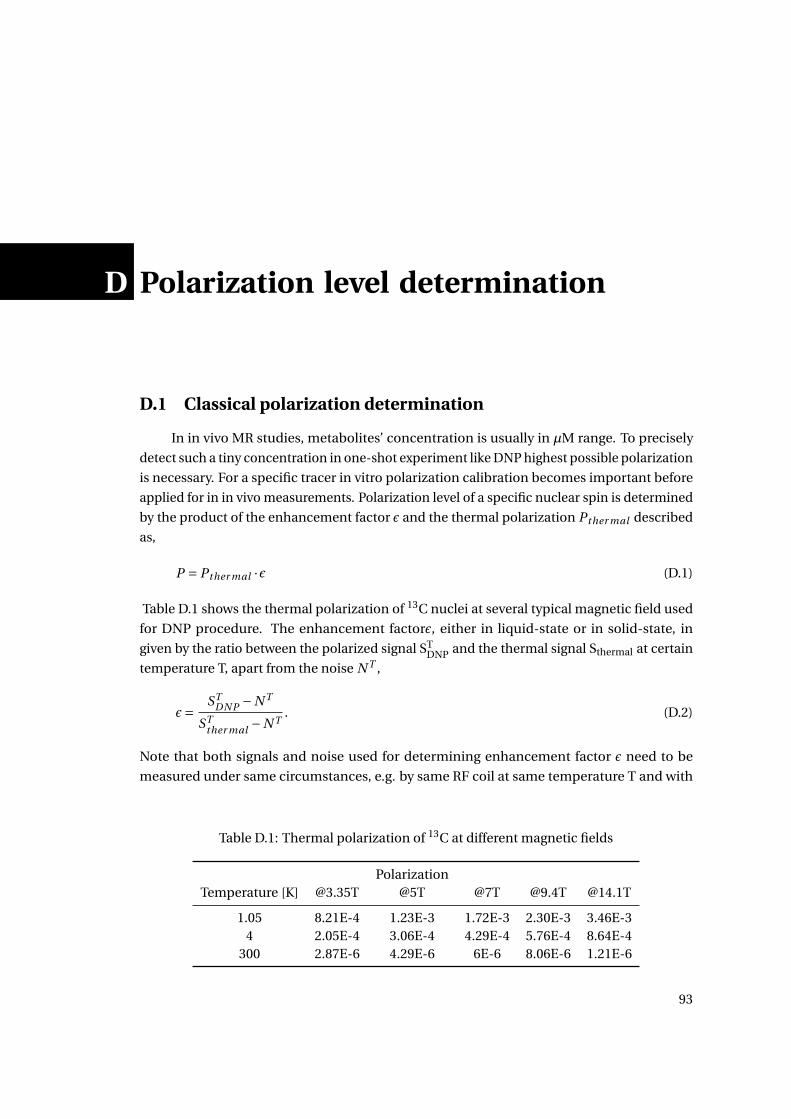
D Polarization level determination
D.1 Classical polarization determination
In in vivo MR studies, metabolites’ concentration is usually in µM range. To precisely
detect such a tiny concentration in one-shot experiment like DNP highest possible polarization
is necessary. For a specific tracer in vitro polarization calibration becomes important before
applied for in in vivo measurements. Polarization level of a specific nuclear spin is determined
by the product of the enhancement factor ε and the thermal polarization Pther mal described
as,
P = Pther mal ·ε (D.1)
Table D.1 shows the thermal polarization of 13C nuclei at several typical magnetic field used
for DNP procedure. The enhancement factorε, either in liquid-state or in solid-state, in
given by the ratio between the polarized signal STDNP and the thermal signal Sthermal at certain
temperature T, apart from the noise N T ,
ε= STDN P −N T
STther mal −N T
. (D.2)
Note that both signals and noise used for determining enhancement factor ε need to be
measured under same circumstances, e.g. by same RF coil at same temperature T and with
Table D.1: Thermal polarization of 13C at different magnetic fields
PolarizationTemperature [K] @3.35T @5T @7T @9.4T @14.1T
1.05 8.21E-4 1.23E-3 1.72E-3 2.30E-3 3.46E-34 2.05E-4 3.06E-4 4.29E-4 5.76E-4 8.64E-4
300 2.87E-6 4.29E-6 6E-6 8.06E-6 1.21E-6
93

Appendix D. Polarization level determination
Figure D.1: Description of the polarization build-up within time interval of τs from Pn−1 to Pn .The measurable parts of the polarization are its projection on XY plane after RF pulse with aflip angle of θ.
the same RF pulse.
D.2 Polarization build-up simulation
In this paragraph we are going to discuss the solid-state polarization build-up process
under the influence of different RF pulse parameters which is shown figure D.1. The solid-state
polarization signal Pn at the time point t = n ·τ monitored by using single pulse with a fixed
flip angle θ is given by,
Pn = (Pmax −Pn−1 cosθ) · (1−e−τ/Tbui ld−up )+Pn−1 ·cosθ, (D.3)
where Pn−1 is the measured polarization at time point t′ = (n−1) · t and Tbuild−up the true
build-up time constant of the sample without any RF pertubations. Replacing the equation
above with P1 = Pmax · (1−e−τ/Tbuild−up ), we can get
Pn = P1 +Pn−1 ·cosθ ·e−τ/Tbui ld−up . (D.4)
After the simplification of the equation with parameter k = cosθ ·e−τ/Tbuild−up and the calcula-
tion of the geometric progression the polarization Pn can be expressed as,
Pn = kn −1
k −1·P1 = kn −1
k −1·Pmax · (1−e−τ/Tbui ld−up ), (D.5)
94

D.3. Polarization calculation through build-up
Figure D.2: Simulation of the DNP build-up by applying various RF pulses with different flipangles: 5, 30, 45
and the polarization on the longitudinal direction, PZn, and transversal direction, PXY
n , can be
easily deduced from the equation above and written as ,
P X Yn = kn −1
k −1·P1 · sinθ = kn −1
k −1·Pmax · (1−e−τ/Tbui ld−up ) · sinθ
P Zn = kn −1
k −1·P1 ·cosθ = kn −1
k −1·Pmax · (1−e−τ/Tbui ld−up ) ·cosθ
(D.6)
As the meaning in the NMR, P X Yn represents the measurable polarization which diminishes
through T2 relaxation and P Zn the reserved polarization which will be kept and undergo the
T1 relaxation. Assume that Pmax = 1, τ= 300s and Tbui ld−up = 3000s, the simulation of DNP
build up curve with different monitoring flip angle θ is shown in figure D.2. From the results
several information can be obtained: a) With large flip angle θ more measurable polarization
can be used for monitoring and at certain angle the measurable polarization decreases; b)
With large flip angle θ the final steady state polarization can be actually reached much faster
than expected and the reserved polarization decreases; c) The build-up time is always shorter
than the real build-up time of the spin with the RF perturbations. In summary small flip angle
pulse is more suitable to monitor the solid-state polarization.
D.3 Polarization calculation through build-up
Since the solid-state relaxation time of nuclear spins at liquid helium temperature (4.2K)
is still reasonable short (∼20 mins for 13C) enhancement factor ε can be easily determined in
several hours. But the thermal polarization becomes hard to measure when the experimental
temperature drops to 1K and the solid-state relaxation time dramatically increases to 10ks
range. To calculate the maximal polarization Pmax and Tbui ld−up , we can measure final
polarization by varying different parameters (flip angle θ or monitoring time interval τ) and
then compare the signals to deduce the polarization level and the real build-up time constant.
95

Appendix D. Polarization level determination
D.3.1 varying flip angle
Consider two experiments performed with different flip angle θ1 and θ2 and assume that
the experiments long enough (n>50) so that kn ¿ 1,
P 1n = sinθ1
(1−k1)·Pmax · (1−e−τ/Tbui ld−up )
P 2n = sinθ2
(1−k2)·Pmax · (1−e−τ/Tbui ld−up )
(D.7)
After comparing the two equations above, an equation only dependent on Tbui ld−up can be
obtained,
P 2n
P 1n= sinθ2
sinθ1· 1−k1
1−k2. (D.8)
The real build-up time can be rewritten as,
Tbui ld−up =− τ
l n P 1n sinθ2−P 2
n sinθ1
P 1n sinθ2 cosθ1−P 2
n sinθ1 cosθ2
, (D.9)
and the maximal polarization is then,
Pmax = P 1n(1−k1)
sinθ1(1−e−τ/Tbui ld−up ), (D.10)
Assume that θ2 = 2θ1 and the equation of the build-up time can be simplified as,
Tbui ld−up =− τ
ln 2·P 1n sinθ1−P 2
n
2·(P 1n−P 2
n )cosθ21+P 2
n
, (D.11)
D.3.2 varying time interval
Consider two experiments performed now with a same flip angle θ, but measured with
two various time interval (τ and 2τ). The same assumption that the experiments last long
enough (n>50) should be followed to ensure the approximation. The polarization measured in
both cases can be expressed as,
P 1n = sinθ
1−k1·Pmax · (1−e−τ/Tbui ld−up )
P 2n = sinθ
1−k2·Pmax · (1−e−2τ/Tbui ld−up )
(D.12)
with k1 = cosθ ·e−τ/Tbui ld−up and k2 = cosθ ·e−2τ/Tbui ld−up . Then the ratio between both build-up
plateau is,
P 2n
P 1n= 1−k1
1−k2· 1−e−2τ/Tbui ld−up
1−e−τ/Tbui ld−up(D.13)
96

D.3. Polarization calculation through build-up
P 2n
P 1n= 1+ (1−cosθ)e−τ/Tbui ld−up
1−cosθe−2τ/Tbui ld−up(D.14)
The solution of the build-up time is,
Tbui ld−up =− τ
ln(1−cosθ)−
√(cosθ−1)2+4cosθ(
P2n
P1n−1)2
2(1− P2n
P1n
)cosθ
, (D.15)
and the maximal polarization is as in equation...,
Pmax = 2P 1n(1−k1)
sin2θ1(1−e−τ/Tbui ld−up ). (D.16)
D.3.3 Summary
The two methods introduced in previous two sections theoretically shows the possibility
of calculating maximal polarization of DNP through comparing two separate datasets of DNP
buildup. In pratice there are some other constraints: a) By varying flip angle θ the measurable
polarization signals of the experiments is easy to distinguish, but a well calibrated flip angle
is mandatory for the final calculation; b) By varying time interval τ it is difficult to observe
significant difference of the measurable polarization with even different time intervals so that
to precisely detect NMR signals for both measurements plays a vital role in the calculation; c)
In general the polarization calculated here should come from target nuclear spins and should
not be influenced by the leakage of other nucelar spins polarized simultaneously. This means,
with trityl radicals this measurements should be much more accurately.
97

Tian Cheng Address: Rue de la Blancherie 1 CH‐1022 Chavannes‐près‐Renens Switzerland Date of birth: 17.12.1981 Place of birth: Nanchang, Jiangxi, P.R. China Nationality: Chinese Tel: +41 21 693 79 66 Email : [email protected]
PROFESSIONAL EXPERIENCE
2009 ‐ 2013 PhD candidate, École Polytechnique Fédérale de Lausanne, Switzerland
Dissolution DNP technique and its hardware developments; in vivo DNP‐enhanced magnetic resonance spectroscopy and
imaging; Design, simulation and construction of RF instrumentation
used in MR; Novel radicals development; Electron Spin Resonance (ESR), functional MRI (fMRI) and
its data analysis. Teaching assistant, École Polytechnique Fédérale de Lausanne,
Switzerland Advanced Physics laboratory course General Physics I
2004 ‐ 2008 Technical assistant, German Cancer Research Center (DKFZ):
Part‐time technical assistant at the cyclotron department of maintaining Germanium detectors with liquid nitrogen and checking residual dose of radioactive solutions used for PET

EDUCATION
2009 – 2013 PhD in Physics, École Polytechnique Fédérale de Lausanne, Switzerland
2007 ‐ 2008 MSc in Medical Physics, University Medical Centre Mannheim, Ruprecht‐Karl University of Heidelberg, Germany
2003 ‐ 2008 Dipl. in Physics, Ruprecht‐Karl University of Heidelberg, Germany
1998 ‐ 2002 BA in Optoelectronics, Beijing Institute of Technology, Beijing, P. R. China
1995‐1998 High school The attached Middle School to Jiangxi Normal University, Nanchang, P.R. China
PUBLICATIONS
Mor Mishkovsky, Tian Cheng, Arnaud Comment and Rolf Gruetter. Localized in vivo hyperpolarization transfer sequences, Magnetic Resonance in Medicine, vol. 68, num. 2, p. 349–352, 2012. Jessica A. M Bastiaansen; Cheng Tian; Mor Mishkovsky; Joao M. N. Duarte; Arnaud Comment; Rolf Gruetter, In vivo enzymatic activity of acetylCoA synthetase in skeletal muscle revealed by 13C turnover from hyperpolarized [113C]acetate to [113C]acetylcarnitine, Biochimica et biophysica acta, 2013 (in press) Cheng Tian, Mor Mishkovsky, Jessica A. M. Bastiaansen, Oliver Ouari, Patrick Hautle, Paul Tordo, Ben van den Brandt, and Arnaud Comment, Method to minimize and monitor in situ the polarization losses in hyperpolarized biomolecules prior to in vivo NMR experiments (submitted) Cheng Tian, Mor Mishkovsky, Matthias J. N. Junk, Dariush Hinderberger, Kerstin Muennemann and Arnaud Comment, Producing radicalfree hyperpolarized solutions for in vivo magnetic resonance (Manuscript in preparation)

CONFERENCE CONTRIBUTIONS
J. Bastiaansen, T. Cheng, R. Gruetter and A. Comment. Hyperpolarized [1-13C]acetylcarnitine as a tracer for cardiac metabolism, ISMRM 21th Annual Scientific Meeting, Salt Lake City, USA, 2013. T. Cheng, J. Jung, A. Comment, R. Gruetter and H. Lei et al., A comparison of high-pass birdcage coils for small animal imaging at 9.4 and 14T., ESMRMB 29th Annual Scientific Meeting, Lisbon, 2012 T. Cheng, M. Mishkovsky, J. Bastiaansen, O. Ouari and P. Hautle et al., Method to minimize the polarization losses in hyperpolarized biomolecules prior to in vivo MR experiments. ESMRMB 29th Annual Scientific Meeting, Lisbon, 2012. J. Bastiaansen, T. Cheng, J. M. N. Duarte, M. Mishkovsky and A. Comment et al. Kinetic analysis of acetylCoA synthetase activity in skeletal muscle. ESMRMB 29th Annual Scientific Meeting, Lisbon, 2012. T. Cheng, M. Mishkovsky, M. Junk, D. Hinderberger and K. Münnemann et al. Producing radical-free hyperpolarized solutions for in vivo magnetic resonance. ISMRM 20th Annual Scientific Meeting, Melbourne, Australia, 2012. J. Bastiaansen, T. Cheng, R. Gruetter and A. Comment. In vivo real time cardiac metabolism using hyperpolarized acetate, ISMRM 20th Annual Scientific Meeting, Melbourne, Australia, 2012. J. Bastiaansen, T. Cheng, M. Mishkovsky, A. Comment and R. Gruetter. In vivo enzymatic assay of carnitine acetyl transferase and acetylCoA synthetase using hyperpolarized acetate, ISMRM 20th Annual Scientific Meeting, Melbourne, Australia, 2012. T. Cheng, M. Mishkovsky and A. Comment. In situ polarization measurement of hyperpolarized solutions prior to in vivo 9.4T MR experiments. ISMRM 18th Annual Scientific Meeting, Montreal, Canada, 2011. J. Bastiaansen, T. Cheng, M. Mishkovsky, A. Comment and R. Gruetter. Study of acetylcarnitine kinetics in skeletal muscle in vivo using hyperpolarized 1-13C acetate. ISMRM, Montreal, 2011. M. Mishkovsky, T. Cheng, A. Comment and R. Gruetter. Localized in vivo hyperpolarization transfer experiments. ISMRM 19th Annual Scientific Meeting, Montreal, Canada, 2011. Y. Takado, T. Cheng, J. Bastiaansen, M. Mishkovsky and R. Gruetter et al. In vivo real-time metabolic studies of mice brain and skeletal muscle at 9.4T. Third International Symposium on

Dynamic Nuclear Polarization, Lausanne, 2011. J. Bastiaansen, T. Cheng, M. Mishkovsky, A. Comment and R. Gruetter. The metabolic effect of hyperpolarized [1-13C]acetate dosage in vivo. Third International Symposium on Dynamic Nuclear Polarization, Lausanne, 2011. J. Bastiaansen, T. Cheng, R. Gruetter and A. Comment. Kinetics of hyperpolarized [1-13C]acetate metabolism in cardiac muscle. Third International Symposium on Dynamic Nuclear Polarization, Lausanne, 2011. J. Bastiaansen, T. Cheng, M. Mishkovsky, A. Comment and R. Gruetter. Hyperpolarized acetate as a metabolic tracer for skeletal and cardiac muscle energetics. Hot Topics in Molecular Imaging - TOPIM, Les Houches, 2011. M. E. Merritt, M. Mishkovsky, T. Cheng, A. Jindal and Z. Kovacs et al. In vivo hyperpolarized 89Y studies in a 9.4T animal scanner. ISMRM 18th Annual Scientific Meeting, May 2008., Stockholm, Sweden, 2010.