methods of gas hydrate concentration estimation with field examples
TRANSCRIPT

GEOHORIZONS December 2009/76
Methods of gas hydrate concentration estimation with field examplesDhananjay Kumar1, Ranjan Dash1, and Pawan Dewangan2
1Chevron Energy Technology Company, California, USA2National Institute of Oceanography, Goa, India
geological settings, use of analogs and other available data.
The hydrate concentration estimation procedurethen requires formulating an appropriate relationship todescribe the change in mechanical properties of the sedimentwith gas hydrate concentration. However, the accuracy ofthe estimation will depend on the sensitivity of these physicalproperties to the presence of gas hydrate e.g., higher thesensitivity of property more reliable is the estimation ofhydrate concentration. Physical properties such as the seismicvelocity and electrical resistivity are very sensitive to thepresence of gas hydrate, while others like seismic anisotropyand attenuation are less sensitive. The relationship betweena physical property and gas hydrate concentration may alsodepend on the nature of gas hydrates within the hostsediment (filling of pore spaces, part of solid frame, fracturefilling or as cement). In this paper, we assume hydrates aspore filling reducing the porosity of host sediments. Thereare various empirical and rock physics based relationshipsavailable between gas hydrate and physical properties (Leeet al., 1996; Helgerud et al., 1999; Chand et al., 2004; Kumar etal., 2007). However, many relationships are good for certaingeological settings only and need field based selection of amodeling relationship. The following properties are commonlyused to estimate the gas hydrate concentration:
1. Seismic or elastic properties (velocities, Poisson’sratio, impedance, AVA, anisotropy, attenuation)
2. Electrical resistivity3. Chloride measurements of pore fluid4. NMR-DENSITY porosity5. Density6. Temperature
In this paper we describe the methods of estimatinggas-hydrate concentration using the properties listed aboveand demonstrate their applications with data from three
Introduction
Gas hydrate is a solid, ice-like, crystalline substancecontaining low molecular weight gases (mostly methane) in alattice of water molecules (Sloan, 1998). The formation andstability of gas hydrates within the subsurface depend uponthe supply of free gas in excess of the solubility limit, suitablepressure and temperature conditions, pore fluid chemistryand the nature of the trapped gas. Globally, hydrates arefound in ocean floor sediments at water depths greater thanabout 500 m and in permafrost environments.
Hydrates contain an immense amount of natural gas(Collett, 2002) and have the potential to be a future cleanenergy resource. Although estimations vary widely as thereis no standard method for estimating hydrate concentration,the amount of free gas within oceanic hydrates can be ashigh as 21x1015 m3 (Kvenvolden, 1999) or 1-5 x 10¹⁵ m3 (Milkov,2004). There are various publications on the gas hydrateconcentration estimation from different geological andgeophysical measurements (e.g., Lee et al., 1996; Tinivella,1999; Ecker et al., 2000; Lu and McMechan, 2002; Carcioneand Gei, 2004; Kumar et al., 2007; Westbrook, 2008). In thisarticle, we aim to summarize different methods available forestimating gas hydrate concentration and demonstrate thoseusing well log data from three geographical areas: 1) BP-DOE-US “Mount Elbert” test, Alaska, 2) northern Cascadiamargin offshore western Canada, and 3) Krishna Godavari(KG) basin, offshore India.
The presence of gas hydrates within the sedimentpore space alters the mechanical properties of the hostsediments (e.g., increasing the seismic velocities), and thischange in properties from a background (hydrate freesediments) value can be utilized to estimate hydrateconcentration. Finding a background value of physicalproperties is not trivial and it requires the knowledge of the
AbstractThe presence of gas hydrates alters the bulk physical properties of the host sediments. The deviation of the
physical property in the hydrated layer from the regional (hydrate-free background) trend can be used to estimatehydrate concentration. In this paper, we summarize six different methods of gas hydrate concentration estimation thatmake use of data from the measurements of the seismic properties, electrical resistivity, chlorinity, porosity, density,and temperature. We demonstrate the methods of hydrate concentration estimation using data from three differentgeographical areas: 1) Mount Elbert test site, Alaska, 2) Cascadia margin, offshore Canada and 3) Krishna Godavari (KG)basin, offshore India. Based on our estimation, the hydrate saturation in the hydrate stability zone varies from 40% to80% of pore space in Alaska, 10% to 40% of pore space in the Cascadia margin, and 5% to 40% of pore space in the KGbasin. There are various factors that can affect the hydrate saturation estimate; the two most important factors being thebackground property value in the absence of gas hydrate, and the modeling relationship between the physical propertyand gas hydrate saturation. We also present a simple work-flow for hydrate saturation estimation from seismic velocityin a Microsoft Excel sheet.

GEOHORIZONS December 2009/77
different geographic regions.
Methods
Before discussing various gas hydrate concentrationestimation methods, we define two key terms used in thisarticle: saturation and concentration. Hydrate saturation (S
h)
is the volumetric fraction of hydrates present in the porespace, whereas hydrate concentration (S
hyd) is the volumetric
fraction of hydrates in the sediment. Given the total porosity(φ) of the rock, saturation and concentration can be estimatedfrom one another by the following relation:
(1)
Seismic or elastic properties
Seismic reflection data have been historically usedto remotely sense the presence of gas hydrates in marinesediments. The most common seismic proxy for gas hydratesis the BSR or the bottom simulating reflector, which representsthe base of the gas hydrate stability zone (GHSZ) and mimicsthe seafloor. The BSR is caused by strong acoustic impedancecontrast between the overlying hydrate bearing sedimentsand the underlying gas charged sediments. P-wave velocity(V
p) is commonly used to estimate gas hydrate concentration
within the sediments (Singh et al., 1993; Ecker et al., 2000; Luand McMechan, 2002). However, estimations based on V
p
alone are not accurate enough when hydrates are present inlow quantity (Lee et al., 1996; Yun et al., 2005). In such cases,V
p along with V
s (S-wave velocity) or V
p/V
s ratio (or Poisson’s
ratio) may provide better constraints on the estimation (Kumaret al., 2007; Westbrook, 2008). In cases where free gas existswithin the GHSZ (Lee and Collett, 2006; Kumar et al., 2007), V
s
is required along with Vp to distinguish the effect of free gas
and hydrate.
Seismic velocities (Vp and V
s) can be estimated from
sonic logs (one dimensional data), seismic data (two andthree dimensional data) and laboratory tests. For example,Waite et al. (2000) estimated a V
p of 3650 m/s, a V
s of 1890 m/s
and a density of 900 kg/m3 from laboratory tests on puresynthetic hydrates. Although conventional seismic data canprovide V
p easily, in most cases V
s has to be computed through
indirect methods such as from the AVA (amplitude variationwith angle) response of P-wave seismic data. However, wheremulticomponent data are available (for example from oceanbottom seismometers), V
s can be computed more accurately.
Waveform inversion of seismic data (Korenga et al., 1997)can provide more reliable and higher resolution seismicvelocity than conventional velocity analysis methods. Ifwaveform seismic data are less reliable, amplitude data canbe used for AVA inversion (Ojha and Sain, 2007) for impedance(equals velocity times density) and this impedance can beused to estimate gas hydrate concentration. Dai et al (2004)used impedance data to estimate hydrate concentration via arock physics relationship based on effective mediummodeling. Willoughby and Edwards (1997) used seafloorcompliance data, which is sensitive to S-wave velocitychange, to improve hydrate resource evaluation.
Several authors have presented relationshipsbetween seismic velocities and gas hydrate concentration
Fig.1 A Microsoft Excel based data example to estimate gas hydrate saturation from P-wave velocity only using methods 1 and2 discussed in text. Columns E and F are estimated hydrate saturations. See text for detail.
GEOHORIZONS December 2009/78
(Chand et al., 2004), which can be broadly grouped into twocategories: 1) empirical relations (Lee et al., 1996) and 2) rockphysics based effective medium theory (Helgerud et al., 1999).While the presence of hydrates in the pore space alwaysincreases the P-wave velocity of the host sediments, theeffect on S-wave velocity depends on the nature andconcentration of hydrates within the sediment. Commonlyused empirical relationships between V
p and saturations
(called four-phase relations involving water, gas, gas hydrateand rock matrix) are:
(2)
and
(3)
where PV , wV , gV , hPV , and mPV are the P-wave velocitiesin the hydrated sediments, water, free-gas, pure hydrate, andmatrix, respectively, φ is total porosity (as a fraction of rockvolume), S
w, S
g, and S
h are the saturations of water, gas, and
gas hydrate in the pore space, respectively(S
w + S
g + S
h = 1), and ρ
w, ρ
g, ρ
h, ρ
m, and ρ are the densities of
water, free gas, pure hydrate, matrix, and bulk sediment,respectively (Table 1). The bulk density( ) can beestimated from individual density components. Note thatequations 2 and 3 are known as Wyllie’s time-average relationand Wood’s relation, respectively. The Wood equation isbetter suited if hydrates are suspended in the pore space,and Wyllie’s time average equation is more appropriate ifhydrates cement grain contacts. Lee et al (1996) present aweighted mean of the Wood’s and time-average equation as
(4)
where Vp1
is P-wave velocity estimated from Wood’s equation,V
p2 is P-wave velocity estimated from time-average equation,
w is a weighting factor, and m is a constant simulating therate of lithification with gas hydrate concentration. The value
of w should be derived from regression analysis of Vp and
porosity in hydrate-free sediments and the value of m shouldbe derived from regression analysis of V
p and gas hydrate
saturation. Lee et al (1996) used the value of w as 1.1 and thevalue of m as 1.0. Kumar et al (2007) modified the Woodequation with an effective medium based rock physicsrelationship that is appropriate for the Hydrate Ridge(offshore Oregon, USA). This effective medium theoryassumes that gas hydrate formation reduces the originalporosity and becomes part of the solid matrix. The V
p from
Modified Wood equation is
(5)
where is porosity after gas hydrate formation,
is the volumetric concentration of gas hydrates in therock that is now part of the solid matrix, and now gas and
water constitute the fluid part in pores ( 1=+ gw SS ).
The S-wave velocity can be empirically derived.Following hydrate formation model of Kumar et al (2007), V
s
can be derived from Vp as follows
(6)
where is the ratio of S to P-wave velocity in the solid
matrix and is equal to ; mG and mKare shear modulus and bulk modulus of solid mineral (hydrateand sand/shale minerals). If the gas hydrate formation modelis pore filling (not affecting rock framework), then V
s can be
estimated according to Lee et al (1996) as
(7)
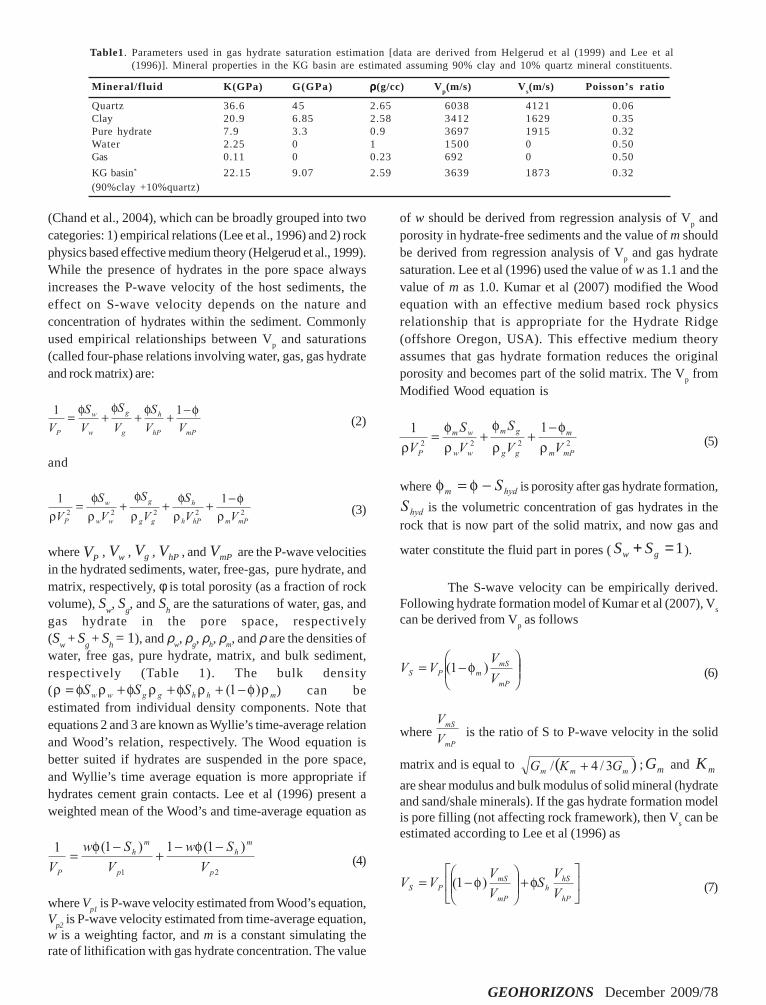
Mineral/fluid K(GPa) G(GPa) ρρρρρ(g/cc) Vp(m/s) Vs(m/s) Poisson’s ratio
Quartz 36.6 45 2.65 6038 4121 0.06Clay 20.9 6.85 2.58 3412 1629 0.35Pure hydrate 7.9 3.3 0.9 3697 1915 0.32Water 2.25 0 1 1500 0 0.50Gas 0.11 0 0.23 692 0 0.50
KG basin* 22.15 9.07 2.59 3639 1873 0.32(90%clay +10%quartz)
Table1. Parameters used in gas hydrate saturation estimation [data are derived from Helgerud et al (1999) and Lee et al(1996)]. Mineral properties in the KG basin are estimated assuming 90% clay and 10% quartz mineral constituents.
GEOHORIZONS December 2009/79
Where is the ratio of S to P-wave velocity in the
pure gas hydrate (which is about 0.46), and solid matrixincludes only sand/shale minerals.
Seismic anisotropy and attenuation are also affectedby the presence of hydrates/free gas within the sediments,but the relationship of these properties with hydratesaturation is poorly known. Hydrate occurring as vein fillingin the sediment can induce seismic anisotropy which can beused to find out the distribution and fabric of gas hydrates(Kumar et al., 2006), but the hydrate concentration estimationusing increase in anisotropy due to the presence of gashydrate is not established. Seismic attenuation in hydratebearing sediments (especially at sonic frequency) is generallyhigher than that for the hydrate free sediments (Guerin andGoldberg, 2002). On the other hand, according to Wood et al(2000), gas hydrate formation at the sediment grain contactsrather than in the pore spaces may significantly decrease theseismic attenuation. Wood et al (2000) assumed P-waveseismic attenuation for hydrate-free sediment to be 400 andestimated P-wave seismic attenuation for hydrate-bearingsediment is in the range of 200 to 700. There is a large overlapbetween the attenuation values for hydrate-free and hydrate-bearing sediments and therefore significant uncertainties existin gas hydrate saturation estimation using attenuation.
Electrical resistivity
Gas hydrate, like ice, acts as an electrical insulator.The presence of gas hydrate (or free gas) increases theresistivity of rock. For example, downhole resistivitymeasurements in the northern Cascadia margin have showna value of ~ 2.0 ohm-m for hydrate bearing sediments incontrast to a value of ~ 1.0 ohm-m for the surroundingsediments (Riedel et al., 2006). Assuming that high resistivityabove the BSR is caused by the presence of gas hydrate inpores (meaning pores are filled with water and/or gashydrate), hydrate saturation can be estimated by Archie’slaw as proposed by Lu and McMechan (2002)
(8)
where Ro is the resistivity of water saturated formation
(background), Rt is the measured resistivity, and n is the
exponent. The exponent is about 1.94 for hydrate bearingclastic sediments and is about 1.62 in gas-bearing zone. Forexample, if resistivity of hydrate-free sediment and hydrate-bearing sediment are 1 ohm-m and 2 ohm-m, respectively, thegas hydrate saturation is about 0.30 according to equation 8.The exponent is empirical and can introduce error in hydrateconcentration estimates. The critical factor for hydrateconcentration estimation using resistivity data is choosingthe baseline indicating hydrate free sediments, which is
dependent on the pore water salinity. Sava and Hardage (2007)suggest calibrating Archie’s equation using the Hashim-Shtrikman lower bound on electrical resistivity, and modifyingArchie’s equation for the presence of clay in hydrate-bearingsediments. Resistivity can be directly measured from well logand estimated from electromagnetic survey. Controlled SourceElectromagnetic (CSEM) survey has been recently used formapping gas hydrate in marine environment (Weitemeyer etal., 2005).
Chloride measurements
Hydrate formation removes water and gas moleculesfrom the pore space and increases the salinity of thesurrounding pore water. Conversely, hydrate dissociationduring drilling and core recovery releases fresh water, causingpore water to become fresher. Also, in an open system, theexcluded ions diffuse away over time after formation of gashydrates (Yuan et al, 1996; Tinivella, 1999). Ion exclusion ofdissolved salts produces distinctive geochemical signaturesthat are used to identify the presence of gas hydrate and toestimate the hydrate concentration. The main challenge forthis method is to accurately predict the base line (background)chlorinity profile. Hyndman et al. (1999) showed that it ispossible to estimate both the in situ pore fluid salinity andthe in situ gas hydrate concentration using resistivity data.The chloride anomaly can be used to estimate gas hydratesaturation in the pore space before recovery (Yuan et al.,1996) as
(9)
where Clpw
and Clsw
are measured chloride concentrations ofpore water and normal bottom seawater (background),respectively. There are various uncertainties in this methodas described by Yuan et al (1996). Chloride measurement isperformed on core samples extracted during drilling (Tinivellaand Carcione, 2001), but the core recovery without damagingit, maintaining in situ conditions in laboratory, and findingthe right background chloride concentration are some of thedifficulties with hydrate concentration estimation withchloride measurements.
NMR-DENSITY porosity
Nuclear magnetic resonance (NMR) logging tool hasthe ability to measure water-filled porosity, and densityporosity measures space occupied by both water and/or gashydrate (Lee, 2008). In a water-filled formation both NMR-and density-porosities will agree. However, in the hydrate-bearing formations, NMR- and density-porosities will disagreeand the difference between the two porosities can be used toestimate gas hydrate saturation as (Lee, 2008),
GEOHORIZONS December 2009/80
(10)
where NMR_porosity and DENSITY_porosity representporosities derived from NMR and density log, respectively.Gas hydrate saturation estimation from this method is onlypossible at well locations.
Density
The formation of gas hydrate reduces the densityof rock and this property can be used to estimate hydratecontent. Assuming original pore space filled with water andnow part of the pore space is filled with gas hydrate, thesaturation of gas hydrate can be estimated by knowing thebackground rock density (ρ
0) for water-filled pores and
measured density of hydrate-bearing rock (ρ) as
(11)
The density measurement and therefore hydratesaturation estimation is possible from well logs deriveddensity and three dimensional density derived from seismicdata AVA inversion.
Temperature
Gas hydrate dissociation is an endothermic process.Once gas hydrate dissociates, sediment containing hydrateis cooled relative to the surrounding sediment, thus creatinga negative temperature anomaly (Ford et al., 2003). Duringrecent deep-sea drillings, infrared thermal imaging camerahas been used to image sediment cores and negativetemperature anomaly (average 40C cooler) has been identifieddue to gas hydrate. Thermal method at drilling locations hasoften been used for qualitative identification of gas hydrates.
Among the six methods discussed above, some areremote sensing methods (seismic, electrical), and othersinvolve direct measurements from downhole logging (seismic,electrical, NMR-DENSITY porosity, density) and coring(chloride, temperature). Each method (or data type) has itsown accuracy, sensitivity and cost issue. Seismic methods arethe most common but the estimated gas hydrate concentrationcan be less accurate than coring method. Although coringmethod has certain difficulty such as the core sampling,preserving samples in in situ condition, and making laboratorymeasurements on core samples, but it provides more accurateprediction of hydrate concentration. Evidently, remote sensingand logging methods are in situ measurements and coringmethods require laboratory measurements.
Implementation of the Seismic Methods
Seismic velocity is most commonly used to derive
gas hydrate saturation. Gas hydrate saturation estimationfrom seismic velocity is an inverse problem where one triesto find the hydrate saturation for which modeled velocitybest matches with measured velocity. Actual calculations aretypically done with software/scripts written in a high-levelcomputer language like Java, C, Fortran, Matlab, or MicrosoftExcel. Here, we discuss two simple implementation methodsof estimating gas hydrate saturation from seismic velocity:using a look-up table or regression analysis (method 1) and adirect estimation method (method 2). The difference betweenthe two methods is in implementation, and the method 1 ismore general. The gas saturation is ignored for simplification,but in the case of free gas and gas hydrate coexisting bothcan be simultaneously estimated. The steps for hydratesaturation estimation in method 1 are: 1) first create a table ofmodeled seismic velocity (V
p and/or V
s) using a preferred
velocity modeling method for various gas hydrate saturationsand given porosity values, 2) compute velocity mismatch(difference of modeled and measured velocities), and 3) lookup for the minimum velocity mismatch created in step 2; thecorresponding gas hydrate saturation (S
h) represents an
estimate of gas hydrate. This can be done with Vp only and
more reliably with both Vp and V
s simultaneously. The hydrate
saturation estimation using method 2 can be simply performedby rewriting the velocity modeling equation for S
h. The
method 2 can be used with only one velocity (Vp), modeled
with either the time-average equation for Vp (equation 2) or
the Wood relation for Vp (equation 3). The equations for
estimating hydrate saturation (method 2) using the time-average equation and the Wood equation are
(12)
and
(13)
where Vp is the measured P-wave velocity and S
h is the gas
hydrate saturation. In both methods 1 and 2, the commonrequirements are: the matrix properties, the velocity forhydrate-free sediments (background velocity), and calibrationof modeled and measured velocities. The calibration ofmodeled and measured velocities is to make sure that for thebackground case (hydrate-free sediments) modeled andmeasured velocities are in agreement. In this paper, in method1 the modeled velocity is calibrated (say by multiplying withscalar1) before computing velocity error and in method 2 themeasured velocity is calibrated (say by multiplying withscalar2). Assuming that the background measured P-wavevelocity is V
Pback, and the modeled P-wave velocity (for S
h =
0) is VPsh0
, the scalar1 (=VPback
/VPsh0
) is the ratio of VPback
andV
Psh0 and the scalar2 (=V
Psh0/V
Pback) is the ratio of V
Psh0 and
VPback
.
GEOHORIZONS December 2009/81
The methods 1 and 2 can be simply performed in aMicrosoft Excel sheet. Figure 1 shows a data example tocompute gas hydrate saturation from V
p alone with both
methods 1 and 2. The Vp in this example is modeled with
Wyllie’s time average equation (equation 2) for hydratebearing sediments in the absence of free gas, and assumingclean sand (quartz as mineral). Data in columns A to C arefrom a well log, column D is background V
p for hydrate-free
sediments, column G is various input parameters (Table 1),column H is background modeled V
p (V
Psh0) using the Time-
average equation, and columns J to DF is a table of absolutevelocity difference (modeled calibrated V
p – measured V
p) for
various gas hydrate saturations and porosities. The columnsM through DE in Figure 1 are hidden. The actual script usedto calculate J5 in the table (Figure 1) is ABS((1/(C5*$J$3/$G$7+C5*$J$2/$G$3+C5*$J$4/$G$17+(1-C5)/$G$11))*D5/H5-B5), where D5/H5 is scalar1. The column E is gashydrate saturation estimated from method 1, andthe actual script used to calculate E5 isINDEX($J$4:$DF$4,1,MATCH(MIN(J5:DF5),J5:DF5,0))*100.The column F is gas hydrate saturation estimated from method2, and the actual script to calculate F5 is (1/C5*(1/(B5*H5/D5)-1/$G$11)-(1/$G$7-1/$G$11))/(1/$G$17-1/$G$7)*100. Thegas hydrate saturation is calculated for each depth point(one data point in one row, Figure 1). Note that saturationsestimated from methods 1 and 2 are same, and to estimate gashydrate saturation using method 2 only column H (modeledVp for S
h=0) is needed and not the velocity error table,
however, method 2 can only be used with Vp, and when V
p is
either modeled with an equation (the time-average equationor the Wood’s equation in this article) that can be rewrittenfor the forward computation of hydrate saturation in terms ofV
p, density and porosity (as given in equations 12 and 13).
We recommend using both Vp and V
s simultaneously if
available, and in this case one will have to use method 1 toestimate gas hydrate. The Figure 1 is an example of MicrosoftExcel scripts to calculate gas hydrate saturation. Theestimated hydrate saturation will be different due todifferences in 1) velocity modeling methods, 2) backgroundmodels and 3) mineral/fluid properties.
Field Data Examples
We discuss data examples from three fields: Alaska,Cascadia margin, and Krishna Godawari (KG) basin. With theAlaska data, we show a typical well log data in hydrate bearingsediments, and compare estimated hydrate saturation fromvarious data/methods assuming quartz as the mineral matrix.With the Cascadia margin data example, we compare hydratesaturation estimated from different data/methods (againassuming quartz as the mineral matrix) and discuss the effectof varying background model on hydrate saturation. Withthe KG basin data, we compare estimated hydrate saturationfrom various data/methods, and discuss the effect of varyingmineral properties on hydrate saturation. The rock matrix isquartz (sand) rich in the first two data examples, but is clayrich (90% clay and 10% quartz) in the case of KG basin.
Mount Elbert test data, Alaska
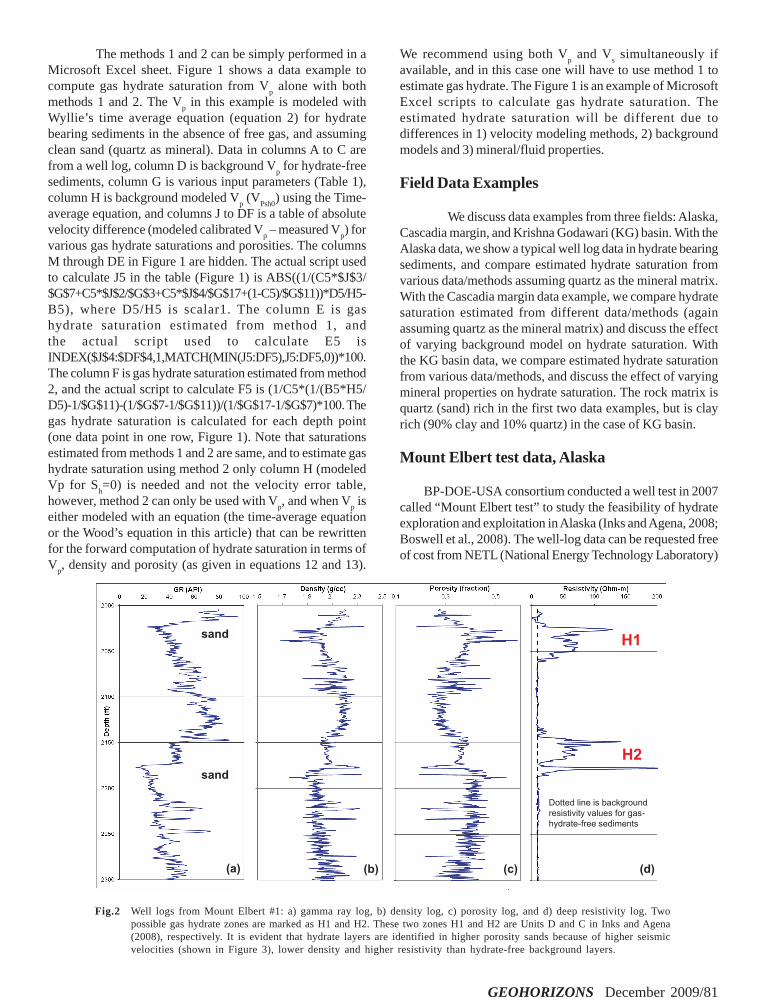
BP-DOE-USA consortium conducted a well test in 2007called “Mount Elbert test” to study the feasibility of hydrateexploration and exploitation in Alaska (Inks and Agena, 2008;Boswell et al., 2008). The well-log data can be requested freeof cost from NETL (National Energy Technology Laboratory)
Fig.2 Well logs from Mount Elbert #1: a) gamma ray log, b) density log, c) porosity log, and d) deep resistivity log. Twopossible gas hydrate zones are marked as H1 and H2. These two zones H1 and H2 are Units D and C in Inks and Agena(2008), respectively. It is evident that hydrate layers are identified in higher porosity sands because of higher seismicvelocities (shown in Figure 3), lower density and higher resistivity than hydrate-free background layers.

GEOHORIZONS December 2009/82
Fig.3 Gas hydrate saturation estimated from well logs at Mount Elbert #1. On the left are Vp and V
s logs with corresponding
background values plotted by black dotted vertical lines (a), and in the middle panel (b) is gas hydrate saturationderived from resistivity log (blue dotted line) using equation 8 and from NMR-DENSITY porosity logs (red solid line)using equation 10. The right panel (c) shows gas hydrate saturations estimated from seismic velocities: blue and redcolor solid curves show saturations estimated from V
p alone using method 2 and method 1, respectively (they are
indistinguishable), and black dotted curve show hydrate saturation estimated from both Vp and V
s simultaneously. In
this example, Vp is modeled using equation 2 and V
s is modeled using equation 7.
Fig. 4 Gas hydrate saturation estimated from well logs at northern Cascadia margin, Expedition 311 site U1327E. On the left(a) are V
p and V
s logs with corresponding background values plotted by black dotted vertical lines and another
background depth varying VP (red dotted line) from Yuan et al (1996). The middle panel (b) and the right panel (c)
show gas hydrate saturations estimated from VP alone (red solid curve) and V
P and V
S combined (black dotted curve)
using method 1. The estimated hydrate saturation shown in the middle panel uses constant background velocities(black vertical dotted lines in Figure 4a), and saturation shown in the right panel were estimated using a constantbackground value for V
S as in the middle panel and a depth varying V
P trend (red dotted curve in Figure 4a). Note the
change in hydrate saturation (middle vs. right panels) due to change in background VP value only. In this example, V
p
is modeled using equation 2 and Vs is modeled using equation 7. Depth shown is in mbsf (meters below seafloor), water
depth is 1300m and the BSR is at 225mbsf.
GEOHORIZONS December 2009/83
website (http://www.netl.doe.gov/technologies/oil-gas/FutureSupply/MethaneHydrates/ANSLogData.html). Anexample of the well logs from the Mount Elbert site is shownin Figures 2 and 3, where Depth is measured from KB (54.80ftabove sea level). Gas hydrate saturation can be estimatedfrom resistivity log using equation 8 knowing the backgroundresistivity of hydrate-free sediments. In this example, weassume a background resistivity of 9 ohm-m. Given the NMR-porosity and density porosity logs, gas hydrate saturation(Figure 3) is estimated using equation 10. For hydratesaturation estimation using seismic velocities, we assume aconstant background value of V
p (2000 m/s) and Vs (720 m/s)
as shown by black dotted lines in Figure 3. Figure 3c showsgas hydrate saturations estimated from V
p alone (using both
methods 1 and 2 as described earlier) and from both Vp and V
s
together. In this example, hydrate saturation varies from 40%to 80% of pore space in the GHSZ.
Cascadia margin, IODP Expedition 311 data,Canada
The northern Cascadia continental margin offshorewestern Canada is under study for the last two decades andthe presence of gas hydrates is confirmed from manygeophysical and geological experiments. More recently, anextensive list of log data were acquired at five locations (U1325to U1329) through IODP Expedition 311 in 2005 to study thegeological models for the formation of hydrates as well as toestimate hydrate concentration (Riedel et al., 2006). The drillholelocations were chosen so as to study the formation (anddissociation) of gas hydrates within the accretionary prism atdifferent stages of its development away from the Juan deFuca ridge. Chen (2006) did an elaborative study of the differentlogs from IODP Expedition 311 to estimate the hydrateconcentration. Combined seismic reflection and sonic logstudy by Dash (2007) showed a hydrate saturation of about~15% of pore space at IODP Site U1327, where the BSR depthis 225 mbsf (meters below seafloor). Figure 4 shows hydratesaturation estimated from seismic velocities with a constantbackground V
S trend and two different background V
P trends.
The estimated hydrate saturations vary by changing thebackground V
P trend, which emphasizes the importance of a
reliable background model. In this example, hydrate saturationvaries from 10% to 40% of pore space in the GHSZ.
KG basin, NGHP Expedition -1 data, India
The Government of India started the National GasHydrate Program (NGHP) in 1997 to explore gas hydrateresources in India. The presence of gas-hydrate in the Indiancontinental margin was confirmed during drilling/coringonboard JOIDES Resolution between 28th April 2006 and 19th
August 2006 (Collett et al., 2008). This is known as NGHPExpedition 01. The drilling/coring revealed 128 m thick gashydrate in the KG offshore basin predominantly deposited inthe fracture network (Holland et al., 2008), disseminateddeposits of varying thickness in the Mahanadi basin and
Andaman basin. We illustrate the methods of hydratesaturation estimation from the well logs acquired in KGoffshore basin during NGHP Expedition 1 (Collett et al., 2008).The sedimentological parameters measured onboard suggestthat the matrix minerals are composed of 90 % clay and 10 %quartz. We use Hill’s averaging method (Hill, 1952) to estimatematrix effective elastic moduli from the pure mineral phases.According to Hill’s averaging, the bulk modulus and the shearmodulus of clay and quartz mix mineral are
(14)
and
(15)
where Vclay
and Vqtz
stand for clay and quartz volume fractionof mineral, K
clay and K
qtz are the bulk moduli of clay and quartz,
Gclay
and Gqtz
are the shear moduli of clay and quartz,respectively. The mineral density can be estimated by volumeaveraging as , where ρ
clay and ρ
qtz are
density of clay and quartz minerals (Table 1). Knowing elasticmoduli and density, P- and S-wave velocities in mineral canbe estimated as and
, respectively. Figure 5 shows gas hydratesaturation estimated at this well location from resistivity(Figure 5a) and seismic velocities (sonic logs) data (Figures5b and 5c). For hydrate saturation estimation from seismicvelocity using method 1, linear background velocities for P-and S-waves were assumed, and seismic velocities weremodeled assuming 90% clay and 10% quartz as mineral inFigure 5b and 100% quartz as mineral in Figure 5c. Hydratesaturation is different if 100% quartz is assumed as mineralcomposition compared to 90% clay and 10% quartz as mineralcomposition. The base of hydrate stability zone is clearlydemarcated in the hydrate saturation plots at about 185 mbsf.This data example emphasizes the importance of knowingthe correct mineral composition. Hydrate saturation variesfrom 5% to 40% of pore space in the GHSZ.
Discussions and Conclusions
There are various direct and indirect methods forestimating gas hydrate concentration. The reliability of thegas hydrate concentration will depend on 1) the quality ofmeasured data, 2) reliability of the relationship between therock’s physical property (e.g., seismic velocity, resistivity)and gas hydrate concentration, 3) background propertyvalues in the absence of gas hydrates, and 4) in situconditions. If there is any discrepancy among hydrateconcentration estimated from different data and methods,one should look at all the four issues. Lee and Collett (2006)discuss errors in gas hydrate saturation estimation due to

GEOHORIZONS December 2009/84
uncertainties in measurement and properties. If the measureddata are reliable, one should carefully decide about anempirical equation or rock physics based equation to modelphysical properties of the gas hydrate-bearing sediments. Inthis paper we used only Wyllie’s equation to model V
p and
empirical equation 7 to model Vs. The two most important
factors in estimating a reliable hydrate concentration are: 1)knowledge of background property trend, and 2) physicalproperty modeling method. In this paper we discussed variousmethods of hydrate concentration estimation using three datasets. For hydrate saturation estimation from seismic velocity,we discussed the importance of background model, in situmineral composition, and velocity modeling method. We alsopresented a workflow to estimate hydrate saturation fromseismic velocity in a Microsoft Excel sheet.
Acknowledgements
We thank Chevron and Director, National Institute ofOceanography Goa for permission to publish this paper. We alsothank Mrinal K Sen for reviewing manuscript. Mount Elbert datafrom Alaska are courtesy of US Department of Energy and BPExploration, Alaska, Inc., Northern Cascadia data are from IODP,and KG basin data were acquired onboard JOIDES Resolution duringNGHP Expedition 1 under the aegis of Directorate General of
Fig. 5 Gas hydrate saturation estimated from well logs in KG basin. On the left (a) is hydrate saturation estimated usingresistivity log with 1.08 ohm-m as the background resistivity value. The middle panel (b) and the right panel (c) showgas hydrate saturations estimated from V
P alone (red solid curve) and V
P and V
S combined (black dotted curve) using method
1, with linear background velocities [VP(m/s)=depth(mbsf)*0.6+1546.67, and V
S(m/s)=depth(mbsf)*0.492+210.67]. Seismic
velocities were modeled assuming 90% clay and 10% quartz as mineral composition in Figure 5b and 100% quartz asmineral composition in Figure 5c. Note the differences in hydrate saturation due to differences in mineral compositions(Figures 5b and 5c). In this example, V
P is modeled using equation 2 and V
S is modeled using equation 7. A linear
increase in the hydrate concentration is observed from 100 mbsf to 185 mbsf. The base of the hydrate stability zoneis clearly demarcated in the hydrate saturation plot at about 185 mbsf.
Hydrocarbons (DGH). This is N10 contribution no. 4652.
References
Boswell, R., Hunter, R., Collett, T., Digert, S.,Hancock, S., Weeks,M., and Mount Elbert Science Team, 2008, Investigation ofgas hydrate-bearing sandstone reservoirs at the “MountElbert” Stratigraphic test well, Milne Point, Alaska:Proceedings of the 6th International Conference on GasHydrates, Vancouver, BC, Canada, July 6-10
Carcione, J. M., and Gei, D., 2004, gas-hydrate concentrationestimated from P- and S-wave velocities at the mallik 2L-38research well, Mackenzie Delta, Canada: J. AppliedGeophysics, 56, 73-78.
Chand, S., Minshull, T. A., Davide, G., and Carcione, J. M., 2004,Elastic velocity models for gas-hydrate-bearing sediments-a comparison: Geophys. J. Int., 159 (2), 573-590.
Chen M., 2006, Northern Cascadia marine gas hydrate: constraintsfrom resistivity, velocity, and AVO: MSc thesis, Universityof Victoria; 165 pp.
Collett, T. S., 2002, Energy resource potential of natural gas hydrates:AAPG Bulletin, 86, 1971-1992.
Collett, T. S., Reidel, M., Cochran, J. R., Boswell, R., Presley, J.,
GEOHORIZONS December 2009/85
Kumar, P., Sathe, A., Sethi, A., Lall, M., and Sibal, V., 2008,Indian National Gas Hydrate Program: Expedition 01-initialreport, Vol. 1, Directorate General of Hydrocarbon, NewDelhi, India.
Dai, J., Xu, H., Synder, F., and Dutta, N., 2004, Detection andestimation of gas hydrates using rock physics and seismicinversion: examples from the northern deepwater Gulf ofMexico: The Leading Edge, 23, 60-66.
Dash R., 2007, Crustal structure and marine gas hydrate studiesnear Vancouver Island using seismic tomography: PhDthesis, University of Victoria, 152 pp.
Ecker, C., Dvorkin, J., and Nur, A., 2000, Estimating the amount ofgas hydrate and free gas from marine seismic data:Geophysics, 65, 565-573.
Ford, K. H., Naehr, T. H., Skilbeck, C. G., and the Leg 201 ScientificParty, 2003, The use of infrared thermal imaging to identifygas hydrate in sediment cores. In D’Hondt, S. L. Jorgensen,B. B., Miller, D. J., et al. (Eds.), Proc. ODP, Init. Rets.,201, 1-20. Online at http:www-odp.tamu.edu/publications/201_IR/VOLUME/CHAPTERS/IR201_04.PDF.
Guerin, G., Goldberg, D., 2002, Sonic waveform attenuation in gashydrate-bearing sediments from the JAPEX/JNOC/GSCMallik 2L-38 research well, Mackenzie Delta: Canada, J.Geophys. Res. 107(B5), 2088, doi10.1029/2001JB000556.
Helgerud, M. B., Dvorkin, J., Nur, A., Sakai, A., and Collett, T.,1999, Effective wave velocity in marine sediments with gashydrates: Effective medium modeling: Geophys. Res. Lett.,26, 2021-2024.
Hill, R., 1952, The elastic behavior of crystalline aggregate: Proc.Phys. Soc., London, A65, 349-354.
Holland, M., Schultheiss, P., Roberts, J., and Druce, M., 2008,Observed gas hydrate morphologies in marine sediments:Proceedings of the 6th International Conference on GasHydrates, Vancouver, BC, Canada, July 6-10.
Hyndman, R.D., Yuan, T., and Moran, K., 1999. The concentrationof deep sea gas hydrates from downhole electrical resistivitylogs and laboratory data: Earth Planet. Sci. Lett., 172:167–177. doi:10.1016/S0012-821X(99)00192-2.
Inks, T. L., and Agena, W. F., 2008, Successful gas hydrateprospecting using 3D seismic-a case study for the Mt. Elbertprospect, Milne Point, North Slope Alaska: SEG expandedabstract, 473-477.
Kumar, D., Sen, M. K., Bangs, N. L., Wang, C., and Pecher, I.,2006, Seismic anisotropy at Hydrate Ridge: Geophys. Res.Lett., 33, L01306, doi:10.1029/2005GL023945.
Kumar, D., Sen, M. K., and Bangs, N. L., 2007, Gas hydrateconcentration and characteristics within Hydrate Ridgeinferred from multicomponent seismic reflection data: J.Geophys. Res., 112, B12306, doi:10.1029/2007JB004993.
Korenga, J., Holbrook, W. S., Singh, S. C., and Minshull, T. A.,
1997, Natural gas hydrates on the southeast US margin:Constraints from full-waveform and traveltime inversion ofwide-angle seismic data: J. Geophys. Res., 102, 15345-15365.
Kvenvolden, K. A., 1999, Potential effects of gas hydrate on humanwelfare: Proceedings of the National Academy of Science,USA, 96, 3420-3426.
Lee, M. W., 2008, Models for gas hydrate-bearing sediments inferredfrom hydraulic permeability and elastic velocities: USGSScientific Investigations Report 2008-5219, 14p, online ath t tp : / /pubs .usgs .gov/s i r /2008/5219/pdf /SIR08-5219_508.pdf.
Lee, M. W., and Collett, T. S., 2006, Gas hydrate and free gassaturations estimated from velocity logs on Hydrate Ridge,offshore Oregon, USA. In Tréhu, A. M., Bohrmann, G.,Torres, M. E., and Colwell, F. S. (Eds.), Proc. ODP, Sci.Results, 204, 1-25. Online at: http://www-odp.tamu.edu/publications/204_SR/VOLUME/CHAPTERS/103.PDF.
Lee, M. W., Hutchinson, D. R., Collett, T. S., and Dillon, W. P.,1996, Seismic velocities for hydrate-bearing sediments usingweighted equation: J. Geophys. Res., 101, 20347-20358.
Lu, S., and McMechan, G. A., 2002, Estimation of gas hydrate andfree gas saturation, concentration, and distribution fromseismic data: Geophysics, 67, 582-593.
Milkov, A. V., 2004, Global estimates of hydrates-bound gas inmarine sediments: how much is really out there?: Earth-Science Reviews, 66, 183-197
Ojha, M., and Sain, K., 2007, Seismic modeling and quantificationof gas-hydrates from AVA modeling in the westerncontinental margin of India: Mar. Geophys Res., 28, 101-107.
Riedel, M., Willoughby, E. C., Chen, M. A., He, T., Novosel, I.,Schwalenberg, K.,Hyndman, R. D., Spence, G. D., Chapman,N. R., and Edwards, R. N., 2006, Proceedings of theIntegrated Ocean Drilling Program, Volume 311.
Sava, D. C., and Hardage, B. A., 2007, Gas-hydrate concentrationand uncertainty estimation from electrical-resistivity logs:Examples from Green Canyon, Gulf of Mexico: SEGexpanded abstracts, 26, 1579-1583.
Singh, S. C., Minshull, T. A., and Spence, G. D., 1993, Velocitystructure of a gas hydrate reflector: Science, 260, 204-207.
Sloan, E. D. Jr., 1998, Clathrate Hydrates of Natural Gases, MarcelDekker, New York.
Tinivella, U., 1999, A method for estimating gas hydrate and freegas concentrations in marine sediments: Boll. Geof. Teor.Appl., 40, 19-30.
Tinivella, U., and Carcione, J., 2001, Estimation of gas-hydrateconcentration and free-gas saturation from log and seismicdata: The Leading Edge, 20, 200-203.
GEOHORIZONS December 2009/86
Yuan, T., Hyndman, R. D., Spence, G. D., and Desmons, B., 1996,Seismic velocity increase and deep-sea hydrateconcentration above a bottom-simulating reflector on thenorthern Cascadia continental slope: J. Geophys. Res., 101,13655-13671.
Yun, T. S., Francisca, F. M., Santamarina, J. C., and Ruppel, C.,2005, Compressional and shear wave velocities inuncemented sediment containing gas hydrate, Geophys. Res.Lett., 32, doi:10.1029/2005GL022607.
Waite, W., Helgerud, M. B., Nur, A., Pinksto, J. C., Stern, L., andKirby, S., 2000. Laboratory measurements of compressionaland shear wave speeds through methane hydrate: In GasHydrates: Challenges for the Future, edited by G. D. Holderand P. R. Bishnoi, Ann. N.Y. Acad. Sci., 912, 1003– 1010.
Weitemeyer, K. A., Constable, S. C., Ket, K. W., and Behrens, J. P.,2005, First result from a marine control-sourceelectromagnetic survey to detect gas hydrates offshore
Oregon: Geophys. Res. Lett., 33, L03304, doi:10.1029/2005GL024896.
Westbrook, et al., 2008, Estimation of gas hydrateconcentration from multi-component seismic data atsites on the continental margins of NW Svalbard andthe Storegga region or Norway: Marine and PetroleumGeology, 25, 744-758.
Willoughby, E. C., and Edwards, R. N., 1997, On the resourceevaluation of marine gas-hydrate deposits usingseafloor compliance methods: Geophys. J. Int., 131,751-766.
Wood, W. T., Holbrook, W. S., and Hoskins, H., 2000, In situmeasurements of P-wave attenuation in the methanehydrate- and gas-bearing sediments of the Blake Ridge.In Paul, C. K., Matsumoto, R., Wallace, P. J., and Dillon,W. P. (Eds.), Proc. ODP, Sci. Results, 164, 265-272.
Corresponding author: Dhananjay Kumar([email protected])