methods of neuroimaging
DESCRIPTION
Functional NeuroimaingTRANSCRIPT

Functional neuroimaging
Imaging brain function in real time (not just thestructure of the brain).
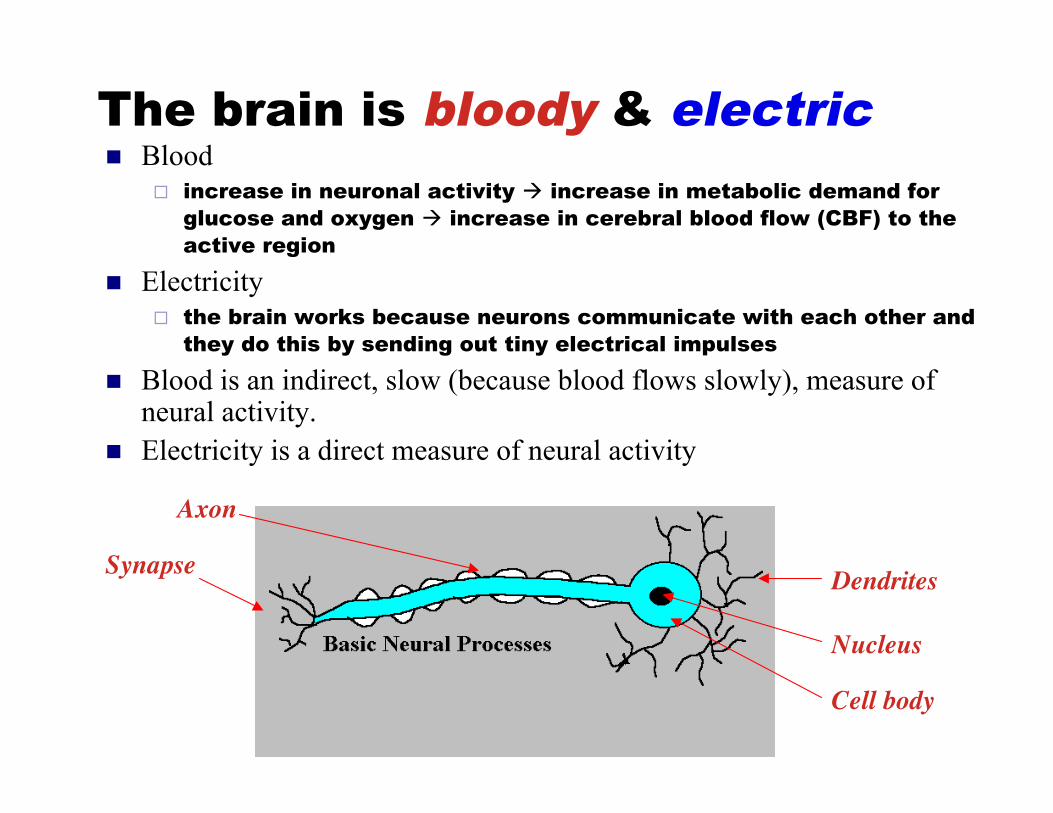
The brain is bloody & electric Blood
increase in neuronal activity increase in metabolic demand forglucose and oxygen increase in cerebral blood flow (CBF) to theactive region
Electricity the brain works because neurons communicate with each other and
they do this by sending out tiny electrical impulses
Blood is an indirect, slow (because blood flows slowly), measure ofneural activity.
Electricity is a direct measure of neural activity
Dendrites
Nucleus
Cell body
Axon
Synapse

Non-invasiverecording fromhuman brain(Functionalbrain imaging)
Positron emissiontomography (PET)
Functional magneticresonance imaging (fMRI)
Electro-encephalography(EEG)
Magneto-encephalography(MEG)
Excellent spatialresolution (~1-2mm)Poor temporalresolution (~1sec)
Poor spatialresolution (esp. EEG)Excellent temporalresolution (<1msec)
Hemodynamictechniques
Electro-magnetictechniques

Experimental designs forhemodynamic techniques

PET

PET (Positron Emission Tomography)
Radioactive labeling of some compound thatis familiar to the body (such as glucose orwater).
The radioactive material is administered to thesubject.
PET images the electromagnetic radiationinduced by the decay of the PETradioisotopes. The chosen radioactive material must have a short
half-life (must decay quickly).
PET radioisotopes emit a positron (a positively charged electron) in theprocess of decay. When this positron collides with an electron, the 2 particlesannihilate each other, and produce 2 photons traveling in opposite directions.This induces electromagnetic radiation which is what can be detectedexternally and is used to measure both the quantity and the location of thepositron emitter.

PET (Positron Emission Tomography)
Dependent measure: regional CerebralBlood Flow (rCBF).
Spatial resolution about 4mm throughoutthe brain.
Temporal resolution very bad (~30-40sec). Randomization is impossible (trials
cannot be distinguished from eachother).
Blocked design is necessary.
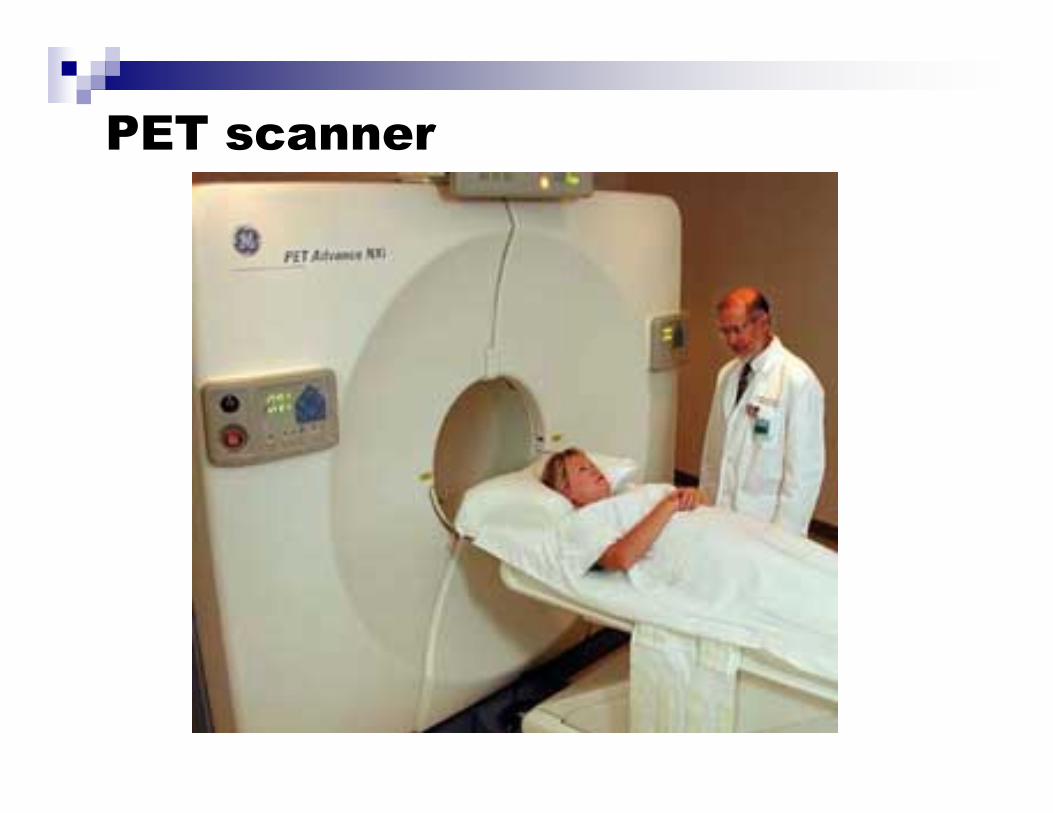
PET scanner

PET pros and cons
PRO Very good spatial resolution
CONs Basically no temporal resolution Invasive.
These days it’s hard to get human subjects approval forPET studies, given that noninvasive alternatives exist:fMRI (based on MRI).

Magnetic Resonance Imaging (MRI)and functional MRI

Basics of MRIOur bodies are mostly water and have a high concentration of hydrogen nuclei.
1. The nuclei of hydrogenatoms (called protons)normally pointrandomly in differentdirections.
1.
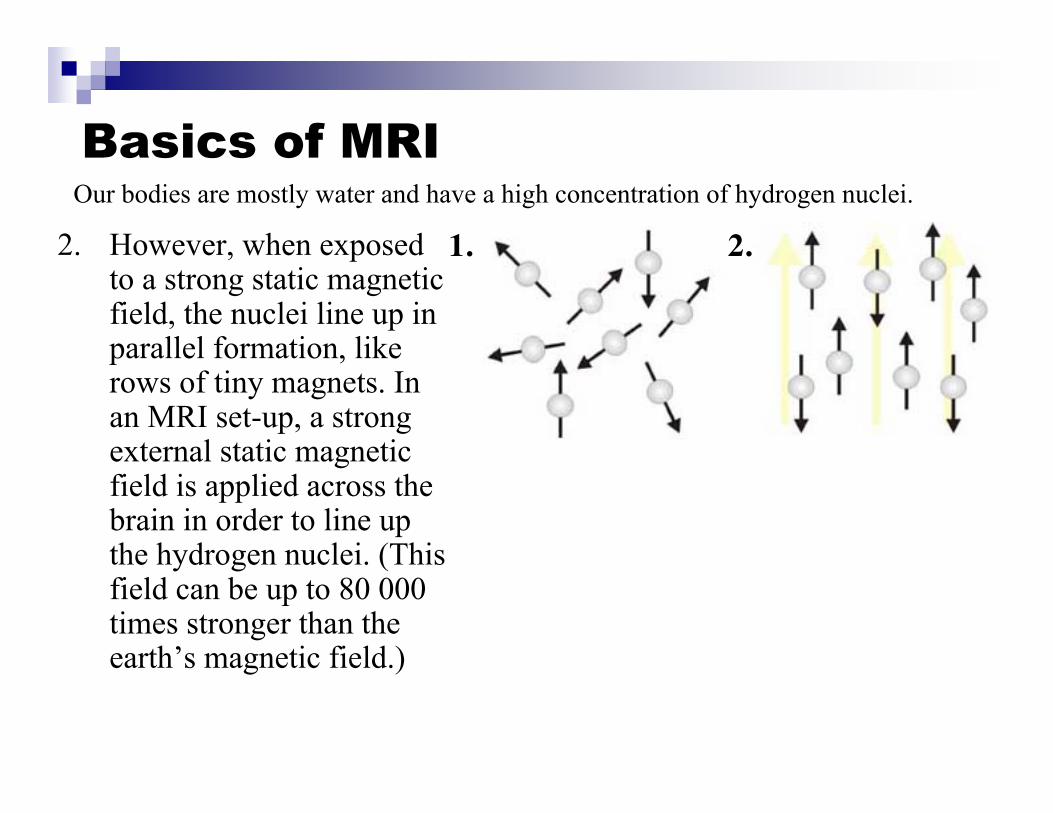
Basics of MRIOur bodies are mostly water and have a high concentration of hydrogen nuclei.
1.2. However, when exposedto a strong static magneticfield, the nuclei line up inparallel formation, likerows of tiny magnets. Inan MRI set-up, a strongexternal static magneticfield is applied across thebrain in order to line upthe hydrogen nuclei. (Thisfield can be up to 80 000times stronger than theearth’s magnetic field.)
2.
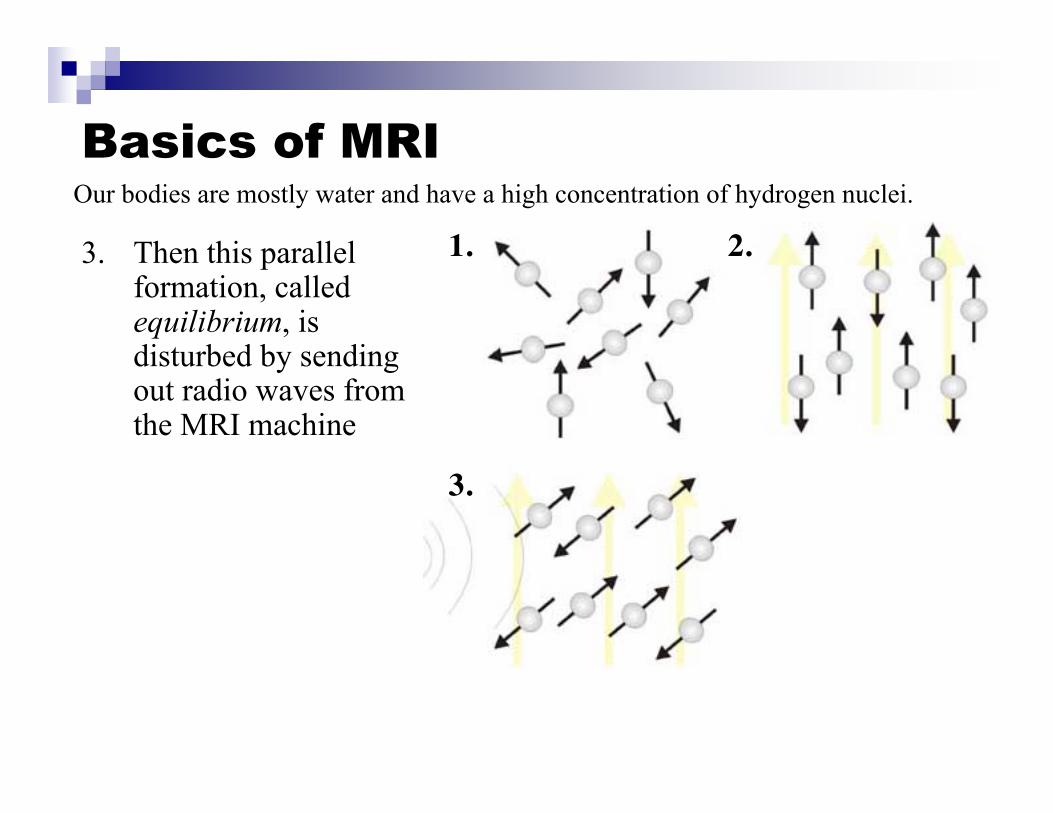
Basics of MRIOur bodies are mostly water and have a high concentration of hydrogen nuclei.
1.3. Then this parallelformation, calledequilibrium, isdisturbed by sendingout radio waves fromthe MRI machine
2.
3.

Basics of MRIOur bodies are mostly water and have a high concentration of hydrogen nuclei.
1. 2.
3.
4. As the hydrogen nucleifall back into alignment,they produce a detectableradio signal. MRI signaldecay rates (T2s) aredifferent for differentbiological tissues. Forexample, tissues thatcontain little or nohydrogen (such as bone)appear black. Those thatcontain large amounts ofhydrogen (such as thebrain) produce a brightimage.
4.

Basics of MRI
Functional MRI (fMRI)
MR has the capability to measure parametersrelated to several neural physiological functions,including: changes in various metabolic byproducts
blood flow
blood volume
blood oxygenation

Functional MRI (fMRI)
Blood Oxygenation Level Dependent (BOLD)signal Blood is more oxygenated in an activated region of
the brain than in a nonactivated region.
Oxyhemoglobin and deoxyhemoglobin differ in theirmagnetic susceptibility: Deoxy Hb has a highermagnetization decay rate than does oxy Hb.
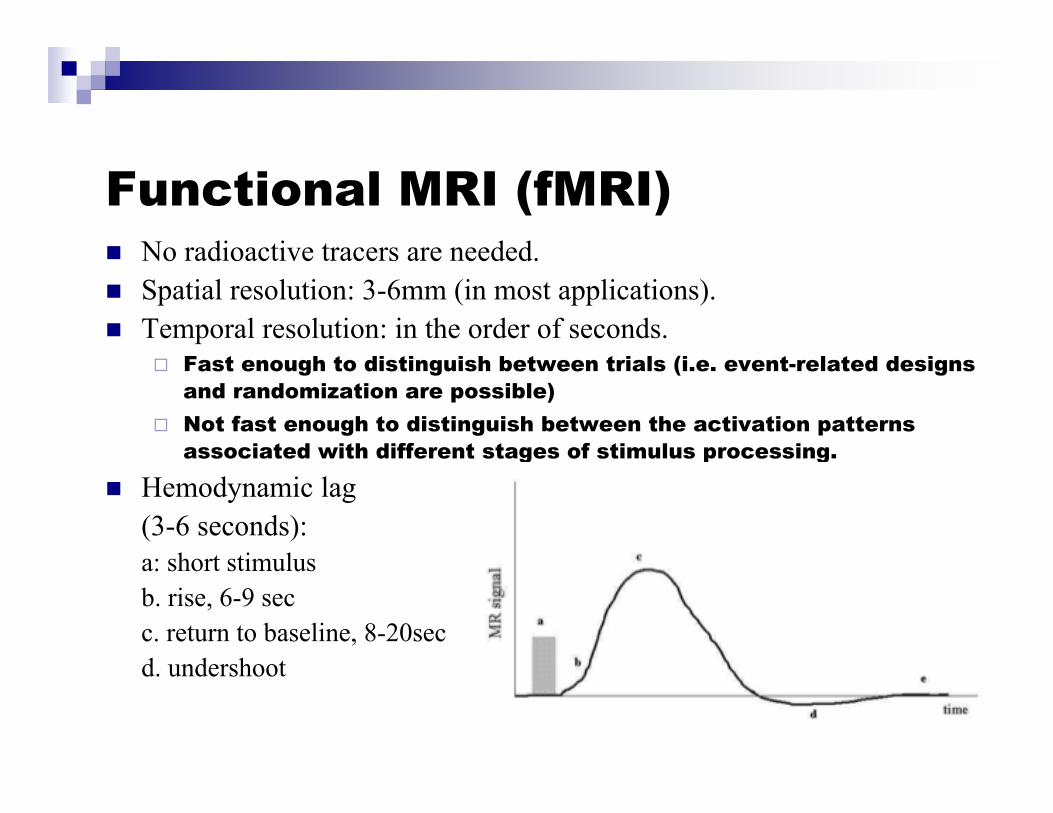
Functional MRI (fMRI) No radioactive tracers are needed. Spatial resolution: 3-6mm (in most applications). Temporal resolution: in the order of seconds.
Fast enough to distinguish between trials (i.e. event-related designsand randomization are possible)
Not fast enough to distinguish between the activation patternsassociated with different stages of stimulus processing.
Hemodynamic lag(3-6 seconds):a: short stimulusb. rise, 6-9 secc. return to baseline, 8-20secd. undershoot
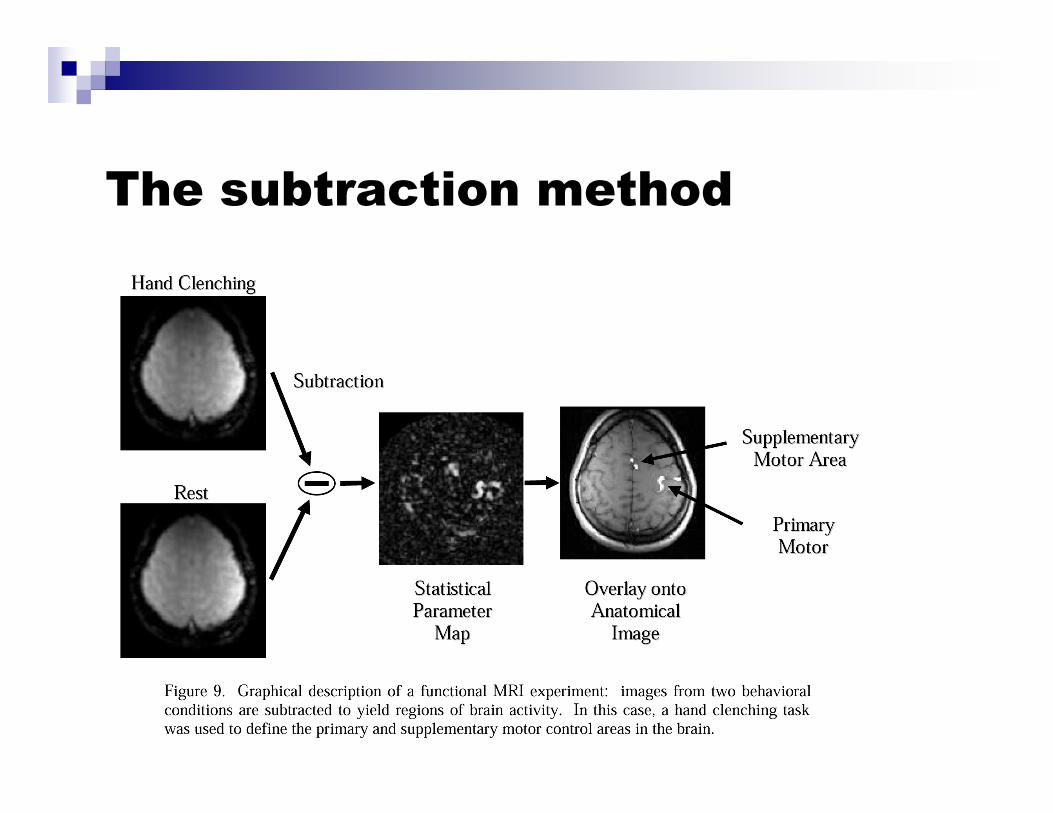
The subtraction method

Electromagnetism:Electroencephalography (EEG) and
Magnetoencephalography (MEG)
Electromagnetism
Millisecond temporal resolution. Neurons communicate with each other thousands of times
per second by sending each other tiny electrical impulses Populations of neurons are connected into networks When networks fire in synchrony, the dynamics of the
electric activity can be detected and recorded outside theskull.

Main source of the signal: Post-synaptic current flowalong the dendrites of (pyramidal) nerve cells

An electric current creates a magnetic field around it.
The right-hand rule: When the thumb of the right hand ispointing in the direction of the current, the fingers of the righthand curl in the direction of the magnetic field

Electromagnetism
EEGEEGMEGMEG
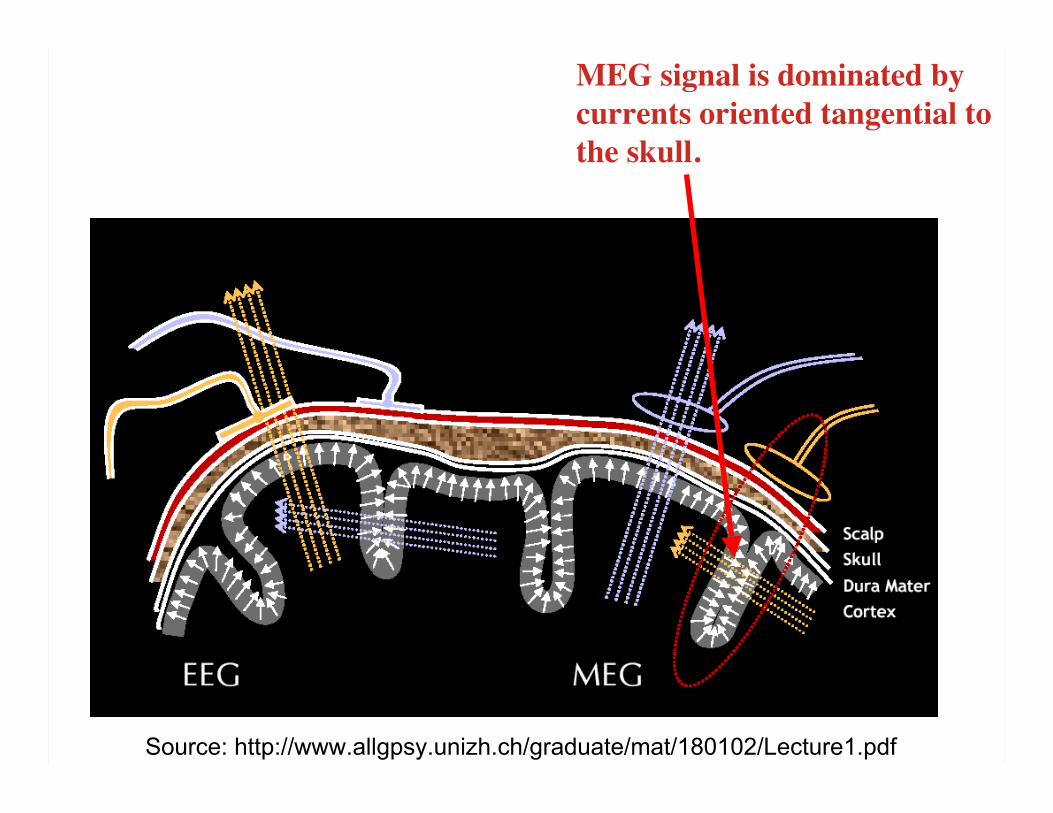
EEG (electroencephalography): electric potentials MEG (magnetoencephalography): magnetic fields

Source: http://www.allgpsy.unizh.ch/graduate/mat/180102/Lecture1.pdf
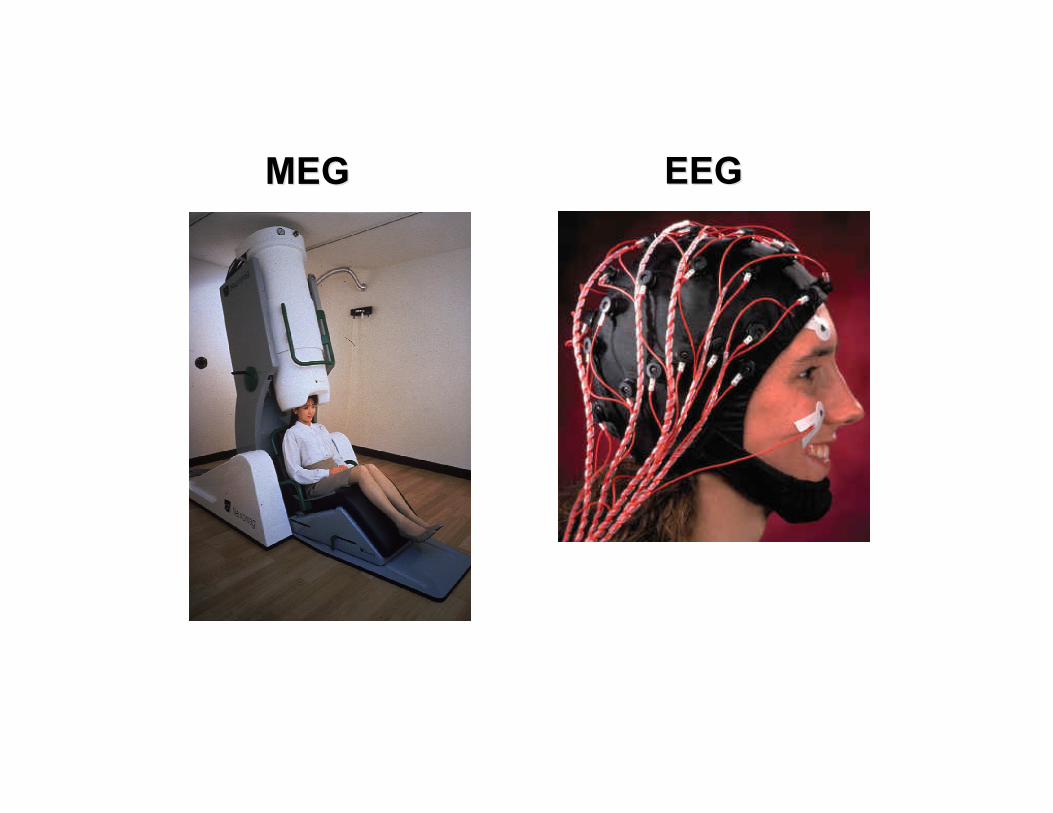
EEG electrodes on the scalp
MEG sensors outside the head,in a tank containing liquidhelium to enhancesuperconductivity
Source: http://www.allgpsy.unizh.ch/graduate/mat/180102/Lecture1.pdf
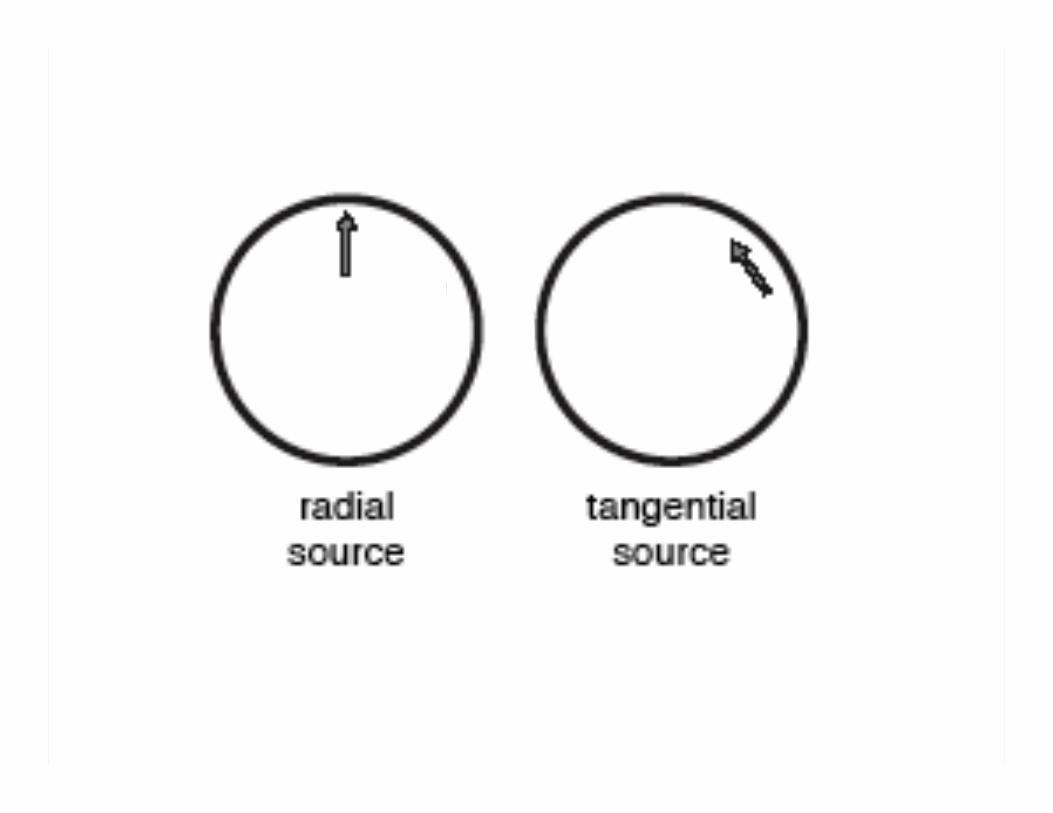
MEG signal is dominated bycurrents oriented tangential tothe skull.

Source: http://www.allgpsy.unizh.ch/graduate/mat/180102/Lecture1.pdf
Currents oriented perfectly radial tothe skull are missed in MEG. Butthere is very little signal that is soperfectly radial.
EEG picks up tangentiallyand radially orientedcurrents equally.
EEGEEGMEGMEG
http://neurocog.psy.tufts.edu/images/ERP_technique.gif

http://neurocog.psy.tufts.edu/images/ERP_technique.gif

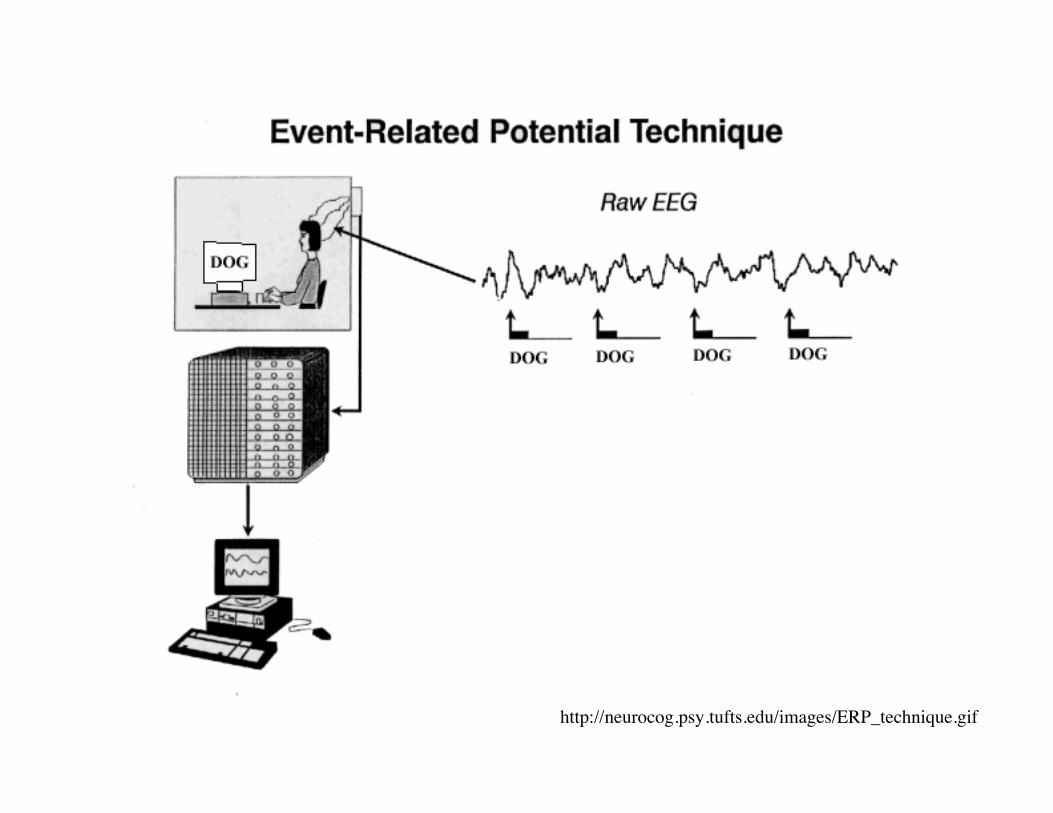
Averaging
http://neurocog.psy.tufts.edu/images/ERP_averaging.gif

http://neurocog.psy.tufts.edu/images/ERP_components.gif
Labelling of ERP components(warning: a bit confusing)
P or N: whether thecomponent is negative orpositive going.
Number after the letter:indicates the approximatepeak latency of thecomponents. 1, 2, 3, etc.are short for 100ms,200ms, 300ms and soforth.
Traditionally, negative isplotted up and positivedown.

Temporal and spatial resolution of EEG
Millisecond temporal resolution. Localization of neural generators complicated (and
usually not done). Different tissues and the skull differ in their conductivity:
Electric potentials do not pass through these structuresundistorted.
Localization requires realistic head models.

MEG
EEGEEGMEGMEG
Main advantage over EEG: better spatial resolution (millimeters forcortex, worse for deeper sources)
Magnetic fields pass through skull and various tissues undistorted. Distribution of the magnetic field around the head tells you a lot
about the underlying current generators.

The magneticfields generatedby neural activityare 100 milliontimes smallerthan the earth'smagnetic fieldand 1 milliontimes smallerthan themagnetic fieldsproduced in anurbanenvironment.

How to capture the tiny signal
Superconductive sensors Reference channels Magnetically shielded room


Reference channels
Placed somewhereclose to the head but farenough to not measureany brain activity. Signalmeasured by thereference channelsubtracted from the rawdata usually onlineduring acquisition.

Magnetically shielded room (MSR)

Magnetically shielded room (MSR)

Source: http://www.allgpsy.unizh.ch/graduate/mat/180102/Lecture1.pdf
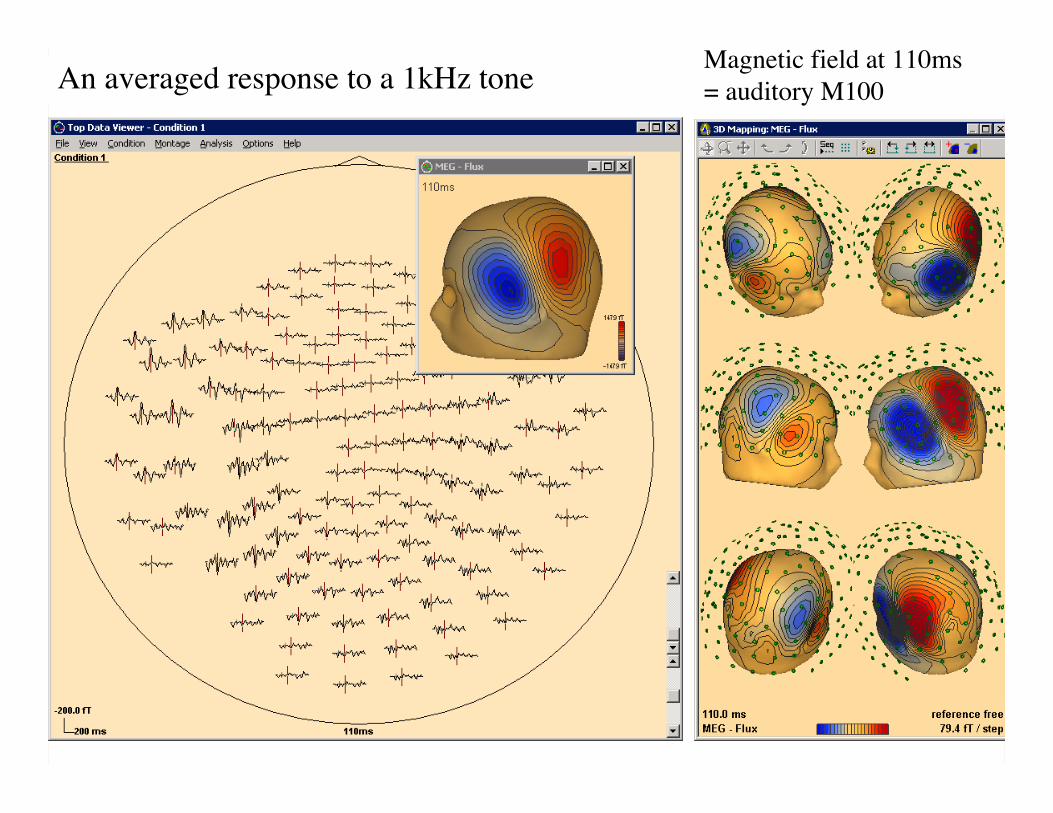
An averaged response to a 1kHz tone Magnetic field at 110ms= auditory M100

Labelling of MEG response components
M50, M100, M250, etcM50, M100, M250, etc…… M = magneticM = magnetic Like in Like in ERPsERPs, the number refers to the, the number refers to the
approximate peak latency of the componentsapproximate peak latency of the components

MEG components elicited by visual words
M100100-150ms
M170150-200ms
M250200-300ms
M350300-400ms
Averaged response tovisual words
100 170 250 350
We can analyze:
- either the sensor data (on the left)
- or the activity of the currents underlying the magneticfields. The locations and orientations of these currents haveto be modeled on the basis of the magnetic fielddistribution.
- Estimating the current source that generates a givenmagnetic field is called the inverse problem

The single dipole modelThe single dipole model
A discrete source model. Assumes that activity is generated not by a patch ofcortex, but by point source. A good way to reduce the spatial dimensionality ofthe data. Each dipole acts as a spatial filter on the data.

MEG components elicited by visual wordsDipole models
M100 M170 M250 M350100-150ms 150-200ms 200-300ms 300-400ms
Averaged response tovisual words
100 170 250 350