methods of research and enquiry developing research plan - quantitative by dr. daniel churchill
TRANSCRIPT

Methods of Research and Enquiry
Developing Research Plan - Quantitativeby Dr. Daniel Churchill

R&
D i
n I
T i
n E
du
cati
on
Admin Matters
Classes originally scheduled for 1st and 8th August will move to 4th and 11th of July.

R&
D i
n I
T i
n E
du
cati
on
Let’s Check on your Group Blogs… Let’s have your presentations and some
discussion about reviews

R&
D i
n I
T i
n E
du
cati
on
Content of this lesson is largely based on Chapters 2, 3 and 4 from the recommended book for the module: Gay, L. R., Mills, G. E., & Airasian, P. (2006).
Educational Research: Competencies for Analysis and Applications. Upper Saddle River, N.J. : Pearson/Merrill Prentice Hall
Some slides are from the presentations by the book authors
R&
D i
n I
T i
n E
du
cati
on
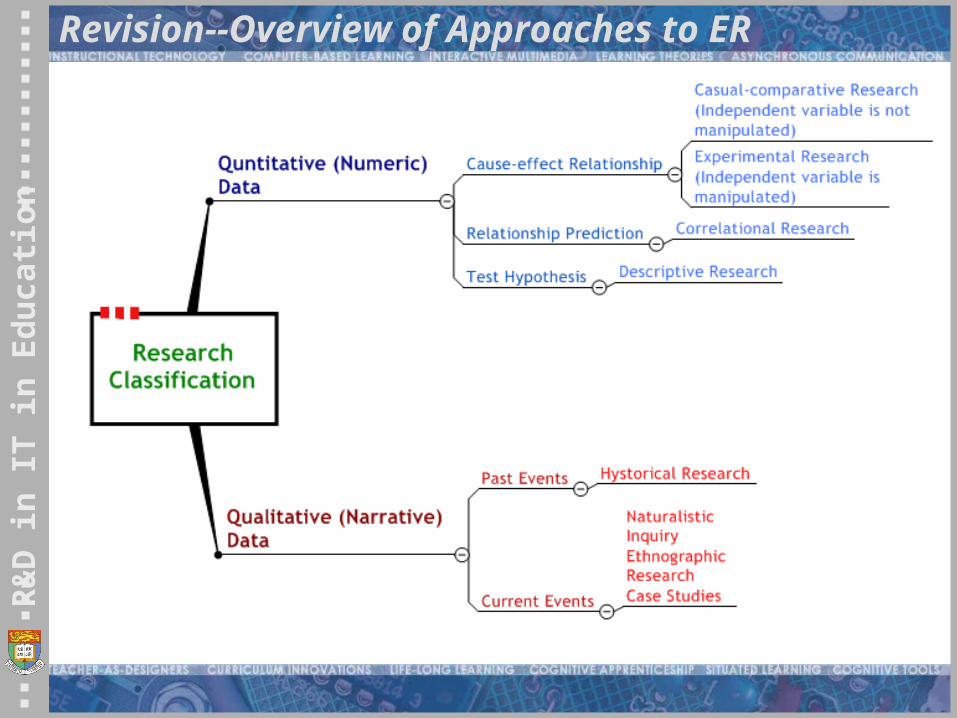
Revision--Overview of Approaches to ER

R&
D i
n I
T i
n E
du
cati
on
Selecting Quantitative Methodology
A quantitative research question includes variables of interest to the researcher, relationship between the variables and type of subjects involved, e.g., The relationship between intelligence (var a)
and computer use (var b) in a secondary school science class.

R&
D i
n I
T i
n E
du
cati
on
A Research Plan
General components of a research plan A justification for the hypotheses or exploration of the
research problem A detailed presentation of the steps to be followed in
conducting the study
Purposes of a written research plan Forces the researcher to think through every aspect of
the study Facilitates the evaluation of the proposed study Provides detailed procedures to guide the conduct of
the study
Obj. A.1

R&
D i
n I
T i
n E
du
cati
on
Quantitative Research Plans
Four major components Introduction = Abstract Method = Procedure Data analysis Timeline and budget
Obj. 3.1

R&
D i
n I
T i
n E
du
cati
on
Quantitative Research Plans Introduction -- three sections
Statement of the topic The topic is identified with a discussion of the
background and rationale = why it is important in this topic.
Review of the literature Provides an overview of the topic and positions the
study in the context of what is known, and, more importantly, what is not known about the topic. (Don’t have too many literatures)
Statement of the hypotheses (prove the hypothesis) A formal statement specifying the hypothesis, support
for expected relationships between variables, and operational definitions of all variables.

R&
D i
n I
T i
n E
du
cati
on
Defining Hypotheses
A hypothesis is a researcher’s preliminary prediction of the results of the research.
The research aims to test a hypothesis. Example:
Secondary 1 mathematics students whose teachers use visual representations as a part of their instructional technique will exhibit significantly higher understanding of algebra than the students…

R&
D i
n I
T i
n E
du
cati
on
Selecting Method From a question you can identify a kind of quantitative
research based on the following formulas:
[variable X], [variable Y], and [variable Z] among [type of subjects] descriptive research.
The relationship between [variable X] and [variable Y] among [type of subjects] correlational research.
The effect of [independent variable not under experimenter's control] on [dependent variable] for [type of subjects] causal-comparative research.
The effect of [independent variable X under experimenter's control] on [dependent variable Y] for [type of subjects] experimental research.

R&
D i
n I
T i
n E
du
cati
on
Types of Quantitative Hypotheses
Research hypotheses state the expected relationship between two variables
Non-directional – no relationship or difference exists between the variables
Directional – there is expected direction of the relationship or difference between variables
Null – a statistical statement that no statistically significant relationship or difference exists between variables
Let’s change our example into different types of hypotheses: Secondary 1 mathematics students whose teachers
use visual representations as a part of their instructional technique will exhibit significantly higher understanding of algebra.

R&
D i
n I
T i
n E
du
cati
on
Stating Hypotheses Formats for quantitative experimental studies
P who get X do better on Y than P who do not get X P represents the participant X represents the treatment Y represents the outcome
Testing hypotheses Statistical analysis of data Importance of the results regardless of the outcome Results support or fail to support hypotheses, but
they never prove or disprove hypotheses
Obj. 5.7 & 5.9

R&
D i
n I
T i
n E
du
cati
on
Quantitative Research Plans Method -- five major sections
Participants Instruments Design Procedures = how to going to do the analysis? Data analyses
Obj. 3.3

R&
D i
n I
T i
n E
du
cati
on
Method Participants
Characteristics of the population and sample as well as the sampling technique used.
Quantitative studies typically use large samples and probability sampling techniques.
Obj. 3.3
R&
D i
n I
T i
n E
du
cati
on
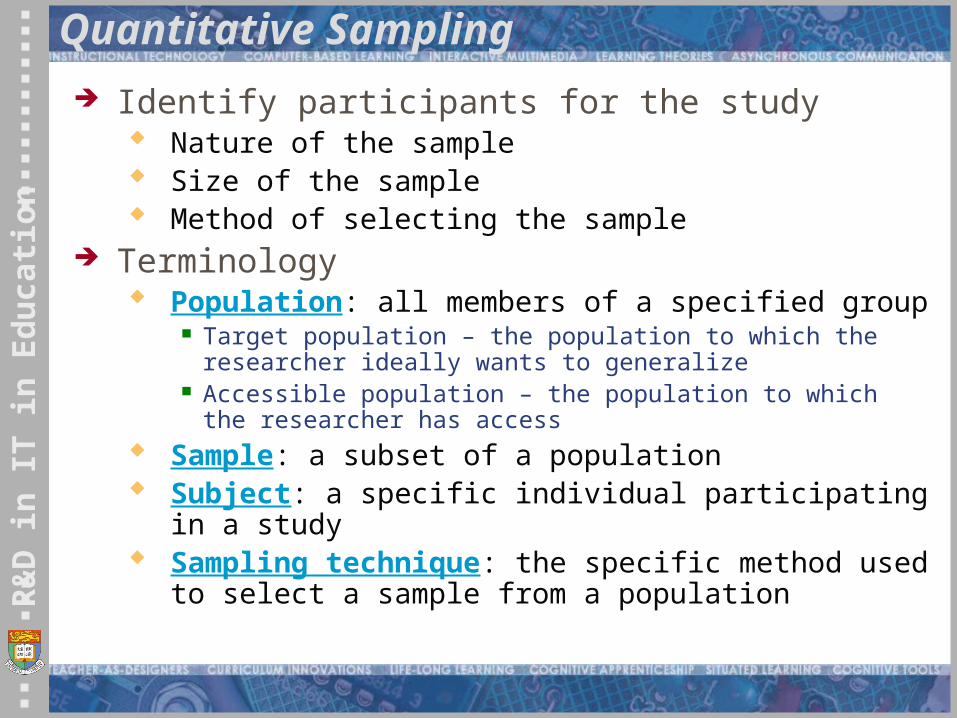
Quantitative Sampling
Identify participants for the study Nature of the sample Size of the sample Method of selecting the sample
Terminology Population: all members of a specified group
Target population – the population to which the researcher ideally wants to generalize
Accessible population – the population to which the researcher has access
Sample: a subset of a population Subject: a specific individual participating in a study Sampling technique: the specific method used to
select a sample from a population

R&
D i
n I
T i
n E
du
cati
on
Quantitative Sampling Terminology
Representation – the extent to which the sample is representative of the population.
Demographic characteristics/characteristics population you want to representation of your research.
Personal characteristics/characteristics population you want to representation of your research.
Specific traits
Generalization – the extent to which the results of the study can be reasonably extended from the sample to the population.
Sampling error – when randomly selected sample is not representative of the population.
Sampling bias, e.g.,: Use data returned from only 25% of those sent a questionnaire. Obj. 1.4

R&
D i
n I
T i
n E
du
cati
on
Quantitative Sampling
Three fundamental steps Identify a population Define the sample size Select the sample
Obj. 1.5

R&
D i
n I
T i
n E
du
cati
on
Quantitative Sampling
General rules for sample size As many subjects as possible Thirty (30) subjects per group for
correlational, causal-comparative, and true experimental designs
Ten (10) to twenty (20) percent of the population for descriptive designs
For population of less than 100, use the entire population
If the population is about 500, sample 50% If the population is about 1,500, sample 20% If the population is larger than 5,000, sample
400 (large population will have less sample.)

R&
D i
n I
T i
n E
du
cati
on
Random Samples or Probability Sampling Random
Selecting subjects so that all members of a population have an equal and independent chance of being selected
Stratified random Selecting subjects so that relevant subgroups in the
population (i.e., strata) are guaranteed representation
Cluster Selecting subjects by using groups that have similar
characteristics and in which subjects can be found Neighborhoods (e.g.,School districts, Schools, Classrooms)
Systematic Selecting every Kth subject from a list of the members of the
population
Obj. 1.7

R&
D i
n I
T i
n E
du
cati
on
Random Samples Proportional and non-proportional (i.e., equal
size) Proportional – same proportion of subgroups in the sample
as in the population If a population has 45% females and 55% males, the sample
should have 45% females and 55% males Non-proportional – different, often equal, proportions of
subgroups Selecting the same number of children from each of the five
grades in a school even though there are different numbers of children in each grade
Obj. 3.4

R&
D i
n I
T i
n E
du
cati
on
Non-Random Samples
Known as non-probability sampling. Use of methods that do not have random
sampling at any stage. Useful when the population cannot be
described. Three techniques
Convenience – Volunteers, Pre-existing groups. Purposive Selection -- based on the researcher’s
experience and knowledge of the individuals being sampled.
Quota -- based on the exact characteristics and quotas of subjects in the sample when it is impossible to list all members of the population.

R&
D i
n I
T i
n E
du
cati
on
Method Instruments
Descriptions of the specific measures of each variable, the technical characteristics of the instruments, and the administration and scoring techniques
Quantitative studies typically use non-interactive instruments (Tests, Questionnaires and Surveys)
Obj. 3.3
R&
D i
n I
T i
n E
du
cati
on
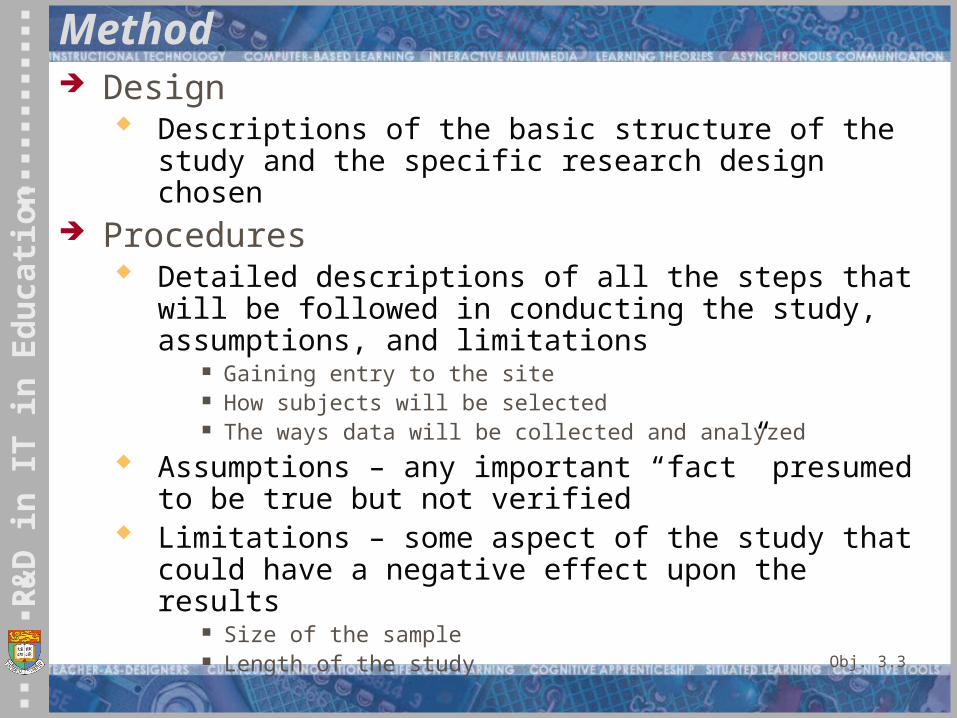
Method Design
Descriptions of the basic structure of the study and the specific research design chosen
Procedures Detailed descriptions of all the steps that will be
followed in conducting the study, assumptions, and limitations
Gaining entry to the site How subjects will be selected The ways data will be collected and analyzed
Assumptions – any important “fact” presumed to be true but not verified
Limitations – some aspect of the study that could have a negative effect upon the results
Size of the sample Length of the study
Obj. 3.3

R&
D i
n I
T i
n E
du
cati
on
Method Data analysis
Descriptions of the techniques used to analyze the data Descriptive statistics – statistics that summarize
data in terms of central tendency (e.g., means), variation (e.g., standard deviations), relative position (e.g., standard scores), or relationships (e.g., correlations)
Inferential statistics – procedures used to infer the likelihood of the results happening in the population rather than just the sample
Obj. 3.3 & 3.4

R&
D i
n I
T i
n E
du
cati
on
Quantitative Research Plans Timeline
Description of the major activities and corresponding anticipated completion dates
Help assess the feasibility of conducting the study The resulting structure helps avoid procrastination A general strategy is to allow more time than you
initially think you will need!!!
Budget Descriptions of anticipated costs that are likely to be
incurred Optional in many plans
Obj. 3.5 & 3.6

R&
D i
n I
T i
n E
du
cati
on
Ethical issues Ask participants to acceptance to participant in
the study Provide the participant with Plain Language
Statement containing; Information about the objectives of the study; Data collection methods; Right to withdraw from the study; Access preliminary data, analysis and report ; Explanations of the participants’ role and
responsibilities will be; That the participant’s identity will not be disclosed and
acronyms will be used for his/her name, and Inform the participant that data will be used for the
purpose of the study and possible journal publications

R&
D i
n I
T i
n E
du
cati
on
Ethical issues Inform the participant when collecting data When writing report the researcher will ensure
that the audience will be able to distinguish between data and interpretations.
The researcher will remain unbiased in respect to collected data and will acknowledge if any biases cannot be controlled.
Let’s check this site: http://www.hku.hk/rss/HREC.htm (include in your research plan)

R&
D i
n I
T i
n E
du
cati
on
Validity and reliability issues Concept of Validity and reliability is different
for Qualitative and Quantitative studies In Quantitative Research:
The concept of reliability has to do with how well have you carried out your research project. Have you carried it out in such a way that, if another researcher were to look into the same questions in the same setting, they would come up with essentially the same results (though not necessarily an identical interpretation). If so, then your work might be judged reliable.
Validity has to do with whether your methods, approaches and techniques relate to, or measure, the issues you have been exploring.

R&
D i
n I
T i
n E
du
cati
on
Evaluation of a Research Plan
Informal assessment Critiques by the researcher, advisors, peers and
colleagues, etc. Critiques by experienced researchers
Formal assessment Field tests Pilot studies
Modifications based on the results of both informal and formal evaluations
Obj. 5.1 & 5.2

R&
D i
n I
T i
n E
du
cati
on
Task
Identify and evaluate one computer tool that can be used to facilitate research.
Atlas.ti SPSS HyerRESEARCHER Nudist EndNote MS Project