metlife, inc. annual report · metlife, inc. annual report. chairman’s letter ... conning, which...
TRANSCRIPT

MetLife, Inc. Annual Report

chairman’s letterTo MetLife Shareholders:
MetLife’s corporate vision—to build financial freedom for everyone—guides our response to people’s
growing need for first-rate financial products and services through various life stages and economic
cycles. Our trusted brand, capital strength, and existing relationships with nine million U.S. households
and 70,000 corporations representing 33 million individuals uniquely position MetLife among its competi-
tors. We plan to become the recognized leader throughout the world for relationship building, connect-
edness and caring in financial services, serving 100 million customers by 2010. We have the talent and
resources to succeed in this effort.
The ‘‘everyone’’ in our vision took on added meaning in 2000 as we welcomed an important new
constituency: you, our shareholders.
MetLife transformed itself from mutual to stock ownership in April 2000 through a demutualization and initial public offering that was
completed just 18 months after Board authorization. The transaction raised $5.2 billion and made MetLife America’s most widely held
stock. We are proud to report our annual results for the first time as a public company.
H Operating Earnings Increase 18%
For the year 2000, MetLife’s after-tax operating earnings increased 18%, to $1.54 billion from adjusted operating earnings of $1.31
billion in 1999. Diluted operating earnings per share for 2000 were $1.96, on a pro forma basis. Operating return on equity increased to
10.5% for the year, from adjusted operating return on equity of 9.5% in 1999.
Most lines of business contributed to this strong performance. Operating earnings from Individual Business rose 38%. The continuing
integration of GenAmerica Financial, the St. Louis-based insurer acquired by MetLife through a transaction completed in January 2000,
was a major contributor to the year’s growth.
Institutional Business maintained its market leadership across product lines; however, revenue increases were partially offset by a
planned increase in spending on technology and customer service improvements to support future growth. As a result, the increase in
operating earnings was 4%.
MetLife Auto & Home’s operating earnings were down 20% due to higher catastrophe losses and the cost of integrating The St. Paul
Companies personal lines property and casualty business. However, The St. Paul Companies’ business contributed to a 27% increase in
written premiums, which should bode well for future growth.
International operations showed a 39% improvement in operating earnings, thanks to stronger growth in South Korea and Mexico.
With new licenses to do business in Poland and the Philippines, and continuing efforts to enter markets in India and China, we expect
steady growth in our International operations over the next several years.
Reinsurance, a new line of business created through MetLife’s 59% ownership in Reinsurance Group of America (NYSE:RGA), part of
the GenAmerica acquisition, contributed $72 million in operating earnings.
In our asset management business, we sold the 48% interest we held in Nvest for $858 million, and made Conning Corporation a
wholly-owned subsidiary. We acquired a majority interest in Conning through our purchase of GenAmerica Financial and bought the
remaining shares outstanding in a tender offer. Going forward, our growth in the asset management field will be focused through
Conning, which serves insurance companies and institutions, and through State Street Research & Management Company, another
wholly-owned subsidiary, which serves both institutional and individual investors. As a result of the Nvest sale, total assets under
management decreased by 19% to $302.2 billion.
H Expense Management Through Consolidation and Integration
The on-going integration of GenAmerica Financial and New England Financial is creating greater efficiencies and economies of scale.
Our goal of supporting all our brands from a common platform—including administrative and investment support services, business
processes, product development, compliance standards and compensation and benefits packages—is nearly realized.
Expense management remains one of MetLife’s highest priorities. We continued to consolidate sales offices, reducing the total
number by 21%, and to raise the bar for office and agent productivity.
H Technology Solutions Improve Service and Efficiency
MetLife invested $395 million in new information technology initiatives in 2000, with 50% of application development resources
devoted to re-engineering core business processes and converting and integrating Web-based e-Business and financial systems.
Before gaining approval for funding, every non-essential project underwent a rigorous return-on-investment analysis to be sure it met or
exceeded a minimum 15% standard.

Our Institutional e-Business team successfully developed a series of portals to give employers, employees, providers and selected
consultants a combination of on-line information and transaction capabilities designed to make benefits programs more convenient and
manageable. In Individual Business, we upgraded and standardized sales office technology and re-engineered a number of administra-
tive processes as we developed effective Web-based functionality for both agents and customers. These capabilities, which will
continue to be rolled out through 2001 and beyond, will increase the ways people can elect to connect with MetLife and enable our
financial services representatives to spend more time on customer relationship building.
H New Paths to Growth
MetLife took great strides last year toward being able to offer customers a more diversified range of financial services. In August, we
agreed to acquire Grand Bank, N.A. of Kingston, New Jersey. On February 12, 2001, the Federal Reserve Board approved MetLife’s
applications for bank holding company status and financial holding company status along with the acquisition. The Reserve’s approval
made us the first insurance company to purchase a bank since the Congressional passage of the Gramm-Leach-Bliley Act, which paved
the way for banks, insurance companies, investment banks and other financial institutions to operate as affiliate companies under the
financial holding company umbrella. MetLife will now be able to offer customers—including those who are beneficiaries of insurance
claims—alternatives for managing their money and reaching their goals.
We also plan to pursue supplemental distribution channels for MetLife products—particularly variable annuities—through banks,
broker-dealers and financial planners. MetLife Investors Group, a new franchise that unites the strengths of Security First Group, Cova,
and the supplemental distribution at New England Financial, was formed in 2000 to establish and extend these relationships.
H Growing a High Performance Company
Our performance management process completed its second year in 2000, clarifying performance expectations and increasing the
financial incentives for top performers. By linking compensation with results, we have succeeded in retaining our best people. For the
second consecutive year, less than 6% of MetLife’s top performers have left the company, while 37% of low performers are gone. As our
new stock-based compensation plan takes effect over the next two years, we will continue to assure that shareholder and employee
interests are aligned.
According to the MetLife Employee Survey 2000, 88% of respondents agree with the statement, ‘‘I am willing to exert the extra effort
required to help this company succeed in the future.’’ Clearly, MetLife associates are meeting the challenges of our cultural shift to a
performance-oriented company.
H Welcome and Thanks
Effective December 19, 2000, former U.S. Senator John C. Danforth was elected as a Director of MetLife, Inc. and its subsidiary,
Metropolitan Life Insurance Company. Representing Missouri in the Senate from 1976 to 1995, Senator Danforth served on the Finance,
Commerce and Intelligence Committees. Currently a partner at Bryan Cave LLP, a St. Louis law firm, Senator Danforth fills the Board
vacancies created by the retirement of Robert G. Schwartz, who served as Chairman, President and CEO of Metropolitan Life Insurance
Company from 1989 to 1993. We extend our sincere gratitude and best wishes to Mr. Schwartz and a warm welcome to Senator
Danforth.
H Visit www.metlife.com
Rather than producing and delivering a glossy and expensive Annual Report to our very large shareholder base, we have deliberately
streamlined this publication to manage its cost on your behalf. We invite you to visit our Web site at www.metlife.com for the most
current information on the company’s products, services and results.
Building on our strong start, MetLife intends to deliver value and world class service to all those who entrust their money with us.
Notwithstanding our revised 2001 earnings guidance announced on March 13, our primary measurements of shareholder success will be
continued 15% annual growth in operating earnings each year through 2002, and an 11.5% return on equity by 2002. Stay with us for
what promises to be an exciting and profitable time ahead.
Sincerely,
Robert H. BenmoscheChairman of the Board and Chief Executive OfficerMarch 16, 2001

Cautionary Statement on Forward-Looking Statements
This Annual Report, including the Management’s Discussion and Analysis of Financial Condition and Results of Operations, contains statementswhich constitute forward-looking statements within the meaning of the Private Securities Litigation Reform Act of 1995, including statements relating totrends in operations and financial results and the business and the products of MetLife, Inc. and its subsidiaries (the ‘‘Company’’), as well as otherstatements including words such as ‘‘anticipate,’’ ‘‘believe,’’ ‘‘plan,’’ ‘‘estimate,’’ ‘‘expect,’’ ‘‘intend’’ and other similar expressions. Forward-lookingstatements are made based upon management’s current expectations and beliefs concerning future developments and their potential effects on theCompany. Such forward-looking statements are not guarantees of future performance.
Actual results may differ materially from those included in the forward-looking statements as a result of risks and uncertainties including, but notlimited to the following: (i) changes in general economic conditions, including the performance of financial markets and interest rates; (ii) heightenedcompetition, including with respect to pricing, entry of new competitors and the development of new products by new and existing competitors; (iii) theCompany’s primary reliance, as a holding company, on dividends from its subsidiaries to meet debt payment obligations and the applicable regulatoryrestrictions on the ability of the subsidiaries to pay such dividends; (iv) catastrophe losses; (v) regulatory, accounting or tax changes that may affect thecost of, or demand for, the Company’s products or services; (vi) downgrades in the Company’s financial strength ratings; (vii) discrepancies betweenactual claims experience and assumptions used in setting prices for the Company’s products and establishing the liabilities for the Company’s obligationsfor future policy benefits and claims; (viii) adverse litigation or arbitration results; and (ix) other risks and uncertainties described from time to time in theCompany’s filings with the Securities and Exchange Commission, including its S-1 registration statements. The Company specifically disclaims anyobligation to update or revise any forward-looking statement, whether as a result of new information, future developments or otherwise.
Selected Financial Data.
The following table sets forth selected consolidated financial information for the Company. The consolidated financial information for the years endedDecember 31, 2000, 1999 and 1998 and at December 31, 2000 and 1999 has been derived from the Company’s audited consolidated financialstatements included elsewhere herein. The consolidated financial information for the years ended December 31, 1997 and 1996 and at December 31,1998, 1997 and 1996 has been derived from the Company’s audited consolidated financial statements not included elsewhere herein. The followingconsolidated statements of income and consolidated balance sheet data, other than the statutory data, have been prepared in conformity with GAAP.The statutory data have been derived from Metropolitan Life’s Annual Statements filed with insurance regulatory authorities and have been prepared inaccordance with statutory accounting practices. The following information should be read in conjunction with and is qualified in its entirety by theinformation contained in ‘‘Management’s Discussion and Analysis of Financial Condition and Results of Operations,’’ and the consolidated financialstatements appearing elsewhere herein.
For the years ended December 31,
2000 1999 1998 1997 1996
(Dollars in millions)
Statements of Income DataRevenues
Premiums ************************************************************* $16,317 $12,088 $11,503 $11,278 $11,345Universal life and investment-type product policy fees ************************ 1,820 1,433 1,360 1,418 1,243Net investment income(3)(4) ********************************************** 11,768 9,816 10,228 9,491 8,978Other revenues ******************************************************** 2,432 2,154 1,994 1,491 1,246Net investment (losses) gains(5)******************************************* (390) (70) 2,021 787 231
Total revenues(1)(2) 31,947 25,421 27,106 24,465 23,043
ExpensesPolicyholder benefits and claims(6) **************************************** 16,893 13,100 12,638 12,403 12,432Interest credited to policyholder account balances *************************** 2,935 2,441 2,711 2,878 2,868Policyholder dividends*************************************************** 1,919 1,690 1,651 1,742 1,728Payments to former Canadian policyholders(1)******************************* 327 — — — —Demutualization costs *************************************************** 230 260 6 — —Other expenses(4)(7) **************************************************** 8,227 6,755 8,019 5,771 4,609
Total expenses(1)(2) 30,531 24,246 25,025 22,794 21,637
Income before provision for income taxes *************************************** 1,416 1,175 2,081 1,671 1,406Provision for income taxes(8) *********************************************** 463 558 738 468 482
Income before discontinued operations*************************************** 953 617 1,343 1,203 924Loss from discontinued operations(9) **************************************** — — — — (71)
Net income************************************************************** $ 953 $ 617 $ 1,343 $ 1,203 $ 853
Net income after April 7, 2000 (date of demutualization)************************* $ 1,173
MetLife, Inc.1

At December 31,
2000 1999 1998 1997 1996
(Dollars in millions)
Balance Sheet DataGeneral account assets(4)************************************************** $184,768 $160,291 $157,278 $154,444 $145,877Separate account assets*************************************************** 70,250 64,941 58,068 48,338 43,399
Total assets ************************************************************** $255,018 $225,232 $215,346 $202,782 $189,276
Liabilities:Life and health policyholder
liabilities(10) ********************************************************** $140,896 $122,637 $122,726 $125,849 $121,333Property and casualty policyholder liabilities(10) ****************************** 2,559 2,318 1,477 1,509 1,562Short-term debt ******************************************************** 1,094 4,208 3,585 4,587 3,311Long-term debt********************************************************* 2,426 2,514 2,903 2,884 1,946Separate account liabilities *********************************************** 70,250 64,941 58,068 48,338 43,399Other liabilities(4)******************************************************** 20,314 14,924 11,720 5,608 5,742
Total liabilities************************************************************* 237,539 211,542 200,479 188,775 177,293
Company-obligated mandatorily redeemable securities of subsidiary trusts********** 1,090 — — — —
Stockholders’ Equity:Common Stock, at par value ********************************************* 8 — — — —Additional paid-in capital(11) ********************************************** 14,926 — — — —Retained earnings(11)**************************************************** 1,021 14,100 13,483 12,140 10,937Treasury stock, at cost*************************************************** (613) — — — —Accumulated other comprehensive income (loss)***************************** 1,047 (410) 1,384 1,867 1,046
Total stockholders’ equity*************************************************** 16,389 13,690 14,867 14,007 11,983
Total liabilities and stockholders’ equity *************************************** $255,018 $225,232 $215,346 $202,782 $189,276
At or for the years ended December 31,
2000 1999 1998 1997 1996
(Dollars in millions, except per share data)
Other DataOperating income(5)(12)******************************************** $ 1,541 $ 990 $ 23 $ 617 $ 818Adjusted operating income(5)(13) ************************************** $ 1,541 $ 1,307 $ 1,226 $ 807 $ 921Operating return on equity(14)*************************************** 10.5% 7.2% 0.2% 5.3% 7.8%Adjusted operating return on equity(15) ******************************* 10.5% 9.5% 9.6% 7.0% 8.8%Return on equity(16)*********************************************** 6.5% 4.5% 10.5% 10.4% 8.1%Operating cash flows ********************************************** $ 1,326 $ 3,865 $ 842 $ 2,872 $ 3,688Total assets under management(17)********************************** $302,181 $373,646 $360,703 $338,731 $297,570
Statutory Data(18)Premiums and deposits ******************************************** $ 23,536 $ 24,643 $ 22,722 $ 20,569 $ 20,611Net income ****************************************************** $ 1,027 $ 790 $ 875 $ 589 $ 460Policyholder surplus *********************************************** $ 7,213 $ 7,630 $ 7,388 $ 7,378 $ 7,151Asset valuation reserve ******************************************** $ 3,205 $ 3,109 $ 3,323 $ 3,814 $ 2,635
Earnings Per Share Data(19)Basic earnings per share******************************************* $ 1.52 N/A N/A N/A N/ADiluted earnings per share****************************************** $ 1.49 N/A N/A N/A N/A
Adjusted Operating Earnings Per Share Data(20)Basic earnings per share******************************************* $ 1.99 N/A N/A N/A N/ADiluted earnings per share****************************************** $ 1.96 N/A N/A N/A N/A
Dividends Declared Per Share ************************************* $ 0.20 N/A N/A N/A N/A
MetLife, Inc.2

(1) Includes the following combined financial statement data of the Company’s controlling interest in Nvest Companies L.P. and its affiliates, which weresold in 2000, MetLife Capital Holdings, Inc., which was sold in 1998, and the Company’s Canadian operations and U.K. insurance operations,substantially all of which were sold in 1998 and 1997:
For the years ended December 31,
2000 1999 1998 1997 1996
(Dollars in millions)
Total revenues ******************************************** $524 $655 $1,405 $2,149 $1,890
Total expenses******************************************** $492 $603 $1,275 $1,870 $1,412
As a result of these sales, investment gains of $663 million, $520 million and $139 million were recorded for the years ended December 31, 2000,1998 and 1997, respectively.
In July 1998, Metropolitan Life sold a substantial portion of its Canadian operations to Clarica Life. As part of that sale, a large block of policies ineffect with Metropolitan Life in Canada were transferred to Clarica Life, and the holders of the transferred Canadian policies became policyholders ofClarica Life. Those transferred policyholders are no longer policyholders of Metropolitan Life and, therefore, were not entitled to compensation underthe plan of reorganization. However, as a result of a commitment made in connection with obtaining Canadian regulatory approval of that sale and inconnection with the demutualization, Metropolitan Life’s Canadian branch made cash payments to those who were, or were deemed to be, holdersof these transferred Canadian policies. The payments were determined in a manner that is consistent with the treatment of, and fair and equitable to,eligible policyholders of Metropolitan Life.
(2) Included in 2000 total revenues and total expenses are $3,754 million and $3,576 million, respectively, related to GenAmerica, which was acquiredon January 6, 2000.
(3) During 1997, the Company changed to the retrospective interest method of accounting for investment income on structured notes in accordancewith Emerging Issues Task Force Consensus 96-12, Recognition of Interest Income and Balance Sheet Classification of Structured Notes. As aresult, net investment income increased by $175 million. The cumulative effect of this accounting change on prior years’ income was immaterial.
(4) In 1998, the Company adopted the provisions of Statement of Financial Accounting Standards 125, Accounting for Transfers and Servicing ofFinancial Assets and Extinguishments of Liabilities, with respect to the Company’s securities lending program. Adoption of the provisions had theeffect of increasing assets and liabilities by $3,769 million at December 31, 1998 and increasing revenues and expenses by $266 million for theyear ended December 31, 1998.
(5) Investment gains and losses are presented net of related policyholder amounts. The amounts netted against investment gains and losses are thefollowing:
For the years ended December 31,
2000 1999 1998 1997 1996
(Dollars in millions)
Gross investment (losses) gains************************************* $(444) $(137) $ 2,629 $ 1,018 $ 458
Less amounts allocable to:Future policy benefit loss recognition******************************* — — (272) (126) (203)Deferred policy acquisition costs ********************************** 95 46 (240) (70) (4)Participating contracts ******************************************* (126) 21 (96) (35) (20)Policyholder dividend obligation *********************************** 85 — — — —
Total********************************************************** 54 67 (608) (231) (227)
Net investment (losses) gains ************************************** $(390) $ (70) $ 2,021 $ 787 $ 231
Investment gains (losses) have been reduced by (1) deferred policy acquisition amortization to the extent that such amortization results frominvestment gains and losses, (2) additions to future policy benefits resulting from the need to establish additional liabilities due to the recognition ofinvestment gains (3) additions to participating contractholder accounts when amounts equal to such investment gains and losses are credited to thecontractholders’ accounts, and (4) adjustments to the policyholder dividend obligation resulting from investment gains and losses. This presentationmay not be comparable to presentations made by other insurers. This presentation affected operating income and adjusted operating income. Seenotes 12 and 13 below.
(6) Policyholder benefits and claims exclude $41 million, $(21) million, $368 million, $161 million and $223 million for the years ended December 31,2000, 1999, 1998, 1997 and 1996, respectively, of future policy benefit loss recognition, credits to participating contractholder accounts andchanges in the policyholder dividend obligation that have been charged against net investment gains and losses as such amounts are directlyrelated to such gains and losses. This presentation may not be comparable to presentations made by other insurers.
(7) Other expenses exclude $(95) million, $(46) million, $240 million, $70 million and $4 million for the years ended December 31, 2000, 1999, 1998,1997 and 1996, respectively, of amortization of deferred policy acquisition costs that have been charged against net investment gains and lossesas such amounts are directly related to such gains and losses. This presentation may not be comparable to presentations made by other insurers.
(8) Includes $(145) million, $125 million, $18 million, $(40) million and $38 million for surplus tax accrued (credited) by Metropolitan Life for the yearsended December 31, 2000, 1999, 1998, 1997 and 1996, respectively. Prior to its demutualization, Metropolitan Life was subject to surplus taximposed on mutual life insurance companies under Section 809 of the Internal Revenue Code. See ‘‘Management’s Discussion and Analysis ofFinancial Condition and Results of Operations.’’
(9) The loss from discontinued operations was primarily attributable to the disposition of the Company’s group medical insurance business.(10) Policyholder liabilities include future policy benefits, policyholder account balances, other policyholder funds, policyholder dividends and the
policyholder dividend obligation.(11) For additional information regarding these items, see Note 1 of Notes to Consolidated Financial Statements.
MetLife, Inc.3

(12) The following provides a reconciliation of net income to operating income:
For the years ended December 31,
2000 1999 1998 1997 1996
(Dollars in millions)
Net income ******************************************************** $ 953 $617 $ 1,343 $ 1,203 $ 853
Adjustments to reconcile net income to operating income:Gross investment losses (gains) ************************************* 444 137 (2,629) (1,018) (458)Income tax on gross investment gains and losses ********************** (175) (92) 883 312 173
Investment losses (gains), net of income tax************************* 269 45 (1,746) (706) (285)
Amount allocated to investment gains and losses (see note 5) *********** (54) (67) 608 231 227Income tax on amount allocated to investment gains and losses********** 21 45 (204) (71) (86)
Amount allocated to investment gains and losses, net of income tax **** (33) (22) 404 160 141
Demutualization costs********************************************** 230 260 6 — —Income tax on demutualization costs ********************************* (60) (35) (2) — —
Demutualization costs, net of income tax *************************** 170 225 4 — —
Payments to former Canadian policyholders *************************** 327 — — — —
Loss from discontinued operations, net of income tax******************* — — — — 71
Surplus tax ****************************************************** (145) 125 18 (40) 38
Operating income *************************************************** $1,541 $990 $ 23 $ 617 $ 818
The Company believes the supplemental operating information presented above allows for a more complete analysis of results of operations.Investment gains and losses have been excluded due to their volatility between periods and because such data are often excluded when evaluatingthe overall financial performance of insurers. Operating income should not be considered as a substitute for any GAAP measure of performance. TheCompany’s method of calculating operating income may be different from the method used by other companies and therefore comparability may belimited.
(13) The following provides a reconciliation of operating income to adjusted operating income:For the years ended December 31,
2000 1999 1998 1997 1996
(Dollars in millions)
Operating income *********************************************** $1,541 $ 990 $ 23 $ 617 $ 818Adjustments for charges for sales practices claims and for personal injury
claims caused by exposure to asbestos or asbestos-containingproducts, net of income tax************************************* — 317 1,203 190 103
Adjusted operating income *************************************** $1,541 $1,307 $1,226 $ 807 $ 921
The charge for the year ended December 31, 1999 was principally related to the settlement of a multidistrict litigation proceeding involving allegedimproper sales practices, accruals for sales practices claims not covered by the settlement and other legal costs. The amounts reported for theyears ended December 31, 1998, 1997 and 1996 include charges for sales practices claims and claims for personal injuries caused by exposureto asbestos or asbestos-containing products. See Note 10 of Notes to Consolidated Financial Statements. The Company believes that supplemen-tal adjusted operating income data provides information useful in measuring operating trends by excluding the unusual amounts of expensesassociated with sales practices and asbestos-related claims. Adjusted operating income should not be considered as a substitute for any GAAPmeasure of performance.
(14) Operating return on equity is defined as operating income divided by average total equity excluding accumulated other comprehensive income(loss). The Company believes the operating return on equity information presented supplementally allows for a more complete analysis of results ofoperations. Accumulated other comprehensive income (loss) has been excluded due to its volatility between periods and because such data isoften excluded when evaluating the overall financial performance of insurers. Operating return on equity should not be considered as a substitute forany GAAP measure of performance. The Company’s method of calculating operating return on equity may be different from the method used byother companies and, therefore, comparability may be limited.
(15) Adjusted operating return on equity is defined as adjusted operating income divided by average total equity, excluding accumulated othercomprehensive income (loss). The Company believes that supplemental adjusted operating return on equity data provides information useful inmeasuring operating trends by excluding the unusual amounts of expenses associated with sales practices and asbestos-related claims. Adjustedoperating return on equity should not be considered as a substitute for net income in accordance with GAAP.
(16) Return on equity is defined as net income divided by average total equity, excluding accumulated other comprehensive income (loss).(17) Includes MetLife’s general account and separate account assets and assets managed on behalf of third parties. On October 30, 2000, the
Company completed its sale of Nvest. Includes $133 billion, $135 billion, $125 billion and $100 billion of assets under management managed byNvest at December 31, 1999, 1998, 1997 and 1996, respectively.
(18) Metropolitan Life statutory data only.(19) Based on earnings subsequent to date of demutualization. For additional information regarding these items, see Note 17 of Notes to Consolidated
Financial Statements.(20) Earnings per share amounts are presented as if the initial public offering had occurred on January 1, 2000.
MetLife, Inc.4

Management’s Discussion and Analysis of Financial Condition and Results of Operations.
For purposes of this discussion, the term ‘‘Company’’ refers, at all times prior to the date of demutualization (as hereinafter defined), to MetropolitanLife Insurance Company, a mutual life insurance company organized under the laws of the State of New York (‘‘Metropolitan Life’’), and its subsidiaries,and at all times on and after the date of demutualization, to MetLife, Inc. (the ‘‘Holding Company’’), a Delaware corporation, and its subsidiaries, includingMetropolitan Life (‘‘MetLife’’). Following this summary is a discussion addressing the consolidated results of operations and financial condition of theCompany for the periods indicated. This discussion should be read in conjunction with the Company’s consolidated financial statements includedelsewhere herein.
The DemutualizationOn April 7, 2000 (the ‘‘date of demutualization’’), pursuant to an order by the New York Superintendent of Insurance (‘‘Superintendent’’) approving its
plan of reorganization, as amended (the ‘‘plan’’), Metropolitan Life converted from a mutual life insurance company to a stock life insurance company andbecame a wholly-owned subsidiary of the Holding Company. In conjunction therewith, each policyholder’s membership interest was extinguished andeach eligible policyholder received, in exchange for that interest, trust interests representing shares of Common Stock held in the Metropolitan LifePolicyholder Trust, cash or an adjustment to their policy values in the form of policy credits, as provided in the plan. In addition, Metropolitan Life’sCanadian branch made cash payments to holders of certain policies transferred to Clarica Life Insurance Company in connection with the sale of asubstantial portion of Metropolitan Life’s Canadian operations in 1998, as a result of a commitment made in connection with obtaining Canadianregulatory approval of that sale. The payments, which were recorded in the second quarter of 2000, were determined in a manner that was consistentwith the treatment of, and fair and equitable to, eligible policyholders of Metropolitan Life.
On the date of demutualization, the Holding Company conducted an initial public offering of 202,000,000 shares of its Common Stock andconcurrent private placements of an aggregate of 60,000,000 shares of its Common Stock at an offering price of $14.25 per share. The shares ofCommon Stock issued in the offerings are in addition to 494,466,664 shares of Common Stock of the Holding Company distributed to the MetropolitanLife Policyholder Trust for the benefit of policyholders of Metropolitan Life in connection with the demutualization. On April 10, 2000, the Holding Companyissued 30,300,000 additional shares of its Common Stock as a result of the exercise of over-allotment options granted to underwriters in the initial publicoffering.
Concurrently with these offerings, MetLife, Inc. and MetLife Capital Trust I, a Delaware statutory business trust wholly-owned by MetLife, Inc., issued20,125,000 8.00% equity security units for an aggregate offering price of $1,006 million. Each unit consists of (i) a contract to purchase shares ofCommon Stock and (ii) a capital security of MetLife Capital Trust I.
On the date of demutualization, Metropolitan Life established a closed block for the benefit of holders of certain individual life insurance policies ofMetropolitan Life. See Note 6 of Notes to Consolidated Financial Statements.
On June 27, 2000, the Holding Company’s Board of Directors authorized the repurchase of up to $1 billion of the Holding Company’s outstandingCommon Stock. The buyback may take place over an unspecified period of time. the Holding Company may purchase Common Stock from theMetropolitan Life Policyholder Trust, in the open market, and in private transactions. Through December 31, 2000, 26,084,751 shares have beenacquired for $613 million.
Acquisitions and DispositionsOn February 28, 2001, the Holding Company consummated the purchase of Grand Bank, N.A. (‘‘Grand Bank’’). Grand Bank, with reported assets
at September 30, 2000 of approximately $84 million, provides banking services to individuals and small businesses in the Princeton, New Jersey area.On February 12, 2001, the Federal Reserve Board approved the Holding Company’s application for bank holding company status and to become afinancial holding company upon its acquisition of Grand Bank.
On January 6, 2000, Metropolitan Life completed its acquisition of GenAmerica for $1.2 billion. As part of the GenAmerica acquisition, GeneralAmerican Life Insurance Company paid Metropolitan Life a fee of $120 million in connection with the assumption of certain funding agreements. The feehas been considered as part of the purchase price of GenAmerica. GenAmerica is a holding company which includes General American Life InsuranceCompany, 49% of the outstanding shares of Reinsurance Group of America, Incorporated (‘‘RGA’’) common stock, a provider of reinsurance, and 61.0%of the outstanding shares of Conning Corporation (‘‘Conning’’) common stock, an asset manager. Metropolitan Life owned 10% of the outstandingshares of RGA common stock prior to the completion of the GenAmerica acquisition. At December 31, 2000 Metropolitan Life’s ownership percentage ofthe outstanding shares of RGA common stock was approximately 59%.
In April 2000, Metropolitan Life acquired the outstanding shares of Conning common stock not already owned by Metropolitan Life for $73 million.In July 2000, the Company acquired the workplace benefits division of Business Men’s Assurance Company, a Kansas City, Missouri based insurer.In October 2000, the Company completed the sale of its 48% ownership interest in its affiliates, Nvest, L.P. and Nvest Companies L.P. This
transaction resulted in an investment gain of $663 million.In September 1999, the Auto & Home segment acquired the standard personal lines property and casualty insurance operations of The St. Paul
Companies.In November 1999, the Company acquired the individual disability income business of Lincoln National Life Insurance Company.During 1998, the Company sold MetLife Capital Holdings, Inc., a commercial financing company and a substantial portion of its Canadian insurance
operations, which resulted in an investment gain of $531 million.
Results of Operations
The Company
Year ended December 31, 2000 compared with the year ended December 31, 1999Premiums increased by $4,229 million, or 35%, to $16,317 million in 2000 from $12,088 million in 1999, in part, due to the acquisition of
GenAmerica on January 6, 2000. Excluding the impact of this acquisition, premiums increased by $2,273 million, or 19%. This increase is attributable toInstitutional Business, Auto & Home and International. These increases are partially offset by a $72 million, or 2%, decrease in Individual Business. Theincrease of $1,297 million, or 23%, in Institutional Business is predominantly the result of strong sales and continued favorable policyholder retention inthis segment’s group life, dental and disability businesses. The acquisitions of the workplace benefits division from the Business Men’s AssuranceCompany in July 2000 and Lincoln National’s disability business in November 1999 (‘‘the BMA and Lincoln National acquisitions’’) account for $103million of the variance. In addition, significant premiums received from existing group life and retirement and savings customers in 2000 contribute $465
MetLife, Inc.5

million to the variance. The increase of $885 million, or 51%, in Auto & Home is primarily due to the St. Paul acquisition, which represents $755 million ofthe increase, as well as growth in this segment’s standard auto business. The increase of $137 million, or 26%, in International is primarily due to overallgrowth in Mexico, Taiwan, South Korea, Spain and Brazil. The decrease in the Individual Business segment is primarily due to a decline in sales oftraditional life insurance policies, which reflects a continued shift in policyholders’ preferences from those policies to variable life products.
Universal life and investment-type product policy fees increased by $387 million, or 27%, to $1,820 million in 2000 from $1,433 million in 1999.Excluding the impact of the GenAmerica acquisition, universal life and investment-type product policy fees increased by $145 million, or 10%. Thisincrease is almost entirely attributable to a $130 million, or 15%, increase in Individual Business, which is primarily due to increased sales, includingexchanges, of variable life products, increases in separate account assets and the acceleration of the recognition of unearned fees in connection with auniversal life product replacement program.
Net investment income increased by $1,952 million, or 20%, to $11,768 million in 2000 from $9,816 million in 1999. Excluding the impact of theGenAmerica acquisition, net investment income increased by $832 million, or 8%. This increase is primarily due to higher income from (i) fixed maturitiesof $653 million, or 9%, (ii) mortgage loans on real estate of $76 million, or 5%, (iii) interest on policy loans of $17 million, or 5%, (iv) cash and short terminvestments of $79 million, or 46%, (v) real estate and real estate joint ventures, net of investment expenses and depreciation, of $45 million, or 8%, and(vi) lower investment expenses of $27 million, or 10%. These increases are partially offset by reduced income from equity securities and other limitedpartnership interests of $54 million, or 23%, and other invested assets of $11 million, or 12%.
The increase in income from fixed maturities to $7,824 million in 2000 from $7,171 million in 1999 is primarily due to higher volume in the securitieslending program and income from fixed maturities which were part of the St. Paul acquisition in the fourth quarter of 1999. These increases are partiallyoffset by decreases in income from equity-linked notes. The increase in income from mortgage loans on real estate to $1,560 million in 2000 from$1,484 million in 1999 is largely due to higher mortgage production volume. The reduction in income from equity securities and other limited partnershipinterests to $185 million in 2000 from $239 million in 1999 is predominantly the result of a decrease in sales by corporate partnerships.
Other revenues increased by $278 million, or 13%, to $2,432 million in 2000 from $2,154 million in 1999. The impact of the GenAmerica acquisitionis an increase to other revenues of $378 million. The variance year over year, excluding the impact of GenAmerica, is partially attributable to increases inthe Individual and Institutional Business segments. The increase of $89 million in Individual Business is largely a result of higher commission and feeincome related to increased sales in the broker/dealer and other subsidiaries. The primary driver of Institutional Business’ $36 million increase is strongsales growth in its dental and disability administrative services businesses. Offsetting these increases is a $131 million decline in the Asset Managementsegment due to the sale of Nvest, on October 30, 2000. The remaining variance is primarily due to the Corporate (including consolidation relatedadjustments) segment.
The Company’s investment gains and losses are net of related policyholder amounts. The amounts netted against investment gains and losses are(i) amortization of deferred policy acquisition costs attributable to the increase or decrease in product gross margins or profits resulting from investmentgains and losses, (ii) additional policyholder liabilities, which are required when investment gains are recognized and the Company reinvests the proceedsin lower yielding assets (‘‘loss recognition’’), (iii) liabilities for those participating contracts in which the policyholders’ accounts are increased or decreasedby the related investment gains or losses, and (iv) adjustments to the policyholder dividend obligation resulting from investment gains and losses.
Net investment losses increased by $320 million, or 457%, to $390 million in 2000 from $70 million in 1999. This increase reflects total grossinvestment losses of $444 million, an increase of $307 million, or 224%, from $137 million in 1999, before the offsets for: the amortization of deferredpolicy acquisition costs of $95 million and $46 million in 2000 and 1999, respectively; changes in the policyholder dividend obligation of $85 million in2000; and (additions to) or reductions in participating contracts of $(126) million and $21 million in 2000 and 1999, respectively, related to assets sold.Excluding the impact of the GenAmerica acquisition, net investment losses increased by $378 million, or 540%. This increase reflects the continuation ofthe Company’s strategy to reposition its investment portfolio in order to provide a higher operating return on its invested assets and the recognition oflosses through the proactive sale of certain assets. These losses are partially offset by a $663 million gain, which was recognized as a result of the sale ofNvest on October 30, 2000.
The Company believes its policy of netting related policyholder amounts against investment gains and losses provides important information inevaluating its operating performance. Investment gains and losses are often excluded by investors when evaluating the overall financial performance ofinsurers. The Company believes its presentation enables readers of its consolidated statements of income to easily exclude investment gains and lossesand the related effects on the consolidated statements of income when evaluating its operating performance. The Company’s presentation of investmentgains and losses, net of policyholder amounts, may be different from the presentation used by other insurance companies and, therefore, amounts in itsconsolidated statements of income may not be comparable with amounts reported by other insurers.
Policyholder benefits and claims increased by $3,793 million, or 29%, to $16,893 million in 2000 from $13,100 million in 1999. This increasereflects total gross policyholder benefits and claims of $16,934 million, an increase of $3,855 million from $13,079 million in 1999, before the offsets foradditions to or (reductions in) participating contractholder accounts of $126 million in 2000 and $(21) million in 1999 and changes in the policyholderdividend obligation of $(85) million in 2000 directly related to net investment losses. Excluding the impact of the GenAmerica acquisition, policyholderbenefits and claims increased $2,044 million, or 16%. This rise is primarily due to increases of $1,366 million, or 20%, in Institutional Business, $704million, or 54%, in Auto & Home, and $104 million, or 23%, in International. These increases are partially offset by a decrease of $103 million, or 2%, inIndividual Business. The Institutional Business increase is largely due to overall growth within the segment’s group dental and disability businesses, aswell as the BMA and Lincoln National acquisitions. In addition, policyholder benefits and claims related to the group life and retirement and savingsbusinesses increased commensurate with the premium variance noted above. The increase in Auto & Home is due, in most part, to the St. Paulacquisition, which represents $580 million of the increase. The remainder of the increase is largely attributable to a 9% increase in the number of autopolicies in force and increased costs resulting from an increase in the use of original equipment manufacturer parts and higher labor rates. The increase inInternational is primarily due to overall growth in Mexico, Taiwan, South Korea, Spain and Brazil, commensurate with the increase in International’spremiums. The decrease in Individual Business is predominately the result of improved mortality and morbidity experience.
Interest credited increased by $494 million, or 20%, to $2,935 million in 2000 from $2,441 million in 1999. Excluding the impact of the GenAmericaacquisition, interest credited increased by $95 million, or 4%. This is primarily attributable to increases of $54 million, or 5%, in Institutional Business and$36 million, or 3%, in Individual Business. The higher expense in Institutional Business is largely due to an increase in group insurance of $84 million,which resulted from asset growth in customer account balances, growth in the bank-owned life insurance business and increases in the cash values ofexecutive and corporate-owned universal life plans. These increases are partially offset by a decrease in retirement and savings products of $30 million,due to a continued shift in customers’ investment preferences from guaranteed interest products to separate account alternatives. The increase inIndividual Business is predominately due to higher policyholder account balances and increases in crediting rates on annuity and investment products.
MetLife, Inc.6

Policyholder dividends increased by $229 million, or 14%, to $1,919 million in 2000 from $1,690 million in 1999. Excluding the acquisition ofGenAmerica, policyholder dividends increased by $20 million, or 1%. Policyholder dividends vary from period to period based on participating group andtraditional individual life insurance contract experience.
Payments of $327 million were made during the second quarter of 2000, as part of Metropolitan Life’s demutualization, to holders of certain policiestransferred to Clarica Life Insurance Company in connection with the sale of a substantial portion of the Canadian operations in 1998.
Demutualization costs decreased by $30 million, or 12%, to $230 million in 2000 from $260 million in 1999. These costs are related to MetropolitanLife’s demutualization on April 7, 2000.
Other expenses increased by $1,472 million, or 22%, to $8,227 million in 2000 from $6,755 million in 1999. Excluding the capitalization andamortization of deferred policy acquisition costs, which are discussed below, other expenses increased by $1,627 million, or 23%, to $8,612 million in2000 from $6,985 million in 1999. Excluding the impact of the GenAmerica acquisition, other expenses increased by $300 million, or 4%. This increaseis primarily attributable to increases in Auto & Home, Individual Business, Institutional Business and International. These increases are partially offset by a$396 million, or 38%, decrease in Corporate and a $101 million, or 13%, decrease in Asset Management. The increase in Auto & Home of $311 million,or 59%, is largely due to the St. Paul acquisition. The increase in Individual Business of $291 million, or 10%, is partially attributable to a $111 millionincrease from the broker/dealer and other subsidiaries commensurate with the increase in other revenues and increased securities lending volume. Theincrease in Institutional Business of $144 million, or 9%, is primarily due to costs incurred in connection with initiatives focused on improving servicedelivery capabilities through investments in technology and an increase in volume-related expenses associated with premium growth. Volume-relatedexpenses include premium taxes, separate account investment management expenses and commissions. The increase in International of $45 million, or14%, is primarily attributable to expenses incurred in connection with business expansion efforts in several countries. The decrease in Corporate isprimarily due to a $499 million charge in 1999 principally related to the settlement of a multidistrict litigation proceeding involving alleged improper salespractices, accruals for sales practices claims not covered by the settlement and other legal costs. The most significant factor contributing to the decline inAsset Management is the sale of Nvest, which occurred on October 30, 2000.
Deferred policy acquisition costs are principally amortized in proportion to gross margins or profits, including investment gains or losses. Theamortization is allocated to investment gains and losses to provide consolidated statement of income information regarding the impact of investmentgains and losses on the amount of the amortization, and other expenses to provide amounts related to gross margins or profits originating fromtransactions other than investment gains and losses.
Capitalization of deferred policy acquisition costs increased to $1,863 million in 2000 from $1,160 million in 1999 while total amortization of deferredpolicy acquisition costs, charged to operations, increased to $1,383 million in 2000 from $884 million in 1999. Excluding the impact of the GenAmericaacquisition, capitalization of deferred policy acquisition costs increased to $1,413 million in 2000 from $1,160 in 1999 while total amortization of deferredpolicy acquisition costs increased to $1,012 million in 2000 from $884 million in 1999. Amortization of deferred policy acquisition costs of $1,478 millionand $930 million are allocated to other expenses in 2000 and 1999, respectively, while the remainder of the amortization in each year is allocated toinvestment losses. Excluding the impact of the GenAmerica acquisition, amortization of deferred policy acquisition costs of $1,136 million and $930million are allocated to other expenses in 2000 and 1999, respectively, while the remainder of the amortization in each year is allocated to investmentlosses. The increase in amortization of deferred policy acquisition costs allocated to other expenses was predominately attributable to Auto & Home’sacquisition of St. Paul.
Income tax expense for the year ended December 31, 2000 was $463 million, or 33% of income before provision for income taxes, compared with$558 million, or 47%, in 1999. The 2000 effective tax rate differs from the corporate tax rate of 35% due to non-deductible payments made in the secondquarter of 2000 to former Canadian policyholders in connection with the demutualization, a surplus tax benefit of $145 million and a reduction in prior yeartaxes on capital gains associated with the sale of businesses recorded in the third quarter of 2000. The 1999 effective rate differs from the corporate taxrate of 35% primarily due to the impact of surplus tax. Prior to its demutualization, Metropolitan Life was subject to surplus tax imposed on mutual lifeinsurance companies under Section 809 of the Internal Revenue Code. The surplus tax results from the disallowance of a portion of a mutual lifeinsurance company’s policyholder dividends as a deduction from taxable income.
Year ended December 31, 1999 compared with the year ended December 31, 1998Premiums increased by 5% to $12,088 million in 1999 from $11,503 million in 1998. This increase is attributable to strong growth in Institutional
Business of $366 million, or 7%, and Auto & Home of $348 million, or 25%. These increases are partially offset by decreases in International of $95million, or 15%, and in Individual Business of $34 million, or 1%. Institutional Business’ growth is primarily driven by an increase in non-medical healthpremiums due to increased sales and improved policyholder retention in its dental and disability businesses. Auto & Home’s premium increase is primarilydue to the St. Paul acquisition, of which represents $262 million of the increase, as well as growth in both standard and non-standard auto insurancebusinesses. International’s premium decrease is primarily due to the disposition of a substantial portion of the Company’s Canadian operations inJuly 1998. The Individual Business decrease is primarily attributable to the decline in sales of traditional life insurance policies, which reflects a continuedshift in customers’ investment preferences from those policies to variable life products, as well as decreased sales of supplementary contracts with lifecontingencies.
Universal life and investment-type product policy fees increased by 5% to $1,433 million in 1999 from $1,360 million in 1998. This increase isattributable to increases of $71 million, or 9%, in Individual Business and $27 million, or 6%, in Institutional Business. These increases are partially offsetby a decrease in International of $25 million, or 37%. The Individual Business policy fee increase is, in large part, due to the continued growth in depositsfor investment products as well as stock market appreciation. The $27 million increase in Institutional Business’ policy fees is primarily due to continuedgrowth in sales of products used in executive and corporate-owned benefit plans. The majority of International’s policy fee decrease is a result of the saleof a substantial portion of the Company’s Canadian operations.
Net investment income decreased by 4% to $9,816 million in 1999 from $10,228 million in 1998. This decrease is primarily due to reductions in(i) investment income related to mortgage loans on real estate of $93 million, or 6%, (ii) investment income on other invested assets of $340 million, or40%, (iii) equity securities income of $38 million, or 49%, (iv) policy loan income of $47 million, or 12%, and (v) real estate and real estate joint venturesincome, after investment expenses and depreciation, of $106 million, or 15%. These reductions in net investment income are partially offset by higherincome from fixed maturities of $203 million, or 3%. The reduction in investment income from mortgage loans on real estate to $1,479 million in 1999from $1,572 million in 1998 is due to a reduction in principal balances in MetLife Capital Holdings, Inc. and a substantial portion of the Company’sCanadian operations, which were sold in 1998, the proceeds of which were reinvested in fixed maturities. Likewise, the increase in fixed maturityinvestment income to $6,766 million in 1999 from $6,563 million in 1998 is primarily attributable to increased average principal balances due, in part, tothe reinvestment of proceeds from the sale of MetLife Capital Holdings, as well as from sales of equity securities, the dispositions of which were part of
MetLife, Inc.7

the Company’s 1998 year-end asset repositioning program. The reduction in investment income from other invested assets to $501 million in 1999 from$841 million in 1998 is due to a reduction in leveraged lease balances, resulting from the sale of MetLife Capital Holdings, and lower fees received frombond prepayments, calls and tenders. The reduction in real estate and real estate joint ventures income is primarily attributable to the timing of sales ofinvestments held by the Company’s real estate joint ventures.
Other revenues, which are primarily comprised of expense reimbursements from reinsurers and fees related to investment management andadministrative services and securities lending activities, increased by 8% to $2,154 million in 1999 from $1,994 million in 1998. This increase is primarilyattributable to growth of $84 million, or 18%, in Individual Business and $54 million, or 9%, in Institutional Business. The Individual Business increase isprimarily due to a full year of activity from Nathan & Lewis, which was acquired in April 1998. The increase in Institutional Business is due to increases inits non-medical health and retirement and savings businesses, partially offset by a decrease in its group life business. The Company’s non-medical healthbusiness increased $61 million primarily due to growth in its dental administrative service business. The increase in its retirement and savings business of$44 million reflects higher administrative fees derived from separate accounts and its defined contribution record-keeping services. The decrease in thegroup life business of $51 million is primarily due to lower income in 1999 related to funds used to seed separate accounts.
The Company’s investment gains and losses are net of related policyholder amounts. The amounts netted against investment gains and losses are(i) amortization of deferred policy acquisition costs attributable to the increase or decrease in product gross margins or profits resulting from investmentgains and losses, (ii) future policy benefit loss recognition, and (iii) liabilities for those participating contracts in which the policyholders’ accounts areincreased or decreased by the related investment gains or losses.
Net investment gains (losses) decreased by 103% to $(70) million in 1999 from $2,021 million in 1998. This decrease reflects total gross investmentlosses of $(137) million, a decrease of 105%, from total gross investment gains of $2,629 million in 1998, before the offsets for the amortization ofdeferred policy acquisition costs of $46 million and $(240) million, loss recognition of $0 million and $(272) million and reductions in and (additions to)participating contracts of $21 million and $(96) million related to assets sold in 1999 and 1998, respectively. A significant portion of the Company’s netinvestment gains in 1998 is attributable to a sales program initiated in the fourth quarter of 1998, which it conducted as part of its strategy to reposition itsinvestment portfolio in order to provide a higher operating rate of return on its invested assets. In connection with this repositioning, the Company reducedits investments in treasury securities and corporate equities and increased its investments in fixed maturities with a higher current yield. Net investmentlosses in 1999 reflect the continuation of the Company’s strategy to reposition its investment portfolio in order to provide a higher operating rate of returnon its invested assets.
The Company believes its policy of netting related policyholder amounts against investment gains and losses provides important information inevaluating its operating performance. Investment gains and losses are often excluded by investors when evaluating the overall financial performance ofinsurers. The Company believes its presentation enables readers of its consolidated statements of income to easily exclude investment gains and lossesand the related effects on the consolidated statements of income when evaluating its operating performance. The Company’s presentation of investmentgains and losses net of policyholder amounts may be different from the presentation used by other insurance companies and, therefore, amounts in itsconsolidated statements of income may not be comparable with amounts reported by other insurers.
Policyholder benefits and claims increased by 4% to $13,100 million in 1999 from $12,638 million in 1998. This increase reflected total grosspolicyholder benefits and claims of $13,079 million, an increase of $73 million from $13,006 million in 1998, before the offsets for loss recognition of$272 million in 1998 (there were no offsets for loss recognition in 1999) and (reductions in) or additions to participating contractholder accounts of $(21)million and $96 million directly related to net investment gains and losses for the years ended December 31, 1999 and 1998, respectively. This increasewas primarily attributable to increases of $296 million, or 5%, in Institutional Business and $272 million, or 26%, in Auto & Home, partially offset by adecrease of $139 million, or 23%, in International. The Institutional Business increase is primarily due to overall premium growth within its group dental anddisability businesses. The increase in Auto & Home is primarily due to the St. Paul acquisition of $195 million, a 6% increase in the number of policies inforce and $23 million of unfavorable claims development due to lower than expected savings resulting from the implementation of a new technologyplatform. The decrease in International is attributable to the sale of a substantial portion of the Company’s Canadian operations.
Interest credited to policyholder account balances decreased by 10% to $2,441 million in 1999 from $2,711 million in 1998. This decrease isattributable to reductions of $169 million, or 14%, in Institutional Business, $64 million, or 4%, in Individual Business, and $37 million, or 42%, inInternational. Group insurance in Institutional Business decreased by $63 million, or 14%, primarily due to cancellations in the leveraged corporate-ownedlife insurance business attributable to a change in the federal income tax treatment for those products. In addition, retirement and savings productsdeclined by $106 million, or 14%, reflecting a shift in policyholders’ investment preferences from guaranteed interest products to separate accountalternatives. The decrease in Individual Business is the result of a 1998 annuity reinsurance transaction, as well as a shift in policyholders’ preferences toseparate account alternatives. The International decrease is due to the sale of a substantial portion of the Company’s Canadian operations.
Policyholder dividends increased by 2% to $1,690 million in 1999 from $1,651 million in 1998. This increase is attributable to increases of $64million, or 4%, in Individual Business and $17 million, or 12%, in Institutional Business, which are somewhat offset by a $42 million, or 66%, decrease inInternational. The increase in Individual Business is primarily due to growth in cash values of policies associated with the Company’s large block oftraditional life insurance business combined with a dividend scale increase on certain mature policies in 1999. Policyholder dividends within InstitutionalBusiness vary from period to period based on participating group insurance contract experience. The International decrease is due to the sale of asubstantial portion of the Company’s Canadian operations.
Demutualization costs are $260 million and $6 million for the years ended December 31, 1999 and 1998, respectively. These costs related toMetropolitan Life’s demutualization efforts.
Other expenses decreased by 16% to $6,755 million in 1999 from $8,019 million in 1998. This decrease reflects total gross other expenses of$6,709 million, a decrease of 19%, from $8,259 million in 1998, before the offset for amortization of deferred policy acquisition costs directly attributableto net investment gains and losses of $(46) million and $240 million for the years ended December 31, 1999 and 1998, respectively. Excluding the effectof the pay down of debt with proceeds from the sale of MetLife Capital Holdings, Inc. in 1998, other expenses decreased by $1,372 million. Thisdecrease is attributable to a $1,570 million, or 60%, decrease in Corporate. The decrease in Corporate is primarily due to a $1,895 million charge in1998 for sales practices claims and claims for personal injuries caused by exposure to asbestos or asbestos-containing products, compared with a$499 million charge in 1999. The 1999 charge is principally related to the settlement of a multidistrict litigation proceeding involving alleged improper salepractices, accruals for sales practices claims not covered by the settlement and other legal costs. The 1998 charge of $1,895 million is comprised of$925 million and $970 million for sales practices claims and asbestos-related claims, respectively. The Company recorded the accrual for sales practicesclaims based on preliminary settlement discussions and the settlement history of other insurers.
MetLife, Inc.8

Prior to the fourth quarter of 1998, the Company established a liability for asbestos-related claims based on settlement costs for claims that it hadsettled, estimates of settlement costs for claims pending against it and an estimate of settlement costs for unasserted claims. The amount for unassertedclaims is based on management’s estimate of unasserted claims that would be probable of assertion. A liability is not established for claims which theCompany believes are only reasonably possible of assertion. Based on this process, the Company’s accrual for asbestos-related claims at Decem-ber 31, 1997 was $386 million. The Company’s potential liabilities for asbestos-related claims are not easily quantified, due to the nature of theallegations against it, which are not related to the business of manufacturing, producing, distributing or selling asbestos or asbestos-containing products,adding to the uncertainty in the number of claims brought against it.
During 1998, the Company decided to pursue the purchase of insurance to limit its exposure to asbestos-related claims. In connection with itsnegotiations with the casualty insurers to obtain this insurance, the Company obtained information that caused it to reassess its accruals for asbestos-related claims. This information included:
) Information from the insurers regarding the asbestos-related claims experience of other insureds, which indicated that the number of claims thatwere probable of assertion against the Company in the future was significantly greater than it had assumed in its accruals. The number of claimsbrought against it is generally a reflection of the number of asbestos-related claims brought against asbestos defendants generally and thepercentage of those claims in which the Company is included as a defendant. The information provided to the Company relating to other insuredsindicated that it had been included as defendants for a significant percentage of total asbestos-related claims and that it may be included in alarger percentage of claims in the future, because of greater awareness of asbestos litigation generally by potential plaintiffs and plaintiffs’ lawyersand because of the bankruptcy and reorganization or the exhaustion of insurance coverage of other asbestos defendants; and that, althoughvolatile, there was an upward trend in the number of total claims brought against asbestos defendants.
) Information derived from actuarial calculations the Company made in the fourth quarter of 1998 in connection with these negotiations, whichhelped it to frame, define and quantify this liability. These calculations were made using, among other things, current information regarding itsclaims and settlement experience (which reflected the Company’s decision to resolve an increased number of these claims by settlement), recentand historic claims and settlement experience of selected other companies and information obtained from the insurers.
Based on this information, the Company concluded that certain claims that previously were considered as only reasonably possible of assertion areprobable of assertion, increasing the number of assumed claims to approximately three times the number assumed in prior periods. As a result of thisreassessment, the Company increased its liability for asbestos-related claims to $1,278 million at December 31, 1998.
During 1998, the Company paid $1,407 million of premiums for excess of loss reinsurance and insurance policies and agreements, consisting of$529 million for the excess of loss reinsurance agreements for sales practices claims and excess mortality losses and $878 million for the excessinsurance policies for asbestos-related claims. The excess insurance policies for asbestos-related claims provide for recovery of losses of up to$1,500 million, while the excess of loss reinsurance policies provide for recovery of sales practices losses of up to $550 million and for certain mortalitylosses with a maximum aggregate limit of $650 million. The Company may recover amounts under the policies annually, with respect to claims paidduring the prior calendar year. The policies contain self-insured retentions and, with respect to asbestos-related claims, annual and per-claim sublimits,for which the Company believes adequate provision has been made in its consolidated financial statements. For additional information regarding thenature of these claims, see Note 10 of Notes to Consolidated Financial Statements.
In addition to the decrease in Corporate in 1999, other expenses reflected a $104 million, or 30%, decrease in International, and increases of$128 million, or 33%, in Auto & Home and $142 million, or 6%, in Individual Business. The International decrease is primarily due to the sale of asubstantial portion of the Company’s Canadian operations. The increase in Auto & Home is primarily due to the St. Paul acquisition. The increase inIndividual Business is attributable to the net capitalization of deferred acquisition costs, as discussed below. Excluding the net capitalization of deferredacquisition costs, other expenses in Individual Business decreased by $71 million, or 2%. This decrease is primarily attributable to cost reductioninitiatives implemented in 1998.
Deferred policy acquisition costs are principally amortized in proportion to gross margins or gross profits, including investment gains or losses. Theamortization is allocated to investment gains and losses to provide consolidated statement of income information regarding the impact of investmentgains and losses on the amount of the amortization, and other expenses to provide amounts related to gross margins or profits originating fromtransactions other than investment gains and losses.
Capitalization of deferred policy acquisition costs increased by 13% to $1,160 million in 1999 from $1,025 million in 1998, while total amortization ofsuch costs, charged to operations, increased to $884 million in 1999 from $881 million in 1998. Amortization of deferred policy acquisition costs of$930 million and $641 million are allocated to other expenses in 1999 and 1998, respectively, while the remainder of the amortization in each year isallocated to investment gains (losses). The increase in amortization of deferred policy acquisition costs allocated to other expenses is primarily attributableto the Individual Business segment, which increased to $625 million in 1999 from $386 million in 1998. This increase is the result of its reinsurance ofmortality risk at a cost that is expected to be less than its previously estimated mortality losses in 1998, as well as refinements in its calculation ofestimated gross margins.
Income tax expense in 1999 is $558 million, or 47% of income before provision for income taxes compared with $738 million, or 35%, in 1998. The1999 effective tax rate differs from the corporate tax rate of 35% primarily due to the impact of surplus tax. Prior to its demutualization, the Company wassubject to surplus tax imposed on mutual life insurance companies under Section 809 of the Internal Revenue Code. The surplus tax results from thedisallowance of a portion of a mutual life insurance company’s policyholder dividends as a deduction from taxable income.
Individual Business
Year ended December 31, 2000 compared with the year ended December 31, 1999Premiums increased by $384 million, or 9%, to $4,673 million in 2000 from $4,289 million in 1999. Excluding the impact of the GenAmerica
acquisition, premiums decreased by $72 million, or 2%. Premiums from insurance products decreased by $82 million, or 2%, to $4,133 million in 2000from $4,215 million in 1999. This decrease is primarily due to a decline in sales of traditional life insurance policies, which reflects a continued shift inpolicyholders’ preferences from those policies to variable life products. Premiums from annuity and investment products increased by $10 million, or14%, to $84 million in 2000 from $74 million in 1999. This increase is largely attributable to increased sales of supplementary contracts with lifecontingencies and immediate annuity products.
Universal life and investment-type product policy fees increased by $333 million, or 38%, to $1,221 million in 2000 from $888 million in 1999.Excluding the impact of the GenAmerica acquisition, universal life and investment-type fees increased by $130 million, or 15%. Policy fees frominsurance products increased by $48 million, or 8%, to $619 million in 2000 from $571 million in 1999, primarily due to increased sales of variable lifeproducts and continued growth in separate accounts, reflecting a continued shift in customer preferences from traditional life products. This increase also
MetLife, Inc.9

reflects the acceleration of the recognition of unearned fees in connection with a product replacement program related to universal life policies. Policyfees from annuity and investment products increased by $82 million, or 26%, to $399 million in 2000 from $317 million in 1999, primarily due tocontinued growth in separate account assets.
Other revenues increased by $280 million, or 50%, to $838 million in 2000 from $558 million in 1999. Excluding the impact of the GenAmericaacquisition, other revenues increased by $89 million, or 16%. Other revenues for insurance products increased by $91 million, or 17%, to $612 million in2000 from $521 million in 1999. This increase is principally attributable to higher commission and fee income associated with increased sales in thebroker/dealer and other subsidiaries. Other revenues for annuity products remained essentially unchanged at $35 million in 2000 compared with $37million in 1999.
Policyholder benefits and claims increased by $429 million, or 9%, to $5,054 million in 2000 from $4,625 million in 1999. Excluding the impact ofthe GenAmerica acquisition, policyholder benefits and claims decreased by $103 million, or 2%. Policyholder benefits and claims for insurance productsdecreased by $111 million, or 2%, to $4,339 million in 2000 from $4,450 million in 1999. This decrease is predominately a result of improved mortalityand morbidity experience. Policyholder benefits and claims for annuity and investment products increased by $8 million, or 5%, to $183 million in 2000from $175 million in 1999, commensurate with the increase in premiums discussed above.
Interest credited to policyholder account balances increased by $321 million, or 24%, to $1,680 million in 2000 from $1,359 million in 1999.Excluding the impact of the GenAmerica acquisition, interest credited increased by $36 million, or 3%. Interest on insurance products increased by $26million, or 6%, to $445 million in 2000 from $419 million in 1999, largely due to higher policyholder account balances. Higher crediting rates causedinterest on annuity and investment products to increase by $10 million, or 1%, to $950 million in 2000 from $940 million in 1999.
Policyholder dividends increased by $233 million, or 15%, to $1,742 million in 2000 from $1,509 million in 1999. Excluding the impact of theGenAmerica acquisition, policyholder dividends increased by $33 million, or 2%. This increase is due to growth in cash values of policies associated withthis segment’s large block of traditional life insurance business.
Other expenses increased by $792 million, or 29%, to $3,511 million in 2000 from $2,719 million in 1999. Excluding the capitalization andamortization of deferred policy acquisition costs, which are discussed below, other expenses increased by $784 million, or 27%, to $3,660 million in2000 from $2,876 million in 1999. Excluding the impact of the GenAmerica acquisition, other expenses increased by $291 million, or 10%. Otherexpenses related to insurance products increased by $182 million, or 8%, to $2,419 million in 2000 from $2,237 million in 1999. This increase isattributable to a $111 million increase from the broker/dealer and other subsidiaries commensurate with the increase in other revenues discussed above.In addition, increased volume in the securities lending program resulted in a $122 million increase in related rebate expense. These increases werepartially offset by a $51 million reduction in general and administrative expenses. Other expenses related to annuity and investment products increasedby $109 million, or 17%, to $748 million in 2000 from $639 million in 1999. This increase resulted from a $54 million increase in rebate expenseassociated with the Company’s securities lending program. The remaining increase is largely attributable to a $54 million increase in general andadministrative expenses incurred in connection with initiatives focused on improving service delivery capabilities through investments in technology andthe consolidation of operations.
Deferred policy acquisition costs are principally amortized in proportion to gross margins or gross profits, including investment gains or losses. Theamortization is allocated to investment gains and losses to provide consolidated statement of income information regarding the impact of investmentgains and losses on the amount of the amortization, and other expenses to provide amounts related to gross margins or profits originating fromtransactions other than investment gains and losses.
Capitalization of deferred policy acquisition costs increased by $90 million to $872 million in 2000 from $782 million in 1999, while total amortizationof deferred policy acquisition costs, charged to operations, increased by $49 million to $628 million in 2000 from $579 million in 1999. Excluding theimpact of the GenAmerica acquisition, capitalization of deferred policy acquisition costs decreased by $6 million, or 1%, while total amortization ofdeferred policy acquisition costs decreased by $117 million, or 20%. Amortization of deferred policy acquisition costs of $723 million and $625 million areallocated to other expenses in 2000 and 1999, respectively, while the remainder of the amortization in each year is allocated to investment gains andlosses. Excluding the impact of the GenAmerica acquisition, amortization of deferred policy acquisition costs of $585 million and $625 million areallocated to other expenses in 2000 and 1999, respectively, while the remainder of the amortization in each year is allocated to investment gains andlosses. Amortization of deferred policy acquisition costs allocated to other expenses related to insurance products decreased by $128 million to $389million in 2000 from $517 in 1999. This decrease is due to refinements in the calculation of estimated gross margins and profits, as well as theacceleration of the recognition of unearned fees in connection with the product replacement program discussed above. Amortization of deferred policyacquisition costs allocated to other expenses related to annuity and investment products increased by $88 million to $196 million in 2000 from $108million in 1999. This increase is primarily due to refinements in the calculation of estimated gross profits.
Year ended December 31, 1999 compared with the year ended December 31, 1998Premiums decreased by $34 million, or 1%, to $4,289 million in 1999 from $4,323 million in 1998. Premiums from insurance products decreased
by $16 million to $4,215 million in 1999 from $4,231 million in 1998. This decrease is primarily due to a decline in sales of traditional life insurancepolicies, which reflects a continued shift in policyholders’ preferences from those policies to variable life products. Premiums from annuity and investmentproducts decreased by $18 million, or 20%, to $74 million in 1999 from $92 million in 1998, primarily due to lower sales of supplementary contracts withlife contingencies. The relatively high level of supplemental contract premiums in 1998 reflected the initial offering of a payout annuity feature in that year.
Universal life and investment-type product policy fees increased by $71 million, or 9%, to $888 million in 1999 from $817 million in 1998. Policy feesfrom insurance products increased by $3 million, or 1%, to $571 million in 1999 from $568 million in 1998. This increase is attributable to a $77 millionincrease in separate account contract fees arising from increased sales of variable life products. This increase is almost entirely offset by reinsurancetreaties entered into during 1998 related to $86 billion of universal life insurance in-force, which constitutes the majority of the mortality risk on universal lifebusiness written subsequent to January 1, 1983. Policy fees from annuity and investment products increased by $68 million, or 27%, to $317 million in1999 from $249 million in 1998, primarily due to the continued growth in deposits for investment products and stock market appreciation.
Other revenues increased by $84 million, or 18%, to $558 million in 1999 from $474 million in 1998. Other revenues for insurance productsincreased by $85 million, or 19%, to $521 million in 1999 from $436 million in 1998. This increase is primarily attributable to the inclusion of a full year’sactivity of Nathan & Lewis, as well as increased commission and fee income associated with increased sales of non-proprietary products. Otherrevenues for annuity and investment products are essentially flat at $37 million in 1999 compared with $38 million in 1998.
Policyholder benefits and claims increased by $19 million to $4,625 million in 1999 from $4,606 million in 1998. Policyholder benefits and claims forinsurance products increased by $85 million, or 2%, to $4,450 million in 1999 from $4,365 million in 1998. This increase is primarily due to growth in the
MetLife, Inc.10

existing block of traditional life policyholder liabilities. Policyholder benefits and claims for annuity and investment products decreased by $66 million, or27%, to $175 million in 1999 from $241 million in 1998 consistent with the decreased premiums discussed above.
Interest credited to policyholder account balances decreased by $64 million, or 4%, to $1,359 million in 1999 from $1,423 million in 1998. Intereston insurance products decreased by $18 million, or 4%, to $419 million in 1999 from $437 million in 1998. This decrease is primarily due to reducedcrediting rates on universal life products. Interest on annuity and investment products decreased by $46 million, or 5%, to $940 million in 1999 from$986 million in 1998. This decrease is due to a 1998 reinsurance transaction, a shift in policyholders’ preferences to separate account alternatives andreduced crediting rates.
Policyholder dividends increased by $64 million, or 4%, to $1,509 million in 1999 from $1,445 million in 1998. This increase is due to dividendincreases from growth in cash values of policies associated with this segment’s large block of traditional individual life insurance business, combined witha dividend scale increase in 1999.
Other expenses increased by $142 million, or 6%, to $2,719 million in 1999 from $2,577 million in 1998. Excluding the net capitalization of deferredpolicy acquisition costs, other expenses decreased by $71 million, or 2%, to $2,876 million in 1999 from $2,947 million in 1998. Other expenses relatedto insurance products decreased by $152 million, or 6%, to $2,237 million in 1999 from $2,389 million in 1998. This decrease was attributable toexpense management initiatives instituted in 1999 and an adjustment to the allocation of expenses in 1999 between insurance and annuity products tobetter match expenses to the mix of its business. These decreases are partially offset by a $44 million increase due to the inclusion of a full year’s activityof Nathan & Lewis. Other expenses related to annuity and investment products increased by $81 million, or 15%, to $639 million in 1999 from $558million in 1998, primarily due to the adjustment of expenses noted above.
Deferred policy acquisition costs are principally amortized in proportion to gross margins or gross profits, including investment gains or losses. Theamortization is allocated to investment gains (losses) to provide consolidated statement of income information regarding the impact of investment gainsand losses on the amount of the amortization, and other expenses to provide amounts related to gross margins or profits originating from transactionsother than investment gains and losses.
Capitalization of deferred policy acquisition costs increased to $782 million in 1999 from $756 million in 1998 while total amortization of such costs,charged to operations, decreased to $579 million in 1999 from $626 million in 1998. Amortization of deferred policy acquisition costs of $625 million and$386 million are allocated to other expenses in 1999 and 1998, respectively, while the remainder of the amortization in each year is allocated toinvestment gains and losses. Amortization of deferred policy acquisition costs allocated to other expenses related to insurance products increased to$517 million in 1999 from $277 million in 1998 attributable to the reinsurance transaction discussed above and refinements in the calculation ofestimated gross margins. Amortization of deferred policy acquisition costs allocated to other expenses related to annuity products remained essentiallyunchanged at $108 million in 1999 compared with $109 million in 1998.
Institutional Business
Year ended December 31, 2000 compared with the year ended December 31, 1999Premiums increased by $1,375 million, or 25%, to $6,900 million in 2000 from $5,525 million in 1999. Excluding the impact of the GenAmerica
acquisition, premiums increased by $1,297 million, or 23%, to $6,822 million in 2000 from $5,525 million in 1999. Group insurance premiums increasedby $953 million, or 19%, to $6,048 million in 2000 from $5,095 million in 1999. This increase is predominately the result of strong sales and continuedfavorable policyholder retention in this segment’s group life, dental and disability businesses, as well as $121 million of additional insurance coveragespurchased by existing customers with funds received in the demutualization. In addition, the BMA and Lincoln National acquisitions contributed $103million to the variance. Retirement and savings premiums increased by $344 million, or 80%, to $774 million in 2000 from $430 million in 1999, primarilydue to significant premiums received from existing customers in 2000.
Universal life and investment-type product policy fees increased by $45 million, or 9%, to $547 million in 2000 from $502 million in 1999. Excludingthe impact of the GenAmerica acquisition, universal life and investment-type product policy fees increased by $6 million, or 1%, to $508 million in 2000from $502 million in 1999. This increase reflects growth in group universal life products.
Other revenues increased by $44 million, or 7%, to $673 million in 2000 from $629 million in 1999. Excluding the impact of the GenAmericaacquisition, other revenues increased by $36 million, or 6%, to $665 million in 2000 from $629 million in 1999. Group insurance other revenuesincreased by $53 million, or 18%, to $355 million in 2000 from $302 million in 1999. The primary driver of this increase was strong sales growth in thissegment’s dental and disability administrative services businesses. Retirement and savings other revenues decreased by $17 million, or 5%, to $310million in 2000 from $327 million in 1999, primarily due to a special performance fee received in 1999.
Policyholder benefits and claims increased by $1,466 million, or 22%, to $8,178 million in 2000 from $6,712 million in 1999. Excluding the impact ofthe GenAmerica acquisition, policyholder benefits and claims increased by $1,366 million, or 20%, to $8,078 million in 2000 from $6,712 million in 1999.Group life increased by $411 million, or 12%, to $3,941 million in 2000 from $3,530 million in 1999, primarily due to overall growth in the business,commensurate with the premium variance discussed above. Non-medical health increased by $614 million, or 46%, to $1,941 million in 2000 from$1,327 million in 1999. This increase is largely attributable to significant growth in this segment’s dental and disability businesses. In addition, the BMAand Lincoln National acquisitions contributed to the variance. Retirement and savings increased by $341 million, or 18%, to $2,196 million in 2000 from$1,855 million in 1999 commensurate with the premium variance above.
Interest credited to policyholders increased by $60 million, or 6%, to $1,090 million in 2000 from $1,030 million in 1999. Excluding the impact of theGenAmerica acquisition, interest credited to policyholder account balances increased by $54 million, or 5%, to $1,084 million in 2000 from $1,030million in 1999. Group insurance increased by $84 million, or 21%, to $482 million in 2000 from $398 million in 1999. This increase is primarily due toasset growth in customer account balances and the bank-owned life insurance business, as well as an increase in the cash values of executive andcorporate-owned universal life plans. Retirement and savings decreased by $30 million, or 5%, to $602 million in 2000 from $632 million in 1999, due toa continued shift in customers’ investment preferences from guaranteed interest products to separate account alternatives.
Policyholder dividends decreased by $35 million, or 22%, to $124 million in 2000 from $159 million in 1999. Policyholder dividends vary from periodto period based on participating group insurance contract experience.
Other expenses increased by $164 million, or 10%, to $1,753 million in 2000 from $1,589 million in 1999. Excluding the impact of the GenAmericaacquisition, expenses increased by $126 million, or 8%, to $1,715 million in 2000 from $1,589 million in 1999. Other expenses related to group lifeincreased by $56 million, or 15%, to $438 million in 2000 from $382 million in 1999. Other expenses related to group non-medical health increased by$12 million, or 2%, to $685 million in 2000 from $673 million in 1999. Other expenses related to retirement and savings increased by $58 million, or 11%,to $592 million in 2000 from $534 million in 1999. These increases are primarily due to costs incurred in connection with initiatives that focused onimproving service delivery capabilities through investments in technology and higher expenses associated with the Company’s securities lendingprogram. In addition, an increase in volume-related expenses associated with premium growth contributed to the variance. Volume-related expensesinclude premium taxes, separate account investment management expenses and commissions.
MetLife, Inc.11

Year ended December 31, 1999 compared with the year ended December 31, 1998Premiums increased by 7% to $5,525 million in 1999 from $5,159 million in 1998. Group insurance premiums increased by $478 million, or 10%, to
$5,095 million in 1999 from $4,617 million in 1998. This increase is largely attributable to strong sales and improved policyholder retention in non-medicalhealth, primarily the dental and disability businesses. Retirement and savings premiums decreased by $112 million, or 21%, to $430 million in 1999 from$542 million in 1998, primarily due to premiums received from several large existing customers in 1998.
Universal life and investment-type product policy fees increased by 6% to $502 million in 1999 from $475 million in 1998. This increase reflects thecontinued growth in the sale of products used in executive- and corporate-owned benefit plans due to the continued favorable tax status associated withthese products.
Other revenues increased by 9% to $629 million in 1999 from $575 million in 1998. Group life decreased by $51 million, or 77%, to $15 million in1999 from $66 million in 1998. This decrease is primarily due to lower income in 1999 relating to funds used to seed separate accounts. Non-medicalhealth increased by $61 million, or 27%, to $287 million in 1999 from $226 million in 1998. This increase is primarily due to growth in the dentaladministrative service business. Retirement and savings increased by $44 million, or 16%, to $327 million in 1999 from $283 million in 1998. Thisincrease reflects higher administrative fees derived from separate accounts and defined contribution record-keeping services. In addition, the 1999results reflect interest on funds held on deposit relating to a reinsurance transaction entered into during December 1998.
Policyholder benefits and claims increased by 5% to $6,712 million in 1999 from $6,416 million in 1998. Group insurance increased by $362 million,or 8%, to $4,857 million in 1999 from $4,495 million in 1998. This increase is primarily due to overall growth and is comparable to the growth in premiumsdiscussed above. Retirement and savings decreased by $66 million, or 3%, to $1,855 million in 1999 from $1,921 million in 1998. The decrease iscommensurate with the premium variance discussed above, partially offset by an increase in liabilities associated with the continued accumulation ofinterest on liabilities relating to this segment’s large block of non-participating annuity business.
Interest credited to policyholder account balances decreased by 14% to $1,030 million in 1999 from $1,199 million in 1998. Group insurancedecreased by $63 million, or 14%, to $398 million in 1999 from $461 million in 1998. This decrease is primarily due to cancellations in the leveragedcorporate-owned life insurance business attributable to a change in the federal income tax treatment for these products. Retirement and savingsdecreased by $106 million, or 14%, to $632 million in 1999 from $738 million in 1998 due to a shift in customers’ investment preferences fromguaranteed interest products to separate account alternatives and the continuation of the low interest rate environment.
Policyholder dividends increased by 12% to $159 million in 1999 from $142 million in 1998. Non-medical health increased by $26 million to $27million in 1999. Group life and retirement and savings decreased $9 million, or 6%, to $132 million in 1999 from $141 million in 1998. Policyholderdividends vary from period to period based on participating group insurance contract experience.
Other expenses decreased by 1% to $1,589 million in 1999 from $1,613 million in 1998. Other expenses related to group life decreased by $14million, or 4%, to $382 million in 1999 from $396 million in 1998. Other expenses related to non-medical health decreased by $18 million, or 3%, to $673million in 1999 from $691 million in 1998. These decreases are primarily attributable to reductions in non-sales positions and the achievement ofoperational efficiencies. Other expenses related to retirement and savings products increased by $8 million, or 2%, to $534 million in 1999 from $526million in 1998. This increase is due to higher interest expense of $47 million primarily due to commercial paper issued in connection with amountsplaced on deposit related to a 1998 reinsurance transaction and a $15 million increase in volume-related expenses, including premium taxes, separateaccount investment management expenses and commissions. These increases are partially offset by a $54 million decrease due to reductions in non-sales positions and other administrative expenses.
Reinsurance
Year ended December 31, 2000As a result of the acquisition of GenAmerica, MetLife beneficially owns approximately 59% of RGA. MetLife’s Reinsurance segment is comprised of
the life reinsurance business of RGA, and MetLife’s ancillary life reinsurance business. The ancillary life reinsurance business was an immaterialcomponent of MetLife’s Individual Business segment for periods prior to January 1, 2000.
Revenues were $1,856 million for the year ended December 31, 2000. Reinsurance revenues are primarily derived from renewal premiums fromexisting reinsurance treaties, new business premiums from existing or new reinsurance treaties and income earned on invested assets. Premium levelsare significantly influenced by large transactions and reporting practices of ceding companies and, as a result, can fluctuate from period to period.
Expenses were $1,672 million for the year ended December 31, 2000. Policy benefits and claims were 75.6% of premiums for the year endedDecember 31, 2000, which is consistent with management’s expectations. Underwriting, acquisition and insurance expenses, which are included inother expenses, were 22.3% of premiums for the year ended December 31, 2000. This percentage fluctuates depending on the mix of the underlyinginsurance products being reinsured. Interest credited to policyholder account balances are related to amounts credited on RGA’s deposit-type contractsand cash value products, which have a significant mortality component. This amount fluctuates with the changes in cash values and changes in interestcrediting rates.
Minority interest, which represents third-party ownership interests in RGA, was $67 million for the year ended December 31, 2000.
Auto & Home
Year ended December 31, 2000 compared with the year ended December 31, 1999Premiums increased by $885 million, or 51%, to $2,636 million in 2000 from $1,751 million in 1999, primarily due to the St. Paul acquisition in 1999.
Excluding the impact of the St. Paul acquisition, premiums increased by $130 million, or 9%. Auto premiums increased by $95 million, or 8%, to $1,313million in 2000 from $1,218 million in 1999. This increase is primarily due to growth in the standard auto insurance book of business, which wasattributable to increased new business production resulting from an increase in independent agents in this segment’s sales force and improved retentionin the existing business. Policyholder retention in the standard auto business increased by 1% to 89%. Homeowner premiums increased by $27 million,or 11%, to $282 million in 2000 from $255 million in 1999 due to higher new business production as a result of a larger sales force and an increase inpolicyholder retention of 2% to 91% in 2000 from 89% in 1999. Premiums from other personal lines increased by 44% to $26 million in 2000 from $18million in 1999.
Other revenues increased by $19 million, or 90%, to $40 million in 2000 from $21 million in 1999, primarily due to a revision of an estimate ofamounts recoverable from reinsurers related to the disposition of this segment’s reinsurance business in 1990.
Expenses increased by $1,017 million, or 56%, to $2,832 million in 2000 from $1,815 million in 1999. Excluding the impact of the St. Paulacquisition, expenses increased by $152 million, or 10%, which resulted in an increase in the combined ratio to 103.9% in 2000 from 102.8% in 1999.As discussed below, higher overall loss costs, predominately in the homeowners line, is the primary cause of this increase.
MetLife, Inc.12

Policyholder benefits and claims increased by $704 million, or 54%, to $2,005 million in 2000 from $1,301 million in 1999. Automobile policyholderbenefits and claims increased by $438 million, or 42%, to $1,490 million in 2000 from $1,052 million in 1999. Homeowner policyholder benefits andclaims increased by $260 million, or 112%, to $493 million in 2000 from $233 million in 1999. Other policyholder benefits and claims increased by $6million, or 38%, to $22 million in 2000 from $16 million in 1999. Correspondingly, the auto loss ratio increased to 76.6% in 2000 from 76.1% in 1999 andthe homeowners loss ratio increased to 76.4% from 67.2% in 1999. The increase in the homeowners loss ratio is primarily due to higher catastrophelosses and expenses, predominantly in the St. Paul book of business. Catastrophes, including multiple storms and the Los Alamos fire, resulted in anincrease in the catastrophe loss ratio to 17.3% in 2000 from 6.3% in 1999.
Excluding the impact of the St. Paul acquisition, policyholder benefits and claims increased by $124 million, or 11%. Auto policyholder benefits andclaims increased by $102 million, or 11%, to $1,041 million in 2000 from $939 million in 1999. This is largely attributable to a 9% increase in the numberof policies in force and increased costs resulting from an increase in the use of original equipment manufacturer parts and higher labor rates. The autoloss ratio increased to 79.3% in 2000 from 77.1% in 1999. Homeowners benefits and claims increased by $23 million, or 14%, to $186 million in 2000from $163 million in 1999, primarily due to the increased volume of this book of business and increased catastrophe experience as discussed above.The homeowners loss ratio increased by 1.6% to 66.0% in 2000 from 64.4% in 1999. Other personal lines benefits and claims decreased by $1 millionto $11 million in 2000 from $12 million in 1999.
Other expenses increased by $313 million, or 61%, to $827 million in 2000 from $514 million in 1999, which resulted in an increase in the expenseratio to 31.4% in 2000 from 29.3% in 1999. A portion of the increase in expenses from 1999 to 2000 is associated with the costs incurred in connectionwith the integration of the St. Paul business acquired.
Year ended December 31, 1999 compared with the year ended December 31, 1998Premiums increased by 25% to $1,751 million in 1999 from $1,403 million in 1998 primarily due to the St. Paul acquisition in 1999. Excluding the
impact of the St. Paul acquisition, premiums increased by $88 million, or 6%. Auto premiums increased by $54 million, or 5%, to $1,218 million in 1999from $1,164 million in 1998. This increase is due to growth in both the standard and non-standard auto insurance books of business. ‘‘Non-standard’’auto insurance is insurance for risks bearing higher loss experience or loss potential than risks covered by standard auto insurance policies. In addition,the standard auto policyholder retention increased 1% to 88%. Homeowner premiums increased by $30 million, or 13%, to $255 million in 1999 from$225 million in 1998 due to higher new business production, an average premium increase of 1%, and increased policyholder retention to 90% in 1999from 89% in 1998. Premiums from other personal lines increased to $18 million in 1999 from $14 million in 1998.
Other revenues decreased by 42% to $21 million in 1999 from $36 million in 1998. This decrease is primarily attributable to a decrease in paymentsresulting from experience-related adjustments under a reinsurance agreement related to the disposition of this segment’s reinsurance business in 1990.
Expenses increased by 28% to $1,815 million in 1999 from $1,415 million in 1998. This resulted in an increase in the combined ratio to 103.7% in1999 from 100.8% in 1998. Excluding the impact of the St. Paul acquisition, expenses increased by $116 million, or 8%, which resulted in an increase inthe combined ratio to 102.8% in 1999 from 100.8% in 1998. This increase is primarily due to higher overall loss costs in the auto and homeowners linesas discussed below. In addition, both lines experienced modestly elevated acquisition expenses due to increased levels of new business premiums.
Policyholder benefits and claims increased by 26% to $1,301 million in 1999 from $1,029 million in 1998. Correspondingly, the auto andhomeowners loss ratios increased to 76.1% from 74.9% and to 67.2% from 65.0% in 1999 and 1998, respectively. Excluding the impact of the St. Paulacquisition, policyholder benefits and claims increased by $85 million, or 8%. Auto policyholder benefits and claims increased by $67 million, or 8%, to$939 million in 1999 from $872 million in 1998, due to a 6% increase in the number of policies in-force and $23 million of unfavorable claimsdevelopment due to lower than expected savings resulting from the implementation of a new technology platform. Correspondingly, the auto loss ratioincreased to 77.1% in 1999 from 74.9% in 1998. Homeowners benefits and claims increased by $17 million, or 12%, to $163 million in 1999 from $146million in 1998 due to increased volume of this book of business. The homeowners loss ratio decreased by 0.6% to 64.4% in 1999 from 65.0% in 1998.Other personal lines benefits and claims increased by $1 million to $12 million in 1999 from $11 million in 1998.
Other expenses increased by 33% to $514 million in 1999 from $386 million in 1998, which resulted in an increase in the expense ratio to 29.3% in1999 from 27.4% in 1998. Excluding the impact of the St. Paul acquisition, operating expenses increased by $31 million, or 8%, resulting in an increasein the expense ratio to 27.9% in 1999 from 27.4% in 1998. This increase is primarily due to $10 million in additional administration expenses and $23million in new business acquisition expenses, which are partially offset by a reduction in employee-related expenses.
Asset Management
Year ended December 31, 2000 compared with the year ended December 31, 1999Other revenues, which are primarily comprised of management and advisory fees, decreased by $43 million, or 5%, to $760 million in 2000 from
$803 million in 1999. The most significant factor contributing to this decline is a $131 million decrease resulting primarily from the sale of Nvest, whichoccurred on October 30, 2000. This reduction is partially offset by a $79 million increase related to the acquisition of Conning, a component of theGenAmerica acquisition. Excluding the impact of these transactions, other revenues increased by $9 million, or 6%, to $159 million in 2000 from $150million in 1999. This is attributable to an increase in average assets under management during the year and a change in asset mix. Despite a $1 billion, or2%, decrease in assets under management from $57 billion as of December 31, 1999 to $56 billion at December 31, 2000, average assets undermanagement exceed those for the same period in 1999. The decline occurred during the fourth quarter as a result of a market downturn. Managementand advisory fees are typically calculated based on a percentage of assets under management, and are not necessarily proportionate to average assetsmanaged due to changes in account mix.
Other expenses increased by $8 million, or 1%, to $749 million in 2000 from $741 million in 1999. The sale of Nvest reduced other expenses by$92 million and the acquisition of Conning increased other expenses by $90 million. Excluding the impact of these transactions, other expensesincreased by $10 million, or 5%, to $202 million in 2000 from $192 million in 1999. Approximately half of the variance is attributable to an increase in totalcompensation and benefits. This expense totaled $103 million for the year 2000 and is comprised of approximately 59% base compensation and 41%variable compensation. Base compensation increased by $2 million, or 3%, to $61 million in 2000 from $59 million in 1999, primarily due to annual salaryincreases and higher staffing levels. Variable compensation increased by $3 million, or 8%, to $42 million in 2000 from $39 million in 1999. Variableincentive payments are based upon profitability, investment portfolio performance, new business sales and growth in revenues and profits. The variablecompensation plans reward the employees for growth in their businesses, but also require them to share in the impact of any declines. Generaladministrative expenses increased by $5 million, or 5%, to $99 million in 2000 from $94 million in 1999. This increase is primarily due to increased mutualfund expense subsidies, distribution costs and system enhancements.
Minority interest, reflecting third-party ownership interest in Nvest, decreased by $19 million, or 35%, to $35 million in 2000 from $54 million in 1999.
MetLife, Inc.13

Year ended December 31, 1999 compared with the year ended December 31, 1998Other revenues, which are primarily comprised of management and advisory fees, decreased by $14 million, or 2%, to $803 million in 1999 from
$817 million in 1998, reflecting an overall decrease in assets under management of $1 billion, or 1%, to $190 billion at December 31, 1999 from$191 billion at December 31, 1998. This decrease in assets is primarily attributable to a reduction in assets under management in value-style products.Management and advisory fees are typically calculated based on a percentage of assets under management, and are not necessarily proportionate toaverage assets managed due to changes in account mix.
Other expenses are essentially unchanged in 1999 from 1998. Total compensation and benefits of $424 million consisted of approximately 53%base compensation and 47% variable compensation. Base compensation increased by $10 million, or 5%, to $225 million in 1999 from $215 million in1998, primarily due to annual salary increases and higher staffing levels. Variable compensation decreased by $15 million, or 7%, to $199 million in 1999from $214 million in 1998. Variable incentive payments are based upon profitability, investment portfolio performance, new business sales and growth inrevenues and profits. The variable compensation plans reward the employees for growth in their businesses, but also require them to share in the impactof any declines. In addition, general and administrative expenses increased by $6 million, or 2%, to $317 million in 1999 from $311 million in 1998,primarily due to increased discretionary spending.
Minority interest, reflecting third-party ownership interests in Nvest, decreased by $5 million, or 9%, to $54 million in 1999 from $59 million in 1998.
International
Year ended December 31, 2000 compared with the year ended December 31, 1999Premiums increased by $137 million, or 26%, to $660 million in 2000 from $523 million in 1999. Mexico’s premiums increased by $45 million,
primarily due to new business growth in the group life and major medical products. South Korea’s increase in premiums of $29 million is mainlyattributable to the establishment of a new professional agency force resulting in higher productivity levels and an improvement in the individual lifebusiness’ persistency. The majority of Taiwan’s premium increase of $28 million is due to overall growth in the individual life business. Increased salesfrom the direct auto business is the principal driver behind Spain’s premium increase of $18 million. Brazil’s premiums increased by $14 million resultingpredominately from business expansion. Brazil began selling business late in the second quarter of 1999 and acquired two large blocks of business inthe beginning of 2000. The remainder of the increase is due to minor increases in several other countries.
Universal life and investment-type product policy fees increased by $10 million, or 22%, to $53 million in 2000 from $43 million in 1999, primarilydue to expanded business operations in both Argentina and Spain.
Other revenues decreased by $3 million to $9 million in 2000 from $12 million in 1999. This decrease is attributable to variances in several countries.Policyholder benefits and claims increased by $104 million, or 23%, to $562 million in 2000 from $458 million in 1999. Mexico, Taiwan, South Korea
and Brazil’s policyholder benefits and claims increased by $35 million, $32 million, $14 million and $8 million, respectively, commensurate with the overallpremium growth discussed above. Spain’s policyholder benefits and claims increased by $11 million, primarily due to increases in auto claims. This isconsistent with the premium growth discussed above. The remainder of the increase is primarily due to expanded business operations in several othercountries.
Interest credited to policyholder account balances increased by $4 million, or 8%, to $56 million in 2000 from $52 million in 1999 as a result ofgrowth in policyholder account balances in Argentina and Mexico.
Policyholder dividends increased by $10 million, or 47%, to $32 million in 2000 from $22 million in 1999. This increase is largely attributable togrowth in Mexico’s participating group business and is in line with the increase in premiums discussed above.
Payments of $327 million related to Metropolitan Life’s demutualization were made during the second quarter of 2000 to holders of certain policiestransferred to Clarica Life Insurance Company in connection with the sale of a substantial portion of the Company’s Canadian operations in 1998.
Other expenses increased by $44 million, or 18%, to $292 million in 2000 from $248 million in 1999. This increase is partially attributable tobusiness expansion initiatives in Brazil and Uruguay and the establishment of operations in Poland, the Philippines, and India in 2000. The remainingincrease in other expenses is commensurate with the overall growth discussed above.
Year ended December 31, 1999 compared with the year ended December 31, 1998Premiums decreased by 15% to $523 million in 1999 from $618 million in 1998, primarily due to the disposition of a substantial portion of the
Company’s Canadian operations. Excluding the impact of this sale, premiums increased by $109 million, or 26%, to $523 million in 1999 from$414 million in 1998. Argentina’s premiums increased by $11 million, primarily due to expanded business operations. South Korea’s and Taiwan’spremiums increased by $24 million and $39 million, respectively, due to improved economic environments. Spain’s premiums increased by $24 millionprimarily due to increased sales through the Company’s joint venture partnership.
Universal life and investment-type product policy fees decreased by 37% to $43 million in 1999 from $68 million in 1998. Excluding the impact ofthe Canadian divestiture, universal life and investment-type product policy fees were essentially unchanged at $43 million in 1999 compared with $46million in 1998.
Other revenues decreased by 64% to $12 million in 1999 from $33 million in 1998. Excluding the impact of the Canadian divestiture, other revenuesincreased slightly to $12 million in 1999 from $10 million in 1998.
Policyholder benefits and claims decreased by 23% to $458 million in 1999 from $597 million in 1998. Excluding the impact of the Canadiandivestiture, policyholder benefits and claims increased by $101 million, or 28%, to $458 million in 1999 from $357 million in 1998. This increase iscommensurate with the aforementioned increase in premiums.
Interest credited to policyholder account balances decreased by 42% to $52 million in 1999 from $89 million in 1998. Excluding the impact of theCanadian divestiture, interest credited to policyholder account balances increased by $1 million, or 2%, to $52 million in 1999 from $51 million in 1998 inline with increased account balances.
Policyholder dividends decreased by 66% to $22 million in 1999 from $64 million in 1998. Excluding the impact of the Canadian divestiture,policyholder dividends decreased $1 million, or 5%, to $22 million in 1999 from $21 million in 1998, primarily due to less favorable experience onparticipating policies in Spain.
Other expenses decreased by 30% to $248 million in 1999 from $352 million in 1998. Excluding the impact of the Canadian divestiture, otherexpenses decreased by $7 million, or 3%, to $248 million in 1999 from $255 million in 1998. This decrease is primarily attributable to ongoing costreduction initiatives.
MetLife, Inc.14
Corporate
Year ended December 31, 2000 compared with the year ended December 31, 1999Total revenues for the Corporate segment, which consist of net investment income, other revenues, and net investment losses that are not allocated
to other business segments, decreased by $40 million, or 6%, to $583 million in 2000 from $623 million in 1999. Excluding the impact of theGenAmerica acquisition, total revenues decreased by $169 million, or 27%. This decrease is primarily due to a $179 million increase in net investmentlosses. These losses reflect the continuation of the Company’s strategy to reposition its investment portfolio to provide a higher operating return on itsinvested assets. Total Corporate expenses decreased by $290 million, or 22%, to $1,001 million in 2000 from $1,291 million in 1999. Excluding theimpact of the GenAmerica acquisition, total expenses decreased by $426 million, or 33%. During 1999, the Company reported a $499 million chargeprincipally related to the settlement of a multidistrict litigation proceeding involving alleged improper sales practices, accruals for sales practices claims notcovered by the settlement and other legal costs.
Year ended December 31, 1999 compared with the year ended December 31, 1998Total revenues for the Corporate segment, which consist of net investment income and realized investment gains and losses that are not allocated to
other business segments, were $623 million in 1999, a decrease of $849 million, or 58%, from $1,472 million in 1998, primarily due to a reduction ininvestment gains and investment income of $722 million due to the sale of MetLife Capital Holdings in 1998. Total Corporate expenses were $1,291million in 1999, a decrease of $1,306 million, or 50%, from $2,597 million in 1998. This decrease is primarily due to a $1,895 million charge in 1998 forsales practices claims and claims for personal injuries caused by exposure to asbestos or asbestos-containing products, as well as the elimination of$270 million of expenses due to the sale of MetLife Capital Holdings. These decreases are partially offset by a $499 million charge in 1999 principallyrelated to the settlement of a multidistrict litigation proceeding involving alleged improper sales practices, accruals for sales practices claims not coveredby the settlement and other legal costs, as well as a $254 million increase in demutualization costs.
Liquidity and Capital Resources
The Holding CompanyThe primary uses of liquidity of the Holding Company include the payment of Common Stock dividends, interest payments on debentures issued to
MetLife Capital Trust I and other debt servicing, contributions to subsidiaries, and payment of general operating expenses. The primary source of theHolding Company’s liquidity is dividends it receives from Metropolitan Life and the interest received from Metropolitan Life under the capital notedescribed in Note 9 of Notes to Consolidated Financial Statements. The Holding Company’s ability, on a continuing basis, to meet its cash needsdepends primarily on the receipt of dividends and the interest on the capital note from Metropolitan Life.
Under the New York Insurance Law, Metropolitan Life is permitted without prior insurance regulatory clearance to pay a stockholder dividend to the HoldingCompany as long as the aggregate amount of all such dividends in any calendar year does not exceed the lesser of (i) 10% of its surplus to policyholders as ofthe immediately preceding calendar year and (ii) its net gain from operations for the immediately preceding calendar year (excluding realized capital gains).Metropolitan Life will be permitted to pay a stockholder dividend to the Holding Company in excess of the lesser of such two amounts only if it files notice of itsintention to declare such a dividend and the amount thereof with the New York Superintendent of Insurance (the ‘‘Superintendent’’) and the Superintendent doesnot disapprove the distribution. Under the New York Insurance Law, the Superintendent has broad discretion in determining whether the financial condition of astock life insurance company would support the payment of such dividends to its stockholders. The New York Insurance Department has established informalguidelines for such determinations. The guidelines, among other things, focus on the insurer’s overall financial condition and profitability under statutory accountingpractices. Management of the Company cannot provide assurance that Metropolitan Life will have statutory earnings to support payment of dividends to theHolding Company in an amount sufficient to fund its cash requirements and pay cash dividends or that the Superintendent will not disapprove any dividends thatMetropolitan Life must submit for the Superintendent’s consideration. MetLife’s other insurance subsidiaries are also subject to restrictions on the payment ofdividends to their respective parent companies.
The dividend limitation is based on statutory financial results. Statutory accounting practices differ in certain respects from accounting principlesused in financial statements prepared in conformity with GAAP. The significant differences relate to deferred policy acquisition costs, deferred incometaxes, required investment reserves, reserve calculation assumptions, capital notes and surplus notes.
In connection with the contribution of the net proceeds from the initial public offering, the private placements and the offering of equity security units,Metropolitan Life issued to the Holding Company a $1,006 8.00% mandatorily convertible capital note due 2005.
The Superintendent approved the issuance of the capital note on April 4, 2000. If the payment of interest is prevented by application of the paymentrestrictions described in Note 9 in Notes to Consolidated Financial Statements, the interest on the capital note will not be available as a source of liquidityfor the Holding Company.
Based on the historic cash flows and the current financial results of Metropolitan Life, subject to any dividend limitations which may be imposed uponMetropolitan Life or its subsidiaries by regulatory authorities, management believes that cash flows from operating activities, together with the dividends itis permitted to pay without prior insurance regulatory clearance and the interest received on the capital note from Metropolitan Life, will be sufficient toenable the Holding Company to make dividend payments on its Common Stock, to pay all operating expenses, make payments on the debenturesissued to MetLife Capital Trust I and meet its other obligations.
The CompanyLiquidity sources. The Company’s principal cash inflows from its insurance activities come from life insurance premiums, annuity considerations
and deposit funds. A primary liquidity concern with respect to these cash inflows is the risk of early contract holder and policyholder withdrawal. TheCompany seeks to include provisions limiting withdrawal rights from general account institutional pension products (generally group annuities, includingguaranteed interest contracts and certain deposit fund liabilities) sold to employee benefit plan sponsors.
The Company’s principal cash inflows from its investment activities result from repayments of principal and proceeds from maturities and sales ofinvested assets, investment income, as well as dividends and distributions from subsidiaries. The primary liquidity concerns with respect to these cashinflows are the risks of default by debtors, interest rate and other market volatilities and potential illiquidity of subsidiaries. The Company closely monitorsand manages these risks.
Additional sources of liquidity to meet unexpected cash outflows are available from the Company’s portfolio of liquid assets. These liquid assetsinclude substantial holdings of U.S. treasury securities, short-term investments, common stocks and marketable fixed maturity securities. The Company’savailable portfolio of liquid assets was approximately $101 billion and $88 billion at December 31, 2000 and December 31, 1999, respectively.
Sources of liquidity also include facilities for short- and long-term borrowing as needed, primarily arranged through MetLife Funding, Inc., a subsidiaryof Metropolitan Life. See ‘‘— Financing’’ below.
MetLife, Inc.15

Liquidity uses. The Company’s principal cash outflows primarily relate to the liabilities associated with its various life insurance, annuity and grouppension products, operating expenses, income taxes, contributions to subsidiaries, as well as principal and interest on its outstanding debt obligations.Liabilities arising from its insurance activities primarily relate to benefit payments under the above-named products, as well as payments for policysurrenders, withdrawals and loans.
The Company’s management believes that its sources of liquidity are more than adequate to meet its current cash requirements.Litigation. Various litigation claims and assessments against the Company have arisen in the course of the Company’s business, including, but
not limited to, in connection with its activities as an insurer, employer, investor, investment advisor and taxpayer. Further, state insurance regulatoryauthorities and other Federal and state authorities regularly make inquiries and conduct investigations concerning the Company’s compliance withapplicable insurance and other laws and regulations.
It is not feasible to predict or determine the ultimate outcome of all pending investigations and legal proceedings or provide reasonable ranges ofpotential losses. In some of the matters referred to above, very large and/or indeterminate amounts, including punitive and treble damages, are sought.Based on information currently known by the Company’s management, in its opinion, the outcomes of such pending investigations and legalproceedings are not likely to have a material adverse effect on the Company’s consolidated financial position. However, given the large and/orindeterminate amounts sought in certain of these matters and the inherent unpredictability of litigation, it is possible that an adverse outcome in certainmatters could, from time to time, have a material adverse effect on the Company’s operating results or cash flows in particular quarterly or annual periods.See Note 10 of Notes to Consolidated Financial Statements.
Risk-based capital. Section 1322 of the New York Insurance Law requires that New York domestic life insurers report their RBC based on aformula calculated by applying factors to various asset, premium and statutory reserve items. The formula takes into account the risk characteristics of theinsurer, including asset risk, insurance risk, interest rate risk and business risk. Section 1322 gives the Superintendent explicit regulatory authority torequire various actions by, or take various actions against, insurers whose total adjusted capital does not exceed certain RBC levels. At December 31,2000, Metropolitan Life’s and each of its U.S. insurance subsidiaries’ total adjusted capital was in excess of each of the RBC levels required by eachstate of domicile.
In March 1998, the NAIC adopted the Codification. The Codification, which is intended to standardize regulatory accounting and reporting to stateinsurance departments, became effective January 1, 2001. However, statutory accounting principles will continue to be established by individual statelaws and permitted practices. The New York Insurance Department requires adoption of the Codification, with certain modifications, for the preparation ofstatutory financial statements effective January 1, 2001. The Company believes that the adoption, effective January 1, 2001, of the Codification by theNAIC and the Codification as modified by the New York Insurance Department, as currently interpreted, will not adversely affect statutory capital andsurplus.
Financing. MetLife Funding, Inc. serves as a centralized finance unit for the Company. Pursuant to a support agreement, Metropolitan Life hasagreed to cause MetLife Funding to have a tangible net worth of at least one dollar. At December 31, 2000 and 1999, MetLife Funding had a tangible networth of $10.3 million and $10.5 million, respectively. MetLife Funding raises funds from various funding sources and uses the proceeds to extend loansto the Holding Company, Metropolitan Life and other affiliates. MetLife Funding manages its funding sources to enhance the financial flexibility and liquidityof MetLife. At December 31, 2000 and 1999, MetLife Funding had total outstanding liabilities of $1.1 billion and $4.2 billion, respectively, consistingprimarily of commercial paper.
In connection with the Company’s acquisition of the stock of GenAmerica, the Company incurred $900 million of short-term debt, consistingprimarily of commercial paper. In April 2000, the debt was repaid with proceeds from the offerings of Common Stock and equity security units and theprivate placements of Common Stock. The Company also incurred approximately $3.2 billion of short-term debt, consisting primarily of commercialpaper, in connection with its October 1, 1999 exchange offer to holders of General American funding agreements. This debt was repaid during 2000.
The Company also maintained approximately $2 billion in committed credit facilities at December 31, 2000, as compared with $7 billion ($5 billion ofwhich served as back-up for the commercial paper incurred in connection with the exchange offer to holders of General American funding agreements)at December 31, 1999. These credit facilities were not utilized during 2000 or 1999.
Support agreements. In addition to its support agreement with MetLife Funding described above, Metropolitan Life has entered into a net worthmaintenance agreement with New England, whereby it is obligated to maintain New England’s statutory capital and surplus at the greater of $10 million orthe amount necessary to prevent certain regulatory action by Massachusetts, the state of domicile of this subsidiary. The capital and surplus of NewEngland’s at December 31, 2000 was in excess of the amount that would trigger such an event.
In connection with the Company’s acquisition of GenAmerica, Metropolitan Life entered into a net worth maintenance agreement with GeneralAmerican, whereby Metropolitan Life is obligated to maintain General American’s statutory capital and surplus at the greater of $10 million or the amountnecessary to maintain the capital and surplus of General American at a level not less than 180% of the NAIC Risk Based Capitalization Model. The capitaland surplus of General American at December 31, 2000 was in excess of the required amount after giving effect to its receipt of $300 million through aseries of affiliated capital transactions.
Metropolitan Life has also entered into arrangements with some of its other subsidiaries and affiliates to assist such subsidiaries and affiliates inmeeting various jurisdictions’ regulatory requirements regarding capital and surplus. In addition, Metropolitan Life has entered into a support arrangementwith respect to reinsurance obligations of its wholly-owned subsidiary, Metropolitan Insurance and Annuity Company. Management does not anticipatethat these arrangements will place any significant demands upon the Company’s liquidity resources.
Consolidated cash flows. Net cash provided by operating activities was $1,326 million, $3,865 million and $842 million for the years endedDecember 31, 2000, 1999 and 1998, respectively. In 2000, the decrease in cash provided by operating activities was primarily the result of the timing inthe settlement in receivables and payables. In 1999, the change in cash provided by operating activities was largely due to strong growth in theInstitutional Business and Auto & Home segments. The growth in the Institutional Business segment is largely attributable to strong sales and improvedpolicyholder retention in non-medical health, predominately in the dental and disability businesses. The growth in Auto & Home is primarily due to theacquisition of the standard personal lines property and casualty insurance operations of The St. Paul Companies, as well as growth in both the standardand non-standard auto insurance businesses. Net cash provided by operating activities in 2000, 1999 and 1998 was more than adequate to meetliquidity requirements.
Net cash provided by (used in) investing activities was $83 million, $(2,389) million and $2,683 million for the years ended December 31, 2000,1999 and 1998, respectively. Purchases of investments exceeded sales, maturities and repayments by $7,313 million, $461 million and $7,647 millionin 2000, 1999 and 1998, respectively. In 2000, the increase in net purchases of investments resulted from increased volume in the Company’ssecurities lending program as well as the reinvestment of the proceeds from the sale of Nvest on October 30, 2000. In 1999, the significant decrease in
MetLife, Inc.16

net purchases of investments resulted from a decrease in the reinvestment of sales proceeds as a result of the funding agreement exchange offer inconnection with the GenAmerica acquisition, as well as the purchase of the individual disability income business of Lincoln National Insurance Company.Cash flows from investing activities increased by $5,840 million, $2,692 million and $3,769 million in 2000, 1999, and 1998, respectively, as a result ofincreased volume in the securities lending program.
Net cash used in financing activities was $764 million, $1,988 million and $3,135 million for the years ended December 31, 2000, 1999 and 1998,respectively. In 2000, the primary sources of cash from financing activities include cash proceeds from the Company’s initial public offering andconcurrent private placements in April 2000, as well as the issuance of mandatorily convertible securities in connection with the formation of MetLifeCapital Trust I. The primary uses of cash in financing activities include cash payments to eligible policyholders in connection with the demutualization, theacquisition of treasury stock, Common Stock dividends, and the pay-down of short-term debt. Deposits to policyholders’ account balances exceededwithdrawals by $599 million in 2000, as compared with withdrawals from policyholder account balances exceeding deposits of $2,222 million and$2,345 million in 1999 and 1998, respectively. Short-term financings decreased by $3,114 million in 2000 compared with an increase of $623 million in1999, while net additions to long-term debt were $88 million in 2000 compared with net reductions of $389 million in 1999.
The operating, investing and financing activities described above resulted in an increase (decrease) in cash and cash equivalents of $645 million,$(512) million and $390 million for the years ended December 31, 2000, 1999 and 1998, respectively.
Insolvency AssessmentsMost of the jurisdictions in which the Company is admitted to transact business require life insurers doing business within the jurisdiction to
participate in guaranty associations, which are organized to pay contractual benefits owed pursuant to insurance policies issued by impaired, insolvent orfailed life insurers. These associations levy assessments, up to prescribed limits, on all member insurers in a particular state on the basis of theproportionate share of the premiums written by member insurers in the lines of business in which the impaired, insolvent or failed insurer engaged. Somestates permit member insurers to recover assessments paid through full or partial premium tax offsets. Assessments levied against the Company fromJanuary 1, 1998 through December 31, 2000 aggregated $6 million. The Company maintained a liability of $63 million at December 31, 2000 for futureassessments in respect of currently impaired, insolvent or failed insurers.
Effects of InflationThe Company does not believe that inflation has had a material effect on its consolidated results of operations, except insofar as inflation may affect
interest rates.
InvestmentsThe Company had total cash and invested assets at December 31, 2000 of $160.0 billion. In addition, the Company had $70.3 billion held in its
separate accounts, for which the Company generally does not bear investment risk.The Company’s primary investment objective is to maximize after-tax operating income consistent with acceptable risk parameters. The Company is
exposed to three primary sources of investment risk:) credit risk, relating to the uncertainty associated with the continued ability of a given obligor to make timely payments of principal and interest;) interest rate risk, relating to the market price and cash flow variability associated with changes in market interest rates; and) market valuation risk for equity holdings.The Company manages risk through in-house fundamental analysis of the underlying obligors, issuers, transaction structures and real estate
properties. The Company also manages credit risk and market valuation risk through industry and issuer diversification and asset allocation. For realestate and agricultural assets, the Company manages credit risk and valuation risk through geographic, property type, and product type diversificationand asset allocation. The Company manages interest rate risk as part of its asset and liability management strategies, product design, such as the use ofmarket value adjustment features and surrender charges, and proactive monitoring and management of certain non-guaranteed elements of its products,such as the resetting of credited interest and dividend rates for policies that permit such adjustments.
The following table summarizes the Company’s cash and invested assets at December 31, 2000 and December 31, 1999:
At December 31,
2000 1999
Carrying % of Carrying % ofValue Total Value Total
(Dollars in millions)
Fixed maturities available for sale at fair value *********************************************** $112,979 70.7% $ 96,981 69.9%Mortgage loans on real estate************************************************************ 21,951 13.7 19,739 14.3Policy loans *************************************************************************** 8,158 5.1 5,598 4.0Equity real estate and real estate joint ventures ********************************************* 5,504 3.4 5,649 4.1Cash and cash equivalents ************************************************************** 3,434 2.1 2,789 2.0Equity securities and other limited partnership interests *************************************** 3,845 2.4 3,337 2.4Other invested assets ****************************************************************** 2,821 1.8 1,501 1.1Short-term investments ***************************************************************** 1,269 0.8 3,055 2.2
Total cash and invested assets*************************************************** $159,961 100.0% $138,649 100.0%
MetLife, Inc.17

Investment ResultsThe annual yields on general account cash and invested assets, excluding net investment gains and losses, were 7.5%, 7.3% and 7.5% for the
years ended December 31, 2000, 1999 and 1998, respectively.The following table illustrates the annual yields on average assets for each of the components of the Company’s investment portfolio for the years
ended December 31, 2000, 1999 and 1998:
2000 1999 1998
Yield(1) Amount Yield(1) Amount Yield(1) Amount
(Dollars in millions)
Fixed Maturities:(2)Investment income *************************************************** 7.8% $ 8,538 7.5% $ 7,171 7.4% $ 6,990Net investment (losses) gains ****************************************** (1,437) (538) 573
Total ************************************************************* $ 7,101 $ 6,633 $ 7,563
Ending assets ******************************************************* $112,979 $96,981 $100,767
Mortgage Loans:(3)Investment income *************************************************** 7.9% $ 1,693 8.1% $ 1,484 8.5% $ 1,580Net investment (losses) gains ****************************************** (18) 28 23
Total ************************************************************* $ 1,675 $ 1,512 $ 1,603
Ending assets ******************************************************* $ 21,951 $19,739 $ 16,827
Policy Loans:Investment income *************************************************** 6.5% $ 515 6.1% $ 340 6.6% $ 387
Ending assets ******************************************************* $ 8,158 $ 5,598 $ 5,600
Equity Real Estate and Real Estate Joint Ventures:(4)Investment income, net of expenses ************************************ 11.1% $ 629 9.7% $ 581 10.4% $ 687Net investment gains ************************************************* 101 265 424
Total ************************************************************* $ 730 $ 846 $ 1,111
Ending assets ******************************************************* $ 5,504 $ 5,649 $ 6,287
Cash, Cash Equivalents and Short-term Investments:Investment income *************************************************** 5.7% $ 288 4.2% $ 173 5.3% $ 187
Ending assets ******************************************************* $ 4,703 $ 5,844 $ 4,670
Equity Securities and Other Limited Partnership Interests:Investment income *************************************************** 5.0% $ 183 7.1% $ 239 5.6% $ 274Net investment gains ************************************************* 185 132 1,007
Total ************************************************************* $ 368 $ 371 $ 1,281
Ending assets ******************************************************* $ 3,845 $ 3,337 $ 3,387
Other Invested Assets:Investment income *************************************************** 6.3% $ 162 6.0% $ 91 12.2% $ 406Net investment gains (losses) ****************************************** 65 (24) 71
Total ************************************************************* $ 227 $ 67 $ 477
Ending assets ******************************************************* $ 2,821 $ 1,501 $ 1,484
Total Investments:Investment income *************************************************** 7.7% $ 12,008 7.5% $10,079 7.7% $ 10,511Investment expenses and fees ***************************************** (0.2%) (240) (0.2%) (263) (0.2%) (283)
Net investment income *********************************************** 7.5% $ 11,768 7.3% $ 9,816 7.5% $ 10,228Net investment (losses) gains ****************************************** (1,104) (137) 2,098Adjustments to investment (losses) gains(5) ****************************** 54 67 (608)Gains from sales of subsidiaries **************************************** 660 — 531
$ 11,378 $ 9,746 $ 12,249
(1) Yields are based on quarterly average asset carrying values for 2000, 1999 and 1998, excluding recognized and unrealized gains and losses, and foryield calculation purposes, average assets exclude collateral associated with the Company’s securities lending program. Fixed maturity investmentincome has been reduced by rebates paid under the program.
(2) Included in fixed maturities are equity-linked notes of $1,232 million, $1,079 million and $916 million at December 31, 2000, 1999 and 1998,respectively, which include an equity component as part of the notes’ return. Investment income for fixed maturities includes prepayment fees andincome from the securities lending program.
(3) Investment income from mortgage loans includes prepayment fees.(4) Equity real estate and real estate joint venture income is shown net of depreciation of $224 million, $247 million and $282 million for the years ended
December 31, 2000, 1999 and 1998, respectively.(5) Adjustments to investment gains and losses include amortization of deferred policy acquisition costs, charges and credits to participating contracts,
and adjustments to the policyholder dividend obligation resulting from investment gains and losses.
MetLife, Inc.18

Fixed MaturitiesFixed maturities consist principally of publicly traded and privately placed debt securities, and represented 70.7% and 69.9% of total cash and
invested assets at December 31, 2000 and 1999, respectively.Based on estimated fair value, public fixed maturities and private fixed maturities comprised 83.6% and 16.4%, respectively, of total fixed maturities
at December 31, 2000 and 82.6% and 17.4%, respectively, at December 31, 1999. The Company invests in privately placed fixed maturities to enhancethe overall value of its portfolio, increase diversification and obtain higher yields than can ordinarily be obtained with comparable public market securities.Generally, private placements provide the Company with protective covenants, call protection features and, where applicable, a higher level of collateral.However, the Company may not freely trade its private placements because of restrictions imposed by federal and state securities laws and illiquidtrading markets.
The Securities Valuation Office of the NAIC evaluates the bond investments of insurers for regulatory reporting purposes and assigns securities toone of six investment categories called ‘‘NAIC designations.’’ The NAIC designations parallel the credit ratings of the Nationally Recognized StatisticalRating Organizations for marketable bonds. NAIC designations 1 and 2 include bonds considered investment grade (rated ‘‘Baa3’’ or higher by Moody’s,or rated ‘‘BBB–’’ or higher by S&P) by such rating organizations. NAIC designations 3 through 6 include bonds considered below investment grade (rated‘‘Ba1’’ or lower by Moody’s, or rated ‘‘BB+’’ or lower by S&P).
The following table presents the Company’s total fixed maturities by NAIC designation and the equivalent ratings of the Nationally RecognizedStatistical Rating Organizations at December 31, 2000 and December 31, 1999, as well as the percentage, based on estimated fair value, that eachdesignation comprises:
At December 31, 2000 At December 31, 1999
Estimated EstimatedNAIC Rating Agency Amortized Fair % of Amortized Fair % of
Rating Equivalent Designation Cost Value Total Cost Value Total
(Dollars in millions)
1 AAa/Aa/A **************************************** $ 72,170 $ 74,389 65.9% $62,855 $62,207 64.2%2 Baa ********************************************* 28,470 28,405 25.1 26,883 25,951 26.83 Ba ********************************************** 5,935 5,650 5.0 5,808 5,636 5.84 B *********************************************** 3,964 3,758 3.3 3,017 2,969 3.15 Caa and lower ************************************ 123 95 0.1 168 141 0.16 In or near default ********************************** 319 361 0.3 68 67 0.0
Subtotal**************************************** 110,981 112,658 99.7 98,799 96,971 100.0Redeemable preferred stock ************************* 321 321 0.3 10 10 0.0
Total fixed maturities******************************** $111,302 $112,979 100.0% $98,809 $96,981 100.0%
Based on estimated fair values, total investment grade public and private placement fixed maturities comprised 91.0% of total fixed maturities in thegeneral account at both December 31, 2000 and 1999.
The following table shows the amortized cost and estimated fair value of fixed maturities, by contractual maturity dates (excluding scheduled sinkingfunds) at December 31, 2000 and 1999:
At December 31,
2000 1999
Amortized Estimated Amortized EstimatedCost Fair Value Cost Fair Value
(Dollars in millions)
Due in one year or less **************************************************** $ 3,465 $ 3,460 $ 3,180 $ 3,217Due after one year through five years ***************************************** 21,041 21,275 18,152 18,061Due after five years through ten years***************************************** 23,872 23,948 23,755 23,114Due after ten years ******************************************************** 29,564 30,402 26,316 25,918
Subtotal ************************************************************* 77,942 79,085 71,403 70,310Mortgage-backed and other asset-backed securities **************************** 33,039 33,573 27,396 26,661
Subtotal ************************************************************* 110,981 112,658 98,799 96,971Redeemable preferred stock ************************************************ 321 321 10 10
Total fixed maturities ******************************************************* $111,302 $112,979 $98,809 $96,981
Problem, potential problem and restructured fixed maturities. The Company monitors fixed maturities to identify investments thatmanagement considers to be problems or potential problems. The Company also monitors investments that have been restructured.
The Company defines problem securities in the fixed maturities category as securities as to which principal or interest payments are in default or areto be restructured pursuant to commenced negotiations, or as securities issued by a debtor that has entered into bankruptcy.
The Company defines potential problem securities in the fixed maturity category as securities of an issuer deemed to be experiencing significantoperating problems or difficult industry conditions. The Company uses various criteria, including the following, to identify potential problem securities:
) debt service coverage or cash flow falling below certain thresholds which vary according to the issuer’s industry and other relevant factors;) significant declines in revenues or margins;) violation of financial covenants;) public securities trading at a substantial discount as a result of specific credit concerns; and) other subjective factors.The Company defines restructured securities in the fixed maturities category as securities to which the Company has granted a concession that it
would not have otherwise considered but for the financial difficulties of the obligor. The Company enters into a restructuring when it believes it will realize agreater economic value under the new terms rather than through liquidation or disposition. The terms of the restructuring may involve some or all of the
MetLife, Inc.19
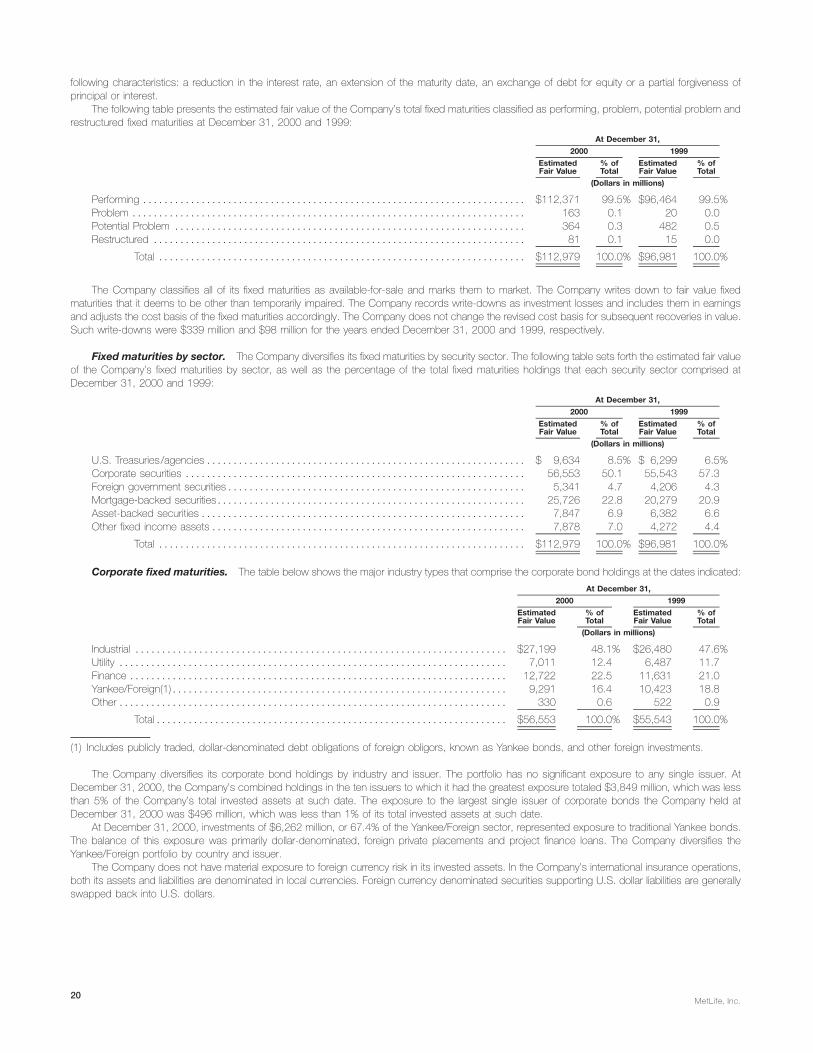
following characteristics: a reduction in the interest rate, an extension of the maturity date, an exchange of debt for equity or a partial forgiveness ofprincipal or interest.
The following table presents the estimated fair value of the Company’s total fixed maturities classified as performing, problem, potential problem andrestructured fixed maturities at December 31, 2000 and 1999:
At December 31,
2000 1999
Estimated % of Estimated % ofFair Value Total Fair Value Total
(Dollars in millions)
Performing ************************************************************************ $112,371 99.5% $96,464 99.5%Problem ************************************************************************** 163 0.1 20 0.0Potential Problem ****************************************************************** 364 0.3 482 0.5Restructured ********************************************************************** 81 0.1 15 0.0
Total ********************************************************************* $112,979 100.0% $96,981 100.0%
The Company classifies all of its fixed maturities as available-for-sale and marks them to market. The Company writes down to fair value fixedmaturities that it deems to be other than temporarily impaired. The Company records write-downs as investment losses and includes them in earningsand adjusts the cost basis of the fixed maturities accordingly. The Company does not change the revised cost basis for subsequent recoveries in value.Such write-downs were $339 million and $98 million for the years ended December 31, 2000 and 1999, respectively.
Fixed maturities by sector. The Company diversifies its fixed maturities by security sector. The following table sets forth the estimated fair valueof the Company’s fixed maturities by sector, as well as the percentage of the total fixed maturities holdings that each security sector comprised atDecember 31, 2000 and 1999:
At December 31,
2000 1999
Estimated % of Estimated % ofFair Value Total Fair Value Total
(Dollars in millions)
U.S. Treasuries/agencies ************************************************************ $ 9,634 8.5% $ 6,299 6.5%Corporate securities **************************************************************** 56,553 50.1 55,543 57.3Foreign government securities******************************************************** 5,341 4.7 4,206 4.3Mortgage-backed securities********************************************************** 25,726 22.8 20,279 20.9Asset-backed securities ************************************************************* 7,847 6.9 6,382 6.6Other fixed income assets *********************************************************** 7,878 7.0 4,272 4.4
Total ********************************************************************* $112,979 100.0% $96,981 100.0%
Corporate fixed maturities. The table below shows the major industry types that comprise the corporate bond holdings at the dates indicated:
At December 31,
2000 1999
Estimated % of Estimated % ofFair Value Total Fair Value Total
(Dollars in millions)
Industrial ********************************************************************** $27,199 48.1% $26,480 47.6%Utility ************************************************************************* 7,011 12.4 6,487 11.7Finance *********************************************************************** 12,722 22.5 11,631 21.0Yankee/Foreign(1)*************************************************************** 9,291 16.4 10,423 18.8Other ************************************************************************* 330 0.6 522 0.9
Total****************************************************************** $56,553 100.0% $55,543 100.0%
(1) Includes publicly traded, dollar-denominated debt obligations of foreign obligors, known as Yankee bonds, and other foreign investments.
The Company diversifies its corporate bond holdings by industry and issuer. The portfolio has no significant exposure to any single issuer. AtDecember 31, 2000, the Company’s combined holdings in the ten issuers to which it had the greatest exposure totaled $3,849 million, which was lessthan 5% of the Company’s total invested assets at such date. The exposure to the largest single issuer of corporate bonds the Company held atDecember 31, 2000 was $496 million, which was less than 1% of its total invested assets at such date.
At December 31, 2000, investments of $6,262 million, or 67.4% of the Yankee/Foreign sector, represented exposure to traditional Yankee bonds.The balance of this exposure was primarily dollar-denominated, foreign private placements and project finance loans. The Company diversifies theYankee/Foreign portfolio by country and issuer.
The Company does not have material exposure to foreign currency risk in its invested assets. In the Company’s international insurance operations,both its assets and liabilities are denominated in local currencies. Foreign currency denominated securities supporting U.S. dollar liabilities are generallyswapped back into U.S. dollars.
MetLife, Inc.20

Mortgage-backed securities. The following table shows the types of mortgage-backed securities the Company held at December 31, 2000and 1999:
At December 31,
2000 1999
Estimated % of Estimated % ofFair Value Total Fair Value Total
(Dollars in millions)
Pass-through securities *********************************************************** $10,610 41.3% $ 8,478 41.8%Collateralized mortgage obligations ************************************************** 9,866 38.3 7,694 37.9Commercial mortgage-backed securities ********************************************* 5,250 20.4 4,107 20.3
Total ******************************************************************* $25,726 100.0% $20,279 100.0%
At December 31, 2000, pass-through and collateralized mortgage obligations totaled $20,476 million, or 79.6% of total mortgage-backedsecurities, and a majority of this amount represented agency-issued pass-through and collateralized mortgage obligations guaranteed or otherwisesupported by the Federal National Mortgage Association, Federal Home Loan Mortgage Corporation or Government National Mortgage Association.Other types of mortgage-backed securities comprised the balance of such amounts reflected in the table. At December 31, 2000, approximately $3,202million, or 61.0% of the commercial mortgage-backed securities, and $17,303 million, or 84.5% of the pass-through securities and collateralizedmortgage obligations, were rated Aaa/AAA by Moody’s or S&P.
The principal risks inherent in holding mortgage-backed securities are prepayment and extension risks, which will affect the timing of when cash flowwill be received. The Company’s active monitoring of its mortgage-backed securities mitigates exposure to losses from cash flow risk associated withinterest rate fluctuations.
Asset-backed securities. Asset-backed securities, which include credit card and automobile receivables and home equity loans, are pur-chased both to diversify the overall risks of the Company’s fixed maturities assets and to provide attractive returns. The Company’s asset-backedsecurities are diversified both by type of asset and by issuer. Home equity loans constitute the largest exposure in the Company’s asset-backedsecurities investments. Except for asset-backed securities backed by home equity loans, the asset-backed securities investments generally have littlesensitivity to changes in interest rates. At December 31, 2000, approximately $3,149 million, or 40.1%, of total asset-backed securities were ratedAaa/AAA by Moody’s or S&P.
The principal risks in holding asset-backed securities are structural, credit and capital market risks. Structural risks include the security’s priority in theissuer’s capital structure, the adequacy of and ability to realize proceeds from the collateral and the potential for prepayments. Credit risks includeconsumer or corporate credits such as credit card holders, equipment lessees, and corporate obligors. Capital market risks include the general level ofinterest rates and the liquidity for these securities in the marketplace.
Mortgage LoansThe Company’s mortgage loans are collateralized by commercial, agricultural and residential properties. Mortgage loans comprised 13.7% and
14.3% of the Company’s total cash and invested assets at December 31, 2000 and 1999, respectively. The carrying value of mortgage loans is stated atoriginal cost net of repayments, amortization of premiums, accretion of discounts and valuation allowances. The following table shows the carrying valueof the Company’s mortgage loans by type at December 31, 2000 and 1999:
At December 31,
2000 1999
Carrying % of Carrying % ofValue Total Value Total
(Dollars in millions)
Commercial ********************************************************************* $16,869 76.8% $14,862 75.3%Agricultural ********************************************************************** 4,973 22.7 4,798 24.3Residential ********************************************************************** 109 0.5 79 0.4
Total ******************************************************************* $21,951 100.0% $19,739 100.0%
MetLife, Inc.21
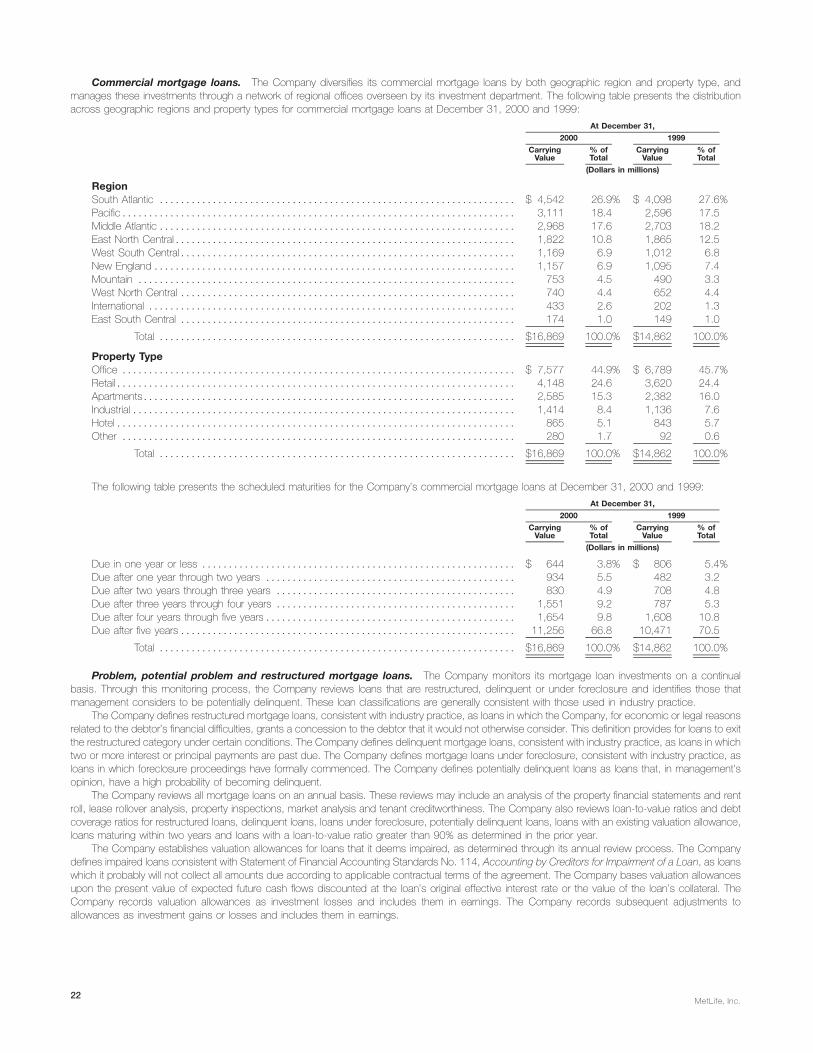
Commercial mortgage loans. The Company diversifies its commercial mortgage loans by both geographic region and property type, andmanages these investments through a network of regional offices overseen by its investment department. The following table presents the distributionacross geographic regions and property types for commercial mortgage loans at December 31, 2000 and 1999:
At December 31,
2000 1999
Carrying % of Carrying % ofValue Total Value Total
(Dollars in millions)
RegionSouth Atlantic ******************************************************************* $ 4,542 26.9% $ 4,098 27.6%Pacific************************************************************************** 3,111 18.4 2,596 17.5Middle Atlantic ******************************************************************* 2,968 17.6 2,703 18.2East North Central**************************************************************** 1,822 10.8 1,865 12.5West South Central*************************************************************** 1,169 6.9 1,012 6.8New England ******************************************************************** 1,157 6.9 1,095 7.4Mountain *********************************************************************** 753 4.5 490 3.3West North Central *************************************************************** 740 4.4 652 4.4International ********************************************************************* 433 2.6 202 1.3East South Central *************************************************************** 174 1.0 149 1.0
Total ******************************************************************* $16,869 100.0% $14,862 100.0%
Property TypeOffice ************************************************************************** $ 7,577 44.9% $ 6,789 45.7%Retail*************************************************************************** 4,148 24.6 3,620 24.4Apartments********************************************************************** 2,585 15.3 2,382 16.0Industrial ************************************************************************ 1,414 8.4 1,136 7.6Hotel*************************************************************************** 865 5.1 843 5.7Other ************************************************************************** 280 1.7 92 0.6
Total ******************************************************************* $16,869 100.0% $14,862 100.0%
The following table presents the scheduled maturities for the Company’s commercial mortgage loans at December 31, 2000 and 1999:
At December 31,
2000 1999
Carrying % of Carrying % ofValue Total Value Total
(Dollars in millions)
Due in one year or less *********************************************************** $ 644 3.8% $ 806 5.4%Due after one year through two years *********************************************** 934 5.5 482 3.2Due after two years through three years ********************************************* 830 4.9 708 4.8Due after three years through four years ********************************************* 1,551 9.2 787 5.3Due after four years through five years*********************************************** 1,654 9.8 1,608 10.8Due after five years *************************************************************** 11,256 66.8 10,471 70.5
Total ******************************************************************* $16,869 100.0% $14,862 100.0%
Problem, potential problem and restructured mortgage loans. The Company monitors its mortgage loan investments on a continualbasis. Through this monitoring process, the Company reviews loans that are restructured, delinquent or under foreclosure and identifies those thatmanagement considers to be potentially delinquent. These loan classifications are generally consistent with those used in industry practice.
The Company defines restructured mortgage loans, consistent with industry practice, as loans in which the Company, for economic or legal reasonsrelated to the debtor’s financial difficulties, grants a concession to the debtor that it would not otherwise consider. This definition provides for loans to exitthe restructured category under certain conditions. The Company defines delinquent mortgage loans, consistent with industry practice, as loans in whichtwo or more interest or principal payments are past due. The Company defines mortgage loans under foreclosure, consistent with industry practice, asloans in which foreclosure proceedings have formally commenced. The Company defines potentially delinquent loans as loans that, in management’sopinion, have a high probability of becoming delinquent.
The Company reviews all mortgage loans on an annual basis. These reviews may include an analysis of the property financial statements and rentroll, lease rollover analysis, property inspections, market analysis and tenant creditworthiness. The Company also reviews loan-to-value ratios and debtcoverage ratios for restructured loans, delinquent loans, loans under foreclosure, potentially delinquent loans, loans with an existing valuation allowance,loans maturing within two years and loans with a loan-to-value ratio greater than 90% as determined in the prior year.
The Company establishes valuation allowances for loans that it deems impaired, as determined through its annual review process. The Companydefines impaired loans consistent with Statement of Financial Accounting Standards No. 114, Accounting by Creditors for Impairment of a Loan, as loanswhich it probably will not collect all amounts due according to applicable contractual terms of the agreement. The Company bases valuation allowancesupon the present value of expected future cash flows discounted at the loan’s original effective interest rate or the value of the loan’s collateral. TheCompany records valuation allowances as investment losses and includes them in earnings. The Company records subsequent adjustments toallowances as investment gains or losses and includes them in earnings.
MetLife, Inc.22

The following table presents the amortized cost and valuation allowances for commercial mortgage loans distributed by loan classification atDecember 31, 2000 and 1999:
At December 31, 2000 At December 31, 1999
% of % ofAmortized % of Valuation Amortized Amortized % of Valuation Amortized
Cost(1) Total Allowance Cost Cost(1) Total Allowance Cost
(Dollars in millions)
Performing ******************************************** $16,169 95.5% $15 0.1% $14,098 94.5% $11 0.1%Restructured******************************************* 646 3.8 47 7.3% 810 5.4 52 6.4%Delinquent or under foreclosure*************************** 24 0.1 4 16.7% 17 0.1 4 25.0%Potentially delinquent************************************ 106 0.6 10 9.4% 6 0.0 2 33.3%
Total ***************************************** $16,945 100.0% $76 0.4% $14,931 100.0% $69 0.5%
(1) Amortized cost is equal to carrying value before valuation allowances.
The following table presents the changes in valuation allowances for commercial mortgage loans for the years ended December 31, 2000, 1999and 1998:
Year ended December 31,
2000 1999 1998
(Dollars in millions)
Balance, beginning of year ********************************************************************** $ 69 $ 142 $ 259Additions ************************************************************************************* 61 36 30Deductions for writedowns and dispositions ******************************************************** (54) (109) (147)
Balance, end of year *************************************************************************** $ 76 $ 69 $ 142
The principal risks in holding commercial mortgage loans are property specific, supply and demand, financial and capital market risks. Propertyspecific risks include the geographic location of the property, the physical condition of the property, the diversity of tenants and the rollover of their leasesand the ability of the property manager to attract tenants and manage expenses. Supply and demand risks include changes in the supply and/or demandfor rental space which cause changes in vacancy rates and/or rental rates. Financial risks include the overall level of debt on the property and the amountof principal repaid during the loan term. Capital market risks include the general level of interest rates, the liquidity for these securities in the marketplaceand the capital available loan for refinancing.
Agricultural mortgage loans. The Company diversifies its agricultural mortgage loans by both geographic region and product type. TheCompany manages these investments through a network of regional offices and field professionals overseen by its investment department.
Approximately 59.9% of the $4,973 million of agricultural mortgage loans outstanding at December 31, 2000 was subject to rate resets prior tomaturity. A substantial portion of these loans were successfully renegotiated and remain outstanding to maturity. The process and policies for monitoringthe agricultural mortgage loans and classifying them by performance status are generally the same as those for the commercial loans.
The following table presents the amortized cost and valuation allowances for agricultural mortgage loans distributed by loan classification atDecember 31, 2000 and 1999:
At December 31, 2000 At December 31, 1999
% of % ofAmortized % of Valuation Amortized Amortized % of Valuation Amortized
Cost(1) Total Allowance Cost Cost(1) Total Allowance Cost
(Dollars in millions)
Performing ************************************************** $4,771 95.7% $1 0.0% $4.616 95.8% $ 1 0.0%Restructured************************************************* 172 3.5 2 1.2% 165 3.4 11 6.7%Delinquent or under foreclosure********************************* 24 0.5 4 16.7% 27 0.6 2 7.4%Potentially delinquent******************************************* 13 0.3 0 2.3% 8 0.2 4 50.0%
Total *********************************************** $4,980 100.0% $7 0.1% $4,816 100.0% $18 0.4%
(1) Amortized cost is equal to carrying value before valuation allowances.
The following table presents the changes in valuation allowances for agricultural mortgage loans for the years ended December 31, 2000, 1999 and1998:
Year ended December 31,
2000 1999 1998
(Dollars in millions)
Balance, beginning of year************************************************************************** $ 18 $ 28 $ 27Additions **************************************************************************************** 8 4 10Deductions for writedowns and dispositions *********************************************************** (19) (14) (9)
Balance, end of year ****************************************************************************** $ 7 $ 18 $ 28
The principal risks in holding agricultural mortgage loans are property specific, supply and demand, financial and capital market risks. Propertyspecific risks include the geographic location of the property, soil types, weather conditions and the other factors that may impact the borrower’s
MetLife, Inc.23

guaranty. Supply and demand risks include the supply and demand for the commodities produced on the specific property and the related price forthose commodities. Financial risks include the overall level of debt on the property and the amount of principal repaid during the loan term. Capital marketrisks include the general level of interest rates, the liquidity for these securities in the marketplace and the capital available for loan refinancing.
Equity Real Estate and Real Estate Joint VenturesThe Company’s equity real estate and real estate joint venture investments consist of commercial and agricultural properties located throughout the
U.S. and Canada. The Company manages these investments through a network of regional offices overseen by its investment department. AtDecember 31, 2000 and 1999, the carrying value of the Company’s equity real estate and real estate joint ventures was $5,504 million and $5,649million, respectively, or 3.4% and 4.1%, respectively, of total cash and invested assets. The carrying value of equity real estate was stated at depreciatedcost net of impairments and valuation allowances. The carrying value of real estate joint ventures was stated at the Company’s equity in the real estatejoint ventures net of impairments and valuation allowances. These holdings consist of equity real estate, interests in real estate joint ventures and realestate acquired upon foreclosure of commercial and agricultural mortgage loans. The following table presents the carrying value of the Company’s equityreal estate and real estate joint ventures at December 31, 2000 and 1999:
At December 31,
2000 1999
Carrying % of Carrying % ofValue Total Value Total
(Dollars in millions)
TypeEquity real estate ******************************************************************* $5,069 92.1% $5,271 93.3%Real estate joint ventures ************************************************************ 369 6.7 331 5.9
Subtotal ****************************************************************** 5,438 98.8 5,602 99.2Foreclosed real estate*************************************************************** 66 1.2 47 0.8
Total ********************************************************************* $5,504 100.0% $5,649 100.0%
Office properties representing 66.1% and 68.1% of the Company’s equity real estate and real estate joint venture holdings at December 31, 2000and 1999, respectively, are well diversified geographically, principally within the United States. The average occupancy level of office properties was 94%and 92% at December 31, 2000 and 1999, respectively.
The Company classifies equity real estate and real estate joint ventures as held-for-investment or held-for-sale. The carrying value of equity real estate andreal estate joint ventures held-for-investment was $5,223 million and $5,151 million at December 31, 2000 and 1999, respectively. The carrying value of equityreal estate and real estate joint ventures held-for-sale was $281 million and $498 million at December 31, 2000 and 1999, respectively.
Ongoing management of these investments includes quarterly appraisals as well as an annual market update and review of each property’s budget,financial returns, lease rollover status and the Company’s exit strategy. In addition to individual property reviews, the Company employs an overall strategyof selective dispositions and acquisitions as market opportunities arise.
The Company adjusts the carrying value of equity real estate and real estate joint ventures held for investment for impairments whenever events orchanges in circumstances indicate that the carrying value of the property may not be recoverable. The Company writes down impaired real estate toestimated fair value, which it generally computes using the present value of future cash flows from the property, discounted at a rate commensurate withthe underlying risks. The Company records write-downs as investment losses through earnings and reduces the cost basis of the properties accordingly.The Company does not change the new cost basis for subsequent recoveries in value.
The Company records real estate acquired upon foreclosure of commercial and agricultural mortgage loans at the lower of estimated fair value or thecarrying value of the mortgage loan at the date of foreclosure.
Once the Company identifies a property to be sold and commences a firm plan for marketing the property, the Company establishes andperiodically revises, if necessary, a valuation allowance to adjust the carrying value of the property to its expected sales value, less associated sellingcosts, if it is lower than the property’s carrying value. The Company records allowances as investment losses and includes them in earnings. TheCompany records subsequent adjustments to allowances as investment gains or losses and includes them in earnings.
The Company’s carrying value of equity real estate and real estate joint ventures held-for-sale, including real estate acquired upon foreclosure ofcommercial and agricultural mortgage loans, in the amounts of $281 million and $498 million at December 31, 2000 and 1999, respectively, are net ofimpairments of $97 million and $187 million and net of valuation allowances of $39 million and $34 million, respectively.
Equity Securities and Other Limited Partnership InterestsThe Company’s carrying value of equity securities, which primarily consists of investments in common stocks, was $2,193 million and $2,006 million
at December 31, 2000 and 1999, respectively. Substantially all of the common stock is publicly traded on major securities exchanges. The carrying valueof the other limited partnership interests which primarily represent ownership interests in pooled investment funds that make private equity investments incompanies in the U.S. and overseas was $1,652 million and $1,331 million at December 31, 2000 and 1999, respectively. The Company classifies itsinvestments in common stocks as available-for-sale and marks them to market except for non-marketable private equities which are generally carried atcost. The Company accounts for its investments in limited partnership interests in which it does not have a controlling interest in accordance with theequity method of accounting. The Company’s investments in equity securities represented 1.4% and 1.5% of cash and invested assets at December 31,2000 and 1999, respectively.
Equity securities include, at December 31, 2000 and 1999, $577 million and $237 million, respectively, of private equity securities. The Companymay not freely trade its private equity securities because of restrictions imposed by federal and state securities laws and illiquid trading markets.
At December 31, 2000 and 1999, approximately $313 million and $380 million, respectively, of the Company’s equity securities holdings wereeffectively fixed at a minimum value of $257 million and $355 million in these respective periods, primarily through the use of exchangeable securities andother derivatives. The exchangeable debt securities issued by the Company mature through 2002 and the Company may repurchase them earlier at itsdiscretion. In 2000, one exchangeable debt security was repurchased resulting in a gross investment loss of $9 million on the note and a grossinvestment gain of $77 million on the equity exchanged in satisfaction of the note.
The Company makes commitments to fund partnership investments in the normal course of business. The amounts of these unfunded commit-ments were $1,311 million and $1,131 million at December 31, 2000 and 1999, respectively. The Company anticipates that these amounts will beinvested in the partnerships over the next three to five years.
MetLife, Inc.24

Problem and Potential Problem Equity Securities and Other Limited Partnership InterestsThe Company monitors its equity securities and other limited partnership interests on a continual basis. Through this monitoring process, the
Company identifies investments that management considers to be problems or potential problems.Problem equity securities and other limited partnership interests are defined as securities (1) in which significant declines in revenues and/or margins
threaten the ability of the issuer to continue operating or (2) where the issuer has subsequently entered bankruptcy.Potential problem equity securities and other limited partnership interests are defined as securities issued by a company that is experiencing
significant operating problems or difficult industry conditions. Criteria generally indicative of these problems or conditions are (1) cash flows falling belowvarying thresholds established for the industry and other relevant factors, (2) significant declines in revenues and/or margins, (3) public securities tradingat a substantial discount as a result of specific credit concerns, and (4) other information that becomes available.
Equity securities or other limited partnership interests which are deemed to be other than temporarily impaired are written down to fair value. Write-downs are recorded as investment losses and are included in earnings and the cost basis of the equity securities and other limited partnership interestsare adjusted accordingly. The new cost basis is not changed for subsequent recoveries in value. For the years ended December 31, 2000 and 1999,such write-downs were $18 million and $30 million, respectively.
Other Invested AssetsThe Company’s other invested assets consisted principally of leveraged leases, which were recorded net of non-recourse debt. The Company
participates in lease transactions which are diversified by geographic area. The Company regularly reviews residual values and writes down residuals toexpected values as needed. The Company’s other invested assets represented 1.8% and 1.1% of cash and invested assets at December 31, 2000 and1999, respectively.
Derivative Financial InstrumentsThe Company uses derivative instruments to reduce the risk associated with changing market values or variable cash flows related to the
Company’s financial assets and liabilities. This objective is achieved through one of two principal risk management strategies: hedging the changes in fairvalue of financial assets, liabilities or firm commitments or hedging the variable cash flows of assets, liabilities or forecasted transactions. Hedgedforecasted transactions, other than the receipt or payment of variable interest payments, are not expected to occur more than 12 months after hedgeinception. The Company’s derivative strategy employs a variety of instruments including financial futures, financial forwards, interest rate and foreigncurrency swaps, floors, foreign exchange contracts, caps and options.
Effective January 4, 2001, the Company is authorized, under a newly enacted provision of the New York Insurance Law, to use derivatives forreplication. This provision allows the Company to create and invest in synthetic investments by combining a derivative with an existing security to createthe characteristics of a different desired security. The Company expects to take advantage of this new law by transacting in derivatives to replicatesecurities in order to manage risks or to increase risk adjusted returns. Many of these transactions are not expected to receive hedge accounting underthe requirements of Statement of Financial Accounting Standards No. 133, Accounting for Derivative Instruments and Hedging Activities. As of the date ofthis filing, the Company has not entered into any replication transactions.
The Company held the following positions in derivative financial instruments at December 31, 2000 and 1999:
At December 31,
2000 1999
Current Market Current Marketor Fair Value or Fair ValueCarrying Notional Carrying Notional
Value Amount Assets Liabilities Value Amount Assets Liabilities
(Dollars in millions)
Financial futures *********************************************** $23 $ 254 $ 23 $— $ 27 $ 3,140 $37 $ 10Interest rate swaps********************************************* 41 1,549 49 1 (32) 1,316 11 40Floors******************************************************** — 325 3 — — — — —Caps ******************************************************** — 9,950 — — 1 12,376 3 —Foreign currency swaps **************************************** (1) 1,469 267 85 — 4,002 26 103Exchange traded options**************************************** 1 10 — 1 — — — —
Total contractual commitments *********************************** $64 $13,557 $342 $87 $ (4) $20,834 $77 $153
Securities LendingPursuant to the Company’s securities lending program, it lends securities to major brokerage firms. The Company’s policy requires a minimum of
102% of the fair value of the loaned securities as collateral, calculated on a daily basis. The Company’s securities on loan at December 31, 2000 and1999 had estimated fair values of $12,289 million and $6,391 million, respectively.
Separate Account AssetsThe Company manages each separate account’s assets in accordance with the prescribed investment policy that applies to that specific separate
account. The Company establishes separate accounts on a single client and multi-client comingled basis in conformity with insurance laws. Generally,separate accounts are not chargeable with liabilities that arise from any other business of the Company. Separate account assets are subject to claims ofthe Company’s general account claims only to the extent that the value of such assets exceeds the separate account liabilities, as defined by theaccount’s contract. If the Company uses a separate account to support a contract providing guaranteed benefits, the Company must comply with theasset maintenance requirements stipulated under Regulation 128 of the New York Insurance Department. The Company monitors these requirements atleast monthly and, in addition, performs cash flow analyses, similar to that conducted for the general account, on an annual basis. The Company reportsseparately as assets and liabilities investments held in separate accounts and liabilities of the separate accounts. The Company reports substantially allseparate account assets at their fair market value. Investment income and gains or losses on the investments of separate accounts accrue directly tocontract holders, and, accordingly, the Company does not reflect them in its consolidated statements of income and cash flows. The Company reflectsin its revenues fees charged to the separate accounts by the Company, including mortality charges, risk charges, policy administration fees, investmentmanagement fees and surrender charges.
MetLife, Inc.25

Quantitative and Qualitative Disclosures About Market Risk.The Company must effectively manage, measure and monitor the market risk associated with its invested assets and interest rate sensitive
insurance contracts. It has developed an integrated process for managing risk, which it conducts through its Corporate Risk Management Department,several asset/liability committees and additional specialists at the business segment level. The Company has established and implemented comprehen-sive policies and procedures at both the corporate and business segment level to minimize the effects of potential market volatility.
Market Risk ExposuresThe Company has exposure to market risk through its insurance operations and investment activities. For purposes of this disclosure, ‘‘market risk’’
is defined as the risk of loss resulting from changes in interest rates, equity prices and foreign exchange rates.Interest rates. The Company’s exposure to interest rate changes results from its significant holdings of fixed maturities, as well as its interest rate
sensitive liabilities. The fixed maturities include U.S. and foreign government bonds, securities issued by government agencies, corporate bonds andmortgage-backed securities, all of which are mainly exposed to changes in medium- and long-term treasury rates. The interest rate sensitive liabilities forpurposes of this disclosure include guaranteed interest contracts and fixed annuities, which have the same interest rate exposure (medium- and long-term treasury rates) as the fixed maturities. The Company employs product design, pricing and asset/liability management strategies to reduce theadverse effects of interest rate volatility. Product design and pricing strategies include the use of surrender charges or restrictions on withdrawals in someproducts. Asset/liability management strategies include the use of derivatives, the purchase of securities structured to protect against prepayments,prepayment restrictions and related fees on mortgage loans and consistent monitoring of the pricing of the Company’s products in order to better matchthe duration of the assets and the liabilities they support.
Equity prices. The Company’s investments in equity securities expose it to changes in equity prices. It manages this risk on an integrated basiswith other risks through its asset/liability management strategies. The Company also manages equity price risk through industry and issuer diversificationand asset allocation techniques.
Foreign exchange rates. The Company’s exposure to fluctuations in foreign exchange rates against the U.S. dollar results from its holdings in non-U.S. dollar denominated fixed maturity securities and equity securities and through its investments in foreign subsidiaries. The principal currencies whichcreate foreign exchange rate risk in the Company’s investment portfolios are Canadian dollars, Euros, German marks, French francs, Spanish pesetas,Mexican pesos and British pounds. The Company mitigates the majority of its fixed maturities’ foreign exchange rate risk through the utilization of foreigncurrency swaps and forward contracts. Through its investments in foreign subsidiaries, the Company is primarily exposed to the Spanish peseta,Mexican peso and South Korean won. The Company has denominated substantially all assets and liabilities of its foreign subsidiaries in their respectivelocal currencies, thereby minimizing its risk to foreign exchange rate fluctuations.
Risk ManagementCorporate risk management. MetLife has established several financial and non-financial senior management committees as part of its risk
management process. These committees manage capital and risk positions, approve asset/liability management strategies and establish appropriatecorporate business standards.
MetLife also has a separate Corporate Risk Management Department, which is responsible for risk throughout MetLife and reports directly toMetropolitan Life’s Chief Actuary. The Corporate Risk Management Department’s primary responsibilities consist of:
) implementing a board of directors-approved corporate risk framework, which outlines the Company’s approach for managing risk on anenterprise-wide basis;
) developing policies and procedures for managing, measuring and monitoring those risks identified in the corporate risk framework;) establishing appropriate corporate risk tolerance levels;) deploying capital on a risk-adjusted basis; and) reporting on a periodic basis to the Audit Committee of the Holding Company’s board of directors and various financial and non-financial senior
management committees.Asset/liability management. At MetLife, asset/liability management is the responsibility of the General Account Portfolio Management Department
(‘‘GAPM’’), the operating business segments and various GAPM boards. The GAPM boards are comprised of senior officers from the investmentdepartment, senior managers from each business segment and the Chief Actuary. The GAPM boards’ duties include setting broad asset/liabilitymanagement policy and strategy, reviewing and approving target portfolios, establishing investment guidelines and limits, and providing oversight of theportfolio management process.
The portfolio managers and asset sector specialists, who have responsibility on a day-to-day basis for risk management of their respective investingactivities, implement the goals and objectives established by the GAPM boards. The goals of the investment process are to optimize after-tax, risk-adjusted investment income and after-tax, risk-adjusted total return while ensuring that the assets and liabilities are managed on a cash flow and durationbasis. The risk management objectives established by the GAPM boards stress quality, diversification, asset/liability matching, liquidity and investmentreturn.
Each of MetLife’s business segments has an asset/liability officer who works with portfolio managers in the investment department to monitorinvestment, product pricing, hedge strategy and liability management issues. MetLife establishes target asset portfolios for each major insurance product,which represent the investment strategies used to profitably fund its liabilities within acceptable levels of risk. These strategies include objectives foreffective duration, yield curve sensitivity, convexity, liquidity, asset sector concentration and credit quality.
To manage interest rate risk, the Company performs periodic projections of asset and liability cash flows to evaluate the potential sensitivity of itssecurities investments and liabilities to interest rate movements. These projections involve evaluating the potential gain or loss on most of the Company’sin-force business under various increasing and decreasing interest rate environments. The Company has developed models of its in-force business thatreflect specific product characteristics and include assumptions based on current and anticipated experience regarding lapse, mortality and interestcrediting rates. In addition, these models include asset cash flow projections reflecting interest payments, sinking fund payments, principal payments,bond calls, mortgage prepayments and defaults. New York Insurance Department regulations require that MetLife perform some of these analysesannually as part of the annual proof of the sufficiency of its regulatory reserves to meet adverse interest rate scenarios.
Hedging activities. MetLife’s risk management strategies incorporate the use of various interest rate derivatives that are used to adjust the overallduration and cash flow profile of its invested asset portfolios to better match the duration and cash flow profile of its liabilities to reduce interest rate risk.Such instruments include interest rate swaps, futures and caps. MetLife also uses foreign currency swaps and forward contracts to hedge its foreigncurrency denominated fixed income investments.
MetLife, Inc.26
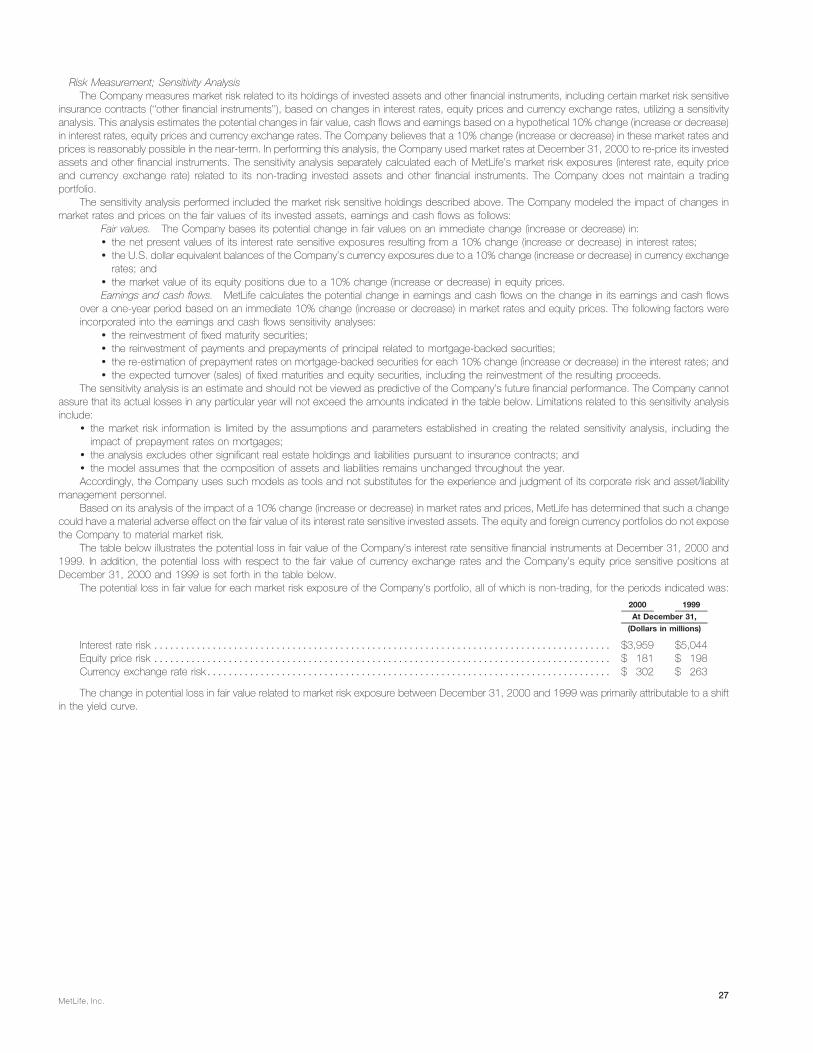
Risk Measurement; Sensitivity AnalysisThe Company measures market risk related to its holdings of invested assets and other financial instruments, including certain market risk sensitive
insurance contracts (‘‘other financial instruments’’), based on changes in interest rates, equity prices and currency exchange rates, utilizing a sensitivityanalysis. This analysis estimates the potential changes in fair value, cash flows and earnings based on a hypothetical 10% change (increase or decrease)in interest rates, equity prices and currency exchange rates. The Company believes that a 10% change (increase or decrease) in these market rates andprices is reasonably possible in the near-term. In performing this analysis, the Company used market rates at December 31, 2000 to re-price its investedassets and other financial instruments. The sensitivity analysis separately calculated each of MetLife’s market risk exposures (interest rate, equity priceand currency exchange rate) related to its non-trading invested assets and other financial instruments. The Company does not maintain a tradingportfolio.
The sensitivity analysis performed included the market risk sensitive holdings described above. The Company modeled the impact of changes inmarket rates and prices on the fair values of its invested assets, earnings and cash flows as follows:
Fair values. The Company bases its potential change in fair values on an immediate change (increase or decrease) in:) the net present values of its interest rate sensitive exposures resulting from a 10% change (increase or decrease) in interest rates;) the U.S. dollar equivalent balances of the Company’s currency exposures due to a 10% change (increase or decrease) in currency exchange
rates; and) the market value of its equity positions due to a 10% change (increase or decrease) in equity prices.Earnings and cash flows. MetLife calculates the potential change in earnings and cash flows on the change in its earnings and cash flows
over a one-year period based on an immediate 10% change (increase or decrease) in market rates and equity prices. The following factors wereincorporated into the earnings and cash flows sensitivity analyses:
) the reinvestment of fixed maturity securities;) the reinvestment of payments and prepayments of principal related to mortgage-backed securities;) the re-estimation of prepayment rates on mortgage-backed securities for each 10% change (increase or decrease) in the interest rates; and) the expected turnover (sales) of fixed maturities and equity securities, including the reinvestment of the resulting proceeds.
The sensitivity analysis is an estimate and should not be viewed as predictive of the Company’s future financial performance. The Company cannotassure that its actual losses in any particular year will not exceed the amounts indicated in the table below. Limitations related to this sensitivity analysisinclude:
) the market risk information is limited by the assumptions and parameters established in creating the related sensitivity analysis, including theimpact of prepayment rates on mortgages;
) the analysis excludes other significant real estate holdings and liabilities pursuant to insurance contracts; and) the model assumes that the composition of assets and liabilities remains unchanged throughout the year.Accordingly, the Company uses such models as tools and not substitutes for the experience and judgment of its corporate risk and asset/liability
management personnel.Based on its analysis of the impact of a 10% change (increase or decrease) in market rates and prices, MetLife has determined that such a change
could have a material adverse effect on the fair value of its interest rate sensitive invested assets. The equity and foreign currency portfolios do not exposethe Company to material market risk.
The table below illustrates the potential loss in fair value of the Company’s interest rate sensitive financial instruments at December 31, 2000 and1999. In addition, the potential loss with respect to the fair value of currency exchange rates and the Company’s equity price sensitive positions atDecember 31, 2000 and 1999 is set forth in the table below.
The potential loss in fair value for each market risk exposure of the Company’s portfolio, all of which is non-trading, for the periods indicated was:
2000 1999
At December 31,
(Dollars in millions)
Interest rate risk ************************************************************************************** $3,959 $5,044Equity price risk ************************************************************************************** $ 181 $ 198Currency exchange rate risk**************************************************************************** $ 302 $ 263
The change in potential loss in fair value related to market risk exposure between December 31, 2000 and 1999 was primarily attributable to a shiftin the yield curve.
MetLife, Inc.27

[This page intentionally left blank]
MetLife, Inc.28

INDEX TO CONSOLIDATED FINANCIAL STATEMENTSPage
Independent Auditors’ Report F-2Financial Statements as of December 31, 2000 and 1999 and for the years ended 2000, 1999 and 1998:
Consolidated Balance Sheets F-3Consolidated Statements of Income F-4Consolidated Statements of Stockholders’ Equity F-5Consolidated Statements of Cash Flows F-6Notes to Consolidated Financial Statements F-8
MetLife, Inc.F-1

Independent Auditors’ ReportThe Board of Directors and Shareholders of MetLife, Inc.:
We have audited the accompanying consolidated balance sheets of MetLife, Inc. and subsidiaries (the ‘‘Company’’) as of Decem-ber 31, 2000 and 1999, and the related consolidated statements of income, stockholders’ equity, and cash flows for each of the threeyears in the period ended December 31, 2000. These financial statements are the responsibility of the Company’s management. Ourresponsibility is to express an opinion on these financial statements based on our audits.
We conducted our audits in accordance with auditing standards generally accepted in the United States of America. Those standardsrequire that we plan and perform the audit to obtain reasonable assurance about whether the financial statements are free of materialmisstatement. An audit includes examining, on a test basis, evidence supporting the amounts and disclosures in the financial state-ments. An audit also includes assessing the accounting principles used and significant estimates made by management, as well asevaluating the overall financial statement presentation. We believe that our audits provide a reasonable basis for our opinion.
In our opinion, such consolidated financial statements present fairly, in all material respects, the consolidated financial position ofMetLife, Inc. and subsidiaries as of December 31, 2000 and 1999, and the consolidated results of their operations and their consoli-dated cash flows for each of the three years in the period ended December 31, 2000, in conformity with accounting principles generallyaccepted in the United States of America.
DELOITTE & TOUCHE LLP
New York, New YorkFebruary 9, 2001
MetLife, Inc.F-2
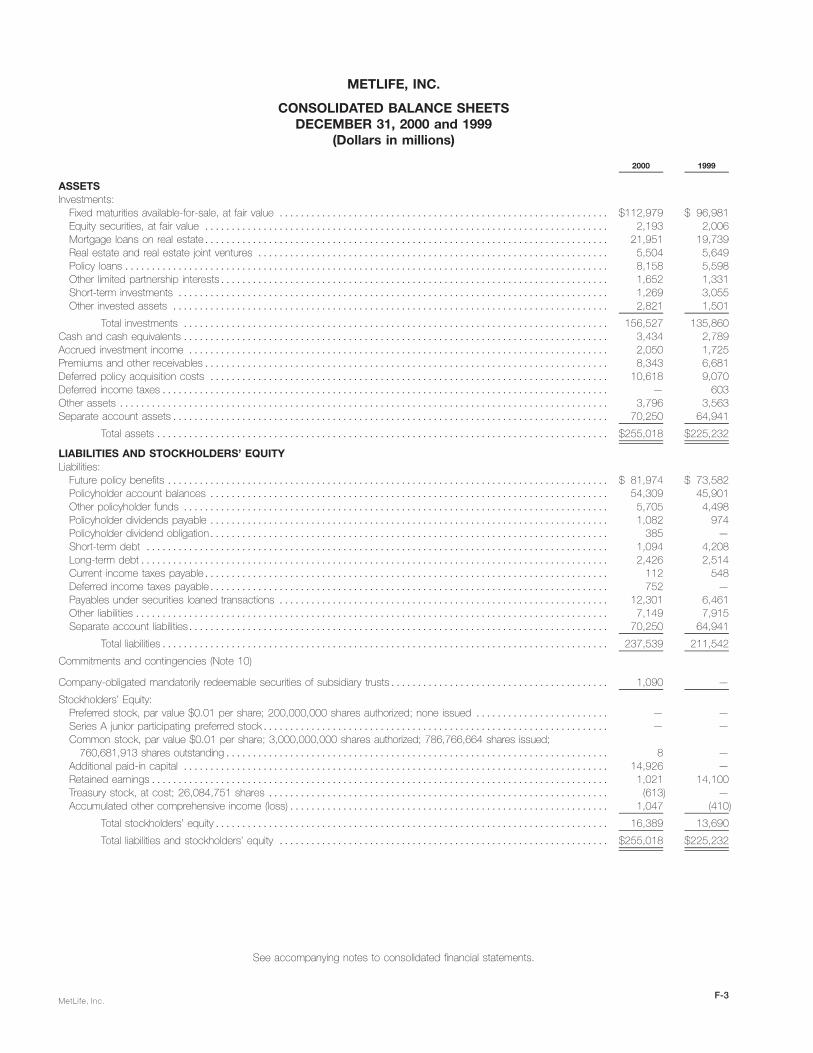
METLIFE, INC.
CONSOLIDATED BALANCE SHEETSDECEMBER 31, 2000 and 1999
(Dollars in millions)
2000 1999
ASSETSInvestments:
Fixed maturities available-for-sale, at fair value ************************************************************** $112,979 $ 96,981Equity securities, at fair value **************************************************************************** 2,193 2,006Mortgage loans on real estate**************************************************************************** 21,951 19,739Real estate and real estate joint ventures ****************************************************************** 5,504 5,649Policy loans ******************************************************************************************* 8,158 5,598Other limited partnership interests************************************************************************* 1,652 1,331Short-term investments ********************************************************************************* 1,269 3,055Other invested assets ********************************************************************************** 2,821 1,501
Total investments ******************************************************************************** 156,527 135,860Cash and cash equivalents ******************************************************************************** 3,434 2,789Accrued investment income ******************************************************************************* 2,050 1,725Premiums and other receivables**************************************************************************** 8,343 6,681Deferred policy acquisition costs *************************************************************************** 10,618 9,070Deferred income taxes************************************************************************************ — 603Other assets ******************************************************************************************** 3,796 3,563Separate account assets********************************************************************************** 70,250 64,941
Total assets ************************************************************************************* $255,018 $225,232
LIABILITIES AND STOCKHOLDERS’ EQUITYLiabilities:
Future policy benefits *********************************************************************************** $ 81,974 $ 73,582Policyholder account balances *************************************************************************** 54,309 45,901Other policyholder funds ******************************************************************************** 5,705 4,498Policyholder dividends payable *************************************************************************** 1,082 974Policyholder dividend obligation*************************************************************************** 385 —Short-term debt *************************************************************************************** 1,094 4,208Long-term debt**************************************************************************************** 2,426 2,514Current income taxes payable**************************************************************************** 112 548Deferred income taxes payable*************************************************************************** 752 —Payables under securities loaned transactions ************************************************************** 12,301 6,461Other liabilities ***************************************************************************************** 7,149 7,915Separate account liabilities******************************************************************************* 70,250 64,941
Total liabilities************************************************************************************ 237,539 211,542
Commitments and contingencies (Note 10)
Company-obligated mandatorily redeemable securities of subsidiary trusts***************************************** 1,090 —
Stockholders’ Equity:Preferred stock, par value $0.01 per share; 200,000,000 shares authorized; none issued ************************* — —Series A junior participating preferred stock***************************************************************** — —Common stock, par value $0.01 per share; 3,000,000,000 shares authorized; 786,766,664 shares issued;
760,681,913 shares outstanding************************************************************************ 8 —Additional paid-in capital ******************************************************************************** 14,926 —Retained earnings************************************************************************************** 1,021 14,100Treasury stock, at cost; 26,084,751 shares **************************************************************** (613) —Accumulated other comprehensive income (loss)************************************************************ 1,047 (410)
Total stockholders’ equity************************************************************************** 16,389 13,690
Total liabilities and stockholders’ equity ************************************************************** $255,018 $225,232
See accompanying notes to consolidated financial statements.
MetLife, Inc.F-3

METLIFE, INC.
CONSOLIDATED STATEMENTS OF INCOMEFOR THE YEARS ENDED DECEMBER 31, 2000, 1999 and 1998
(Dollars in millions, except per share data)2000 1999 1998
REVENUESPremiums************************************************************************************** $16,317 $12,088 $11,503Universal life and investment-type product policy fees ************************************************* 1,820 1,433 1,360Net investment income ************************************************************************** 11,768 9,816 10,228Other revenues ********************************************************************************* 2,432 2,154 1,994Net investment (losses) gains (net of amounts allocable to other accounts of $(54), $(67) and $608,
respectively)********************************************************************************** (390) (70) 2,021
Total revenues************************************************************************** 31,947 25,421 27,106
EXPENSESPolicyholder benefits and claims (excludes amounts directly related to net investment gains and losses of $41,
$(21) and $368, respectively) ******************************************************************* 16,893 13,100 12,638Interest credited to policyholder account balances**************************************************** 2,935 2,441 2,711Policyholder dividends *************************************************************************** 1,919 1,690 1,651Payments to former Canadian policyholders ********************************************************* 327 — —Demutualization costs**************************************************************************** 230 260 6Other expenses (excludes amounts directly related to net investment and losses gains of $(95), $(46) and
$240, respectively) **************************************************************************** 8,227 6,755 8,019
Total expenses ************************************************************************* 30,531 24,246 25,025
Income before provision for income taxes *********************************************************** 1,416 1,175 2,081Provision for income taxes************************************************************************ 463 558 738
Net income ************************************************************************************ $ 953 $ 617 $ 1,343
Net income after April 7, 2000 (date of demutualization) (Note 17) ************************************** $ 1,173
Net income per shareBasic *************************************************************************************** $ 1.52
Diluted ************************************************************************************** $ 1.49
Cash dividends per share ************************************************************************ $ 0.20
See accompanying notes to consolidated financial statements.
MetLife, Inc.F-4

METLIFE, INC.
CONSOLIDATED STATEMENTS OF STOCKHOLDERS’ EQUITYFOR THE YEARS ENDED DECEMBER 31, 2000, 1999 and 1998
(Dollars in millions)Accumulated Other
Comprehensive Income (Loss)
Net Foreign MinimumAdditional Treasury Unrealized Currency Pension
Common Paid-in Retained Stock Investment Translation LiabilityStock Capital Earnings at Cost Gains (Losses) Adjustment Adjustment Total
Balance at January 1, 1998**************************** $— $ — $ 12,140 $ — $ 1,898 $ (31) $ — $14,007Comprehensive income:
Net income *************************************** 1,343 1,343Other comprehensive loss:
Unrealized investment losses, net of related offsets,reclassification adjustments and income taxes******* (358) (358)
Foreign currency translation adjustments ************* (113) (113)Minimum pension liability adjustment***************** (12) (12)
Other comprehensive loss ************************* (483)
Comprehensive income ***************************** 860
Balance at December 31, 1998 ************************ — — 13,483 — 1,540 (144) (12) 14,867Comprehensive loss:
Net income *************************************** 617 617Other comprehensive loss:
Unrealized investment losses, net of related offsets,reclassification adjustments and income taxes******* (1,837) (1,837)
Foreign currency translation adjustments ************* 50 50Minimum pension liability adjustment***************** (7) (7)
Other comprehensive loss ************************* (1,794)
Comprehensive loss ******************************** (1,177)
Balance at December 31, 1999 ************************ — — 14,100 — (297) (94) (19) 13,690Policy credits and cash payments to eligible policyholders ** (2,958) (2,958)Common stock issued in demutualization **************** 5 10,917 (10,922) —Initial public offering of common stock ******************* 2 3,152 3,154Private placement of common stock********************* 1 854 855Unit offering ***************************************** 3 3Treasury stock acquired ******************************* (613) (613)Dividends on common stock *************************** (152) (152)Comprehensive income:
Net loss before date of demutualization **************** (220) (220)Net income after date of demutualization *************** 1,173 1,173Other comprehensive income:
Unrealized investment gains, net of related offsets,reclassification adjustments and income taxes******* 1,472 1,472
Foreign currency translation adjustments ************* (6) (6)Minimum pension liability adjustment***************** (9) (9)
Other comprehensive income ********************** 1,457
Comprehensive income ******************************* 2,410
Balance at December 31, 2000 ************************ $ 8 $14,926 $ 1,021 $(613) $ 1,175 $(100) $(28) $16,389
See accompanying notes to consolidated financial statements.
MetLife, Inc.F-5
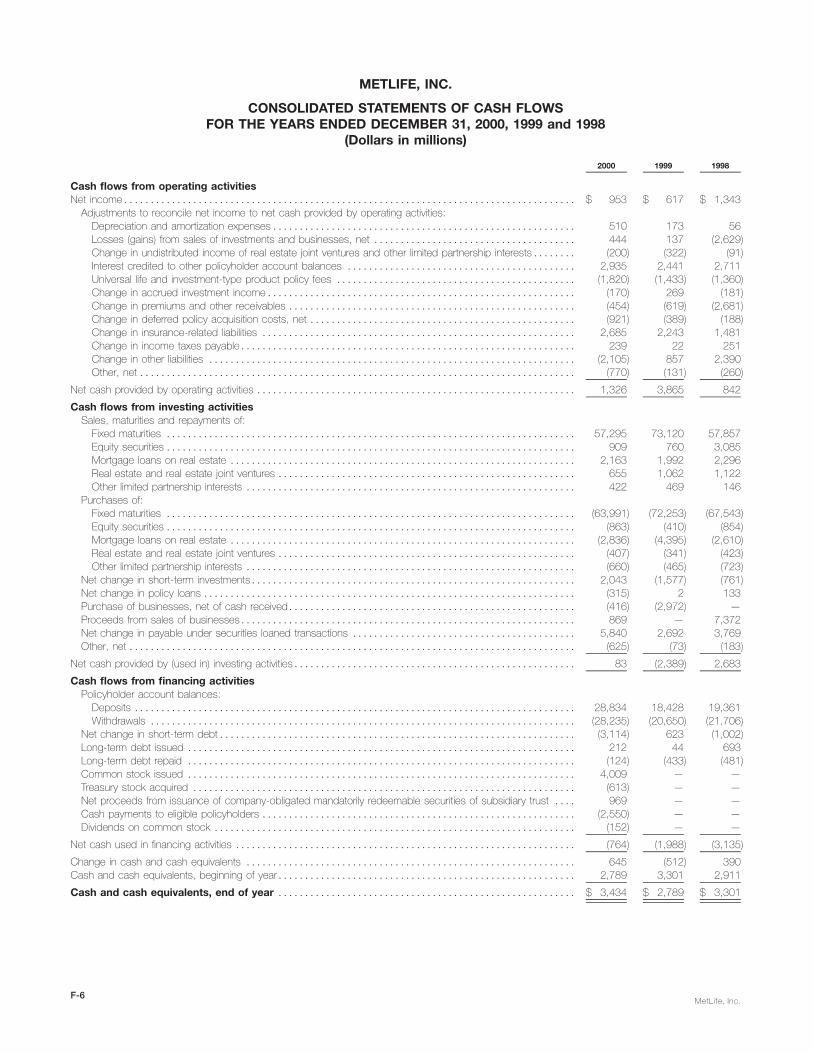
METLIFE, INC.
CONSOLIDATED STATEMENTS OF CASH FLOWSFOR THE YEARS ENDED DECEMBER 31, 2000, 1999 and 1998
(Dollars in millions)
2000 1999 1998
Cash flows from operating activitiesNet income************************************************************************************* $ 953 $ 617 $ 1,343
Adjustments to reconcile net income to net cash provided by operating activities:Depreciation and amortization expenses********************************************************* 510 173 56Losses (gains) from sales of investments and businesses, net ************************************** 444 137 (2,629)Change in undistributed income of real estate joint ventures and other limited partnership interests******** (200) (322) (91)Interest credited to other policyholder account balances ******************************************* 2,935 2,441 2,711Universal life and investment-type product policy fees ********************************************* (1,820) (1,433) (1,360)Change in accrued investment income********************************************************** (170) 269 (181)Change in premiums and other receivables ****************************************************** (454) (619) (2,681)Change in deferred policy acquisition costs, net ************************************************** (921) (389) (188)Change in insurance-related liabilities *********************************************************** 2,685 2,243 1,481Change in income taxes payable*************************************************************** 239 22 251Change in other liabilities ********************************************************************* (2,105) 857 2,390Other, net ********************************************************************************** (770) (131) (260)
Net cash provided by operating activities ************************************************************ 1,326 3,865 842
Cash flows from investing activitiesSales, maturities and repayments of:
Fixed maturities ***************************************************************************** 57,295 73,120 57,857Equity securities ***************************************************************************** 909 760 3,085Mortgage loans on real estate ***************************************************************** 2,163 1,992 2,296Real estate and real estate joint ventures ******************************************************** 655 1,062 1,122Other limited partnership interests ************************************************************** 422 469 146
Purchases of:Fixed maturities ***************************************************************************** (63,991) (72,253) (67,543)Equity securities ***************************************************************************** (863) (410) (854)Mortgage loans on real estate ***************************************************************** (2,836) (4,395) (2,610)Real estate and real estate joint ventures ******************************************************** (407) (341) (423)Other limited partnership interests ************************************************************** (660) (465) (723)
Net change in short-term investments************************************************************* 2,043 (1,577) (761)Net change in policy loans ********************************************************************** (315) 2 133Purchase of businesses, net of cash received****************************************************** (416) (2,972) —Proceeds from sales of businesses*************************************************************** 869 — 7,372Net change in payable under securities loaned transactions ****************************************** 5,840 2,692 3,769Other, net ************************************************************************************ (625) (73) (183)
Net cash provided by (used in) investing activities***************************************************** 83 (2,389) 2,683
Cash flows from financing activitiesPolicyholder account balances:
Deposits *********************************************************************************** 28,834 18,428 19,361Withdrawals ******************************************************************************** (28,235) (20,650) (21,706)
Net change in short-term debt******************************************************************* (3,114) 623 (1,002)Long-term debt issued ************************************************************************* 212 44 693Long-term debt repaid ************************************************************************* (124) (433) (481)Common stock issued ************************************************************************* 4,009 — —Treasury stock acquired ************************************************************************ (613) — —Net proceeds from issuance of company-obligated mandatorily redeemable securities of subsidiary trust **** 969 — —Cash payments to eligible policyholders *********************************************************** (2,550) — —Dividends on common stock ******************************************************************** (152) — —
Net cash used in financing activities **************************************************************** (764) (1,988) (3,135)
Change in cash and cash equivalents ************************************************************** 645 (512) 390Cash and cash equivalents, beginning of year******************************************************** 2,789 3,301 2,911
Cash and cash equivalents, end of year ******************************************************** $ 3,434 $ 2,789 $ 3,301
MetLife, Inc.F-6

METLIFE, INC.
CONSOLIDATED STATEMENTS OF CASH FLOWS — (Continued)FOR THE YEARS ENDED DECEMBER 31, 2000, 1999 and 1998
(Dollars in millions)
2000 1999 1998
Supplemental disclosures of cash flow information:Cash paid during the year for:
Interest ************************************************************************************ $ 440 $ 388 $ 367
Income taxes ******************************************************************************* $ 222 $ 587 $ 579
Non-cash transactions during the year:Policy credits to eligible policyholders *********************************************************** $ 408 $ — $ —
Business acquisitions — assets **************************************************************** $ 22,936 $ 4,832 $ —
Business acquisitions — liabilities*************************************************************** $ 22,437 $ 1,860 $ —
Business dispositions — assets **************************************************************** $ 1,184 $ — $ 10,663
Business dispositions — liabilities*************************************************************** $ 1,014 $ — $ 3,691
Real estate acquired in satisfaction of debt ****************************************************** $ 22 $ 37 $ 69
See accompanying notes to consolidated financial statements.
MetLife, Inc.F-7

METLIFE, INC.
NOTES TO CONSOLIDATED FINANCIAL STATEMENTS1. Summary of Significant Accounting Policies
BusinessMetLife, Inc. (the ‘‘Holding Company’’) and its subsidiaries (‘‘MetLife’’ or the ‘‘Company’’) is a leading provider of insurance and financial services to a
broad section of institutional and individual customers. The Company offers life insurance, annuities and mutual funds to individuals and group insurance,reinsurance and retirement and savings products and services to corporations and other institutions.
Basis of PresentationThe preparation of financial statements in conformity with accounting principles generally accepted in the United States of America requires
management to make estimates and assumptions that affect the reported amounts of assets and liabilities and disclosure of contingent assets andliabilities at the dates of the financial statements and the reported amounts of revenues and expenses during the reporting periods. The most significantestimates include those used in determining deferred policy acquisition costs, investment allowances and the liability for future policyholder benefits.Actual results could differ from those estimates.
The accompanying consolidated financial statements include the accounts of the Holding Company and its subsidiaries, partnerships and jointventures in which the Company has a majority voting interest or general partner interest with limited removal rights by limited partners. Closed blockassets, liabilities, revenues and expenses are combined on a line by line basis with the assets, liabilities, revenues and expenses outside the closedblock based on the nature of the particular item. Intercompany accounts and transactions have been eliminated.
The Company uses the equity method to account for its investments in real estate joint ventures and other limited partnership interests in which itdoes not have a controlling interest, but has more than a minimal interest.
Minority interest related to consolidated entities included in other liabilities was $479 million and $245 million at December 31, 2000 and 1999,respectively.
Certain amounts in the prior years’ consolidated financial statements have been reclassified to conform with the 2000 presentation.
Demutualization and Initial Public OfferingOn April 7, 2000 (the ‘‘date of demutualization’’), Metropolitan Life Insurance Company (‘‘Metropolitan Life’’) converted from a mutual life insurance
company to a stock life insurance company and became a wholly-owned subsidiary of MetLife, Inc. The conversion was pursuant to an order by the NewYork Superintendent of Insurance (‘‘Superintendent’’) approving Metropolitan Life’s plan of reorganization, as amended (the ‘‘plan’’).
On the date of demutualization, policyholders’ membership interests in Metropolitan Life were extinguished and eligible policyholders received, inexchange for their interests, trust interests representing 494,466,664 shares of common stock of MetLife, Inc. to be held in a trust, cash paymentsaggregating $2,550 million and adjustments to their policy values in the form of policy credits aggregating $408 million, as provided in the plan. Inaddition, Metropolitan Life’s Canadian branch made cash payments of $327 million to holders of certain policies transferred to Clarica Life InsuranceCompany in connection with the sale of a substantial portion of Metropolitan Life’s Canadian operations in 1998, as a result of a commitment made inconnection with obtaining Canadian regulatory approval of that sale.
InvestmentsThe Company’s fixed maturity and equity securities are classified as available-for-sale and are reported at their estimated fair value. Unrealized
investment gains and losses on securities are recorded as a separate component of other comprehensive income (loss), net of policyholder relatedamounts and deferred income taxes. The cost of fixed maturity and equity securities is adjusted for impairments in value deemed to be other thantemporary. These adjustments are recorded as investment losses. Investment gains and losses on sales of securities are determined on a specificidentification basis. All security transactions are recorded on a trade date basis.
Mortgage loans on real estate are stated at amortized cost, net of valuation allowances. Valuation allowances are established for the excess carryingvalue of the mortgage loan over its estimated fair value when it is probable that, based upon current information and events, the Company will be unableto collect all amounts due under the contractual terms of the loan agreement. Valuation allowances are based upon the present value of expected futurecash flows discounted at the loan’s original effective interest rate or the collateral value if the loan is collateral dependent. Interest income earned onimpaired loans is accrued on the net carrying value amount of the loan based on the loan’s effective interest rate. However, interest ceases to be accruedfor loans on which interest is more than 60 days past due.
Real estate, including related improvements, is stated at cost less accumulated depreciation. Depreciation is provided on a straight-line basis overthe estimated useful life of the asset (typically 20 to 40 years). Cost is adjusted for impairment whenever events or changes in circumstances indicate thecarrying amount of the asset may not be recoverable. Impaired real estate is written down to estimated fair value with the impairment loss being includedin net investment gains (losses). Impairment losses are based upon the estimated fair value of real estate, which is generally computed using the presentvalue of expected future cash flows from the real estate discounted at a rate commensurate with the underlying risks. Real estate acquired in satisfactionof debt is recorded at estimated fair value at the date of foreclosure. Valuation allowances on real estate held-for-sale are computed using the lower ofdepreciated cost or estimated fair value, net of disposition costs.
Policy loans are stated at unpaid principal balances.Short-term investments are stated at amortized cost, which approximates fair value.
Derivative InstrumentsThe Company uses derivative instruments to reduce the risk associated with changing market values or variable cash flows related to the
Company’s financial assets and liabilities. This objective is achieved through one of two principal risk management strategies: hedging the changes in fairvalue of financial assets, liabilities or firm commitments or hedging the variable cash flows of assets, liabilities or forecasted transactions. Hedgedforecasted transactions, other than the receipt or payment of variable interest payments, are not expected to occur more than 12 months after hedgeinception. The Company’s derivative strategy employs a variety of instruments including financial futures, financial forwards, interest rate and foreigncurrency swaps, floors, foreign exchange contracts, caps and options.
The Company’s derivative program is monitored by senior management. The Company’s risk of loss is typically limited to the fair value of itsderivative instruments and not to the notional or contractual amounts of these derivatives. Risk arises from changes in the fair value of the underlying
MetLife, Inc.F-8

METLIFE, INC.
NOTES TO CONSOLIDATED FINANCIAL STATEMENTS — (Continued)
instruments and, with respect to over-the-counter transactions, from the possible inability of counterparties to meet the terms of the contracts. TheCompany has policies regarding the financial stability and credit standing of its major counterparties.
The Company uses derivative instruments to hedge designated risks. The hedge is expected to be highly effective in offsetting the designated risk atthe inception of the contract. The Company monitors the effectiveness of its hedges throughout the contract term using an offset ratio of 80 to125 percent as its minimum acceptable threshold for hedge effectiveness. During any period the derivative instruments are outside their threshold forhedge effectiveness, or if the relationship no longer qualifies as a hedge, all changes in the derivative’s value are marked to market through net investmentgains and losses.
Gains or losses on financial futures contracts entered into in anticipation of investment transactions are deferred and, at the time of the ultimateinvestment purchase or disposition, recorded as an adjustment to the basis of the purchased assets or to the proceeds on disposition. Gains or losseson financial futures used in asset risk management are deferred and amortized into net investment income over the remaining term of the investment.Gains or losses on financial futures used in portfolio risk management are deferred and amortized into net investment income or policyholder benefits overthe remaining life of the hedged sector of the underlying portfolio.
Financial forward contracts that are entered into to purchase securities are marked to fair value through other comprehensive income, similar to theaccounting for the security to be purchased. Such contracts are accounted for at settlement by recording the purchase of the specified securities at thecontracted value. Gains or losses resulting from the termination of forward contracts are recognized immediately as a component of net investment gainsand losses.
Interest rate and certain foreign currency swaps involve the periodic exchange of payments without the exchange of underlying principal or notionalamounts. Net receipts or payments are accrued and recognized over the term of the swap agreement as an adjustment to net investment income orother expenses. Gains or losses resulting from swap terminations are amortized over the remaining term of the underlying asset or liability. Gains andlosses on swaps and certain foreign forward exchange contracts entered into in anticipation of investment transactions are deferred and, at the time ofthe ultimate investment purchase or disposition, reflected as an adjustment to the basis of the purchased assets or to the proceeds of disposition. In theevent the asset or liability underlying a swap is disposed of, the swap position is closed immediately and any gain or loss is recorded in net investmentgains and losses.
The Company periodically enters into collars, which consist of purchased put and written call options, to lock in unrealized gains on equity securities.Collars are marked to market through other comprehensive income or loss, similar to the accounting for the underlying equity securities.
Purchased interest rate caps and floors are used to offset the risk of interest rate changes related to insurance liabilities. Premiums paid on floors,caps and options are amortized over the life of the applicable derivative instrument. Any gains or losses relating to these derivative instruments aredeferred and are recognized as a component of net investment income over the original term of the derivative instrument.
Cash and Cash EquivalentsThe Company considers all investments purchased with an original maturity of three months or less to be cash equivalents.
Property, Equipment and Leasehold ImprovementsProperty, equipment and leasehold improvements, which are included in other assets, are stated at cost, less accumulated depreciation and
amortization. Depreciation is determined using either the straight-line or sum-of-the-years-digits method over the estimated useful lives of the assets.Estimated lives range from ten to 40 years for leasehold improvements and three to 15 years for all other property and equipment. Accumulateddepreciation of property and equipment and accumulated amortization on leasehold improvements was $1,304 million and $1,224 million at Decem-ber 31, 2000 and 1999, respectively. Related depreciation and amortization expense was $120 million, $109 million and $116 million for the yearsended December 31, 2000, 1999 and 1998, respectively.
Deferred Policy Acquisition CostsThe costs of acquiring new insurance business that vary with, and are primarily related to, the production of new business are deferred. Such costs,
which consist principally of commissions, agency and policy issue expenses, are amortized with interest over the expected life of the contract forparticipating traditional life, universal life and investment-type products. Generally, deferred policy acquisition costs are amortized in proportion to thepresent value of estimated gross margins or profits from investment, mortality, expense margins and surrender charges. Interest rates are based on ratesin effect at the inception or acquisition of the contracts. Actual gross margins or profits can vary from management’s estimates resulting in increases ordecreases in the rate of amortization. Management periodically updates these estimates and evaluates the recoverability of deferred policy acquisitioncosts. When appropriate, management revises its assumptions of the estimated gross margins or profits of these contracts, and the cumulativeamortization is re-estimated and adjusted by a cumulative charge or credit to current operations.
Deferred policy acquisition costs for non-participating traditional life, non-medical health and annuity policies with life contingencies are amortized inproportion to anticipated premiums. Assumptions as to anticipated premiums are made at the date of policy issuance or acquisition and are consistentlyapplied during the lives of the contracts. Deviations from estimated experience are included in operations when they occur. For these contracts, theamortization period is typically the estimated life of the policy.
Deferred policy acquisition costs related to internally replaced contracts are expensed at the date of replacement.Deferred policy acquisition costs for property and casualty insurance contracts, which are primarily comprised of commissions and certain
underwriting expenses, are deferred and amortized on a pro rata basis over the applicable contract term or reinsurance treaty.Value of business acquired, included as part of deferred policy acquisition costs, represents the present value of future profits generated from
existing insurance contracts in force at the date of acquisition and is amortized over the expected policy or contract duration in relation to the presentvalue of estimated gross profits from such policies and contracts.
MetLife, Inc.F-9

METLIFE, INC.
NOTES TO CONSOLIDATED FINANCIAL STATEMENTS — (Continued)
Information regarding deferred policy acquisition costs is as follows:
Years ended December 31,
2000 1999 1998
(Dollars in millions)
Balance at January 1********************************************************************** $ 9,070 $ 7,028 $6,948Capitalization of policy acquisition costs ****************************************************** 1,863 1,160 1,025Value of business acquired ***************************************************************** 1,681 156 32
Total **************************************************************************** 12,614 8,344 8,005
Amortization allocated to:Net investment (losses) gains ************************************************************* (95) (46) 240Unrealized investment gains (losses) ******************************************************* 590 (1,628) (216)Other expenses ************************************************************************ 1,478 930 641
Total amortization ***************************************************************** 1,973 (744) 665
Dispositions and other********************************************************************* (23) (18) (312)
Balance at December 31 ****************************************************************** $10,618 $ 9,070 $7,028
Amortization of deferred policy acquisition costs is allocated to (1) investment gains and losses to provide consolidated statement of incomeinformation regarding the impact of such gains and losses on the amount of the amortization, (2) unrealized investment gains and losses to provideinformation regarding the amount of deferred policy acquisition costs that would have been amortized if such gains and losses had been recognized, and(3) other expenses to provide amounts related to the gross margins or profits originating from transactions other than investment gains and losses.
Investment gains and losses related to certain products have a direct impact on the amortization of deferred policy acquisition costs. Presentinginvestment gains and losses net of related amortization of deferred policy acquisition costs provides information useful in evaluating the operatingperformance of the Company. This presentation may not be comparable to presentations made by other insurers.
GoodwillThe excess of cost over the fair value of net assets acquired (‘‘goodwill’’) is included in other assets. Goodwill is amortized on a straight-line basis
over a period ranging from ten to 30 years. The Company reviews goodwill to assess recoverability from future operations using undiscounted cashflows. Impairments are recognized in operating results if a permanent diminution in value is deemed to have occurred.
Years ended December 31
2000 1999 1998
(Dollars in millions)
Net Balance at January 1********************************************************************************* $611 $404 $359Acquisitions ******************************************************************************************** 279 237 67Amortization ******************************************************************************************** (62) (30) (22)Dispositions ******************************************************************************************** (125) — —
Net Balance at December 31 ***************************************************************************** $703 $611 $404
December 31
2000 1999
(Dollars in millions)
Accumulated Amortization ******************************************************************************* $ 74 $118
Future Policy Benefits and Policyholder Account BalancesFuture policy benefit liabilities for participating traditional life insurance policies are equal to the aggregate of (1) net level premium reserves for death
and endowment policy benefits (calculated based upon the nonforfeiture interest rate, ranging from 3% to 11%, and mortality rates guaranteed incalculating the cash surrender values described in such contracts), (2) the liability for terminal dividends, and (3) premium deficiency reserves, which areestablished when the liabilities for future policy benefits plus the present value of expected future gross premiums are insufficient to provide for expectedfuture policy benefits and expenses after deferred policy acquisition costs are written off.
Future policy benefit liabilities for traditional annuities are equal to accumulated contractholder fund balances during the accumulation period and thepresent value of expected future payments after annuitization. Interest rates used in establishing such liabilities range from 3% to 12%. Future policybenefit liabilities for non-medical health insurance are calculated using the net level premium method and assumptions as to future morbidity, withdrawalsand interest, which provide a margin for adverse deviation. Interest rates used in establishing such liabilities range from 3% to 11%. Future policy benefitliabilities for disabled lives are estimated using the present value of benefits method and experience assumptions as to claim terminations, expenses andinterest. Interest rates used in establishing such liabilities range from 3% to 11%.
Policyholder account balances for universal life and investment-type contracts are equal to the policy account values, which consist of anaccumulation of gross premium payments plus credited interest, ranging from 2% to 17%, less expenses, mortality charges, and withdrawals.
The liability for unpaid claims and claim expenses for property and casualty insurance represents the amount estimated for claims that have beenreported but not settled and claims incurred but not reported. Liabilities for unpaid claims are estimated based upon the Company’s historical experienceand other actuarial assumptions that consider the effects of current developments, anticipated trends and risk management programs, reduced foranticipated salvage and subrogation. Revisions of these estimates are included in operations in the year such refinements are made.
MetLife, Inc.F-10

METLIFE, INC.
NOTES TO CONSOLIDATED FINANCIAL STATEMENTS — (Continued)
Recognition of Insurance Revenue and Related BenefitsPremiums related to traditional life and annuity policies with life contingencies are recognized as revenues when due. Benefits and expenses are
provided against such revenues to recognize profits over the estimated lives of the policies. When premiums are due over a significantly shorter periodthan the period over which benefits are provided, any excess profit is deferred and recognized into operations in a constant relationship to insurance in-force or, for annuities, the amount of expected future policy benefit payments.
Premiums related to non-medical health contracts are recognized on a pro rata basis over the applicable contract term.Deposits related to universal life and investment-type products are credited to policyholder account balances. Revenues from such contracts
consist of amounts assessed against policyholder account balances for mortality, policy administration and surrender charges. Amounts that are chargedto operations include interest credited and benefit claims incurred in excess of related policyholder account balances.
Premiums related to property and casualty contracts are recognized as revenue on a pro rata basis over the applicable contract term. Unearnedpremiums are included in other liabilities.
Policyholder DividendsPolicyholder dividends are approved annually by the boards of directors. The aggregate amount of policyholder dividends is related to actual interest,
mortality, morbidity and expense experience for the year, as well as management’s judgment as to the appropriate level of statutory surplus to be retainedby the insurance subsidiaries.
Participating BusinessParticipating business represented approximately 22% and 19% of the Company’s life insurance in-force, and 81% and 83% of the number of life
insurance policies in-force, at December 31, 2000 and 1999, respectively. Participating policies represented approximately 47% and 50%, 50% and54%, and 45% and 47% of gross and net life insurance premiums for the years ended December 31, 2000, 1999 and 1998, respectively. Thepercentages indicated are calculated excluding the business of the Reinsurance segment.
Income TaxesThe Holding Company and its includable life insurance and non-life insurance subsidiaries file a consolidated U.S. federal income tax return in
accordance with the provisions of the Internal Revenue Code of 1986, as amended (the ‘‘Code’’). Non-includable subsidiaries file either separate taxreturns or separate consolidated tax returns. Under the Code, the amount of federal income tax expense incurred by mutual life insurance companiesincludes an equity tax calculated based upon a prescribed formula that incorporates a differential earnings rate between stock and mutual life insurancecompanies. Metropolitan Life is not subject to the equity tax after the date of demutualization. The future tax consequences of temporary differencesbetween financial reporting and tax bases of assets and liabilities are measured at the balance sheet dates and are recorded as deferred income taxassets and liabilities.
ReinsuranceThe Company has reinsured certain of its life insurance and property and casualty insurance contracts with other insurance companies under
various agreements. Amounts due from reinsurers are estimated based upon assumptions consistent with those used in establishing the liabilities relatedto the underlying reinsured contracts. Policy and contract liabilities are reported gross of reinsurance credits. Deferred policy acquisition costs arereduced by amounts recovered under reinsurance contracts. Amounts received from reinsurers for policy administration are reported in other revenues.
The Company assumes and retrocedes financial reinsurance contracts, which represent low mortality risk reinsurance treaties. These contracts arereported as deposits and are included in other assets. The amount of revenue reported on these contracts represents fees and the cost of insuranceunder the terms of the reinsurance agreement.
Separate AccountsSeparate accounts are established in conformity with insurance laws and are generally not chargeable with liabilities that arise from any other
business of the Company. Separate account assets are subject to general account claims only to the extent the value of such assets exceeds theseparate account liabilities. Investments (stated at estimated fair value) and liabilities of the separate accounts are reported separately as assets andliabilities. Deposits to separate accounts, investment income and recognized and unrealized gains and losses on the investments of the separateaccounts accrue directly to contractholders and, accordingly, are not reflected in the Company’s consolidated statements of income and cash flows.Mortality, policy administration and surrender charges to all separate accounts are included in revenues.
Foreign Currency TranslationBalance sheet accounts of foreign operations are translated at the exchange rates in effect at each year-end and income and expense accounts are
translated at the average rates of exchange prevailing during the year. The local currencies of foreign operations are the functional currencies unless thelocal economy is highly inflationary. Translation adjustments are charged or credited directly to other comprehensive income or loss. Gains and lossesfrom foreign currency transactions are reported in earnings.
Earnings Per ShareEarnings per share amounts, on a basic and diluted basis, have been calculated based upon the weighted average common shares outstanding or
deemed to be outstanding only for the period after the date of demutualization.Basic earnings per share is computed based on the weighted average number of shares outstanding during the period. Diluted earnings per share
includes the dilutive effect of forward purchase contracts, using the treasury stock method. Under the treasury stock method, exercise of the forwardpurchase contracts is assumed with the proceeds used to purchase common stock at the average market price for the period. The difference betweenthe number of shares assumed issued and number of shares assumed purchased represents the dilutive shares.
MetLife, Inc.F-11
METLIFE, INC.
NOTES TO CONSOLIDATED FINANCIAL STATEMENTS — (Continued)
Application of Accounting PronouncementsEffective December 31, 2000, the Company early adopted Statement of Position (‘‘SOP’’) 00-3, Accounting by Insurance Enterprises for
Demutualizations and Formations of Mutual Insurance Holding Companies and for Certain Long-Duration Participating Contracts (‘‘SOP 00-3’’). SOP 00-3provides guidance on accounting by insurance enterprises for demutualizations and the formation of mutual insurance holding companies, including theemergence of earnings from and the financial statement presentation of the closed block formed as a part of a demutualization. Adoption of SOP 00-3did not have a material effect on the Company’s consolidated results of operations other than the reclassification of demutualization costs as operatingexpenses rather than as an extraordinary item.
Effective October 1, 2000, the Company adopted Staff Accounting Bulletin No. 101, Revenue Recognition in Financial Statements (‘‘SAB 101’’).SAB 101 summarizes certain of the Securities and Exchange Commission’s views in applying generally accepted accounting principles to revenuerecognition in financial statements. The requirements of SAB 101 did not have a material effect on the Company’s consolidated financial statements.
Effective January 1, 2000, the Company adopted Statement of Position 98-7, Accounting for Insurance and Reinsurance Contracts That Do NotTransfer Insurance Risk (‘‘SOP 98-7’’). SOP 98-7 provides guidance on the method of accounting for insurance and reinsurance contracts that do nottransfer insurance risk, defined in the SOP as the deposit method. SOP 98-7 classifies insurance and reinsurance contracts for which the depositmethod is appropriate into those that (1) transfer only significant timing risk, (2) transfer only significant underwriting risk, (3) transfer neither significanttiming nor underwriting risk and (4) have an indeterminate risk. Adoption of SOP 98-7 did not have a material effect on the Company’s consolidatedfinancial statements.
In September 2000, the Financial Accounting Standards Board (‘‘FASB’’) issued Statement of Financial Accounting Standards (‘‘SFAS’’) No. 140,Accounting for Transfers and Servicing of Financial Assets and Extinguishments of Liabilities — a replacement of FASB Statement No. 125 (‘‘SFAS 140’’).SFAS 140 is effective for transfers and extinguishments of liabilities occurring after March 31, 2001 and is effective for disclosures about securitizationsand collateral and for recognition and reclassification of collateral for fiscal years ending after December 15, 2000. The Company is in the process ofquantifying the impact, if any, of the provisions of SFAS 140 effective for future periods.
Effective January 1, 1999, the Company adopted SOP 98-5, Reporting on the Costs of Start-Up Activities (‘‘SOP 98-5’’). SOP 98-5 broadly definesstart-up activities. SOP 98-5 requires costs of start-up activities and organization costs to be expensed as incurred. Adoption of SOP 98-5 did not have amaterial effect on the Company’s consolidated financial statements.
Effective January 1, 1999, the Company adopted SOP 98-1, Accounting for the Costs of Computer Software Developed or Obtained for InternalUse (‘‘SOP 98-1’’). SOP 98-1 provides guidance for determining when an entity should capitalize or expense external and internal costs of computersoftware developed or obtained for internal use. Adoption of the provisions of SOP 98-1 had the effect of increasing other assets by $82 million atDecember 31, 1999.
Effective January 1, 1999, the Company adopted SOP 97-3, Accounting for Insurance and Other Enterprises for Insurance Related Assessments(‘‘SOP 97-3’’). SOP 97-3 provides guidance on accounting by insurance and other enterprises for assessments related to insurance activities includingrecognition, measurement and disclosure of guaranty fund and other insurance related assessments. Adoption of SOP 97-3 did not have a materialeffect on the Company’s consolidated financial statements.
In June 2000, the FASB issued Statement of Financial Accounting Standards No. 138, Accounting for Certain Derivative Instruments and CertainHedging Activities — an Amendment of FASB Statement No. 133 (‘‘SFAS 138’’). In June 1999, the FASB also issued Statement of Financial AccountingStandards No. 137, Accounting for Derivative Instruments and Hedging Activities — Deferral of the Effective Date of FASB Statement No. 133 (‘‘SFAS137’’). SFAS 137 deferred the provisions of Statement of Financial Accounting Standards No. 133, Accounting for Derivative Instruments and HedgingActivities (‘‘SFAS 133’’) until January 1, 2001. SFAS 133 and SFAS 138 require, among other things, that all derivatives be recognized in the consolidatedbalance sheets as either assets or liabilities and measured at fair value. The corresponding derivative gains and losses should be reported based uponthe hedge relationship, if such a relationship exists. Changes in the fair value of derivatives that are not designated as hedges or that do not meet thehedge accounting criteria in SFAS 133 and SFAS 138 are required to be reported in income. The Company estimates that the cumulative effect of theadoption SFAS 133 and SFAS 138, as of January 1, 2001, will result in a $32 million, net of income taxes of $19 million, increase in other comprehensiveincome and an insignificant impact on net income.
In July 2000, the Emerging Issues Task Force (‘‘EITF’’) reached consensus on Issue No. 99-20, Recognition of Interest Income and Impairment onCertain Investments (‘‘EITF No. 99-20’’). This pronouncement requires investors in certain asset-backed securities to record changes in their estimatedyield on a prospective basis and to evaluate these securities for an other-than-temporary decline in value. This consensus is effective for financialstatements with fiscal quarters beginning after December 15, 2000. While the Company currently is in the process of quantifying the impact of EITFNo. 99-20, the provisions of the consensus are not expected to have a material impact on the Company’s consolidated financial statements.
MetLife, Inc.F-12

METLIFE, INC.
NOTES TO CONSOLIDATED FINANCIAL STATEMENTS — (Continued)
2. Investments
Fixed Maturities and Equity SecuritiesFixed maturities and equity securities at December 31, 2000 were as follows:
Cost or Gross UnrealizedAmortized EstimatedCost Gain Loss Fair Value
(Dollars in millions)
Fixed Maturities:Bonds:
U.S. Treasury securities and obligations of U.S. government corporations andagencies ************************************************************* $ 8,461 $1,189 $ 16 $ 9,634
States and political subdivisions ******************************************** 1,563 79 3 1,639Foreign governments ***************************************************** 5,153 341 153 5,341Corporate ************************************************************** 48,893 1,181 1,493 48,581Mortgage- and asset-backed securities ************************************* 33,039 699 165 33,573Other ****************************************************************** 13,872 384 366 13,890
Total bonds ********************************************************* 110,981 3,873 2,196 112,658Redeemable preferred stocks************************************************ 321 — — 321
Total fixed maturities************************************************** $111,302 $3,873 $2,196 $112,979
Equity Securities:Common stocks*********************************************************** $ 872 $ 785 $ 55 $ 1,602Nonredeemable preferred stocks ********************************************* 577 19 5 591
Total equity securities************************************************* $ 1,449 $ 804 $ 60 $ 2,193
Fixed maturities and equity securities at December 31, 1999 were as follows:
Cost or Gross UnrealizedAmortized EstimatedCost Gain Loss Fair Value
(Dollars in millions)
Fixed Maturities:Bonds:
U.S. Treasury securities and obligations of U.S. government corporations andagencies********************************************************** $ 5,990 $ 456 $ 147 $ 6,299
States and political subdivisions **************************************** 1,583 4 45 1,542Foreign governments ************************************************* 4,090 210 94 4,206Corporate*********************************************************** 47,505 585 1,913 46,177Mortgage- and asset-backed securities ********************************** 27,396 112 847 26,661Other ************************************************************** 12,235 313 462 12,086
Total bonds ***************************************************** 98,799 1,680 3,508 96,971Redeemable preferred stocks ******************************************** 10 — — 10
Total fixed maturities ********************************************** $98,809 $1,680 $3,508 $96,981
Equity Securities:Common stocks ******************************************************* $ 980 $ 921 $ 35 $ 1,866Nonredeemable preferred stocks ***************************************** 151 — 11 140
Total equity securities ********************************************* $ 1,131 $ 921 $ 46 $ 2,006
The Company held foreign currency derivatives with notional amounts of $3,885 million and $4,002 million to hedge the exchange rate riskassociated with foreign bonds at December 31, 2000 and 1999, respectively.
At December 31, 2000, fixed maturities at estimated fair values held by the Company that were below investment grade or not rated by anindependent rating agency totaled $9,864 million. At December 31, 2000, non-income producing fixed maturities were insignificant.
MetLife, Inc.F-13
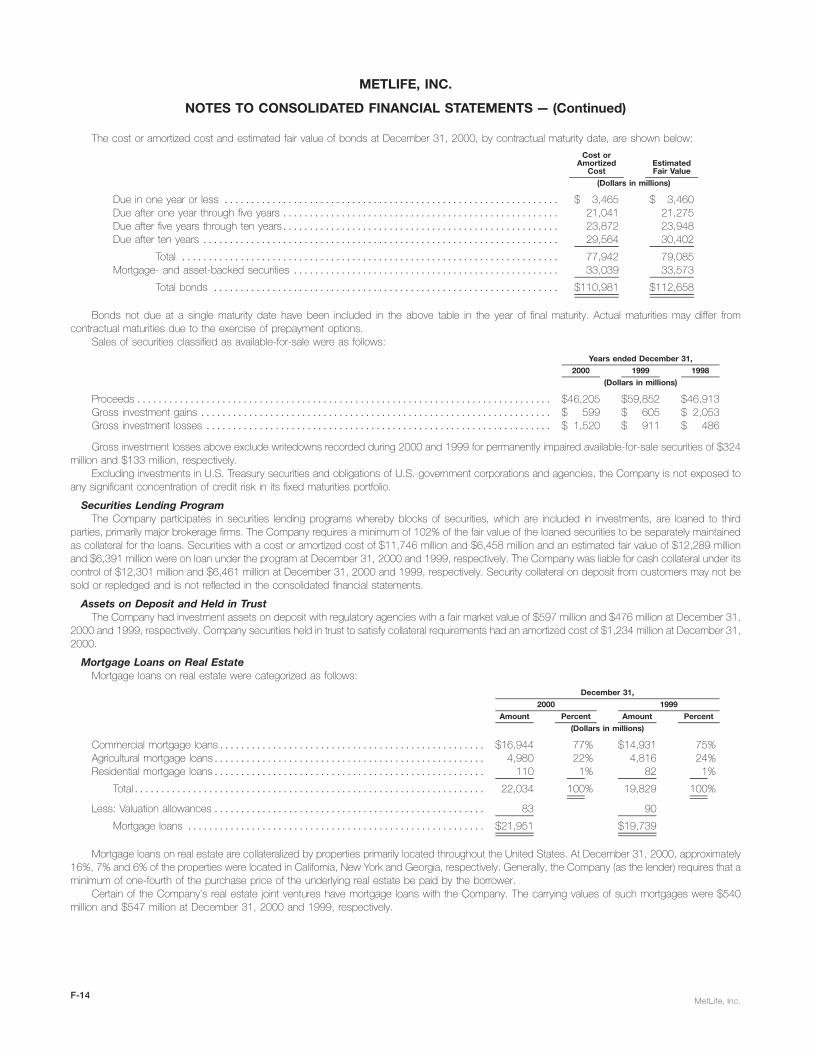
METLIFE, INC.
NOTES TO CONSOLIDATED FINANCIAL STATEMENTS — (Continued)
The cost or amortized cost and estimated fair value of bonds at December 31, 2000, by contractual maturity date, are shown below:
Cost orAmortized Estimated
Cost Fair Value
(Dollars in millions)
Due in one year or less *************************************************************** $ 3,465 $ 3,460Due after one year through five years **************************************************** 21,041 21,275Due after five years through ten years**************************************************** 23,872 23,948Due after ten years ******************************************************************* 29,564 30,402
Total *********************************************************************** 77,942 79,085Mortgage- and asset-backed securities ************************************************** 33,039 33,573
Total bonds ***************************************************************** $110,981 $112,658
Bonds not due at a single maturity date have been included in the above table in the year of final maturity. Actual maturities may differ fromcontractual maturities due to the exercise of prepayment options.
Sales of securities classified as available-for-sale were as follows:
Years ended December 31,
2000 1999 1998
(Dollars in millions)
Proceeds ****************************************************************************** $46,205 $59,852 $46,913Gross investment gains ****************************************************************** $ 599 $ 605 $ 2,053Gross investment losses ***************************************************************** $ 1,520 $ 911 $ 486
Gross investment losses above exclude writedowns recorded during 2000 and 1999 for permanently impaired available-for-sale securities of $324million and $133 million, respectively.
Excluding investments in U.S. Treasury securities and obligations of U.S. government corporations and agencies, the Company is not exposed toany significant concentration of credit risk in its fixed maturities portfolio.
Securities Lending ProgramThe Company participates in securities lending programs whereby blocks of securities, which are included in investments, are loaned to third
parties, primarily major brokerage firms. The Company requires a minimum of 102% of the fair value of the loaned securities to be separately maintainedas collateral for the loans. Securities with a cost or amortized cost of $11,746 million and $6,458 million and an estimated fair value of $12,289 millionand $6,391 million were on loan under the program at December 31, 2000 and 1999, respectively. The Company was liable for cash collateral under itscontrol of $12,301 million and $6,461 million at December 31, 2000 and 1999, respectively. Security collateral on deposit from customers may not besold or repledged and is not reflected in the consolidated financial statements.
Assets on Deposit and Held in TrustThe Company had investment assets on deposit with regulatory agencies with a fair market value of $597 million and $476 million at December 31,
2000 and 1999, respectively. Company securities held in trust to satisfy collateral requirements had an amortized cost of $1,234 million at December 31,2000.
Mortgage Loans on Real EstateMortgage loans on real estate were categorized as follows:
December 31,
2000 1999
Amount Percent Amount Percent
(Dollars in millions)
Commercial mortgage loans************************************************** $16,944 77% $14,931 75%Agricultural mortgage loans*************************************************** 4,980 22% 4,816 24%Residential mortgage loans*************************************************** 110 1% 82 1%
Total****************************************************************** 22,034 100% 19,829 100%
Less: Valuation allowances *************************************************** 83 90
Mortgage loans ******************************************************** $21,951 $19,739
Mortgage loans on real estate are collateralized by properties primarily located throughout the United States. At December 31, 2000, approximately16%, 7% and 6% of the properties were located in California, New York and Georgia, respectively. Generally, the Company (as the lender) requires that aminimum of one-fourth of the purchase price of the underlying real estate be paid by the borrower.
Certain of the Company’s real estate joint ventures have mortgage loans with the Company. The carrying values of such mortgages were $540million and $547 million at December 31, 2000 and 1999, respectively.
MetLife, Inc.F-14
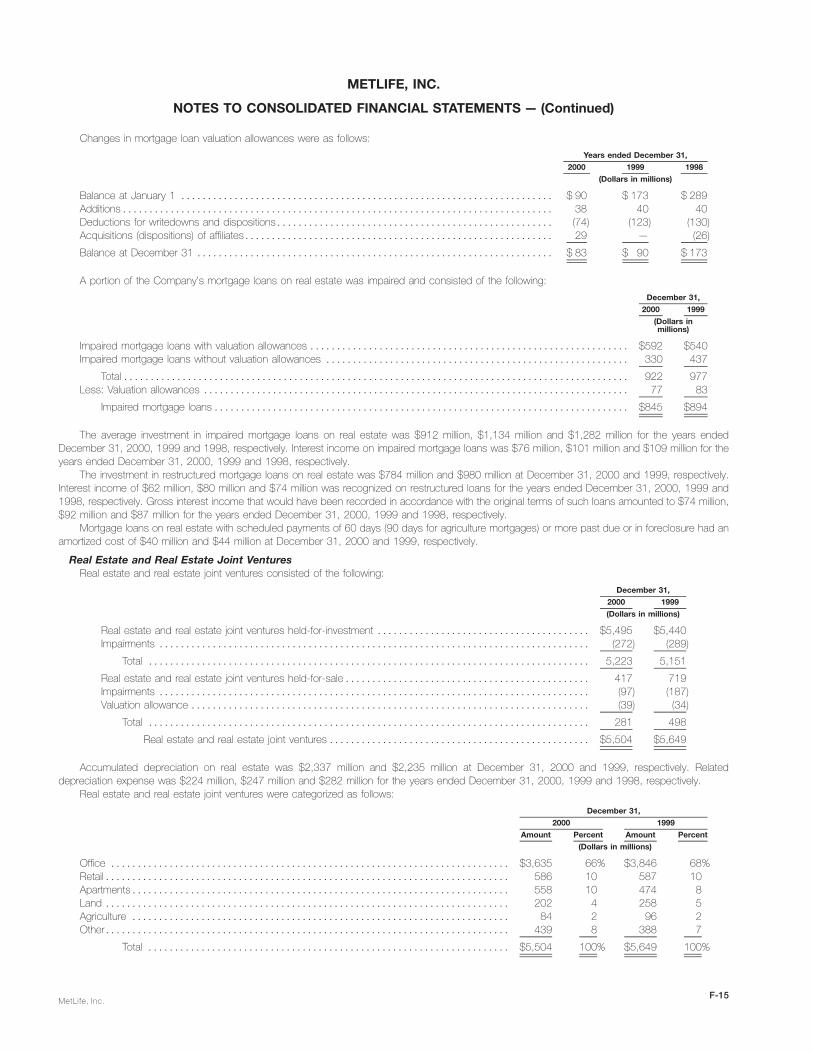
METLIFE, INC.
NOTES TO CONSOLIDATED FINANCIAL STATEMENTS — (Continued)
Changes in mortgage loan valuation allowances were as follows:
Years ended December 31,
2000 1999 1998
(Dollars in millions)
Balance at January 1 ********************************************************************** $ 90 $ 173 $ 289Additions********************************************************************************* 38 40 40Deductions for writedowns and dispositions**************************************************** (74) (123) (130)Acquisitions (dispositions) of affiliates********************************************************** 29 — (26)
Balance at December 31 ******************************************************************* $ 83 $ 90 $ 173
A portion of the Company’s mortgage loans on real estate was impaired and consisted of the following:
December 31,
2000 1999
(Dollars inmillions)
Impaired mortgage loans with valuation allowances ************************************************************ $592 $540Impaired mortgage loans without valuation allowances ********************************************************* 330 437
Total *********************************************************************************************** 922 977Less: Valuation allowances ******************************************************************************** 77 83
Impaired mortgage loans ****************************************************************************** $845 $894
The average investment in impaired mortgage loans on real estate was $912 million, $1,134 million and $1,282 million for the years endedDecember 31, 2000, 1999 and 1998, respectively. Interest income on impaired mortgage loans was $76 million, $101 million and $109 million for theyears ended December 31, 2000, 1999 and 1998, respectively.
The investment in restructured mortgage loans on real estate was $784 million and $980 million at December 31, 2000 and 1999, respectively.Interest income of $62 million, $80 million and $74 million was recognized on restructured loans for the years ended December 31, 2000, 1999 and1998, respectively. Gross interest income that would have been recorded in accordance with the original terms of such loans amounted to $74 million,$92 million and $87 million for the years ended December 31, 2000, 1999 and 1998, respectively.
Mortgage loans on real estate with scheduled payments of 60 days (90 days for agriculture mortgages) or more past due or in foreclosure had anamortized cost of $40 million and $44 million at December 31, 2000 and 1999, respectively.
Real Estate and Real Estate Joint VenturesReal estate and real estate joint ventures consisted of the following:
December 31,
2000 1999
(Dollars in millions)
Real estate and real estate joint ventures held-for-investment **************************************** $5,495 $5,440Impairments ********************************************************************************* (272) (289)
Total *********************************************************************************** 5,223 5,151
Real estate and real estate joint ventures held-for-sale********************************************** 417 719Impairments ********************************************************************************* (97) (187)Valuation allowance *************************************************************************** (39) (34)
Total *********************************************************************************** 281 498
Real estate and real estate joint ventures ************************************************* $5,504 $5,649
Accumulated depreciation on real estate was $2,337 million and $2,235 million at December 31, 2000 and 1999, respectively. Relateddepreciation expense was $224 million, $247 million and $282 million for the years ended December 31, 2000, 1999 and 1998, respectively.
Real estate and real estate joint ventures were categorized as follows:
December 31,
2000 1999
Amount Percent Amount Percent
(Dollars in millions)
Office *************************************************************************** $3,635 66% $3,846 68%Retail**************************************************************************** 586 10 587 10Apartments*********************************************************************** 558 10 474 8Land **************************************************************************** 202 4 258 5Agriculture *********************************************************************** 84 2 96 2Other**************************************************************************** 439 8 388 7
Total ******************************************************************** $5,504 100% $5,649 100%
MetLife, Inc.F-15

METLIFE, INC.
NOTES TO CONSOLIDATED FINANCIAL STATEMENTS — (Continued)
The Company’s real estate holdings are primarily located throughout the United States. At December 31, 2000, approximately 26%, 25% and 10%of the Company’s real estate holdings were located in New York, California and Texas, respectively.
Changes in real estate and real estate joint ventures held-for-sale valuation allowance were as follows:
Years ended December 31,
2000 1999 1998
(Dollars in millions)
Balance at January 1 *************************************************************************** $ 34 $ 33 $110Additions charged (credited) to operations ********************************************************** 17 36 (5)Deductions for writedowns and dispositions********************************************************* (12) (35) (72)
Balance at December 31 ************************************************************************ $ 39 $ 34 $ 33
Investment income related to impaired real estate and real estate joint ventures held-for-investment was $45 million, $61 million and $105 million forthe years ended December 31, 2000, 1999 and 1998, respectively. Investment income related to impaired real estate and real estate joint ventures held-for-sale was $18 million, $14 million and $3 million for the years ended December 31, 2000, 1999 and 1998, respectively. The carrying value of non-income producing real estate and real estate joint ventures was $15 million and $22 million at December 31, 2000 and 1999, respectively.
The Company owned real estate acquired in satisfaction of debt of $66 million and $47 million at December 31, 2000 and 1999, respectively.
Leveraged LeasesLeveraged leases, included in other invested assets, consisted of the following:
December 31,
2000 1999
(Dollars in millions)
Investment ********************************************************************************** $1,002 $1,016Estimated residual values ********************************************************************** 546 559
Total *********************************************************************************** 1,548 1,575Unearned income **************************************************************************** (384) (417)
Leveraged leases ************************************************************************ $1,164 $1,158
The investment amounts set forth above are generally due in monthly installments. The payment periods generally range from three to 15 years, butin certain circumstances are as long as 30 years. These receivables are generally collateralized by the related property.
Net Investment IncomeThe components of net investment income were as follows:
Years ended December 31,
2000 1999 1998
(Dollars in millions)
Fixed maturities ************************************************************************* $ 8,538 $ 7,171 $ 6,990Equity securities ************************************************************************ 41 40 78Mortgage loans on real estate************************************************************* 1,693 1,484 1,580Real estate and real estate joint ventures *************************************************** 1,407 1,426 1,529Policy loans **************************************************************************** 515 340 387Other limited partnership interests********************************************************** 142 199 196Cash, cash equivalents and short-term investments ****************************************** 288 173 187Other ********************************************************************************* 162 91 406
Total ****************************************************************************** 12,786 10,924 11,353Less: Investment expenses *************************************************************** 1,018 1,108 1,125
Net investment income ************************************************************** $11,768 $ 9,816 $10,228
MetLife, Inc.F-16

METLIFE, INC.
NOTES TO CONSOLIDATED FINANCIAL STATEMENTS — (Continued)
Net Investment Gains (Losses)Net investment gains (losses), including changes in valuation allowances, were as follows:
Years ended December 31,
2000 1999 1998
(Dollars in millions)
Fixed maturities ***************************************************************************** $(1,437) $(538) $ 573Equity securities **************************************************************************** 192 99 994Mortgage loans on real estate***************************************************************** (18) 28 23Real estate and real estate joint ventures ******************************************************* 101 265 424Other limited partnership interests************************************************************** (7) 33 13Sales of businesses ************************************************************************* 660 — 531Other ************************************************************************************* 65 (24) 71
Total ********************************************************************************** (444) (137) 2,629Amounts allocable to:
Future policy benefit loss recognition ********************************************************* — — (272)Deferred policy acquisition costs ************************************************************ 95 46 (240)Participating contracts ********************************************************************* (126) 21 (96)Policyholder dividend obligation************************************************************** 85 — —
Net investment (losses) gains ************************************************************* $ (390) $ (70) $2,021
Investment gains and losses have been reduced by (1) additions to future policy benefits resulting from the need to establish additional liabilities dueto the recognition of investment gains, (2) deferred policy acquisition cost amortization to the extent that such amortization results from investment gainsand losses, (3) additions to participating contractholder accounts when amounts equal to such investment gains and losses are credited to thecontractholders’ accounts, and (4) adjustments to the policyholder dividend obligation resulting from investment gains and losses. This presentation maynot be comparable to presentations made by other insurers.
Net Unrealized Investment Gains (Losses)The components of net unrealized investment gains (losses), included in accumulated other comprehensive income (loss), were as follows:
Years ended December 31,
2000 1999 1998
(Dollars in millions)
Fixed maturities*************************************************************************** $ 1,677 $(1,828) $ 4,809Equity securities ************************************************************************** 744 875 832Other invested assets ********************************************************************* 70 165 154
Total ******************************************************************************** 2,491 (788) 5,795
Amounts allocable to:Future policy benefit loss recognition ******************************************************* (284) (249) (2,248)Deferred policy acquisition costs ********************************************************** 107 697 (931)Participating contracts ******************************************************************* (133) (118) (212)Policyholder dividend obligation *********************************************************** (385) — —
Deferred income taxes********************************************************************* (621) 161 (864)
Total ******************************************************************************** (1,316) 491 (4,255)
Net unrealized investment gains (losses) ********************************************** $ 1,175 $ (297) $ 1,540
The changes in net unrealized investment gains (losses) were as follows:
Years ended December 31,
2000 1999 1998
(Dollars in millions)
Balance at January 1*********************************************************************** $ (297) $ 1,540 $1,898Unrealized investment gains (losses) during the year ********************************************* 3,279 (6,583) (870)Unrealized investment gains (losses) relating to:
Future policy benefit (loss) gain recognition *************************************************** (35) 1,999 (59)Deferred policy acquisition costs *********************************************************** (590) 1,628 216Participating contracts ******************************************************************** (15) 94 100Policyholder dividend obligation ************************************************************ (385) — —
Deferred income taxes********************************************************************** (782) 1,025 255
Balance at December 31 ******************************************************************* $1,175 $ (297) $1,540
Net change in unrealized investment gains (losses) ********************************************** $1,472 $(1,837) $ (358)
MetLife, Inc.F-17
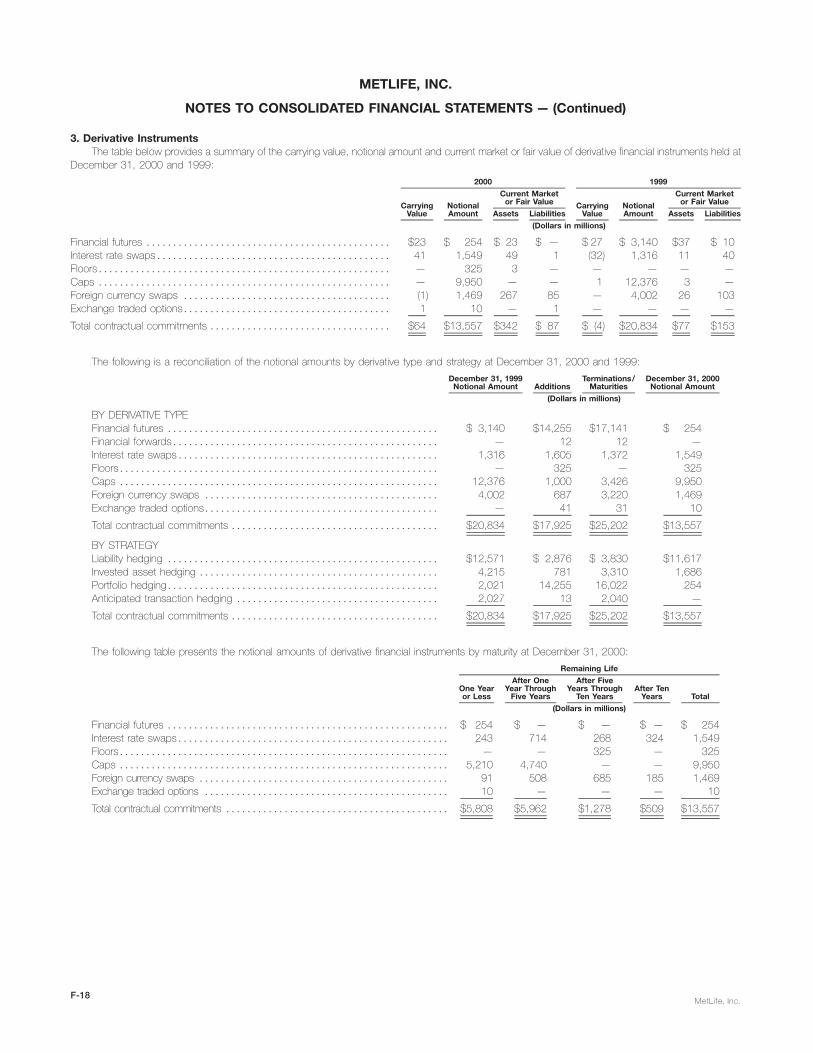
METLIFE, INC.
NOTES TO CONSOLIDATED FINANCIAL STATEMENTS — (Continued)
3. Derivative InstrumentsThe table below provides a summary of the carrying value, notional amount and current market or fair value of derivative financial instruments held at
December 31, 2000 and 1999:
2000 1999
Current Market Current Marketor Fair Value or Fair ValueCarrying Notional Carrying Notional
Value Amount Assets Liabilities Value Amount Assets Liabilities
(Dollars in millions)
Financial futures ********************************************** $23 $ 254 $ 23 $ — $ 27 $ 3,140 $37 $ 10Interest rate swaps******************************************** 41 1,549 49 1 (32) 1,316 11 40Floors******************************************************* — 325 3 — — — — —Caps ******************************************************* — 9,950 — — 1 12,376 3 —Foreign currency swaps *************************************** (1) 1,469 267 85 — 4,002 26 103Exchange traded options*************************************** 1 10 — 1 — — — —
Total contractual commitments ********************************** $64 $13,557 $342 $ 87 $ (4) $20,834 $77 $153
The following is a reconciliation of the notional amounts by derivative type and strategy at December 31, 2000 and 1999:
December 31, 1999 Terminations/ December 31, 2000Notional Amount Additions Maturities Notional Amount
(Dollars in millions)
BY DERIVATIVE TYPEFinancial futures *************************************************** $ 3,140 $14,255 $17,141 $ 254Financial forwards************************************************** — 12 12 —Interest rate swaps************************************************* 1,316 1,605 1,372 1,549Floors************************************************************ — 325 — 325Caps ************************************************************ 12,376 1,000 3,426 9,950Foreign currency swaps ******************************************** 4,002 687 3,220 1,469Exchange traded options******************************************** — 41 31 10
Total contractual commitments *************************************** $20,834 $17,925 $25,202 $13,557
BY STRATEGYLiability hedging *************************************************** $12,571 $ 2,876 $ 3,830 $11,617Invested asset hedging ********************************************* 4,215 781 3,310 1,686Portfolio hedging*************************************************** 2,021 14,255 16,022 254Anticipated transaction hedging ************************************** 2,027 13 2,040 —
Total contractual commitments *************************************** $20,834 $17,925 $25,202 $13,557
The following table presents the notional amounts of derivative financial instruments by maturity at December 31, 2000:
Remaining Life
After One After FiveOne Year Year Through Years Through After Tenor Less Five Years Ten Years Years Total
(Dollars in millions)
Financial futures ***************************************************** $ 254 $ — $ — $ — $ 254Interest rate swaps*************************************************** 243 714 268 324 1,549Floors************************************************************** — — 325 — 325Caps ************************************************************** 5,210 4,740 — — 9,950Foreign currency swaps *********************************************** 91 508 685 185 1,469Exchange traded options ********************************************** 10 — — — 10
Total contractual commitments ****************************************** $5,808 $5,962 $1,278 $509 $13,557
MetLife, Inc.F-18

METLIFE, INC.
NOTES TO CONSOLIDATED FINANCIAL STATEMENTS — (Continued)
4. Fair Value InformationThe estimated fair values of financial instruments have been determined by using available market information and the valuation methodologies
described below. Considerable judgment is often required in interpreting market data to develop estimates of fair value. Accordingly, the estimatespresented herein may not necessarily be indicative of amounts that could be realized in a current market exchange. The use of different assumptions orvaluation methodologies may have a material effect on the estimated fair value amounts.
Amounts related to the Company’s financial instruments were as follows:
Notional Carrying EstimatedAmount Value Fair Value
(Dollars in millions)
December 31, 2000Assets:
Fixed maturities ********************************************************************** $112,979 $112,979Equity securities ********************************************************************* 2,193 2,193Mortgage loans on real estate********************************************************** 21,951 22,847Policy loans ************************************************************************* 8,158 8,914Short-term investments *************************************************************** 1,269 1,269Cash and cash equivalents ************************************************************ 3,434 3,434Mortgage loan commitments*********************************************************** $534 — 17
Liabilities:Policyholder account balances ********************************************************* 43,196 42,958Short-term debt ********************************************************************* 1,094 1,094Long-term debt********************************************************************** 2,426 2,326Payable under securities loaned transactions ********************************************* 12,301 12,301
Other:Company-obligated mandatorily redeemable securities of subsidiary trusts********************* 1,090 1,153
Notional Carrying EstimatedAmount Value Fair Value
(Dollars in millions)
December 31, 1999Assets:
Fixed maturities ************************************************************************ $96,981 $96,981Equity securities************************************************************************ 2,006 2,006Mortgage loans on real estate************************************************************ 19,739 19,452Policy loans *************************************************************************** 5,598 5,618Short-term investments****************************************************************** 3,055 3,055Cash and cash equivalents ************************************************************** 2,789 2,789Mortgage loan commitments ************************************************************* $465 — (7)
Liabilities:Policyholder account balances *********************************************************** 37,170 36,893Short-term debt************************************************************************ 4,208 4,208Long-term debt ************************************************************************ 2,514 2,466Payable under securities loaned transactions *********************************************** 6,461 6,461
The methods and assumptions used to estimate the fair values of financial instruments are summarized as follows:
Fixed Maturities and Equity SecuritiesThe fair value of fixed maturities and equity securities are based upon quotations published by applicable stock exchanges or received from
other reliable sources. For securities in which the market values were not readily available, fair values were estimated using quoted market prices ofcomparable investments.
Mortgage Loans on Real Estate and Mortgage Loan CommitmentsFair values for mortgage loans on real estate are estimated by discounting expected future cash flows, using current interest rates for similar
loans with similar credit risk. For mortgage loan commitments, the estimated fair value is the net premium or discount of the commitments.
Policy LoansFair values for policy loans are estimated by discounting expected future cash flows using U.S. Treasury rates to approximate interest rates and
the Company’s past experiences to project patterns of loan accrual and repayment characteristics.
Cash and Cash Equivalents and Short-term InvestmentsThe carrying values for cash and cash equivalents and short-term investments approximated fair market values due to the short-term maturities
of these instruments.
Policyholder Account BalancesThe fair value of policyholder account balances are estimated by discounting expected future cash flows, based upon interest rates currently
being offered for similar contracts with maturities consistent with those remaining for the agreements being valued.
MetLife, Inc.F-19

METLIFE, INC.
NOTES TO CONSOLIDATED FINANCIAL STATEMENTS — (Continued)
Short-term and Long-term Debt, Payables Under Securities Loaned Transactions and Company-Obligated Mandatorily RedeemableSecurities of Subsidiary Trusts
The fair values of short-term and long-term debt, payables under securities loaned transactions and Company-obligated mandatorily redeemablesecurities of subsidiary trusts are determined by discounting expected future cash flows, using risk rates currently available for debt with similar terms andremaining maturities.
Derivative InstrumentsThe fair value of derivative instruments, including financial futures, financial forwards, interest rate and foreign currency swaps, floors, foreign
exchange contracts, caps and options are based upon quotations obtained from dealers or other reliable sources. See Note 3 for derivative fair valuedisclosures.
5. Employee Benefit Plans
Pension Benefit and Other Benefit PlansThe Company is both the sponsor and administrator of defined benefit pension plans covering all eligible employees and sales representatives of
Metropolitan Life and certain of its subsidiaries. Retirement benefits are based upon years of credited service and final average earnings history.The Company also provides certain postemployment benefits and certain postretirement health care and life insurance benefits for retired employees
through insurance contracts. Substantially all of the Company’s employees may, in accordance with the plans applicable to the postretirement benefits,become eligible for these benefits if they attain retirement age, with sufficient service, while working for the Company.
December 31,
Pension Benefits Other Benefits
2000 1999 2000 1999
(Dollars in millions)
Change in projected benefit obligation:Projected benefit obligation at beginning of year ********************************************* $3,737 $3,920 $1,483 $1,708
Service cost************************************************************************* 98 100 29 28Interest cost************************************************************************* 291 271 113 107Acquisitions ************************************************************************* 107 — 37Actuarial losses (gains) **************************************************************** 176 (260) 59 (281)Curtailments and terminations ********************************************************** (3) (22) 2 10Change in benefits ******************************************************************* (2) — (86) —Benefits paid ************************************************************************ (259) (272) (95) (89)
Projected benefit obligation at end of year ************************************************** 4,145 3,737 1,542 1,483
Change in plan assets:Contract value of plan assets at beginning of year ******************************************* 4,726 4,403 1,199 1,123
Actual return on plan assets *********************************************************** 54 575 179 141Acquisitions ************************************************************************* 79 — —Employer contribution ***************************************************************** 19 20 3 24Benefits paid ************************************************************************ (259) (272) (63) (89)
Contract value of plan assets at end of year************************************************ 4,619 4,726 1,318 1,199
Over (under) funded ********************************************************************** 474 989 (224) (284)Unrecognized net asset at transition********************************************************* (31) (66) — —Unrecognized net actuarial losses (gains)***************************************************** 2 (564) (478) (487)Unrecognized prior service cost ************************************************************ 109 127 (89) (2)
Prepaid (accrued) benefit cost************************************************************** $ 554 $ 486 $ (791) $ (773)
Qualified plan prepaid pension cost ********************************************************* $ 775 $ 632Non-qualified plan accrued pension cost ***************************************************** (263) (182)Unamortized prior service cost ************************************************************* 14 17Accumulated other comprehensive income *************************************************** 28 19
Prepaid benefit cost ********************************************************************** $ 554 $ 486
The aggregate projected benefit obligation and aggregate contract value of plan assets for the pension plans were as follows:
Non-QualifiedQualified Plan Plan Total
2000 1999 2000 1999 2000 1999
(Dollars in millions)
Aggregate projected benefit obligation ********************************************* $(3,775) $(3,482) $(370) $(255) $(4,145) $(3,737)Aggregate contract value of plan assets (principally Company contracts)***************** 4,619 4,726 — — 4,619 4,726
Over (under) funded ************************************************************ $ 844 $ 1,244 $(370) $(255) $ 474 $ 989
MetLife, Inc.F-20
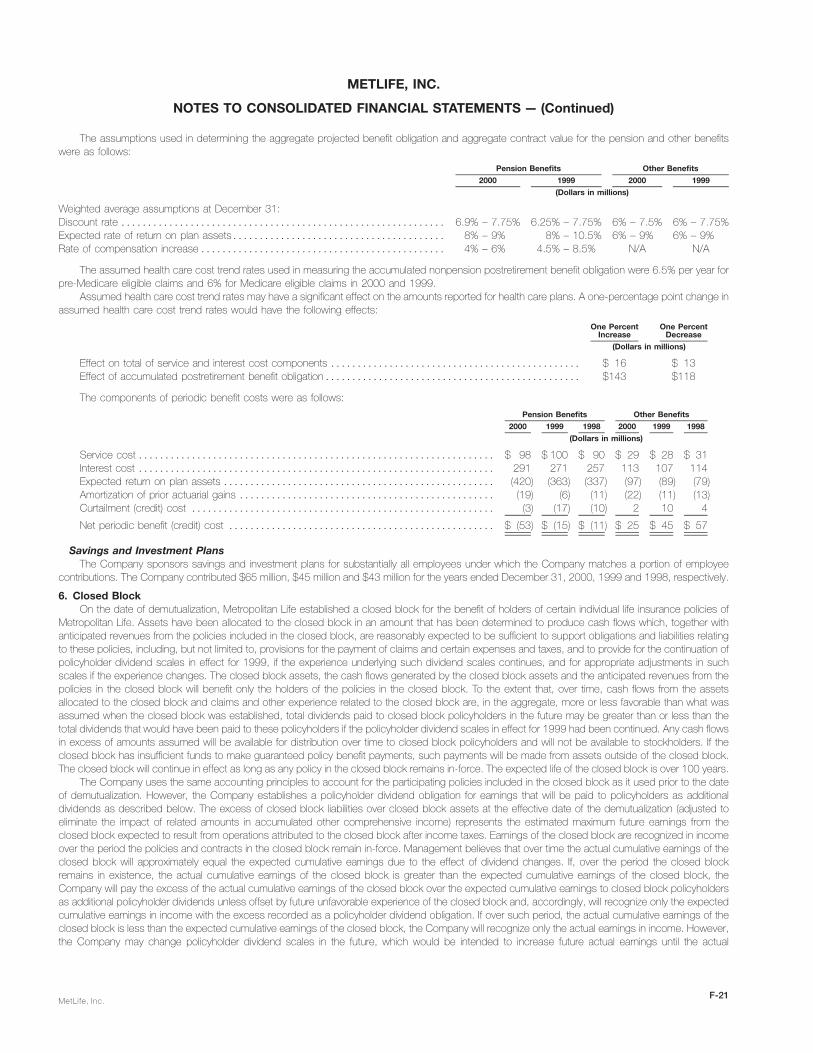
METLIFE, INC.
NOTES TO CONSOLIDATED FINANCIAL STATEMENTS — (Continued)
The assumptions used in determining the aggregate projected benefit obligation and aggregate contract value for the pension and other benefitswere as follows:
Pension Benefits Other Benefits
2000 1999 2000 1999
(Dollars in millions)
Weighted average assumptions at December 31:Discount rate ************************************************************* 6.9% – 7.75% 6.25% – 7.75% 6% – 7.5% 6% – 7.75%Expected rate of return on plan assets**************************************** 8% – 9% 8% – 10.5% 6% – 9% 6% – 9%Rate of compensation increase ********************************************** 4% – 6% 4.5% – 8.5% N/A N/A
The assumed health care cost trend rates used in measuring the accumulated nonpension postretirement benefit obligation were 6.5% per year forpre-Medicare eligible claims and 6% for Medicare eligible claims in 2000 and 1999.
Assumed health care cost trend rates may have a significant effect on the amounts reported for health care plans. A one-percentage point change inassumed health care cost trend rates would have the following effects:
One Percent One PercentIncrease Decrease
(Dollars in millions)
Effect on total of service and interest cost components *********************************************** $ 16 $ 13Effect of accumulated postretirement benefit obligation************************************************ $143 $118
The components of periodic benefit costs were as follows:
Pension Benefits Other Benefits
2000 1999 1998 2000 1999 1998
(Dollars in millions)
Service cost ******************************************************************* $ 98 $ 100 $ 90 $ 29 $ 28 $ 31Interest cost ******************************************************************* 291 271 257 113 107 114Expected return on plan assets *************************************************** (420) (363) (337) (97) (89) (79)Amortization of prior actuarial gains ************************************************ (19) (6) (11) (22) (11) (13)Curtailment (credit) cost ********************************************************* (3) (17) (10) 2 10 4
Net periodic benefit (credit) cost ************************************************** $ (53) $ (15) $ (11) $ 25 $ 45 $ 57
Savings and Investment PlansThe Company sponsors savings and investment plans for substantially all employees under which the Company matches a portion of employee
contributions. The Company contributed $65 million, $45 million and $43 million for the years ended December 31, 2000, 1999 and 1998, respectively.
6. Closed BlockOn the date of demutualization, Metropolitan Life established a closed block for the benefit of holders of certain individual life insurance policies of
Metropolitan Life. Assets have been allocated to the closed block in an amount that has been determined to produce cash flows which, together withanticipated revenues from the policies included in the closed block, are reasonably expected to be sufficient to support obligations and liabilities relatingto these policies, including, but not limited to, provisions for the payment of claims and certain expenses and taxes, and to provide for the continuation ofpolicyholder dividend scales in effect for 1999, if the experience underlying such dividend scales continues, and for appropriate adjustments in suchscales if the experience changes. The closed block assets, the cash flows generated by the closed block assets and the anticipated revenues from thepolicies in the closed block will benefit only the holders of the policies in the closed block. To the extent that, over time, cash flows from the assetsallocated to the closed block and claims and other experience related to the closed block are, in the aggregate, more or less favorable than what wasassumed when the closed block was established, total dividends paid to closed block policyholders in the future may be greater than or less than thetotal dividends that would have been paid to these policyholders if the policyholder dividend scales in effect for 1999 had been continued. Any cash flowsin excess of amounts assumed will be available for distribution over time to closed block policyholders and will not be available to stockholders. If theclosed block has insufficient funds to make guaranteed policy benefit payments, such payments will be made from assets outside of the closed block.The closed block will continue in effect as long as any policy in the closed block remains in-force. The expected life of the closed block is over 100 years.
The Company uses the same accounting principles to account for the participating policies included in the closed block as it used prior to the dateof demutualization. However, the Company establishes a policyholder dividend obligation for earnings that will be paid to policyholders as additionaldividends as described below. The excess of closed block liabilities over closed block assets at the effective date of the demutualization (adjusted toeliminate the impact of related amounts in accumulated other comprehensive income) represents the estimated maximum future earnings from theclosed block expected to result from operations attributed to the closed block after income taxes. Earnings of the closed block are recognized in incomeover the period the policies and contracts in the closed block remain in-force. Management believes that over time the actual cumulative earnings of theclosed block will approximately equal the expected cumulative earnings due to the effect of dividend changes. If, over the period the closed blockremains in existence, the actual cumulative earnings of the closed block is greater than the expected cumulative earnings of the closed block, theCompany will pay the excess of the actual cumulative earnings of the closed block over the expected cumulative earnings to closed block policyholdersas additional policyholder dividends unless offset by future unfavorable experience of the closed block and, accordingly, will recognize only the expectedcumulative earnings in income with the excess recorded as a policyholder dividend obligation. If over such period, the actual cumulative earnings of theclosed block is less than the expected cumulative earnings of the closed block, the Company will recognize only the actual earnings in income. However,the Company may change policyholder dividend scales in the future, which would be intended to increase future actual earnings until the actual
MetLife, Inc.F-21

METLIFE, INC.
NOTES TO CONSOLIDATED FINANCIAL STATEMENTS — (Continued)
cumulative earnings equal the expected cumulative earnings. Amounts reported at April 7, 2000 and for the period after demutualization are as of April 1,2000 and for the period beginning on April 1, 2000 (the effect of transaction from April 1, 2000 through April 6, 2000 are not considered material).
Closed block liabilities and assets designated to the closed block at December 31, 2000 and April 7, 2000 were as follows:
December 31, April 7,2000 2000
(Dollars in millions)
Closed Block LiabilitiesFuture policy benefits ******************************************************************** $39,415 $38,661Other policyholder funds****************************************************************** 278 321Policyholder dividends payable ************************************************************ 740 747Policyholder dividend obligation ************************************************************ 385 —Payable under securities loaned transactions************************************************* 3,268 1,856Other********************************************************************************** 37 330
Total closed block liabilities******************************************************** 44,123 41,915
Assets Designated to the Closed BlockInvestments:
Fixed maturities available-for-sale, at fair value (amortized cost: $25,660 and $24,725)************ 25,634 23,940Equity securities, at fair value (cost: $51) ************************************************** 54 —Mortgage loans on real estate *********************************************************** 5,801 4,744Policy loans ************************************************************************** 3,826 3,762Short-term investments***************************************************************** 223 168Other invested assets ****************************************************************** 248 325
Total investments **************************************************************** 35,786 32,939Cash and cash equivalents *************************************************************** 661 655Accrued investment income*************************************************************** 557 538Deferred income taxes ******************************************************************* 1,234 1,390Premiums and other receivables *********************************************************** 117 267
Total assets designated to the closed block ***************************************** 38,355 35,789
Excess of closed block liabilities over assets designated to the closed block ********************** 5,768 6,126
Amounts included in other comprehensive loss:Net unrealized investment loss, net of deferred income tax of $9 and $287********************* (14) (498)Allocated to policyholder dividend obligation, net of deferred income tax of $143 **************** (242) —
(256) (498)
Maximum future earnings to be recognized from closed block assets and liabilities ***************** $ 5,512 $ 5,628
Information regarding the policyholder dividend obligation is as follows:
(Dollars in millions)
Balance at April 7, 2000 ***************************************************************** $ —Change in policyholder dividend obligation ************************************************** 85Net investment losses ******************************************************************* (85)Net unrealized investment gains at December 31, 2000*************************************** 385
Balance at December 31, 2000*********************************************************** $ 385
MetLife, Inc.F-22

METLIFE, INC.
NOTES TO CONSOLIDATED FINANCIAL STATEMENTS — (Continued)
Closed block revenues and expenses were as follows:
April 7, 2000through
December 31, 2000
(Dollars in millions)
RevenuesPremiums ***************************************************************************** $2,900Net investment income ****************************************************************** 1,949Net investment losses (net of amounts allocable to the policyholder dividend obligation of $(85)) ***** (150)
Total revenues 4,699
ExpensesPolicyholder benefits and claims*********************************************************** 2,874Policyholder dividends ******************************************************************* 1,132Change in policyholder dividend obligation (includes amounts directly related to net investment losses
of $(85))***************************************************************************** 85Other expenses ************************************************************************ 425
Total expenses 4,516
Revenues net of expenses before income taxes ********************************************* 183Income taxes ************************************************************************** 67
Revenues net of expenses and income taxes *********************************************** $ 116
The change in maximum future earnings of the closed block was as follows:
(Dollars in millions)
April 7, 2000*************************************************************************** $5,628December 31, 2000 ******************************************************************** 5,512
Change during the period **************************************************************** $ (116)
Metropolitan Life charges the closed block with federal income taxes, state and local premium taxes, and other additive state or local taxes, as wellas investment management expenses relating to the closed block as provided in the plan of reorganization. Metropolitan Life also charges the closedblock for expenses of maintaining the policies included in the closed block.
7. Separate AccountsSeparate accounts reflect two categories of risk assumption: non-guaranteed separate accounts totaling $53,656 million and $47,618 million at
December 31, 2000 and 1999, respectively, for which the policyholder assumes the investment risk, and guaranteed separate accounts totaling$16,594 million and $17,323 million at December 31, 2000 and 1999, respectively, for which the Company contractually guarantees either a minimumreturn or account value to the policyholder.
Fees charged to the separate accounts by the Company (including mortality charges, policy administration fees and surrender charges) are reflectedin the Company’s revenues as universal life and investment-type product policy fees and totaled $667 million, $485 million and $413 million for the yearsended December 31, 2000, 1999 and 1998, respectively. Guaranteed separate accounts consisted primarily of Met Managed Guaranteed InterestContracts and participating close out contracts. The average interest rates credited on these contracts were 6.9% and 6.5% at December 31, 2000 and1999, respectively. The assets that support these liabilities were comprised of $15,708 million and $16,874 million in fixed maturities at December 31,2000 and 1999, respectively. The portfolios are segregated from other investments and are managed to minimize liquidity and interest rate risk. In orderto minimize the risk of disintermediation associated with early withdrawals, these investment products carry a graded surrender charge as well as amarket value adjustment.
8. DebtDebt consisted of the following:
December 31,
2000 1999
(Dollars in millions)
Surplus notes, interest rates ranging from 6.30% to 7.80%, maturity dates ranging from 2003 to 2025 ***** $1,650 $1,546Investment related exchangeable debt, interest rates ranging from 4.90% to 5.40%, due 2001 and 2002*** 271 369Fixed rate notes, interest rates ranging from 5.29% to 10.50%, maturity dates ranging from 2001 to 2009 ** 316 187Senior notes, interest rates ranging from 7.06% to 7.25%, maturity dates ranging from 2003 to 2007 ****** 98 270Capital lease obligations *********************************************************************** 42 44Other notes with varying interest rates *********************************************************** 49 98
Total long-term debt ************************************************************************** 2,426 2,514Total short-term debt************************************************************************** 1,094 4,208
Total ******************************************************************************* $3,520 $6,722
MetLife, Inc.F-23

METLIFE, INC.
NOTES TO CONSOLIDATED FINANCIAL STATEMENTS — (Continued)
Metropolitan Life and certain of its subsidiaries maintain committed and unsecured credit facilities aggregating $2,000 million (five-year facility of$1,000 million expiring in April 2003 and a 364-day facility of $1,000 million expiring in April of 2001). Both facilities bear interest at LIBOR plus 20 basispoints. The facilities can be used for general corporate purposes and also provide backup for the Company’s commercial paper program. AtDecember 31, 2000, there were no outstanding borrowings under either of the facilities.
Reinsurance Group of America, Incorporated (‘‘RGA’’), a subsidiary of the Company, maintains committed and unsecured credit facilities aggregat-ing $178 million (two three-year facilities of $140 million and $22 million expiring May 2003 and a three month $16 million revolving line of credit). Theinterest on borrowing is based on the terms of each specific borrowing. At December 31, 2000 there was $98 million outstanding under these facilities.Subsequent to December 31, 2000, RGA amended its revolving line of credit agreement into a $20 million facility.
Payments of interest and principal on the surplus notes, subordinated to all other indebtedness, may be made only with the prior approval of theinsurance department of the state of domicile. Subject to the prior approval of the Superintendent, the $300 million 7.45% surplus notes due 2023 maybe redeemed, in whole or in part, at the election of Metropolitan Life at any time on or after November 1, 2003.
Each issue of investment related debt is payable in cash or by delivery of an underlying security owned by the Company. The amount of the debtpayable at maturity is greater than the principal of the debt if the market value of the underlying security appreciates above certain levels at the date ofdebt repayment as compared to the market value of the underlying security at the date of debt issuance. At December 31, 2000, the underlyingsecurities pledged as collateral had a market value of $295 million.
The aggregate maturities of long-term debt for the Company are $172 million in 2001, $210 million in 2002, $500 million in 2003, $14 million in2004, $381 million in 2005 and $1,149 million thereafter.
Short-term debt of the Company consisted of commercial paper with a weighted average interest rate of 6.60% and 6.05% and a weighted averagematurity of 44 days and 74 days at December 31, 2000 and 1999, respectively.
Interest expense related to the Company’s indebtedness was $377 million, $384 million and $333 million for the years ended December 31, 2000,1999 and 1998, respectively.
9. Company-Obligated Mandatorily Redeemable Securities of Subsidiary TrustsOn April 7, 2000, MetLife Capital Trust I, a Delaware statutory business trust wholly owned by the Holding Company, issued 20,125,000 8.00%
equity security units (‘‘units’’). Each unit consists of (i) a purchase contract under which the holder agrees to purchase, for $50.00, shares of commonstock of the Holding Company on May 15, 2003 (52,771,250 shares at December 31, 2000 based on the average market price at December 31, 2000)and (ii) a capital security, with a stated liquidation amount of $50.00 and mandatorily redeemable on May 15, 2005. The number of shares to bepurchased at such date will be determined based on the average trading price of the Holding Company’s common stock. The proceeds from the sale ofthe units were used to acquire $1,006 million 8.00% debentures of the Holding Company (‘‘MetLife debentures’’). The capital securities representundivided beneficial ownership interests in MetLife Capital Trust I’s assets, which consist solely of the MetLife debentures. These securities are pledgedto collateralize the obligations of the unit holder under the related purchase contracts. Holders of the capital securities are entitled to receive cumulativecash distributions accruing from April 7, 2000 and payable quarterly in arrears commencing August 15, 2000 at an annual rate of 8.00%. The HoldingCompany irrevocably guarantees, on a senior and unsecured basis, the payment in full of distributions on the capital securities and the stated liquidationamount of the capital securities, in each case to the extent of available trust funds. Holders of the capital securities generally have no voting rights. Capitalsecurities outstanding at December 31, 2000 were $972 million, net of unamortized discount of $34 million.
The MetLife debentures bear interest at an annual rate of 8.00% of the principal amount, payable quarterly in arrears commencing August 15, 2000and mature on May 15, 2005. These debentures are unsecured. The Holding Company’s right to participate in the distribution of assets of any subsidiaryupon the subsidiary’s liquidation, reorganization or otherwise, is subject to the prior claims of creditors of the subsidiary, except to the extent the HoldingCompany may be recognized as a creditor of that subsidiary. Accordingly, the Holding Company’s obligations under the debentures are effectivelysubordinated to all existing and future liabilities of its subsidiaries.
In connection with the contribution to Metropolitan Life of the net proceeds from the initial public offering, the private placements and the unitsoffering, Metropolitan Life issued to the Holding Company a $1,006 million 8.00% mandatorily convertible note due 2005 having the same interest andpayment terms as set forth in the MetLife debentures issued to MetLife Capital Trust I. The principal amount of the capital note is mandatorily convertibleinto common stock of Metropolitan Life upon maturity or acceleration of the capital note and without any further action by the Holding Company orMetropolitan Life. In addition, the capital note provides that Metropolitan Life may not make any payment of principal or interest on the capital note so longas specified payment restrictions exist and have not been waived by the Superintendent. Payment restrictions would exist if Metropolitan Life fails toexceed certain thresholds relative to the level of its statutory risk-based capital or the amount of its outstanding capital notes, surplus notes or similarobligations. At December 31, 2000, Metropolitan Life’s statutory total adjusted capital exceeded these limitations.
In June 1997, GenAmerica Corporation (‘‘GenAmerica’’) issued $125 million of 8.525% capital securities through a wholly-owned subsidiary trust,GenAmerica Capital I. GenAmerica has fully and unconditionally guaranteed, on a subordinated basis, the obligation of the trust under the capitalsecurities and is obligated to mandatorily redeem the securities on June 30, 2027. GenAmerica may prepay the securities any time after June 30, 2007.Capital securities outstanding at December 31, 2000 were $118 million, net of unamortized discount of $7 million.
MetLife, Inc.F-24

METLIFE, INC.
NOTES TO CONSOLIDATED FINANCIAL STATEMENTS — (Continued)
10. Commitments and Contingencies
LitigationMetropolitan Life is currently a defendant in approximately 500 lawsuits raising allegations of improper marketing and sales of individual life insurance
policies or annuities. These lawsuits are generally referred to as ‘‘sales practices claims.’’On December 28, 1999, after a fairness hearing, the United States District Court for the Western District of Pennsylvania approved a class action
settlement resolving a multidistrict litigation proceeding involving alleged sales practices claims. No appeal was taken, and the settlement is final. Thesettlement class includes most of the owners of permanent life insurance policies and annuity contracts or certificates issued pursuant to individual salesin the United States by Metropolitan Life, Metropolitan Insurance and Annuity Company or Metropolitan Tower Life Insurance Company betweenJanuary 1, 1982 and December 31, 1997. The class includes owners of approximately six million in-force or terminated insurance policies andapproximately one million in-force or terminated annuity contracts or certificates.
In addition to dismissing the consolidated class actions, the District Court’s order also bars sales practices claims by class members with respect topolicies or annuities issued by the defendant insurers during the class period, effectively resolving all pending sales practices class actions against theseinsurers in the United States.
Under the terms of the order, only those class members who excluded themselves from the settlement may continue an existing, or start a new,sales practices lawsuit against Metropolitan Life, Metropolitan Insurance and Annuity Company or Metropolitan Tower Life Insurance Company for policiesor annuities issued during the class period. Approximately 20,000 class members elected to exclude themselves from the settlement. At December 31,2000, approximately 300 of these ‘‘opt-outs’’ have filed new individual lawsuits.
The settlement provides three forms of relief. General relief, in the form of free death benefits, is provided automatically to class members who didnot exclude themselves from the settlement or who did not elect the claim evaluation procedures set forth in the settlement. The claim evaluationprocedures permit a class member to have a claim evaluated by a third party under procedures set forth in the settlement. Claim awards made under theclaim evaluation procedures will be in the form of policy adjustments, free death benefits or, in some instances, cash payments. In addition, classmembers who have or had an ownership interest in specified policies will also automatically receive deferred acquisition cost tax relief in the form of freedeath benefits. The settlement fixes the aggregate amounts that are available under each form of relief. Implementation of the class action settlement isproceeding.
Metropolitan Life expects that the total cost of the settlement will be approximately $957 million. This amount is equal to the amount of the increasein liabilities for the death benefits and policy adjustments and the present value of expected cash payments to be provided to included class members,as well as attorneys’ fees and expenses and estimated other administrative costs, but does not include the cost of litigation with policyholders who areexcluded from the settlement. The Company believes that the cost of the settlement will be substantially covered by available reinsurance and theprovisions made in the consolidated financial statements, and thus will not have a material adverse effect on its business, results of operations or financialposition. Metropolitan Life made some recoveries in 2000 under those reinsurance agreements and, although there is no assurance that otherreinsurance claim submissions will be paid, Metropolitan Life believes payment is likely to occur. The Company believes it has made adequate provisionin the consolidated financial statements for all probable losses for sales practices claims, including litigation costs involving policyholders who areexcluded from the settlement as well as for the two class action settlements described in the two paragraphs immediately following the next paragraph.
The Metropolitan Life class action settlement did not resolve two putative class actions involving sales practices claims filed against Metropolitan Lifein Canada. A certified class action with conditionally certified subclasses is pending in the United States District Court for the Southern District of NewYork against Metropolitan Life, Metropolitan Insurance and Annuity Company, Metropolitan Tower Life Insurance Company and various individualdefendants alleging improper sales abroad; settlement discussions are continuing.
Separate from the Metropolitan Life class action settlement, similar sales practices class action litigation against New England Mutual Life InsuranceCompany (‘‘New England Mutual’’), with which Metropolitan Life merged in 1996, and General American, which was acquired in 2000, has been settled.The New England Mutual case, a consolidated multidistrict litigation in the United States District Court for the District of Massachusetts, involvesapproximately 600,000 life insurance policies sold during the period January 1, 1983 through August 31, 1996. The settlement of this case wasapproved by the District Court in October 2000 and is not being appealed. Implementation of the class action settlement is proceeding. The Companyexpects that the total cost of this settlement will be approximately $150 million. Approximately 2,400 class members opted-out of the settlement. As ofDecember 31, 2000, New England Mutual was a defendant in approximately 30 opt-out lawsuits involving sales practices claims.
The settlement of the consolidated multidistrict sales practices class action case against General American was approved by the United StatesDistrict Court for the Eastern District of Missouri. The General American case involves approximately 250,000 life insurance policies sold during the periodJanuary 1, 1982 through December 31, 1996. One appeal has been filed. The Company expects that the approximate cost of the settlement will be $55million, not including legal fees and costs for plaintiffs’ counsel. The District Court has scheduled a hearing in March 2001 with respect to plaintiffs’ classcounsels’ request for such fees and costs. Approximately 700 class members have elected to exclude themselves from the General Americansettlement. As of December 31, 2000, General American was a defendant in approximately ten opt-out lawsuits involving sales practices claims.
In the past, some individual sales practices claims have been resolved through settlement, have been won by dispositive motions, or, in a fewinstances, have gone to trial. Most of the current cases seek substantial damages, including in some cases punitive and treble damages and attorneys’fees. Additional litigation relating to the Company’s marketing and sales of individual life insurance may be commenced in the future.
Regulatory authorities in a small number of states have had investigations or inquiries relating to Metropolitan Life’s, New England Mutual’s or GeneralAmerican’s sales of individual life insurance policies or annuities. Over the past several years, these and a number of investigations by other regulatoryauthorities were resolved for monetary payments and certain other relief. The Company may continue to resolve investigations in a similar manner.
Metropolitan Life is also a defendant in numerous lawsuits seeking compensatory and punitive damages for personal injuries allegedly caused byexposure to asbestos or asbestos-containing products. Metropolitan Life has never engaged in the business of manufacturing, producing, distributing orselling asbestos or asbestos-containing products. Rather, these lawsuits, currently numbering in the thousands, have principally been based uponallegations relating to certain research, publication and other activities of one or more of Metropolitan Life’s employees during the period from the 1920’sthrough approximately the 1950’s and alleging that Metropolitan Life learned or should have learned of certain health risks posed by asbestos and,among other things, improperly publicized or failed to disclose those health risks. Legal theories asserted against Metropolitan Life have included
MetLife, Inc.F-25

METLIFE, INC.
NOTES TO CONSOLIDATED FINANCIAL STATEMENTS — (Continued)
negligence, intentional tort claims and conspiracy claims concerning the health risks associated with asbestos. While Metropolitan Life believes it hasmeritorious defenses to these claims, and has not suffered any adverse judgments in respect of these claims, most of the cases have been resolved bysettlements. Metropolitan Life intends to continue to exercise its best judgment regarding settlement or defense of such cases, including when trials ofthese cases are appropriate. The number of such cases that may be brought or the aggregate amount of any liability that Metropolitan Life may ultimatelyincur is uncertain.
Significant portions of amounts paid in settlement of such cases have been funded with proceeds from a previously-resolved dispute withMetropolitan Life’s primary, umbrella and first level excess liability insurance carriers. Metropolitan Life was involved in litigation with several of its excessliability insurers regarding amounts payable under its policies with respect to coverage for these claims. The trial court granted summary judgment tothese insurers and Metropolitan Life appealed. The Connecticut Supreme Court in 2001 affirmed the decision of the trial court. The Company believesthat Metropolitan Life’s asbestos-related litigation with these insurers should have no effect on its recoveries under excess insurance policies that wereobtained in 1998 for asbestos-related claims.
The Company has recorded, in other expenses, charges of $15 million ($10 million after-tax), $499 million ($317 million after-tax), and $1,895 million($1,203 million after-tax) for the years ended December 31, 2000, 1999, and 1998, respectively, for sales practices claims and claims for personalinjuries caused by exposure to asbestos or asbestos-containing products. The 2000 charge was principally related to sales practices claims. The 1999charge was principally related to the settlement of the multidistrict litigation proceeding involving alleged improper sales practices, accruals for salespractices claims not covered by the settlement and other legal costs. The 1998 charge was comprised of $925 million and $970 million for salespractices claims and asbestos-related claims, respectively. The Company recorded the charges for sales practices claims in 1998 based on preliminarysettlement discussions and the settlement history of other insurers.
Prior to the fourth quarter of 1998, Metropolitan Life established a liability for asbestos-related claims based on settlement costs for claims thatMetropolitan Life had settled, estimates of settlement costs for claims pending against Metropolitan Life and an estimate of settlement costs forunasserted claims. The amount for unasserted claims was based on management’s estimate of unasserted claims that would be probable of assertion. Aliability is not established for claims which management believes are only reasonably possible of assertion. Based on this process, the accrual forasbestos-related claims at December 31, 1997 was $386 million. Potential liabilities for asbestos-related claims are not easily quantified, due to thenature of the allegations against Metropolitan Life, which are not related to the business of manufacturing, producing, distributing or selling asbestos orasbestos-containing products, adding to the uncertainty as to the number of claims that may be brought against Metropolitan Life.
During 1998, Metropolitan Life decided to pursue the purchase of excess insurance to limit its exposure to asbestos-related claims. In connectionwith the negotiations with the casualty insurers to obtain this insurance, Metropolitan Life obtained information that caused management to reassess theaccruals for asbestos-related claims. This information included:
) Information from the insurers regarding the asbestos-related claims experience of other insureds, which indicated that the number of claims thatwere probable of assertion against Metropolitan Life in the future was significantly greater than it had assumed in its accruals. The number ofclaims brought against Metropolitan Life is generally a reflection of the number of asbestos-related claims brought against asbestos defendantsgenerally and the percentage of those claims in which Metropolitan Life is included as a defendant. The information provided to Metropolitan Liferelating to other insureds indicated that Metropolitan Life had been included as a defendant for a significant percentage of total asbestos-relatedclaims and that it may be included in a larger percentage of claims in the future, because of greater awareness of asbestos litigation generally bypotential plaintiffs and plaintiffs’ lawyers and because of the bankruptcy and reorganization or the exhaustion of insurance coverage of otherasbestos defendants; and that, although volatile, there was an upward trend in the number of total claims brought against asbestos defendants.
) Information derived from actuarial calculations Metropolitan Life made in the fourth quarter of 1998 in connection with these negotiations, whichhelped to frame, define and quantify this liability. These calculations were made using, among other things, current information regardingMetropolitan Life’s claims and settlement experience (which reflected Metropolitan Life’s decision to resolve an increased number of these claimsby settlement), recent and historic claims and settlement experience of selected other companies and information obtained from the insurers.
Based on this information, Metropolitan Life concluded that certain claims that previously were considered as only reasonably possible of assertionwere probable of assertion, increasing the number of assumed claims to approximately three times the number assumed in prior periods. As a result ofthis reassessment, Metropolitan Life increased its liability for asbestos-related claims to $1,278 million at December 31, 1998.
During 1998, Metropolitan Life paid $1,407 million of premiums for excess of loss reinsurance agreements and excess insurance policies,consisting of $529 million for the excess of loss reinsurance agreements for sales practices claims and excess mortality losses and $878 million for theexcess insurance policies for asbestos-related claims.
Metropolitan Life obtained the excess of loss reinsurance agreements to provide reinsurance with respect to sales practices claims made on or priorto December 31, 1999 and for certain mortality losses in 1999. These reinsurance agreements have a maximum aggregate limit of $650 million, with amaximum sublimit of $550 million for losses for sales practices claims. This coverage is in excess of an aggregate self-insured retention of $385 millionwith respect to sales practices claims and $506 million, plus Metropolitan Life’s statutory policy reserves released upon the death of insureds, withrespect to life mortality losses. At December 31, 1999, the subject losses under the reinsurance agreements due to sales practices claims and relatedcounsel fees from the time Metropolitan Life entered into the reinsurance agreements did not exceed that self-insured retention. No recoveries weremade with respect to the coverage for excess mortality losses for 1999. As noted above, recoveries have been made in 2000 under the reinsuranceagreements for the sales practices claims. The maximum sublimit of $550 million for sales practices claims was within a range of losses thatmanagement believed were reasonably possible at December 31, 1998. Each excess of loss reinsurance agreement for sales practices claims andmortality losses contains an experience fund, which provides for payments to Metropolitan Life at the commutation date if experience is favorable at suchdate. The Company accounts for the aggregate excess of loss reinsurance agreements as reinsurance; however, if deposit accounting were applied, theeffect on the Company’s consolidated financial statements in 1998, 1999 and 2000 would not be significant.
Under reinsurance accounting, the excess of the liability recorded for sales practices losses recoverable under the agreements of $550 million overthe premium paid of $529 million resulted in a deferred gain of $21 million which was amortized into income over the settlement period fromJanuary 1999 through April 2000. Under deposit accounting, the premium would be recorded as an other asset rather than as an expense, and thereinsurance loss recoverable and the deferred gain would not have been recorded. Because the agreements also contain an experience fund which
MetLife, Inc.F-26

METLIFE, INC.
NOTES TO CONSOLIDATED FINANCIAL STATEMENTS — (Continued)
increases with the passage of time, the increase in the experience fund in 1999 and 2000 under deposit accounting would be recognized as interestincome in an amount approximately equal to the deferred gain that was amortized into income under reinsurance accounting.
The excess insurance policies for asbestos-related claims provide for recovery of losses up to $1,500 million, which is in excess of a $400 millionself-insured retention ($878 million of which was recorded as a recoverable at December 31, 2000, 1999 and 1998). The asbestos-related policies arealso subject to annual and per-claim sublimits. Amounts are recoverable under the policies annually with respect to claims paid during the prior calendaryear. Although amounts paid in any given year that are recoverable under the policies will be reflected as a reduction in the Company’s operating cashflows for that year, management believes that the payments will not have a material adverse effect on the Company’s liquidity. Each asbestos-relatedpolicy contains an experience fund and a reference fund that provides for payments to the Company at the commutation date if experience under thepolicy to such date has been favorable, or pro rata reductions from time to time in the loss reimbursements to the Company if the cumulative return on thereference fund is less than the return specified in the experience fund.
The Company believes adequate provision has been made in its consolidated financial statements for all reasonably probable and estimable lossesfor sales practices and asbestos-related claims. With respect to Metropolitan Life’s asbestos litigation, estimates can be uncertain due to the limitations ofavailable data and the difficulty of predicting with any certainty numerous variables that can affect liability estimates, including the number of future claims,the cost to settle claims and the impact of any possible future adverse verdicts and their amounts. Recent bankruptcies of other companies involved inasbestos litigation may result in an increase in the number of claims and the cost of resolving claims, as well as the number of trials and possible verdictsMetropolitan Life may experience. Plaintiffs are seeking additional funds from defendants, including Metropolitan Life, in light of recent bankruptcy filingsby certain other defendants. Accordingly, it is reasonably possible that the Company’s total exposure to asbestos claims may be greater than the liabilityrecorded by the Company in its consolidated financial statements. Metropolitan Life will continue to study the variables in light of additional information,including legislative and judicial developments, gained over time in order to identify trends that may become evident and to assess their impact on thepreviously established liability; future charges to income may be necessary. While the potential future charges could be material in particular quarterly orannual periods in which they are recorded, based on information currently known by management, it does not believe any such charges are likely to havea material adverse effect on the Company’s consolidated financial position.
A purported class action suit involving policyholders in four states has been filed in a Rhode Island state court against a Metropolitan Life subsidiary,Metropolitan Property and Casualty Insurance Company, with respect to claims by policyholders for the alleged diminished value of automobiles afteraccident-related repairs. The trial court recently denied a motion by Metropolitan Property and Casualty Insurance Company for summary judgment, anddiscovery has commenced. A class certification motion has been denied. Similar ‘‘diminished value’’ purported class action suits have been filed in Texasand Tennessee against Metropolitan Property and Casualty Insurance Company. A purported class action has been filed against Metropolitan Propertyand Casualty Insurance Company’s subsidiary, Metropolitan Casualty Insurance Company, in Florida by a policyholder alleging breach of contract andunfair trade practices with respect to allowing the use of parts not made by the original manufacturer to repair damaged automobiles. A motion for classcertification is pending. In addition, a plaintiff in Louisiana state court recently amended an individual lawsuit to state a putative class action on behalf ofLouisiana insureds challenging the method that Metropolitan Property and Casualty Insurance Company uses to determine the value of a motor vehiclethat has sustained a total loss. A class certification motion is pending. These suits are in the early stages of litigation and Metropolitan Property andCasualty Insurance Company and Metropolitan Casualty Insurance Company intend to defend themselves vigorously against these suits. Similar suitshave been filed against many other personal lines property and casualty insurers.
The United States, the Commonwealth of Puerto Rico and various hotels and individuals have sued MetLife Capital Corporation, a former subsidiaryof the Company, seeking damages for clean up costs, natural resource damages, personal injuries and lost profits and taxes based upon, among otherthings, a release of oil from a barge which was being towed by the M/V Emily S. In connection with the sale of MetLife Capital, the Company acquiredMetLife Capital’s potential liability with respect to the M/V Emily S lawsuits. MetLife Capital had entered into a sale and leaseback financing arrangementwith respect to the M/V Emily S. The plaintiffs have taken the position that MetLife Capital, as the owner of record of the M/V Emily S, is responsible for alldamages caused by the barge, including the oil spill. The claims of the governments of the United States and Puerto Rico were settled in 2000 withinamounts previously accrued by the Company.
Metropolitan Life has completed a tender offer to purchase the shares of Conning Corporation that it had not already owned. After Metropolitan Lifehad announced its intention to make a tender offer, three putative class actions were filed by Conning shareholders alleging that the prospective offer wasinadequate and constituted a breach of fiduciary duty. The parties to the litigation have reached an agreement providing for a settlement of the actions; amotion seeking court approval for the settlement will be filed with the New York State Supreme Court in New York County after a final agreement issigned.
Several lawsuits were brought in 2000 challenging the fairness of Metropolitan Life’s plan of reorganization and the adequacy and accuracy ofMetropolitan Life’s disclosure to policyholders regarding the plan. These actions name as defendants some or all of Metropolitan Life, the HoldingCompany, the individual directors, the New York Superintendent of Insurance and the underwriters for MetLife, Inc.’s initial public offering, GoldmanSachs & Company and Credit Suisse First Boston. Five purported class actions pending in the Supreme Court of the State of New York for New YorkCounty have been consolidated within the commercial part. In addition, there remains a separate purported class action in New York state court in NewYork County and another in Kings County. The plaintiffs in the state court class actions seek injunctive, declaratory and compensatory relief, as well as anaccounting. Some of the plaintiffs in the above described actions have also brought a proceeding under Article 78 of New York’s Civil Practice Law andRules challenging the Opinion and Decision of the New York Superintendent of Insurance that approved the plan. In this proceeding, petitioners seek tovacate the Superintendent’s Opinion and Decision and enjoin him from granting final approval of the plan. Another purported class action is pending in theSupreme Court of the State of New York for New York County and has been brought on behalf of a purported class of beneficiaries of Metropolitan Lifeannuities purchased to fund structured settlements claiming that the class members should have received common stock or cash in connection with thedemutualization. Three purported class actions were filed in the United States District Court for the Eastern District of New York claiming violation of theSecurities Act of 1933. The plaintiffs in these actions, which have been consolidated, claim that the Policyholder Information Booklets relating to the planfailed to disclose certain material facts and seek rescission and compensatory damages. A purported class action was filed in the United States DistrictCourt for the Southern District of New York seeking damages from Metropolitan Life and the Holding Company for alleged violations of various provisionsof the Constitution of the United States in connection with the plan of reorganization. Metropolitan Life, the Holding Company and the individual
MetLife, Inc.F-27
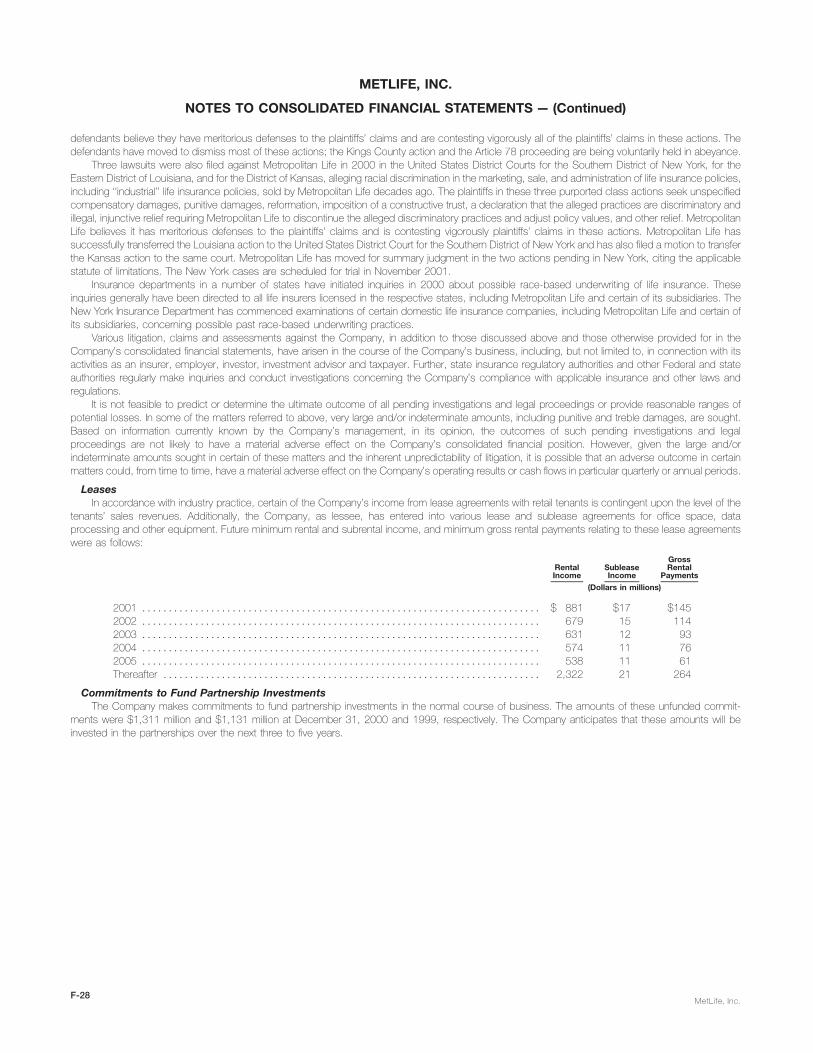
METLIFE, INC.
NOTES TO CONSOLIDATED FINANCIAL STATEMENTS — (Continued)
defendants believe they have meritorious defenses to the plaintiffs’ claims and are contesting vigorously all of the plaintiffs’ claims in these actions. Thedefendants have moved to dismiss most of these actions; the Kings County action and the Article 78 proceeding are being voluntarily held in abeyance.
Three lawsuits were also filed against Metropolitan Life in 2000 in the United States District Courts for the Southern District of New York, for theEastern District of Louisiana, and for the District of Kansas, alleging racial discrimination in the marketing, sale, and administration of life insurance policies,including ‘‘industrial’’ life insurance policies, sold by Metropolitan Life decades ago. The plaintiffs in these three purported class actions seek unspecifiedcompensatory damages, punitive damages, reformation, imposition of a constructive trust, a declaration that the alleged practices are discriminatory andillegal, injunctive relief requiring Metropolitan Life to discontinue the alleged discriminatory practices and adjust policy values, and other relief. MetropolitanLife believes it has meritorious defenses to the plaintiffs’ claims and is contesting vigorously plaintiffs’ claims in these actions. Metropolitan Life hassuccessfully transferred the Louisiana action to the United States District Court for the Southern District of New York and has also filed a motion to transferthe Kansas action to the same court. Metropolitan Life has moved for summary judgment in the two actions pending in New York, citing the applicablestatute of limitations. The New York cases are scheduled for trial in November 2001.
Insurance departments in a number of states have initiated inquiries in 2000 about possible race-based underwriting of life insurance. Theseinquiries generally have been directed to all life insurers licensed in the respective states, including Metropolitan Life and certain of its subsidiaries. TheNew York Insurance Department has commenced examinations of certain domestic life insurance companies, including Metropolitan Life and certain ofits subsidiaries, concerning possible past race-based underwriting practices.
Various litigation, claims and assessments against the Company, in addition to those discussed above and those otherwise provided for in theCompany’s consolidated financial statements, have arisen in the course of the Company’s business, including, but not limited to, in connection with itsactivities as an insurer, employer, investor, investment advisor and taxpayer. Further, state insurance regulatory authorities and other Federal and stateauthorities regularly make inquiries and conduct investigations concerning the Company’s compliance with applicable insurance and other laws andregulations.
It is not feasible to predict or determine the ultimate outcome of all pending investigations and legal proceedings or provide reasonable ranges ofpotential losses. In some of the matters referred to above, very large and/or indeterminate amounts, including punitive and treble damages, are sought.Based on information currently known by the Company’s management, in its opinion, the outcomes of such pending investigations and legalproceedings are not likely to have a material adverse effect on the Company’s consolidated financial position. However, given the large and/orindeterminate amounts sought in certain of these matters and the inherent unpredictability of litigation, it is possible that an adverse outcome in certainmatters could, from time to time, have a material adverse effect on the Company’s operating results or cash flows in particular quarterly or annual periods.
LeasesIn accordance with industry practice, certain of the Company’s income from lease agreements with retail tenants is contingent upon the level of the
tenants’ sales revenues. Additionally, the Company, as lessee, has entered into various lease and sublease agreements for office space, dataprocessing and other equipment. Future minimum rental and subrental income, and minimum gross rental payments relating to these lease agreementswere as follows:
GrossRental Sublease RentalIncome Income Payments
(Dollars in millions)
2001 *************************************************************************** $ 881 $17 $1452002 *************************************************************************** 679 15 1142003 *************************************************************************** 631 12 932004 *************************************************************************** 574 11 762005 *************************************************************************** 538 11 61Thereafter *********************************************************************** 2,322 21 264
Commitments to Fund Partnership InvestmentsThe Company makes commitments to fund partnership investments in the normal course of business. The amounts of these unfunded commit-
ments were $1,311 million and $1,131 million at December 31, 2000 and 1999, respectively. The Company anticipates that these amounts will beinvested in the partnerships over the next three to five years.
MetLife, Inc.F-28

METLIFE, INC.
NOTES TO CONSOLIDATED FINANCIAL STATEMENTS — (Continued)
11. Acquisitions and Dispositions
AcquisitionsOn January 6, 2000, Metropolitan Life completed its acquisition of GenAmerica for $1.2 billion. As part of the GenAmerica acquisition, General
American Life Insurance Company paid Metropolitan Life a fee of $120 million in connection with the assumption of certain funding agreements. The feehas been considered as part of the purchase price of GenAmerica. GenAmerica is a holding company which includes General American Life InsuranceCompany, approximately 49% of the outstanding shares of RGA common stock, a provider of reinsurance, and 61.0% of the outstanding shares ofConning Corporation (‘‘Conning’’) common stock, an asset manager. Metropolitan Life owned 10% of the outstanding shares of RGA common stockprior to the completion of the GenAmerica acquisition. At December 31, 2000 Metropolitan Life’s ownership percentage of the outstanding shares ofRGA common stock was approximately 59%.
In April 2000, Metropolitan Life acquired the outstanding shares of Conning common stock not already owned by Metropolitan Life for $73 million.The Company’s total revenues and net income for the year ended December 31, 1999 on both a historical and pro forma basis as if the acquisition
of GenAmerica had occurred on January 1, 1999 were as follows:
Total NetRevenues Income
(Dollars in millions)
Historical *********************************************************************************** $25,421 $617Pro forma (unaudited) ************************************************************************* $29,278 $403
The pro forma results include adjustments to give effect to the amortization of discounts on fixed maturities, goodwill and value of business acquired,adjustments to liabilities for future policy benefits, and certain other adjustments, together with related income tax effects. The pro forma information is notnecessarily indicative of the results that would have occurred had the purchase been made on January 1, 1999 or the future results of the combinedoperations.
DispositionsDuring 2000, the Company completed the sale of its 48% ownership interest in its affiliates, Nvest, L.P. and Nvest Companies L.P. This transaction
resulted in an investment gain of $663 million.During 1998, the Company sold MetLife Capital Holdings, Inc. (a commercial financing company) and a substantial portion of its Canadian and
Mexican insurance operations, which resulted in an investment gain of $531 million.
12. Income TaxesThe provision for income taxes was as follows:
Years ended December 31,
2000 1999 1998
(Dollars in millions)
Current:Federal************************************************************************************ $(153) $608 $666State and local ***************************************************************************** 34 24 60Foreign************************************************************************************ 5 4 99
(114) 636 825
Deferred:Federal************************************************************************************ 563 (78) (25)State and local ***************************************************************************** 8 2 (8)Foreign************************************************************************************ 6 (2) (54)
577 (78) (87)
Provision for income taxes********************************************************************** $ 463 $558 $738
Reconciliations of the income tax provision at the U.S. statutory rate to the provision for income taxes as reported were as follows:
Years ended December 31,
2000 1999 1998
(Dollars in millions)
Tax provision at U.S. statutory rate*************************************************************** $ 496 $411 $728Tax effect of:
Tax exempt investment income**************************************************************** (52) (39) (40)Surplus tax ******************************************************************************** (145) 125 18State and local income taxes ***************************************************************** 30 18 31Prior year taxes***************************************************************************** (37) (31) 4Demutualization costs *********************************************************************** 21 56 —Payments to former Canadian policyholders ***************************************************** 114 — —Sales of businesses************************************************************************* 31 — (19)Other, net ********************************************************************************* 5 18 16
Provision for income taxes********************************************************************** $ 463 $558 $738
MetLife, Inc.F-29
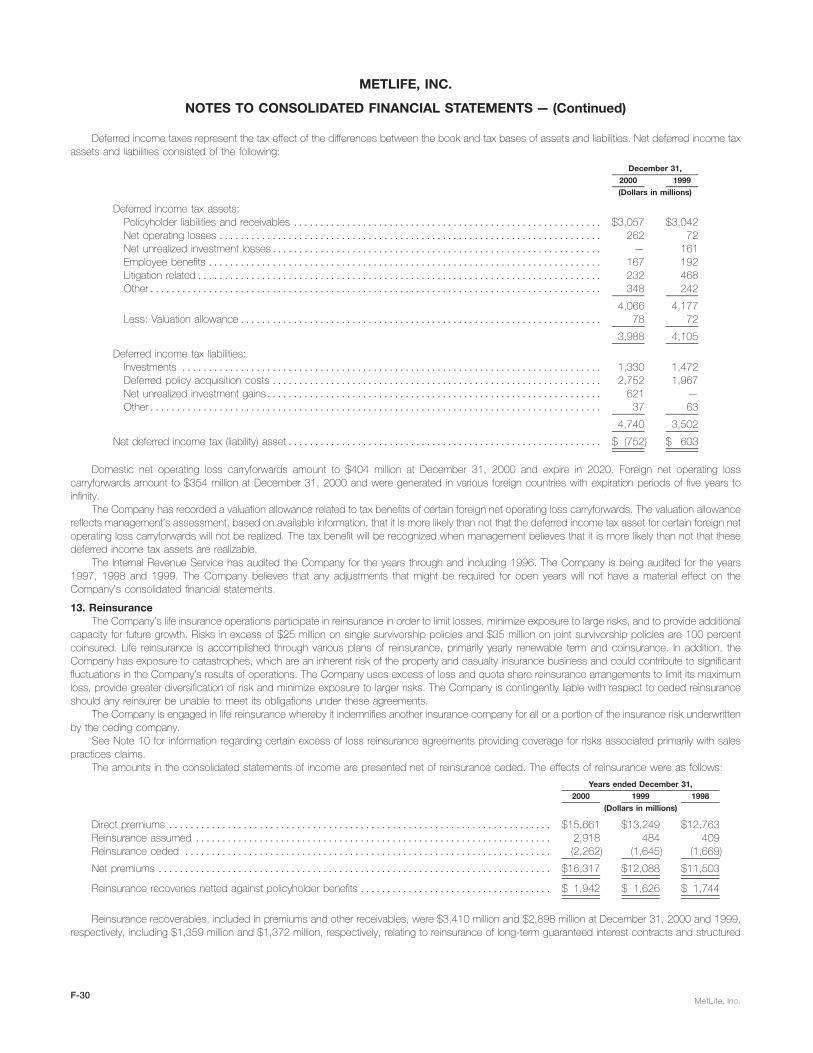
METLIFE, INC.
NOTES TO CONSOLIDATED FINANCIAL STATEMENTS — (Continued)
Deferred income taxes represent the tax effect of the differences between the book and tax bases of assets and liabilities. Net deferred income taxassets and liabilities consisted of the following:
December 31,
2000 1999
(Dollars in millions)
Deferred income tax assets:Policyholder liabilities and receivables ********************************************************** $3,057 $3,042Net operating losses ************************************************************************ 262 72Net unrealized investment losses************************************************************** — 161Employee benefits ************************************************************************** 167 192Litigation related**************************************************************************** 232 468Other************************************************************************************* 348 242
4,066 4,177Less: Valuation allowance******************************************************************** 78 72
3,988 4,105
Deferred income tax liabilities:Investments ******************************************************************************* 1,330 1,472Deferred policy acquisition costs ************************************************************** 2,752 1,967Net unrealized investment gains*************************************************************** 621 —Other************************************************************************************* 37 63
4,740 3,502
Net deferred income tax (liability) asset*********************************************************** $ (752) $ 603
Domestic net operating loss carryforwards amount to $404 million at December 31, 2000 and expire in 2020. Foreign net operating losscarryforwards amount to $354 million at December 31, 2000 and were generated in various foreign countries with expiration periods of five years toinfinity.
The Company has recorded a valuation allowance related to tax benefits of certain foreign net operating loss carryforwards. The valuation allowancereflects management’s assessment, based on available information, that it is more likely than not that the deferred income tax asset for certain foreign netoperating loss carryforwards will not be realized. The tax benefit will be recognized when management believes that it is more likely than not that thesedeferred income tax assets are realizable.
The Internal Revenue Service has audited the Company for the years through and including 1996. The Company is being audited for the years1997, 1998 and 1999. The Company believes that any adjustments that might be required for open years will not have a material effect on theCompany’s consolidated financial statements.
13. ReinsuranceThe Company’s life insurance operations participate in reinsurance in order to limit losses, minimize exposure to large risks, and to provide additional
capacity for future growth. Risks in excess of $25 million on single survivorship policies and $35 million on joint survivorship policies are 100 percentcoinsured. Life reinsurance is accomplished through various plans of reinsurance, primarily yearly renewable term and coinsurance. In addition, theCompany has exposure to catastrophes, which are an inherent risk of the property and casualty insurance business and could contribute to significantfluctuations in the Company’s results of operations. The Company uses excess of loss and quota share reinsurance arrangements to limit its maximumloss, provide greater diversification of risk and minimize exposure to larger risks. The Company is contingently liable with respect to ceded reinsuranceshould any reinsurer be unable to meet its obligations under these agreements.
The Company is engaged in life reinsurance whereby it indemnifies another insurance company for all or a portion of the insurance risk underwrittenby the ceding company.
See Note 10 for information regarding certain excess of loss reinsurance agreements providing coverage for risks associated primarily with salespractices claims.
The amounts in the consolidated statements of income are presented net of reinsurance ceded. The effects of reinsurance were as follows:
Years ended December 31,
2000 1999 1998
(Dollars in millions)
Direct premiums ************************************************************************ $15,661 $13,249 $12,763Reinsurance assumed ******************************************************************* 2,918 484 409Reinsurance ceded ********************************************************************* (2,262) (1,645) (1,669)
Net premiums ************************************************************************** $16,317 $12,088 $11,503
Reinsurance recoveries netted against policyholder benefits ************************************ $ 1,942 $ 1,626 $ 1,744
Reinsurance recoverables, included in premiums and other receivables, were $3,410 million and $2,898 million at December 31, 2000 and 1999,respectively, including $1,359 million and $1,372 million, respectively, relating to reinsurance of long-term guaranteed interest contracts and structured
MetLife, Inc.F-30
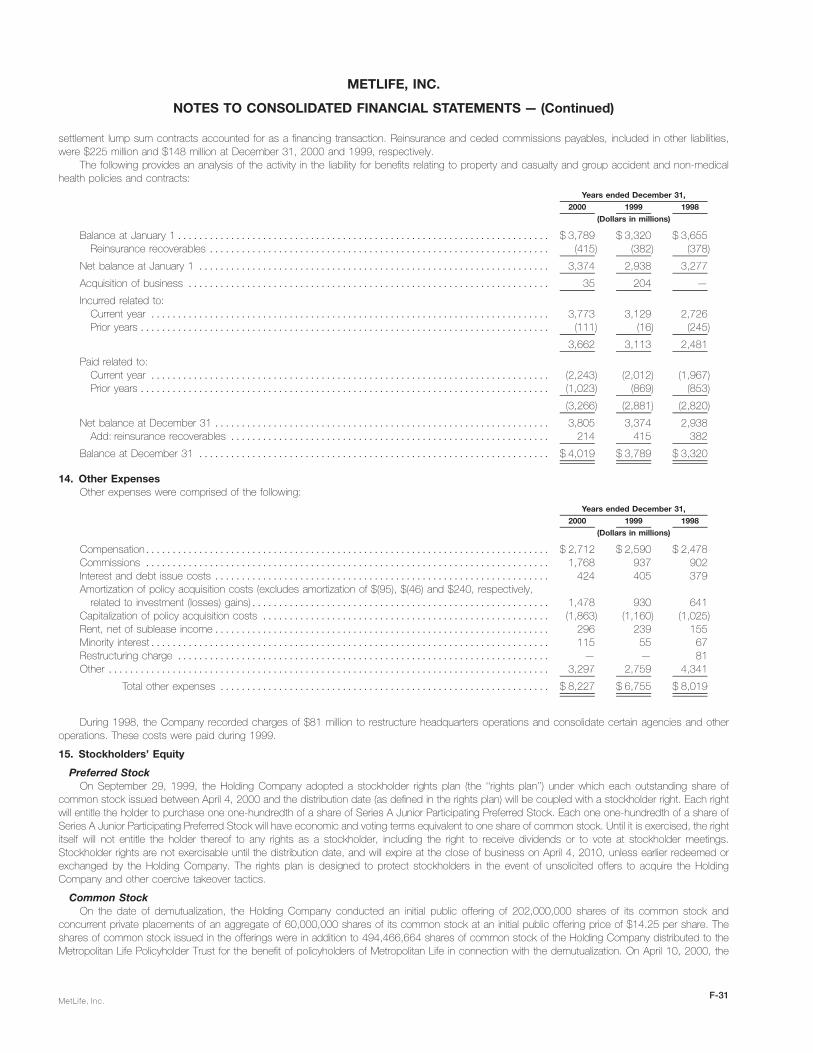
METLIFE, INC.
NOTES TO CONSOLIDATED FINANCIAL STATEMENTS — (Continued)
settlement lump sum contracts accounted for as a financing transaction. Reinsurance and ceded commissions payables, included in other liabilities,were $225 million and $148 million at December 31, 2000 and 1999, respectively.
The following provides an analysis of the activity in the liability for benefits relating to property and casualty and group accident and non-medicalhealth policies and contracts:
Years ended December 31,
2000 1999 1998
(Dollars in millions)
Balance at January 1********************************************************************** $ 3,789 $ 3,320 $ 3,655Reinsurance recoverables **************************************************************** (415) (382) (378)
Net balance at January 1 ****************************************************************** 3,374 2,938 3,277
Acquisition of business ******************************************************************** 35 204 —
Incurred related to:Current year *************************************************************************** 3,773 3,129 2,726Prior years ***************************************************************************** (111) (16) (245)
3,662 3,113 2,481
Paid related to:Current year *************************************************************************** (2,243) (2,012) (1,967)Prior years ***************************************************************************** (1,023) (869) (853)
(3,266) (2,881) (2,820)
Net balance at December 31 *************************************************************** 3,805 3,374 2,938Add: reinsurance recoverables ************************************************************ 214 415 382
Balance at December 31 ****************************************************************** $ 4,019 $ 3,789 $ 3,320
14. Other ExpensesOther expenses were comprised of the following:
Years ended December 31,
2000 1999 1998
(Dollars in millions)
Compensation**************************************************************************** $ 2,712 $ 2,590 $ 2,478Commissions **************************************************************************** 1,768 937 902Interest and debt issue costs *************************************************************** 424 405 379Amortization of policy acquisition costs (excludes amortization of $(95), $(46) and $240, respectively,
related to investment (losses) gains)******************************************************** 1,478 930 641Capitalization of policy acquisition costs ****************************************************** (1,863) (1,160) (1,025)Rent, net of sublease income*************************************************************** 296 239 155Minority interest*************************************************************************** 115 55 67Restructuring charge ********************************************************************** — — 81Other *********************************************************************************** 3,297 2,759 4,341
Total other expenses ************************************************************** $ 8,227 $ 6,755 $ 8,019
During 1998, the Company recorded charges of $81 million to restructure headquarters operations and consolidate certain agencies and otheroperations. These costs were paid during 1999.
15. Stockholders’ Equity
Preferred StockOn September 29, 1999, the Holding Company adopted a stockholder rights plan (the ‘‘rights plan’’) under which each outstanding share of
common stock issued between April 4, 2000 and the distribution date (as defined in the rights plan) will be coupled with a stockholder right. Each rightwill entitle the holder to purchase one one-hundredth of a share of Series A Junior Participating Preferred Stock. Each one one-hundredth of a share ofSeries A Junior Participating Preferred Stock will have economic and voting terms equivalent to one share of common stock. Until it is exercised, the rightitself will not entitle the holder thereof to any rights as a stockholder, including the right to receive dividends or to vote at stockholder meetings.Stockholder rights are not exercisable until the distribution date, and will expire at the close of business on April 4, 2010, unless earlier redeemed orexchanged by the Holding Company. The rights plan is designed to protect stockholders in the event of unsolicited offers to acquire the HoldingCompany and other coercive takeover tactics.
Common StockOn the date of demutualization, the Holding Company conducted an initial public offering of 202,000,000 shares of its common stock and
concurrent private placements of an aggregate of 60,000,000 shares of its common stock at an initial public offering price of $14.25 per share. Theshares of common stock issued in the offerings were in addition to 494,466,664 shares of common stock of the Holding Company distributed to theMetropolitan Life Policyholder Trust for the benefit of policyholders of Metropolitan Life in connection with the demutualization. On April 10, 2000, the
MetLife, Inc.F-31
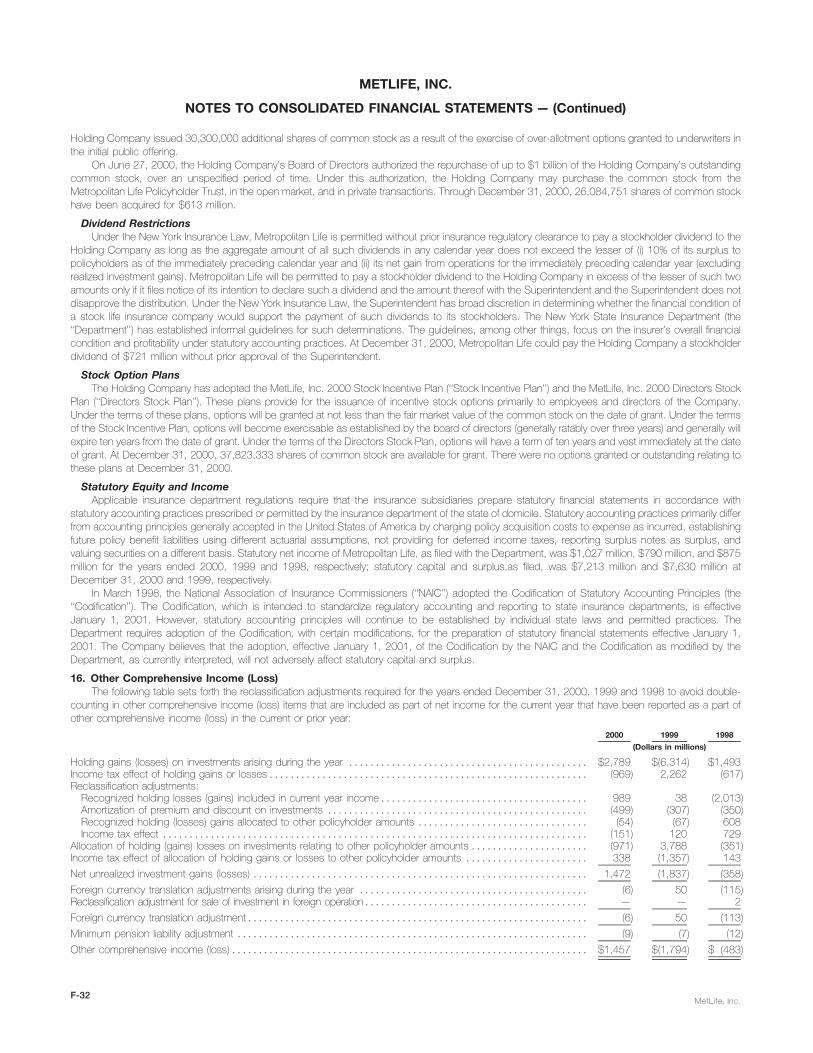
METLIFE, INC.
NOTES TO CONSOLIDATED FINANCIAL STATEMENTS — (Continued)
Holding Company issued 30,300,000 additional shares of common stock as a result of the exercise of over-allotment options granted to underwriters inthe initial public offering.
On June 27, 2000, the Holding Company’s Board of Directors authorized the repurchase of up to $1 billion of the Holding Company’s outstandingcommon stock, over an unspecified period of time. Under this authorization, the Holding Company may purchase the common stock from theMetropolitan Life Policyholder Trust, in the open market, and in private transactions. Through December 31, 2000, 26,084,751 shares of common stockhave been acquired for $613 million.
Dividend RestrictionsUnder the New York Insurance Law, Metropolitan Life is permitted without prior insurance regulatory clearance to pay a stockholder dividend to the
Holding Company as long as the aggregate amount of all such dividends in any calendar year does not exceed the lesser of (i) 10% of its surplus topolicyholders as of the immediately preceding calendar year and (ii) its net gain from operations for the immediately preceding calendar year (excludingrealized investment gains). Metropolitan Life will be permitted to pay a stockholder dividend to the Holding Company in excess of the lesser of such twoamounts only if it files notice of its intention to declare such a dividend and the amount thereof with the Superintendent and the Superintendent does notdisapprove the distribution. Under the New York Insurance Law, the Superintendent has broad discretion in determining whether the financial condition ofa stock life insurance company would support the payment of such dividends to its stockholders. The New York State Insurance Department (the‘‘Department’’) has established informal guidelines for such determinations. The guidelines, among other things, focus on the insurer’s overall financialcondition and profitability under statutory accounting practices. At December 31, 2000, Metropolitan Life could pay the Holding Company a stockholderdividend of $721 million without prior approval of the Superintendent.
Stock Option PlansThe Holding Company has adopted the MetLife, Inc. 2000 Stock Incentive Plan (‘‘Stock Incentive Plan’’) and the MetLife, Inc. 2000 Directors Stock
Plan (‘‘Directors Stock Plan’’). These plans provide for the issuance of incentive stock options primarily to employees and directors of the Company.Under the terms of these plans, options will be granted at not less than the fair market value of the common stock on the date of grant. Under the termsof the Stock Incentive Plan, options will become exercisable as established by the board of directors (generally ratably over three years) and generally willexpire ten years from the date of grant. Under the terms of the Directors Stock Plan, options will have a term of ten years and vest immediately at the dateof grant. At December 31, 2000, 37,823,333 shares of common stock are available for grant. There were no options granted or outstanding relating tothese plans at December 31, 2000.
Statutory Equity and IncomeApplicable insurance department regulations require that the insurance subsidiaries prepare statutory financial statements in accordance with
statutory accounting practices prescribed or permitted by the insurance department of the state of domicile. Statutory accounting practices primarily differfrom accounting principles generally accepted in the United States of America by charging policy acquisition costs to expense as incurred, establishingfuture policy benefit liabilities using different actuarial assumptions, not providing for deferred income taxes, reporting surplus notes as surplus, andvaluing securities on a different basis. Statutory net income of Metropolitan Life, as filed with the Department, was $1,027 million, $790 million, and $875million for the years ended 2000, 1999 and 1998, respectively; statutory capital and surplus,as filed, was $7,213 million and $7,630 million atDecember 31, 2000 and 1999, respectively.
In March 1998, the National Association of Insurance Commissioners (‘‘NAIC’’) adopted the Codification of Statutory Accounting Principles (the‘‘Codification’’). The Codification, which is intended to standardize regulatory accounting and reporting to state insurance departments, is effectiveJanuary 1, 2001. However, statutory accounting principles will continue to be established by individual state laws and permitted practices. TheDepartment requires adoption of the Codification, with certain modifications, for the preparation of statutory financial statements effective January 1,2001. The Company believes that the adoption, effective January 1, 2001, of the Codification by the NAIC and the Codification as modified by theDepartment, as currently interpreted, will not adversely affect statutory capital and surplus.
16. Other Comprehensive Income (Loss)The following table sets forth the reclassification adjustments required for the years ended December 31, 2000, 1999 and 1998 to avoid double-
counting in other comprehensive income (loss) items that are included as part of net income for the current year that have been reported as a part ofother comprehensive income (loss) in the current or prior year:
2000 1999 1998
(Dollars in millions)
Holding gains (losses) on investments arising during the year ********************************************* $2,789 $(6,314) $1,493Income tax effect of holding gains or losses************************************************************ (969) 2,262 (617)Reclassification adjustments:
Recognized holding losses (gains) included in current year income*************************************** 989 38 (2,013)Amortization of premium and discount on investments ************************************************* (499) (307) (350)Recognized holding (losses) gains allocated to other policyholder amounts ******************************** (54) (67) 608Income tax effect ******************************************************************************** (151) 120 729
Allocation of holding (gains) losses on investments relating to other policyholder amounts ********************** (971) 3,788 (351)Income tax effect of allocation of holding gains or losses to other policyholder amounts *********************** 338 (1,357) 143
Net unrealized investment gains (losses) *************************************************************** 1,472 (1,837) (358)
Foreign currency translation adjustments arising during the year ******************************************* (6) 50 (115)Reclassification adjustment for sale of investment in foreign operation****************************************** — — 2
Foreign currency translation adjustment**************************************************************** (6) 50 (113)
Minimum pension liability adjustment ****************************************************************** (9) (7) (12)
Other comprehensive income (loss) ******************************************************************* $1,457 $(1,794) $ (483)
MetLife, Inc.F-32
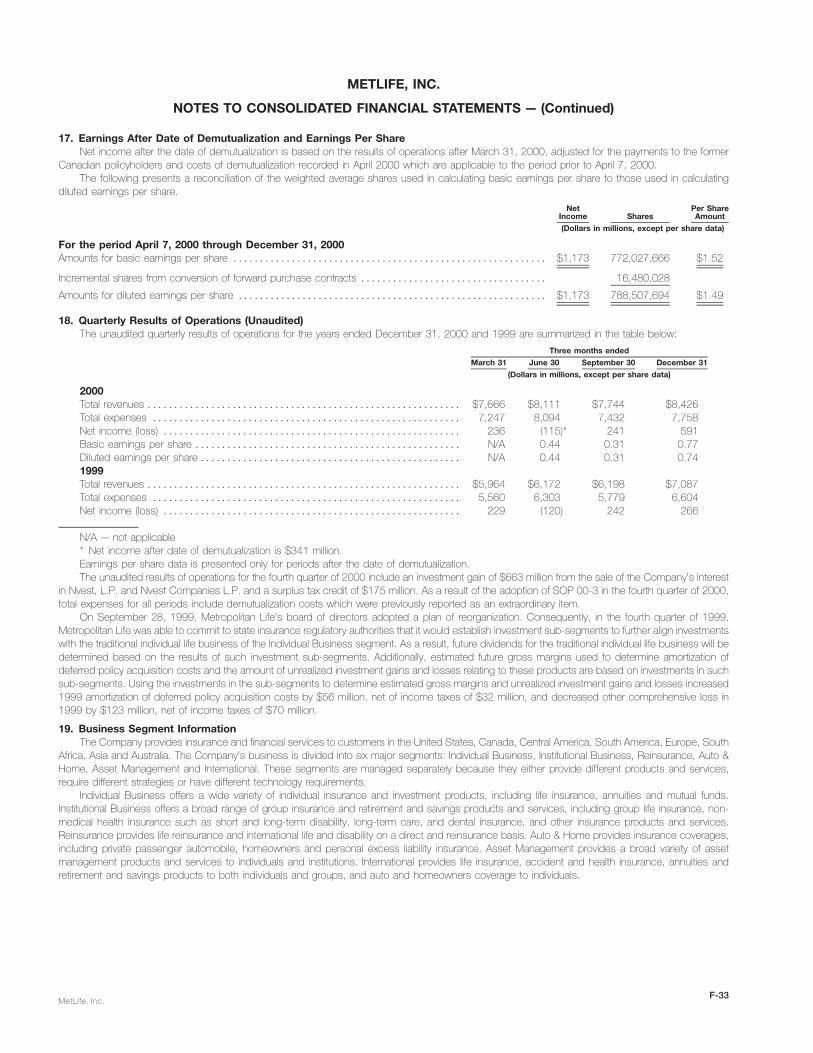
METLIFE, INC.
NOTES TO CONSOLIDATED FINANCIAL STATEMENTS — (Continued)
17. Earnings After Date of Demutualization and Earnings Per ShareNet income after the date of demutualization is based on the results of operations after March 31, 2000, adjusted for the payments to the former
Canadian policyholders and costs of demutualization recorded in April 2000 which are applicable to the period prior to April 7, 2000.The following presents a reconciliation of the weighted average shares used in calculating basic earnings per share to those used in calculating
diluted earnings per share.
Net Per ShareIncome Shares Amount
(Dollars in millions, except per share data)
For the period April 7, 2000 through December 31, 2000Amounts for basic earnings per share *********************************************************** $1,173 772,027,666 $1.52
Incremental shares from conversion of forward purchase contracts *********************************** 16,480,028
Amounts for diluted earnings per share ********************************************************** $1,173 788,507,694 $1.49
18. Quarterly Results of Operations (Unaudited)The unaudited quarterly results of operations for the years ended December 31, 2000 and 1999 are summarized in the table below:
Three months ended
March 31 June 30 September 30 December 31
(Dollars in millions, except per share data)
2000Total revenues *********************************************************** $7,666 $8,111 $7,744 $8,426Total expenses ********************************************************** 7,247 8,094 7,432 7,758Net income (loss) ******************************************************** 236 (115)* 241 591Basic earnings per share ************************************************** N/A 0.44 0.31 0.77Diluted earnings per share ************************************************* N/A 0.44 0.31 0.741999Total revenues *********************************************************** $5,964 $6,172 $6,198 $7,087Total expenses ********************************************************** 5,560 6,303 5,779 6,604Net income (loss) ******************************************************** 229 (120) 242 266
N/A — not applicable* Net income after date of demutualization is $341 million.Earnings per share data is presented only for periods after the date of demutualization.The unaudited results of operations for the fourth quarter of 2000 include an investment gain of $663 million from the sale of the Company’s interest
in Nvest, L.P. and Nvest Companies L.P. and a surplus tax credit of $175 million. As a result of the adoption of SOP 00-3 in the fourth quarter of 2000,total expenses for all periods include demutualization costs which were previously reported as an extraordinary item.
On September 28, 1999, Metropolitan Life’s board of directors adopted a plan of reorganization. Consequently, in the fourth quarter of 1999,Metropolitan Life was able to commit to state insurance regulatory authorities that it would establish investment sub-segments to further align investmentswith the traditional individual life business of the Individual Business segment. As a result, future dividends for the traditional individual life business will bedetermined based on the results of such investment sub-segments. Additionally, estimated future gross margins used to determine amortization ofdeferred policy acquisition costs and the amount of unrealized investment gains and losses relating to these products are based on investments in suchsub-segments. Using the investments in the sub-segments to determine estimated gross margins and unrealized investment gains and losses increased1999 amortization of deferred policy acquisition costs by $56 million, net of income taxes of $32 million, and decreased other comprehensive loss in1999 by $123 million, net of income taxes of $70 million.
19. Business Segment InformationThe Company provides insurance and financial services to customers in the United States, Canada, Central America, South America, Europe, South
Africa, Asia and Australia. The Company’s business is divided into six major segments: Individual Business, Institutional Business, Reinsurance, Auto &Home, Asset Management and International. These segments are managed separately because they either provide different products and services,require different strategies or have different technology requirements.
Individual Business offers a wide variety of individual insurance and investment products, including life insurance, annuities and mutual funds.Institutional Business offers a broad range of group insurance and retirement and savings products and services, including group life insurance, non-medical health insurance such as short and long-term disability, long-term care, and dental insurance, and other insurance products and services.Reinsurance provides life reinsurance and international life and disability on a direct and reinsurance basis. Auto & Home provides insurance coverages,including private passenger automobile, homeowners and personal excess liability insurance. Asset Management provides a broad variety of assetmanagement products and services to individuals and institutions. International provides life insurance, accident and health insurance, annuities andretirement and savings products to both individuals and groups, and auto and homeowners coverage to individuals.
MetLife, Inc.F-33

METLIFE, INC.
NOTES TO CONSOLIDATED FINANCIAL STATEMENTS — (Continued)
Set forth in the tables below is certain financial information with respect to the Company’s operating segments for the years ended December 31,2000, 1999 and 1998. The accounting policies of the segments are the same as those described in the summary of significant accounting policies,except for the method of capital allocation. The Company allocates capital to each segment based upon an internal capital allocation system that allowsthe Company to more effectively manage its capital. The Company evaluates the performance of each operating segment based upon income or lossfrom operations before provision for income taxes and non-recurring items (e.g. items of unusual or infrequent nature). The Company allocates non-recurring items (primarily consisting of sales practices claims and claims for personal injuries caused by exposure to asbestos or asbestos-containingproducts and demutualization costs) and, prior to its sale in 1998, the results of MetLife Capital Holdings, Inc., to the Corporate segment.
AutoAt or for the year ended & Asset Consolidation/December 31, 2000 Individual Institutional Reinsurance Home Management International Corporate Elimination Total
(Dollars in millions)
Premiums *********************** $ 4,673 $6,900 $1,450 $2,636 $ — $ 660 $ — $ (2) $ 16,317Universal life and investment-type
product policy fees ************* 1,221 547 — — — 53 — (1) 1,820Net investment income************ 6,475 3,959 379 194 90 254 662 (245) 11,768Other revenues ****************** 838 673 29 40 760 9 121 (38) 2,432Net investment gains (losses) ****** 227 (475) (2) (20) — 18 (200) 62 (390)Policyholder benefits and claims **** 5,054 8,178 1,096 2,005 — 562 (2) — 16,893Interest credited to policyholder
account balances ************** 1,680 1,090 109 — — 56 — — 2,935Policyholder dividends ************ 1,742 124 21 — — 32 — — 1,919Payments to former Canadian
policyholders ****************** — — — — — 327 — — 327Demutualization costs ************* — — — — — — 230 — 230Other expenses****************** 3,511 1,753 513 827 784 292 773 (226) 8,227Income (loss) before provision for
income taxes ****************** 1,447 459 117 18 66 (275) (418) 2 1,416Net income (loss) **************** 920 307 69 30 34 (285) (146) 24 953Total assets ********************* 132,433 90,279 7,280 4,511 418 5,119 18,542 (3,564) 255,018Deferred policy acquisition costs**** 8,610 446 1,030 176 — 354 1 1 10,618Separate account assets ********** 34,860 33,918 28 — — 1,491 — (47) 70,250Policyholder liabilities************** 84,049 50,223 5,145 2,559 — 2,435 24 (980) 143,455Separate account liabilities ********* 34,860 33,918 28 — — 1,491 — (47) 70,250
AutoAt or for the year ended & Asset Consolidation/December 31, 1999 Individual Institutional Reinsurance Home Management International Corporate Elimination Total
(Dollars in millions)
Premiums *********************** $ 4,289 $ 5,525 $ — $1,751 $— $523 $ — $ — $ 12,088Universal life and investment-type
product policy fees ************* 888 502 — — — 43 — — 1,433Net investment income************ 5,346 3,755 — 103 80 206 605 (279) 9,816Other revenues ****************** 558 629 — 21 803 12 59 72 2,154Net investment (losses) gains ****** (14) (31) — 1 — 1 (41) 14 (70)Policyholder benefits and claims **** 4,625 6,712 — 1,301 — 458 — 4 13,100Interest credited to policyholder
account balances ************** 1,359 1,030 — — — 52 — — 2,441Policyholder dividends ************ 1,509 159 — — — 22 — — 1,690Demutualization costs ************* — — — — — — 260 — 260Other expenses****************** 2,719 1,589 — 514 795 248 1,031 (141) 6,755Income (loss) before provision for
income taxes ****************** 855 890 — 61 88 5 (668) (56) 1,175Net income (loss) **************** 555 567 — 56 51 21 (583) (50) 617Total assets ********************* 109,401 88,127 — 4,443 1,036 4,381 20,499 (2,655) 225,232Deferred policy acquisition costs**** 8,228 364 — 167 — 311 — — 9,070Separate account assets ********** 28,828 35,236 — — — 877 — — 64,941Policyholder liabilities************** 72,956 47,781 — 2,318 — 2,187 6 (293) 124,955Separate account liabilities ********* 28,828 35,236 — — — 877 — — 64,941
MetLife, Inc.F-34

METLIFE, INC.
NOTES TO CONSOLIDATED FINANCIAL STATEMENTS — (Continued)
AutoAt or for the year ended & Asset Consolidation/December 31, 1998 Individual Institutional Reinsurance Home Management International Corporate Elimination Total
(Dollars in millions)
Premiums *********************** $ 4,323 $ 5,159 $— $1,403 $ — $ 618 $ — $ — $ 11,503Universal life and investment-type
product policy fees ************* 817 475 — — — 68 — — 1,360Net investment income************ 5,480 3,885 — 81 75 343 682 (318) 10,228Other revenues ****************** 474 575 — 36 817 33 111 (52) 1,994Net investment gains ************* 659 557 — 122 — 117 679 (113) 2,021Policyholder benefits and claims **** 4,606 6,416 — 1,029 — 597 (10) — 12,638Interest credited to policyholder
account balances ************** 1,423 1,199 — — — 89 — — 2,711Policyholder dividends ************ 1,445 142 — — — 64 — — 1,651Demutualization costs ************* — — — — — — 6 — 6Other expenses****************** 2,577 1,613 — 386 799 352 2,601 (309) 8,019Income (loss) before provision for
income taxes ****************** 1,702 1,281 — 227 93 77 (1,125) (174) 2,081Net income (loss) **************** 1,069 846 — 161 49 56 (695) (143) 1,343Total assets ********************* 103,614 88,741 — 2,763 1,164 3,432 20,852 (5,220) 215,346Deferred policy acquisition costs**** 6,386 354 — 57 — 231 — — 7,028Separate account assets ********** 23,013 35,029 — — — 26 — — 58,068Policyholder liabilities************** 71,571 49,406 — 1,477 — 2,043 1 (295) 124,203Separate account liabilities ********* 23,013 35,029 — — — 26 — — 58,068
The Individual Business segment included an equity ownership interest in Nvest under the equity method of accounting. Nvest was included withinthe Asset Management segment due to the types of products and strategies employed by the entity. The Individual Business segment’s equity inearnings of Nvest, which is included in net investment income, was $30 million, $48 million and $49 million for the years ended December 31, 2000,1999 and 1998, respectively. The Individual Business segment includes $538 million (after allocating $118 million to participating contracts) of the gainon the sale of Nvest in 2000. As part of the GenAmerica acquisition, the Company acquired General American Life Insurance Company, the results ofwhich are included primarily in the Individual Business segment.
The Reinsurance segment includes the life reinsurance business of RGA, acquired in 2000, combined with Exeter, an ancillary life reinsurancebusiness of the Company. Exeter has been reported as a component of the Individual Business segment rather than as a separate segment for periodsprior to January 1, 2000 due to its immateriality.
The Auto & Home segment includes the standard personal lines property and casualty insurance operations of The St. Paul Companies which wereacquired in September, 1999.
As part of the GenAmerica acquisition, the Company acquired Conning, the results of which are included in the Asset Management segment.The International segment includes a $87 million gain resulting from the sale of a substantial portion of the Company’s Canadian operations in 1998.The Corporate segment includes a $433 million gain resulting from the sale of MetLife Capital Holdings, Inc. in 1998.Net investment income and net investment gains and losses are based upon the actual results of each segment’s specifically identifiable asset
portfolio. Other costs and operating costs were allocated to each of the segments based upon: (1) a review of the nature of such costs, (2) time studiesanalyzing the amount of employee compensation costs incurred by each segment, and (3) cost estimates included in the Company’s product pricing.
The consolidation/elimination column includes the elimination of all intersegment amounts and the Individual Business segment’s ownership interestin Nvest. The principal component of the intersegment amounts related to intersegment loans, which bore interest at rates commensurate with relatedborrowings.
Revenues derived from any customer did not exceed 10% of consolidated revenues. Revenues from U.S. operations were $30,953 million,$24,637 million and $25,643 million for the years ended December 31, 2000, 1999 and 1998, respectively, which represented 97%, 97% and 96%,respectively, of consolidated revenues.
MetLife, Inc.F-35

BOARD OF EXECUTIVEDIRECTORS OFFICERS
ROBERT H. BENMOSCHE HARRY P. KAMEN JOHN J. PHELAN, JR. ROBERT H. BENMOSCHEChairman of the Board Retired Chairman of the Retired Chairman Chairman of the Board andand Chief Executive Officer Board and and Chief Executive Officer Chief Executive OfficerMetLife, Inc. and Chief Executive Officer New York Stock Exchange, Inc.
GERALD CLARKMetropolitan Life Metropolitan Life Insurance Member, Audit Committee,
Vice Chairman of the BoardInsurance Company Company Governance and Finance
and Chief Investment OfficerChairman, Executive Member, Governance and Committee andCommittee Finance Committee and Executive Committee STEWART G. NAGLER
Executive Committee Vice Chairman of the BoardCURTIS H. BARNETTE HUGH B. PRICE
and Chief Financial OfficerChairman Emeritus HELENE L. KAPLAN President and ChiefBethlehem Steel Corporation Of Counsel Executive Officer JAMES M. BENSONMember, Corporate Social Skadden, Arps, Slate, National Urban League, Inc. President,Responsibility Committee Meagher & Flom LLP Member, Audit Committee Individual Business
Chairman, Governance and Corporate SocialGERALD CLARK C. ROBERT HENRIKSONand Finance Committee Responsibility CommitteeVice Chairman of the Board President,Member, Corporate Socialand Chief Investment Officer RUTH J. SIMMONS Institutional BusinessResponsibility CommitteeMetLife, Inc. and President
and Executive Committee WILLIAM J. TOPPETAMetropolitan Life Insurance Smith CollegePresident,Company CHARLES M. LEIGHTON Member, CompensationClient Services andMember, Corporate Social Retired Chairman CommitteeChief Administrative OfficerResponsibility Committee and Chief Executive Officer
WILLIAM C. STEERE, JR.CML Group, Inc. GARY A. BELLERJOAN GANZ COONEY Chairman of the BoardMember, Compensation Senior ExecutiveChairman, Executive Pfizer Inc.Committee and Vice PresidentCommittee of Member, Audit Committee,Executive Committee and General CounselChildren’s Television Compensation Committee and
Workshop ALLEN E. MURRAY Governance and Finance CATHERINE A. REINChairman, Corporate Social Retired Chairman Committee President and ChiefResponsibility Committee of the Board and Chief Executive OfficerMember, Compensation Executive Officer MetLife@ Auto & HomeCommittee Mobil Corporation
JOHN H. TWEEDIEChairman, CompensationJOHN C. DANFORTH Senior Executive ViceCommitteePartner, Bryan Cave LLP President, InternationalMember, Governance andFormer U.S. Senator
Finance Committee and JUDY E. WEISSMember, Audit CommitteeExecutive Committee Chairman of theand Corporate Social
Board andResponsibility Committee STEWART G. NAGLERChief Executive OfficerVice Chairman of the Board
BURTON A. DOLE, JR. MetLife Bank, N.A.and Chief Financial OfficerRetired Chairman,
MetLife, Inc. and DAVID A. LEVENEPresident and ChiefMetropolitan Life Insurance Executive Vice President,Executive OfficerCompany Institutional BusinessNellcor Puritan Bennett, Inc.Member, Corporate Social
Member, Audit Committee TERENCE I. LENNONResponsibility Committeeand Corporate Social Executive Vice President,Responsibility Committee Mergers and Acquisitions
Corporate Special ServicesJAMES R. HOUGHTONChairman of the Board, JEFFREY J. HODGMANEmeritus Executive Vice President,Corning Incorporated InvestmentsChairman, Audit Committee
DANIEL CAVANAGHMember, CompensationExecutive Vice President,Committee, GovernanceInformation Technologyand Finance Committee,
and Executive Committee LISA M. WEBERExecutive Vice President,Human Resources
KERMAN F. KINGExecutive Vice President,MetLife Financial Services
CORPORATE INFORMATION
Corporate Profile Investor InformationMetLife, Inc. through its subsidiaries and affiliates, is a leading http://ir.metlife.comprovider of insurance and other financial services to individual andgroup customers. The MetLife companies serve approximately
MetLife Newsnine million households in the U.S. and companies andhttp://metnews.metlife.cominstitutions with 33 million employees and members. It also has
international insurance operations in 12 countries.
Common Stock and Dividend InformationMetLife Inc.’s common stock is traded on the New York StockCorporate HeadquartersExchange (NYSE) under the trading symbol ‘‘MET.’’ The followingMetLife, Inc.table presents the high and low closing prices for the commonOne Madison Avenuestock of MetLife, Inc. on the NYSE for the periods indicated.New York, NY 10010MetLife, Inc. declared an annual dividend of $0.20 per share on212-578-2211October 24, 2000.
Internet AddressCommon Stock Pricehttp://www.metlife.com
2000 High Low
First quarter* N/A N/AForm 10-K and Other Information Second quarter** $21.31 $15.13Shareholders may receive, without charge, a copy of MetLife, Third quarter $27.19 $19.81Inc.’s Form 10-K (without exhibits) filed with the Securities and Fourth quarter $36.50 $23.75Exchange Commission for the fiscal year ended December 31, *MetLife, Inc. was not a publicly traded company during the first2000 by contacting 1-800-649-3593. Quarterly reports are also quarter of 2000.available through this toll-free number or the Internet. **MetLife, Inc. became a publicly traded company on April 5,
2000.
Transfer Agent/Shareholder RecordsFor information or assistance regarding shareholder accounts or As of March 2, 2001, there were approximately 8.5 milliondividend checks, please contact MetLife’s transfer agent: shareholders of MetLife, Inc.
Mellon Investor Services, L.L.C.P.O. Box 4412South Hackensack, NJ 07606-20121-800-649-3593TDD for Hearing Impaired: 201-373-5040www.mellon-investor.com
Trustee, MetLife Policyholder TrustWilmington Trust Company1100 North Market StreetWilmington, DE 19890302-651-1000www.wilmingtontrust.com
Printed on recycled paper with environmentally friendly inks in the USA.
PEANUTS © United Feature Syndicate, Inc. www.snoopy.com