metrics based management
TRANSCRIPT

0
Metrics Based
Management

1
Contents
Key AD / AM Metrics
Who are the Key personnel
Why Metrics
When and how to use Metrics
How to identify Data Quality issues
Some Enablers for Improvement

METRICS

Effort Metrics Formula
Effort Variance ((Actual Effort – Estimated Effort) / Estimated Effort)*100
Load Factor (Actual Effort / Effort available))
% Review Effort (Total Effort expended on Reviews across all stages)/ (Actual Overall Project Effort) *100
% Cost of Quality (Effort spent on Prevention + Effort spent on Appraisal + Effort spent on Failure) / (Effort spent on Prevention + Effort spent on Appraisal + Effort spent on Failure + Effort spent on Production)) *100
Schedule Metrics Formula
Schedule Variation ((Actual End date – Planned End date) / (Planned End date - Planned Start date))*100
Duration Variation ((Actual End Date – Actual Start Date) – (Planned End Date – Planned Start Date)) / (Planned End Date – Planned Start Date) * 100
AD - Basic Process Metrics and Formula
Schedule Effort

AD - Basic Process Metrics and Formula – Cont.
Defect
Metrics Formula
Defect Removal Efficiency
(Total number of Pre-shipment Defects)/ (Total number of Pre-shipment Defects + Total number of post-shipment Defects + Total number of Post production Defects) *100
Defect Detection Efficiency
(Number of Pre-shipment defects / Appraisal Effort)
Defect Density by Effort
Total no of Defects Detected/Total overall actual effort spent.
Defect Leakage Sum((Number of defects attributed to a stage but only captured in subsequent stages) / (Total number of defects captured in that stage + Total Number of defects attributed to a stage but only captured in subsequent stages)) *100
Metrics Formula
Size Variation ((Actual Overall Size – Planned Overall Size) / (Planned Overall Size))* 100
Productivity Overall Productivity = (Overall Project Size) / (Total Effort for the Project)
Size

AVM - Basic Process Metrics, Definition and Formula
Metrics Formula
Acknowledging Severity 1….5 Incident
(No. of Sev 1/2/3/4/5 incidents acknowledged within the applicable Acknowledgement Time / Total No. of Sev 1/2/3/4/5 Incidents) * 100
Severity 1…..5 Incidents resolved within the allotted time
(Number of Sev 1/2/3/4/5 incidents resolved within the allotted time / number of Sev 1/2/3/4/5 incidents resolved) * 100.
Avoidable Problems / Unforced Errors for Severity level 1 and 2
(No. of incidents/problems caused by the Supplier's Actions / Total No. of incidents/problems) * 100
Metrics Formula
Function Points per $1K Spent
FP count / Total amount spend in ($1K )
Defect Injection Rate - Release or Project
(Total number of defects injected in the Release or Project / size of product)
% of SLAs met % of fixes without escalation

Other set of Product Quality Metrics
Metric / UOM
Formula Operational Definition Tools Usage
.Net Java
Code Review Coverage
Number of impacted programs reviewed / Total number of programs * 100
A measure of the review coverage on the number of programs This is higher the better metric
VSTS-Code Analysis, FxCop, Sonar
SONAR, JCAP, PMD, Checkstyle, FindBugs
Unit Test Coverage
Based on Unit Test Coverage Tools such as Junits/JCoverage
The Code coverage metric identifies the sections of the source code that were either tested/ not tested as part of white box testing This is higher the better metric
NUnit, VSTS- Unit Testing NCover
Junit, Test NG, Code pro analytix, Cobertura, EMMA
Code Quality - Cyclomatic complexity
Cyclomatic Complexity at class level (Highest method CC)
This metric estimates the complexity of the individual functions, modules, methods or classes within a program so as to measure the program's structural complexity. Lower the better metric
IDE,Sonar, VSTS-Code Analysis, FxCop
SONAR, JCAP, PMD, Checkstyle, FindBugs
Requirements to Test Case coverage
% of requirements linked to Test cases
An indication of how extensively the requirements are covered by Test Cases This is higher the better metric
VSTS- Unit Testing, NCover
Junit, Test NG, Code pro analytix, Cobertura, EMMA

Metrics – Testing
Project
Metrics Intent Definition
Reporting
Frequency
Test
Effectiveness
Indicates ability to unearth and fix defects
before they reach UAT and Production
(Number of accepted defects in SIT / (Number of accepted
defects in SIT + UAT + Post UAT)) * 100 Monthly
Test Design
coverage
How much requirements are covered by
test cases ?
(Total number of baselined testable requirements mapped to
test cases / Total number of baselined testable
requirements)*100
Monthly
Test Case
Preparation
Productivity
Test case creation productivity of the team ((No of Test Cases or Test Case points (TCP) prepared)/ (Effort
spent for Test Case Preparation) Monthly
Test Case
Execution
Productivity
Indicates test execution productivity of
the team
((No of Test Cases or TCP Executed)/ (Effort spent for Test
Execution) Monthly

METRICS

9
Metrics Work Flow
Developer / TL enters/updates
the data
PL Reviews the data
PM Approves the Metrics
Metrics review by DD / DM

Some proactive approaches for reviewing the Metrics data
Metrics Submission date to be done by end of every month.
Review of Metrics by PM/Delivery Manger to be completed subsequently.
Monthly Metrics Review scheduled with Delivery Director by 1st week of subsequent month for critical projects.

METRICS

12
Customer’s Expectations (i.e. Why Metrics)
Improved Business Value & New Revenue Generation
On time delivery & Improvement in Time to Market
Zero defects
High Quality Business / Technology Solutions
Reduction in IT Operating Cost
Am I getting more work for lesser $ spent over a period

13
Senior Management Expectations (i.e Why Metrics)
Are we fixing more Tickets over a period
Are we building more LoC over a period
Are we delivering Zero Defects Software
Are we making expected Profitability
Are we adopting Best Practices and Reusable
Are we getting accurate Productivity while submitting RFPs
Are we getting repeat business from this engagement
14
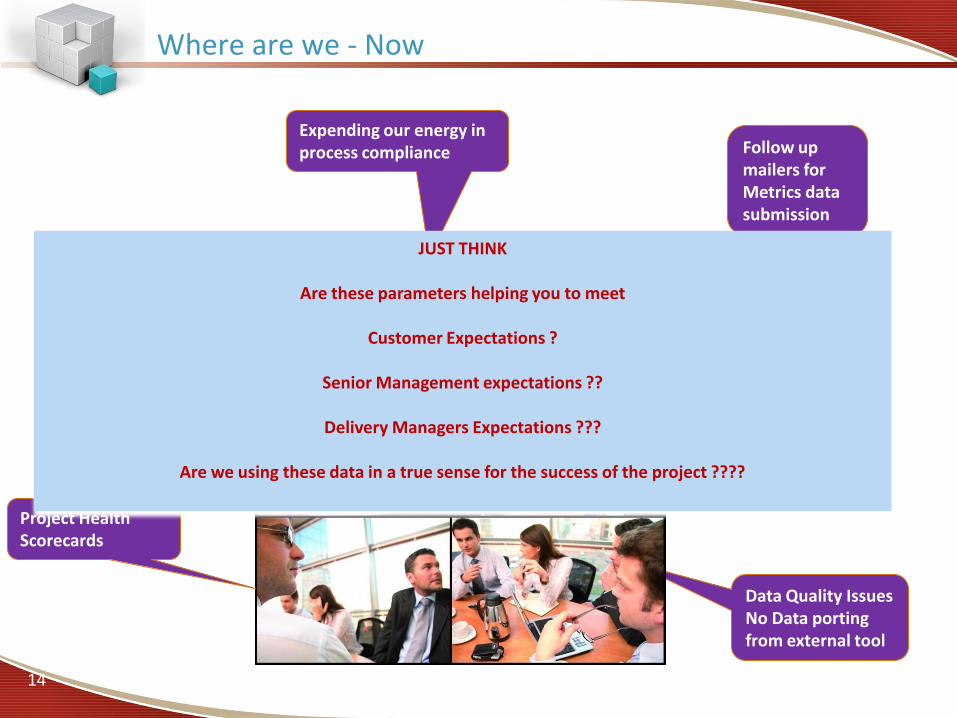
Where are we - Now
Follow-up on Project planning & tracking
Data Quality Issues No Data porting from external tool
Expending our energy in process compliance Follow up
mailers for Metrics data submission
Project Health Scorecards
JUST THINK
Are these parameters helping you to meet
Customer Expectations ?
Senior Management expectations ??
Delivery Managers Expectations ???
Are we using these data in a true sense for the success of the project ????

15
Metrics Based Project Management – Work flow
Process Performance Objective ; Process Performance models
Benchmarking
Guidelines for Metrics and QPM, Statistical Techniques
Data Validation, Analysis and reporting ; Facilitation for usage of statistical tools like control charts
Facilitation
Data Trend analysis and validation of trends using hypothesis testing
Metrics Based Project Management

METRICS

Scenario - 1
Effort Variation Effort Over Run
Schedule Variation On Schedule
Defects (Internal)
Defects (Customer)
Inference • Is there a problem in Estimation • Is the team over burdened? • Is the team possess right skills to carry out the tasks in a stipulated time period? Or takes longer time to find a solution & fix • Is there any scope scale down?
Bring back to Track • Revisit the Estimation • Additional Trainings to Team

Scenario - 2
Effort Variation Effort Over Run
Schedule Variation Schedule Over Run
Defects (Internal)
Defects (Customer)
Inference • Is there a problem in Estimation • Is the team over burdened? • Is the team possess right skills to carry out the tasks in a stipulated time period? Or takes longer time to find a solution & fix • Is there any scope creep ? • Are requirements changed frequently (stability of requirement is low)
Bring back to Track • Revisit the Estimation • Additional Trainings to Team • Reach out to customer, if Scope creep observed, Requirements changed

METRICS

Data Quality Issues- What is wrong here
A Project with a –ve Effort variation cannot have a +ve Schedule overrun and a high LF

Data Quality Issues- What is wrong here
Failure Cost is zero in spite of Defects recorded and having a very High Appraisal cost. Production Cost shows zero

Thank you
22