metrics for knowledge transfer from public research...
TRANSCRIPT

Metrics for Knowledge Transferfrom Public Research Organisationsin Europe
Report from the European Commission’s Expert Groupon Knowledge Transfer Metrics
GE
NE
RA
LIN
FO
RM
AT
ION
-knowledgde transfer_cover:Layout 1 16/04/09 17:09 Page 1

EUROPEAN COMMISSION
Directorate-General for Research
Directorate C European Research Area: knowledge-based economy
Unit C2 Private investment and technology platforms
Website: http://ec.europa.eu/invest-in-research/policy/ipr_en.htm
European Commission
Office SDME 09/46
B-1049 Brussels
Interested in European research?
Research*eu is our monthly magazine keeping you in touch with main developments (results, programmes, events, etc.).It is available in English, French, German and Spanish. A free sample copy or free subscription can be obtained from:
European CommissionDirectorate-General for ResearchCommunication UnitB-1049 BrusselsFax (32-2) 29-58220E-mail: [email protected]: http://ec.europa.eu/research/research-eu
-knowledgde transfer_cover:Layout 1 16/04/09 17:09 Page 2

Directorate-General for Research
EUROPEAN COMMISSION
EUR 238942009
Metrics for Knowledge Transfer fromPublic Research Organisations in Europe
Report from the European Commission’s Expert Group on
Knowledge Transfer Metrics
Expert Group Report
-knowledgde transfer_cover:Layout 1 16/04/09 17:09 Page 3

LEGAL NOTICE:
Neither the European Commission nor any person acting on behalf of the Commission is responsible for the use which mightbe made of the following information.
The views expressed in this publication are the sole responsibility of the author and do not necessarily reflect the viewsof the European Commission.
A great deal of additional information on the European Union is available on the Internet.It can be accessed through the Europa server (http://europa.eu).
Cataloguing data can be found at the end of this publication.
Luxembourg: Office for Official Publications of the European Communities, 2009
ISBN 978-92-79-12009-1
© European Communities, 2009Reproduction is authorised provided the source is acknowledged.
Printed in Belgium
PRINTED ON WHITE CHLORINE-FREE PAPER
EUROPE DIRECT is a service to help you find answersto your questions about the European Union
Freephone number (*):
00 800 6 7 8 9 10 11(*) Certain mobile telephone operators do not allow access to 00 800 numbers
or these calls may be billed
-knowledgde transfer_cover:Layout 1 16/04/09 17:09 Page 4

i
Executive summary This is the report of an Expert Group from Knowledge Transfer Metrics set up by DG Research of the European Commission to improve coherence and convergence be-tween existing surveys of knowledge transfer from public research organisations (PROs) to business and other sectors in society. The purpose of this is to improve the possibility for individual PROs and Member States to monitor and compare their achievements in this field against themselves over time and against each other, in or-der to identify trends and to support work on improvements if needed. This is impor-tant because more science output should be made more readily available for cultural, social and economic development. The strategy of the group has been to identify indicators used in several existing re-current surveys and nominate a small selection of these as core indicators, and agree on a harmonised set of definitions for them. The need for feasible short term imple-mentation has made it imperative to work with surveys directed towards knowledge transfer offices (KTOs). The following indicator set has been selected and defined: Recommended core performance indicators for the PROs served by the KTO:
• Research agreements • Invention disclosures • Patent applications • Patent grants • Licences executed • License income earned • Spin-offs established
Considered supplementary indicators for a more detailed monitoring of the core performance indicators, for which the group has agreed on shared definitions if applied:
• Knowledge transfer involving SMEs • Knowledge transfer involving domestic firms • Knowledge transfer involving the research organisation’s own region • Exclusive licenses • Share of valid patent portfolio that has ever been licensed • Patent share of license income • Technology areas for patenting
Basic data concerning the KTOs and PROs:
• Type(s) and number of affiliated PROs • KTO size • Total KTO costs • Outsourcing of KTO services • Reference year for data collected • Research expenditure in the reference year

ii
• Research personnel in the reference year In order to improve comparability, performance indicators should be published as normalised by research expenditure or research personnel. ASTP and ProTon Europe both operate long standing pan-European surveys in this area, sometimes partially overlapping with national surveys in Denmark, France, It-aly, Spain, Switzerland, and the United Kingdom, with other data collection schemes in Austria and Norway, and with planned survey initiatives in Ireland, the Nether-lands, and possibly other countries. The pan-European surveys are mainly imple-mented to support the benchmarking of participants whereas a main goal for many national surveys is to monitor policy impact. Given differences in confidentiality clauses between surveys, the Expert Group has also developed procedures for com-bining data from different surveys for compilation of comparable data to national and European levels. The selected set of indicators is strongly influenced by what is currently collected as proven knowledge transfer metrics in recurrent surveys. They focus on patenting and licensing because this is what the majority of specialised KTOs are set up to do. How-ever, knowledge is transferred in many important channels besides this, and in the long run, additional indicators will have to be developed in order to achieve a more adequate monitoring. In the meanwhile, some data about direct enterprise involve-ment with PROs can be harvested from the Community Innovation Survey (CIS). Implementation will involve three steps. First, coherence and convergence in the short term between existing surveys will require their owners to agree on a harmonised set of questions to collect the core indicators. Second, arrangements need to be set up for accumulation of data from various surveys into national or other aggregates. Third, coherence and convergence in the long run will require a suitable forum for discussing a possible expansion into covering other channels of knowledge transfer than those already covered. National authorities and individual PROs not currently participating in any surveys or wishing to initiate new monitoring schemes will also benefit from using these indicators and participating in their further development. The Expert Group recommends the European Commission to continue their work with relevant actors in order to facilitate these steps.

iii
Table of contents
Executive summary..................................................................................................... i
Table of contents ....................................................................................................... iii
Chapter 1 Motivations and conditions behind the project...................................1 1.1 Objectives of the knowledge transfer metrics Expert Group and its
selection ...................................................................................................1 1.2 Deliverables of the knowledge transfer metrics Expert Group ...............2
Chapter 2 What is knowledge transfer, and how can it be measured? ..............4 2.1 From technology transfer to knowledge transfer.....................................4 2.2 Forms of knowledge ................................................................................4 2.3 Channels of knowledge transfer ..............................................................5 2.4 From knowledge to benefits ....................................................................6 2.5 Measuring knowledge transfer ................................................................7 2.6 Metrics, incentives, policy, and strategies ...............................................8 2.7 Identifying appropriate metrics..............................................................10
Chapter 3 Surveys of knowledge transfer ...........................................................11 3.1 Introduction: Potential sources of data on knowledge transfer .............11 3.2 Surveys of KTOs ...................................................................................13
3.2.1 Overview ......................................................................................13 3.2.2 Core indicators .............................................................................15 3.2.3 Non-core indicators ......................................................................15 3.2.4 Differences between KTO surveys ..............................................17 3.2.5 What KTO surveys cannot do ......................................................18
3.3 Developing comparable results across KTO surveys ............................19
Chapter 4 Improving comparability across KTO surveys.................................21 4.1 Introduction............................................................................................21 4.2 Indicator definitions...............................................................................21 4.3 Target populations, samples, and response rates ...................................21 4.4 Normalisation by research expenditure and number of researchers......23 4.5 Presentation by KTO or affiliated institution ........................................23 4.6 Treatment of missing values..................................................................23 4.7 Data validation.......................................................................................24 4.8 Time causality........................................................................................24 4.9 Time series and stability over time........................................................25 4.10 Who patents? .........................................................................................25 4.11 Other methodological issues..................................................................25 4.12 Conclusions and caveats ........................................................................26
Chapter 5 Recommendations for data to be collected by KTO surveys...........27 5.1 Introduction............................................................................................27 5.2 Basic data...............................................................................................27 5.3 Performance indicators ..........................................................................29 5.4 Supplementary indicators ......................................................................32
Chapter 6 Consolidating data from multiple surveys ........................................37 6.1 Introduction............................................................................................37

iv
6.2 Results by institution .............................................................................38 6.3 Aggregated results .................................................................................41
6.3.1 Aggregation by country and type of PRO....................................41 6.3.2 Aggregation techniques................................................................42
Chapter 7 Implementation....................................................................................44
Chapter 8 Recommendations................................................................................47
Annex 1: Composition of the Expert Group and attribution of authorship .....A 1
Annex 2: Organisations, surveys and other acronyms........................................A 3
Annex 3: Institution-level results for 2006............................................................A 4
Annex 4: Aggregated country-level results for 2006 .........................................A 11
Annex 5: References .............................................................................................A 13

1
Chapter 1 Motivations and conditions behind the project
1.1 Objectives of the knowledge transfer metrics Expert Group and its selection
This report is the product of the Expert Group on Knowledge Transfer Metrics (KTM) set up by DG Research of the European Commission in the context of the follow-up of the Green Paper on “The European Research Area: New Perspectives” (COM(2007)161) and the Communication “Improving knowledge transfer between research institutions and industry across Europe: embracing open innovation” (COM(2007)182; SEC(2007)449), both adopted by the Commission on April 4 2007. The Expert Group was established to address the need identified in these documents for comparable metrics across Europe regarding knowledge transfer (KT) activities in public research organisations (PROs – including universities)1. Such metrics can help demonstrate some of the value that PROs help create in the larger society. The group’s objective has been to promote coherence and convergence between various existing pan-European and national initiatives to measure and report on such activi-ties. Coherent metrics would make it possible to compare and combine their results so as to get a global view of the European situation and its evolution; it would also en-able Member States and individual PROs to monitor and compare their achievements against each other and against themselves over time, so as to facilitate the identifica-tion of possible needs for improvements. The work of the Expert Group should also be seen in the context of the “Commission Recommendation on the management of intellectual property in knowledge transfer activities and Code of Practice for universities and other public research organisa-tions” (C(2008)1329). That document recommends that Member States encourage the measurement and reporting of KT activities at the PRO level and put in place mecha-nisms to monitor and review this information, including its dissemination to other Member States. It also encourages PROs to monitor their own intellectual property (IP) management and KT activities using appropriate metrics. The composition of the Expert Group is shown in Annex 1. The Commission invited individuals to take part as experts (but not as representatives of their organisations) on the basis of three criteria. The first criterion was a personal KT competence with ei-ther a policy perspective from public administration, a hands on perspective from knowledge transfer or administration of knowledge transfer offices (KTOs), or a re-search perspective from studies of KT. The second criterion was to have informal direct links to KT players, among them agencies/organisations responsible for na-tional surveys and European KT organisations like ProTon Europe and the Associa-tion of European Science & Technology Transfer professionals (ASTP). Thirdly, within a population of experts thus identified, a proper geographical balance was 1 A public research organisation (PRO) is here any organisation that as part of its mission on a regular basis performs research (and experimental development) and regularly receives public funding for this. This typically includes universities and other research oriented higher education institutions, non-profit research organisations, and research hospitals, both in the public and private sectors. See also the defi-nition of a research organisation by the European Commission (2006).

2
aimed at. Furthermore, the Expert Group has consulted with a wide range of external experts representing complementary insights and perspectives to those already pre-sent. These experts, too, are listed in Annex 1.
1.2 Deliverables of the knowledge transfer metrics Expert Group The Commission has motivated the project through four tasks. To solve these tasks in the best possible way, the Expert Group has focused on building consensus between all those perspectives present in the group and identifying good practices likely to be endorsed by bodies carrying out KT surveys. With that in mind, the group has very carefully considered the scope of indicators to be used for monitoring knowledge transfer activities and built consensus regarding which of them should be recom-mended for collection in KT surveys. The four tasks were stipulated through the terms of reference, which also gave the Expert Group considerable flexibility in its work. The tasks are presented below as originally formulated and juxtaposed with Expert Group defined deliverables. 1) Existing indicators “Identify, review and structure the existing indicators for which data are regularly collected regarding knowledge transfer activities performed by European PROs (in-cluding universities), either through EU-wide (ASTP, ProTon Europe, etc.) or na-tional surveys; assess the relevance of these indicators and, where appropriate, of any additional indicators considered relevant but not being currently collected.” The Expert Group has identified, reviewed and structured existing indicators used by national and international KT surveys, see Chapter 3 (and Table 6.2). From these, a core subset has been selected and structured, based on an analysis in Chapter 4 of how to improve comparability. These selected indicators are presented together with uni-fied definitions of relevant concepts and commentaries in Chapter 5, which is the cen-tral chapter of the report. 2) Strategic orientations “Develop on this basis a set of strategic orientations regarding the directions in which the European knowledge transfer benchmarking systems should be encouraged to evolve in order to maximise complementarity and coherence (choice of common indi-cators, definitions, methodologies, etc.), in particular with the objective to make it possible to obtain a global overview of knowledge transfer activities across the Euro-pean Union, covering as many countries as possible.” The Expert Group found it necessary to work on several time horizons. In the short run, the objective has been to align the core set of indicators measured by existing periodical surveys. The basis for this is found in Chapters 3 to 5. In the long run, it seems appropriate to widen the scope of channels of knowledge transfer monitored. To do this would probably require not only defining additional sets of indicators but looking at additional data sources to those covered by existing periodic surveys. Fur-ther research in the matter also seems required. A broadening of the numbers of PROs and countries covered would be another long run concern. The long range pointers are found in several chapters.

3
3) Operational arrangements “Suggest concrete operational arrangements, likely to be endorsed by bodies carrying out surveys, regarding actions to be undertaken to promote and facilitate cooperation between the various data collection activities, with a view to moving towards more consistency, compatibility, complementarity and, where appropriate, integration of tasks (so as to remove possible duplication of work, and to avoid that certain PROs need to answer several surveys); recommendations should also be made to improve regularity and rates of response to surveys.” The Expert Group has worked closely together with leading organisations and agen-cies collecting data for existing surveys, to secure the highest possible compatibility between parallel national and international surveys and to improve response rates, also making the pooling of results possible. Issues related to pooling of results are found in Chapter 6 and operational arrangements are dealt with as implementation issues in Chapter 7. 4) Unified database “Provide the Commission with a unified database containing detailed data assembled from the largest possible number of existing surveys (relating to the latest year for which data are available for most of them). While such database should contain data at institution level, the institutions can be anonymised, i.e. it is not necessary that their identity be mentioned. The Commission will not make these institution-level data public; only aggregate data may be published.” This task could not be performed as requested because of confidentiality clauses in several existing surveys. The nearest available solution was developed, which made it possible to report publicly disclosed data at the level of individual PROs or KTOs along with aggregated data for countries where data from at least three PROs were in the dataset. The data are displayed in Annexes 3 and 4 and the methodological issues, particularly how to avoid double counting when merging overlapping datasets, are dealt with in Chapter 6. In interpreting these data, it is imperative to understand that there are differences in definitions between surveys, hence the data are not directly comparable, and that the coverage varies greatly between countries, hence the margin of error may be very great in many cases. Chapter 8 rounds up the report by collecting the recommendations. Additional an-nexes not mentioned above contain definitions of recurring acronyms and terms (An-nex 2) and a list of references (Annex 5).

4
Chapter 2 What is knowledge transfer, and how can it be measured?
2.1 From technology transfer to knowledge transfer There are close to 1,400 technology transfer offices (TTOs)2 in Europe (Inno et al., 2004). Many started as industry liaison offices and also developed services for PRO personnel to encourage commercialisation of research results. Over time, many of these have developed specialised staff and services for assessing disclosed inventions, patenting, licensing, and developing and funding spin-offs and other start-ups3, but also for actively approaching firms for contract based arrangements (projects and transfer deals). With Bayh-Dole type legislation implemented in many countries, uni-versities were required to exercise an IP policy, focusing on patenting and licensing, and the number of TTOs grew4. An OECD study also helped establish technology transfer (TT) conceptually as primarily concerned with IP management (“to identify, protect, exploit and defend intellectual property”) (OECD, 2003 p. 37). Later, the term knowledge transfer has been established as a broader and more en-compassing concept, and all TTOs now belong to the slightly larger group of knowl-edge transfer offices (KTOs). The scope is broadened in several ways. Technology is not the only field of knowledge for which transfer is considered important, commer-cialisation and economic impacts are complemented by social, cultural, and personal benefits on the output side, and there are other useful forms of transfer than those re-quiring strong IP protection. For a structured overview of the field of knowledge transfer, it helps to think in terms of
• in what forms knowledge can be carried (and transferred) • through what channels or mechanisms knowledge transfer can take place • how transferred knowledge is turned into benefits, and by whom • what strategies are appropriate for different channels, and how PROs can or-
ganise their knowledge transfer activities. This structure will also help identify useful metrics.
2.2 Forms of knowledge There is no universally accepted definition of knowledge. However, for our purpose it is helpful to identify major forms in which knowledge can be carried and hence trans-ferred: 2 The Inno study actually used the term technology transfer institution (TTI), which is slightly broader; for example, some science parks were included. 3 The Expert Group has chosen to use the word ‘spin-off’ for a firm established on the basis of formal knowledge transfer from a PRO and the word ‘start-up’ for any new firm established involving PRO staff or students. Thus the former is a subset of the latter. These words are used inconsistently between surveys. 4 The Bayh-Dole act in the US, adopted in 1980, permits universities to pursue ownership of an inven-tion and other intellectual property resulting from research funded by federal government.

5
• as codified knowledge, expressed through language (including mathematics), for example as scientific literature or patents
• as internalised by people who have acquired codified knowledge and know-how through study, instruction, and experience, for example graduates or ex-perienced researchers leaving their institutions to work in an enterprise that they may (but need not) have set up themselves
• as embedded in artefacts more or less ‘ready to use’ such as machinery or software or new materials or modified organisms; often called ‘technology’.5
In the field of knowledge transfer, it is customary to distinguish between two forms of codified knowledge: publications, where copyright protects how ideas are expressed but not the ideas themselves, and patents, which grant exclusive rights to use the in-ventions explained in them. Whereas scientific articles and patents precisely describe new pieces of knowledge, people also carry with them tacit knowledge derived from experience and they are able to integrate large volumes of knowledge and hone it to-wards specific fields of practice. Artefacts make up the fourth major form in which knowledge is usually transferred, also embodying integrative knowledge beyond that formalised in their description.
2.3 Channels of knowledge transfer Knowledge transfer takes place in channels of interaction between PROs and other actors. Knowledge can be produced, mediated, reproduced, acquired, and transformed in and between the different forms through these channels. This understanding is in line with modern views of innovation as mostly interactive learning processes – where learning includes the generation of new knowledge as well as the integration of knowledge from external sources. A typical (but not exhaustive) classification of channels is listed below, named after activities or mechanisms of knowledge transfer. This particular list is of interest because it stems from a recent consensus exercise between universities, funding agencies and the business community on the future de-velopment of metrics for knowledge transfer, commissioned by UNICO in the UK (Holi et al., 2008).
• Networks • Continuing professional development • Consultancy • Collaborative research • Contract research • Licensing • Spin-outs • Teaching • Other measures
5 Another form is important for considering successful knowledge transfer but less important as a trans-ferable form in itself: knowledge institutionalised in norms and behavioural patterns, routine or other-wise, in activities that require organised collaboration, whether in a research laboratory or in an enter-prise or between them or even in a region successfully specialising in a particular industry. These forms are simplified and adapted from studies synthesised by Blackler (1995), a study which later has given rise to a prolific literature. In the following, the focus lies on transfer with a potential economic impact.

6
Other channels may include publishing (and reading!) through scientific or popular media, movement of people (recruitment, temporary secondment, double positions in industry and PROs, student placement, etc.), and sharing of facilities. It is also customary to distinguish between informal channels, such as networking, access to publications, and recruitment of personnel, and formal channels (involving a contract between the PRO and the firm), such as secondment, paid projects (collabo-rative research, contract research, consulting, etc.), licensing, and ventures (spin-offs).
2.4 From knowledge to benefits The road from knowledge to benefits can be short or long. Sometimes benefits are immediate, such as when a person reads a publication and arrives at a sudden insight. Economic impact in terms of jobs, turnover and profit from a PRO based invention can require massive efforts by innovators outside the PRO sphere and require large resources. The risk of failure can be high and is influenced by very many factors, as in all innovation processes. The processes are often very complex and the role of the researchers, the PRO, and the original piece of knowledge can vary immensely. It is therefore frequently difficult to calculate the economic impact of a particular piece of knowledge, and its share of a success may be very difficult to determine, even after the fact. Even if one restricts attention to knowledge transfer to business, the picture has many facets. The frequency of use, strategic importance, and transfer quality for each chan-nel varies between industrial and scientific sectors, and depends on firm size and strategy as well as availability of services offered by the relevant PROs or KTOs. A study of Dutch university/industry relationships found that the relative importance of channels varied significantly by disciplinary origin and tacitness, systemic qualities, and breakthrough character of the knowledge field Bekkers and Freitas, 2008). A study of over 700 Andalusian firms found channel selection strategies of firms to be clustered as shown in Table 2.1.

7
Table 2.1: Channel selection and combination strategies in Andalusian firms Groups of enterprises Share Enterprises actively engaged in exploiting intellectual property 7.2% Enterprises actively engaged in institutional cooperation 3.0% Enterprises that actively use university facilities 5.6% Enterprises that receive trainees 9.2% Enterprises actively engaged in generating and using knowledge as well as collaborating with university personnel
9.0%
Enterprises that participate in the generation and use of knowledge at a less intensive level 6.1% Sum enterprises engaged in interaction with university (N > 700) 40.1% Notes for Table 2.1: The grouping is achieved using factor analysis and cluster analysis, hence each firm is placed only in the category where it fits the best. The sample was selected among companies that had received some form of public support for various purposes, thus the high total level of interaction with universities. Similar interaction levels with PROs are reported among ‘development oriented’ SMEs in Norway (Finne and Hubak, 2004; Finne, 2007; N ≈ 1,200 in each study; even micro firms (less than ten em-ployees) showed a similar propensity in the latter study). Source: Ramos-Vielba et al. (2008). Both of the two final categories in this Spanish study include collaborative research, contract research, and consultancy. For these firms, it seems less important to distin-guish between the three forms. Many firms use multiple channels and Grimpe and Hussinger (2008) report that the use of both informal and formal methods of collabo-ration between firms and universities increases firm performance more than only us-ing informal methods or only using formal methods6. Empirical research by Cohen et al. (2002) for the United States and Arundel and Ge-una (2004) for Europe found that large R&D intensive firms rank ‘open science’ channels such as publications, conferences, and informal contacts as a more valuable mechanism for obtaining information from universities than patents. However, the two mechanisms are likely to be frequently linked, as when firms use open science channels to identify interesting research and then license the results.
2.5 Measuring knowledge transfer To measure the amount of knowledge transferred from a PRO is virtually impossible. There are two commonly used alternatives. One is to estimate the value of the knowl-edge transferred in its different forms. The assessment of cultural, social, and personal value of knowledge is in its infancy, but quite some effort is put into estimating its economic value. Here, the dominant approach is to equate this value with its price – what someone is willing to pay for it. For knowledge in the making, the most com-mon price is the cost of attempting to produce it through research. For knowledge already in codified, personal, or embedded form, the pricing depends partly on the IP strategy of the PRO. One strategy is to put codified knowledge in the public domain, only requiring academic credit when it is later used. In these cases, the value may not be related to the transfer price at all. Another is to negotiate a price for a license to use it, depending on the future value that a prospective customer expects it to have, possi-
6 Based on an analysis of the Mannheim Innovation Panel of 884 firms. Performance is measured by the percentage of total sales from innovative products introduced in the previous three years.

8
bly also payable as future options (e.g. through equity shares in new firms, which ac-tually postpones the valuation process to some extent). The other common approach is to measure not the knowledge but the transfer: to count the number of manifestations of knowledge transfer as activities in various transfer channels. The number of spin-off firms and the number of lectures given in network seminars are examples using this approach. These measures are diverse (so they cannot be added across channels) but at least they give a picture of the transfer activities that the PROs are involved in. In some channels a sequence of identifiable and measurable events has been defined. In the licensing channel, such a sequence includes the numbers of invention disclosures, patents applied for, patents granted, and licenses issued (often on the basis of granted patents). Events early in the chain can then serve as leading indicators for those further down. The above-mentioned UNICO study proposes for each channel a set of measures of quantity measuring the immediate transfer activities and a set of measures of quality indicating longer run effects of those activities, for example the number of research contracts and the num-ber of repeated contracts between the same partners (Holi et al., 2008). Some studies are looking more explicitly at the value created in society at large by PRO activities. These studies are less concerned with the value of knowledge transfer per se. This is a clear advantage if one is interested in the value of public investment in the PRO sector. For example, one study shows that the total economic impact of the University of Cambridge is several times the public input funding (Library House, 2006). It is, however, less useful for developing the individual channels of knowledge transfer. In general, it is difficult to distinguish the contribution of the transferred knowledge from the contribution of the input of social or commercial actors in creat-ing an economic or social impact. This makes it prudent to measure knowledge trans-fer without making any strong claims to their direct link to value creation.
2.6 Metrics, incentives, policy, and strategies It is important that incentives reflect public policy and are not determined by available indicators, because incentives can have a strong influence on PRO strategy. Even if only used for benchmarking, an indicator may send a strong signal to interested par-ties, including PRO administrators, to try to improve performance on this indicator. Metrics should therefore be used with caution, since more is not always better. The number of patent applications and the number of spin-offs established are two relevant indicators. If seen in isolation, it may be bad public policy but good KTO strategy to maximise these for a given supply of resources for KT activities. A ‘sub-prime’ patent (Harhoff, 2008) and a non-viable spin-off may cost more to launch than the benefits that will accrue, and certainly more than the revenue they will generate for the PRO, even though incentive funding might more than cover the costs of the KTO. Thus the quality of patents and spin-offs may in fact be more important. How-ever, these are much more difficult to define or measure at the time of decision, and quality decisions depend on accumulating relevant skills among the relevant profes-sionals and probably on a minimum deal flow and level of experience in the individ-ual KTO. Nevertheless, these numbers play an important role in comparing perform-

9
ance from one year to the next (and between institutions), given information about other aspects of the activity. Cullen (2007, 2008) has characterised knowledge transfer activities along a scale ac-cording to whether the objectives lie in knowledge sharing (production of a public good) or financial return for the PRO and collaborating partners. Outreach, such as student placement and networks for small and medium-sized enterprises (SMEs), is important to the community but its full cost cannot be borne by the participating en-terprises. Collaborative and contract research and consultancy are important ways to transfer knowledge interactively, while at the same time getting paid. It also helps in giving new research relevance and direction. Licensing of patents or other protected IP, as well as venturing activities (investing in spin-off companies, etc.), requires other skills and resources, and a proper portfolio could generate significant revenue to the PRO over time. Cullen argues that all these activities result in knowledge transfer but that the university’s reason for undertaking each of them is different and that the required skills, the financing modes, the risks, and the potential financial returns to the university differ across these activities, making it necessary to consider them sepa-rately in both strategic and operational terms (objectives, funding mechanisms, and measures of success). This has consequences for how knowledge transfer is organised and subsequently for how it can be measured. There are good reasons for allocating specialised skills and resources to handling pat-enting, licensing, and formation of spin-off companies because these are so different from the normal research and teaching activities of PROs. This is why many TTOs were established in the first place, why the professionalization of technology transfer is such an issue (with professional organisations steadily growing), and why the Euro-pean Commission recommends that PROs share KTO facilities when appropriate (C(2008)1329). With this specialisation, however, there may come an inward focus on the KTO. If it has a choice between maximising its own revenue and the benefit for society, the choice may lean towards the former unless a suitable strategy is in place. This could be the case, for example, in the choice between exclusive licensing, non-exclusive licensing, and free licensing7. There is also a danger that only providing indicators for formal methods of transfer-ring knowledge could, at least in the long run, inadvertently encourage formal meth-ods such as patents at the expense of open science mechanisms such as publications. So far, however, formal KTO activities do not seem to have reached a saturation level. This suggests that the policy community needs to find a balance between promoting formal knowledge transfer methods based on IPR and licensing and informal methods of open science. Unfortunately, we are currently not in a position to specify such a balance. What can be hoped for in the short to medium term is a better understanding of the range of productive balances. Summarising, we point to Figure 2.1 for an illustration of the actors and channels of knowledge transfer for the production of benefits in the economy and the broader so-
7 See also Chapter 5.4 for a discussion of exclusive licensing.

10
ciety. Although the greater flow of knowledge is from left to right in the illustration, it is sometimes the interaction itself that is the basis for producing new knowledge.
Figure 2.1: Knowledge transfer from PROs8 Conspicuously absent from the illustration is the flow of money. As we have dis-cussed above, a balance between the needs of society, individual firms, PROs, and KTOs is required in order to ensure the best use of knowledge produced in PROs. Financial incentives therefore obviously go into the equation. However, that aspect is outside the scope of this report. At the time being, the overarching and commendable goal for most policy initiatives seems to be to simply make more of this knowledge readily available for productive use also outside the PRO sphere itself.
2.7 Identifying appropriate metrics Figure 2.1 shows a multitude of channels for knowledge transfer. The Expert Group’s strategy has been to mainly use existing surveys to select channels for which to ap-proach the question of metrics. By and large, these focus on economic value and are frequently restricted to mapping commercialisation of science results. The question of where to find appropriate data is also dealt with (in Chapter 3.1). As far as the value for cultural, social, and personal development of knowledge transfer, the existing ef-forts to measure them are scant and we shall have to leave it to others to strengthen that side.
8 This illustration is inspired by Kevin Cullen; see Holi et al. (2008).

11
Chapter 3 Surveys of knowledge transfer
3.1 Introduction: Potential sources of data on knowledge transfer Information on the flow of knowledge in the form of publications, patents, artefacts, and people9 from PROs through various channels to firms and others can be obtained from bibliometric and patent research, surveys (or records) of firms or other users of PRO research, and surveys (or records) of PROs, PRO staff, or KTOs that serve these institutions. Bibliometric research can identify academic publications produced by the staff of uni-versities or research institutes and the number of citations to these articles. The former is a measure of gross output of research results while the latter is a quality-adjusted output measure. An analysis of patent databases can also identify patents filed by the public research sector, although this method will underestimate output, as it will miss patents in countries where individual staff can own the patent or when patents are directly assigned to firms. Neither bibliometric nor patent counts are measures of knowledge transfer, since there is no information on whether or not the article or pat-ent is read by firm employees, or even if read, has any influence on firm activities. A better transfer measure is counts of joint public-private sector publications (Narin et al., 1997) or patents (Jaffe et al., 1993), which establish the existence of linkages be-tween the two sectors. Neither of these will in any case capture transfer of non-published research results. Systematic studies of flows of technology (knowledge embedded in artifacts) are rare but can be done (Hauknes and Knell, 2008), although the links back to the originating PROs can be difficult to establish. Promising studies exist at the regional level (e.g. Best, 2005). Systematic studies of transfer of people (except secondments and student placement) can in some countries be based on detailed register data for employers and employees. More common approaches will include labour force surveys of new graduates and, for secondments, student placements, and migration of staff, PRO re-cords (including records kept by specialised mobility projects) or surveys. Surveys of the users of public research results can target firms, other research organi-sations, non-profits, or governments. Almost all surveys are aimed at firms and follow the Oslo Manual guidelines for innovation surveys (OECD, 2005). Most of these sur-veys collect two types of data from firms: the importance to innovation of knowledge obtained from the public research sector, and the percentage of firms that collaborate on innovation with public research organisations. These questions are included in the Community Innovation Survey (CIS) in Europe and similar surveys in Australia, Can-ada, Japan, Korea and New Zealand. Due to space constraints, surveys based on the Oslo Manual rarely ask about other methods that firms use to access knowledge pro-duced by the public research sector, such as reading publications, informal contacts, hiring new PhDs, or licensing inventions. Some of these details, including questions on the type of knowledge obtained, have been asked in specialised surveys, such as
9 People may be PRO employees, students, graduates, or outsiders interacting with PROs.

12
the PACE survey in Europe (Arundel et al., 1995) or the CMS survey in the United Sates (Cohen et al., 2002)10. An alternative method is to survey KTOs that manage the formal knowledge transfer activities of public research organisations. As shown in Chapter 2.1, most KTOs pro-vide a range of services. Due to these responsibilities, KTO managers can provide reasonably good quality data on public science discoveries that might have commer-cial potential (through counts of invention disclosures and patents) and on the actual use of public science outputs by commercial firms, either through licensing or the establishment of spin-offs. However, not all KTOs handle the full range of formal technology transfer activities. One large study found that two-thirds offered spin-off assistance, 60% handled con-tract research, and only half handled patenting and licensing (although EU 15 institu-tions were significantly ahead of institutions in the other 15 countries) (Inno et al., 2004). Slightly less than one-third of KTOs in Europe also manage seed capital funds and incubator facilities (Arundel et al., 2008). Furthermore, many KTOs might not handle all of the patenting activities of their affiliated universities, particularly when the inventor owns the right to the intellectual property, as in Italy (Lissoni et al., 2008), or when the filing is left to collaborating firms. And some PROs don’t have specialised KTOs because they were designed to be interfaces between universities and industry in the first place, focusing on applied research projects. Where KTOs do provide most services, however, a survey of KTOs can significantly reduce the cost of obtaining data on knowledge transfer activities from public research organisations to firms because there are far fewer of the former than of the latter. Ac-cording to ERAWATCH (2008), the 27 Member States of the European Union have an estimated 864 public and 54 private universities (for a total of 918) and 1,850 other tertiary education institutions such as technical colleges. Research activities are con-centrated in less than 500 of these institutions, most of which are public universities. The same report estimates that there are 625 universities in the United States that per-form research and experimental development (R&D). Even if each European univer-sity was served by their own KTO, almost all knowledge transfer by universities through formal methods such as licensing IP could be captured from a comparatively small survey of 500 KTOs. The ITTE study identified close to 1,400 technology transfer offices in Europe, which probably gives a maximum estimate of the number of KTOs that would need to be surveyed to capture the knowledge transfer activities of universities, other higher education institutions, research hospitals, and other public research organisations. Where PROs or authorities generate relevant data on the basis of required reporting, these data can of course be used instead of surveys. The UK provides an example where universities collect data on a broad range of indicators which are strongly linked to a funding stream. These data are generated and thus collected by several offices in each university. Although it is more complicated to collect data from sev-eral sources, this may be necessary in the long run if a wider spectrum of indicators is to be collected. 10 The sister PACE and CMS surveys for Europe and the United States respectively asked about the type of knowledge (basic, applied, research tools, etc.) and the channels used to obtain the knowledge (contracts, reading the literature, attending conferences, etc.).

13
An alternative is to survey researchers at PROs directly, which might be useful where KTOs do not offer a full range of services. In addition, this type of survey could gather some types of data that may not be available from KTOs. However, this could be substantially more expensive than surveying KTOs, due to the large number of research staff that would need to be contacted. A survey of KTOs also has other bene-fits in providing them with performance benchmarks and other information that they can use to improve their services. In comparison, there are an estimated 1.3 million firms in the EU 15 alone with more than 10 employees. The Community Innovation Survey (CIS) samples approximately 250,000 firms in Europe, even after using stratified sampling techniques in many countries to reduce the survey size. In addition to the size of the survey, using the CIS to identify formal knowledge transfer activities such as licensing would not be effi-cient, since the vast majority of European firms do not license knowledge from the public research sector. A large number of firms would therefore need to be sampled for each positive response.
3.2 Surveys of KTOs
3.2.1 Overview The US based Association of University Technology Managers (AUTM) has sur-veyed American universities, hospitals and research institutes on their formal knowl-edge transfer activities since 1993 and published annual data for fiscal years (FY) 1992 to 2006 inclusive. To a large extent building on this survey series as a standard, many more recent initatives are now in operation. Table 3.1 summarises the characteristics of recent KTO surveys in Australia, Can-ada11, the United States, and in eight European countries (Denmark, France, Ireland, Italy, Norway, Spain, Switzerland, and the UK). Gulbrandsen and Rasmussen (2008) provide results for Norway for 1998 to 2004 combined, but only note that the data were collected from a ‘number of different sources’. Austrian PRO patent records are maintained but not published, and are therefore not included in the table. Two sepa-rate surveys by ASTP and ProTon Europe have collected data from multiple European countries. For example, the ASTP FY 2007 survey12 obtained responses from public research organisations in 22 European countries, while the ProTon Europe FY 2006 survey covered four countries extensively through collaboration with national net-works and also obtained responses from PROs in several other European countries. The two one-off surveys of OECD (2003) and ITTE (Inno et al., 2004) and the spe-cialised PACE and CMS surveys have not been included in the table.
11 Statistics Canada ran a KTO survey between FYs 1998 and 2004. The 2004 survey obtained re-sponses from 86 universities (83% response rate) and from 33 hospitals (63% response rate) (Read, 2006). This is much larger than the AUTM Canada survey for 2005, but the Statistics Canada survey does not appear to have been repeated after FY 2004. 12 Most studies collect data for one year, mostly the fiscal year (FY) for each institution ending in the calendar year before the data are collected.

14
Table 3.1: Periodic or potentially periodic surveys of knowledge transfer activities in public re-search organisations Units surveyed
Country Most recent survey title Surv
ey
orga
nisa
tion
Publ
icat
ion
year
Ref
eren
ce y
ear1
Firs
t yea
r da
ta
avai
labl
e2
Res
pons
es
Uni
vers
ities
Oth
er P
RO
s
Hos
pita
ls
Denmark Public research commercialisation survey - Denmark 2007
DASTI 2008 2007 2000 13
France Les activités de valorisation dans les établissements universitaires français - Enquête 2005
CURIE 2006 2004 2000 74
Ireland3 University collaboration on technology transfer: An all-island feasibility study
Inter-Trade
2006 2004 - 05
2004 - 05
8
Italy La valorizzazione della ricerca nelle università italiane
NetVal 2007 2006 2003 61
Norway Indicators for the commercialisation of research: The case of Norway
NIFU STEP
2008 1998 -
2004
1998 16
Spain Informe de la encuesta RedOTRI 2007
Red-OTRI
2008 2007 2003 60
Switzer-land
Swiss technology transfer - report 2006
swiTT 2008 2006 2005 19
UK4 Higher education-business and community interaction survey 2006-07 (HE-BCI)
HEFCE 2008 2006 - 07
1999 -
2000
162
UK4 Fourth annual survey of knowledge transfer activities in public sector research establishments (PSRE)
Techno-polis for DIUS
2008 2006 - 07
2003 - 04
138
Australia National survey of research commercialisation 2003 and 2004
Austra-lian Gov’t5
2007 2004 2003 - 04
138
Canada AUTM Canadian licensing activity survey: FY2007
AUTM 2008 2007 2000 40
USA AUTM U.S. licensing activity survey: FY2006
AUTM 2008 2007 1991 194
Europe The ProTon Europe fourth annual survey report (fiscal year 2006)6
ProTon Europe
2007 2006 1991 189
Europe Final results of the ASTP survey for fiscal year 2007
MERIT for ASTP
2008 2007 2003 325

15
Notes for Table 3.1: 1. Reference year for the collected data from the most recent survey. 2. Reference year for the oldest data set reasonably comparable with the most current survey. 3. Forfás is planning a new survey for Ireland. 4. HEFCE (Higher Education Funding Council for England) surveys universities on behalf of itself and its sister organisations in the UK. Technopolis collects data for non-university PROs on behalf of the Department for Innovation, Universities and Skills (DIUS). UNICO, a UK association of knowledge transfer professionals, has also conducted member surveys, most recently for 2005. 5. Department of Education, Science and Training (DEST) of the Australian government. 6. The ProTon Europe survey is a collaborative survey and includes results for Denmark, Spain, Italy and the UK. Results for these four countries are listed separately in this table. The FY 2006 survey by ProTon Europe also collected results for 17 universities in other countries. Sources: DASTI (2008), Bach et al. (2006), Piccaluga et al. (2007), Gulbrandsen and Rasmussen (2008), Conesa et al. (2008), Fesch and Clerc (2008), HEFCE (2008), DEST (2007), Tieckelmann et al. (2008), Flanegan and Glavicic-Théberge (2008), ProTon Europe (2008), Technopolis (2008).
3.2.2 Core indicators The AUTM surveys have consistently collected data over the years for three indica-tors for the potential commercialisation of public science:
• invention disclosures • patent applications • patent grants
and three indicators for the use of public science by firms:
• number of licenses executed • number of spin-offs13 established • gross license revenue.
Almost all other surveys have followed the AUTM in collecting data for these six core measures of knowledge transfer activities. In addition, it will be shown below that many surveys have managed to collect data on an important aspect of joint PRO-industry project work:
• research agreements with firms. These will subsequently be named the seven core indicators.
3.2.3 Non-core indicators In addition to collecting data on the seven core activities, many surveys also collect a wide spectrum of data, but not consistently across all surveys. Table 3.2 identifies indicators that are collected by at least two surveys, with all seven core indicators in-tegrated (and marked with an asterisk). Examples include KTO staffing levels, US patenting activities, data on the licensee (location and size), the type of license (exclu-sivity measures, etc), and the share of license income from software or from patents. 13 AUTM uses the word ‘start-up’ for the concept defined in this report as ‘spin-off’.

16
Table 3.2: Variables of interest with data collected in two or more KTO surveys
Survey/Country
Indicators1 * precedes core indicators A
UT
M U
SA/C
anad
a
DE
ST A
ustr
alia
HE
-BC
I UK
PSR
E U
K
swIT
T S
witz
erla
nd
C.U
.R.I.
E. F
ranc
e
ProT
on E
urop
e
Red
OT
RI S
pain
Net
Val
Ital
y
DA
STI D
enm
ark
AST
P E
urop
e
(1) KT office resources KT office start year KT office staffing level (FTEs2) Commercialisation costs / KTO budget Fees, legal costs / IP protection costs (2) Research Research expenditures Research employment (FTEs) * Research agreements3 Gross contract value (3) IP * Invention disclosures * Patent applications (priority) EPO patent applications USPTO patent applications * Patent grants EPO patent grants USPTO patent grants Currently active patents (4) Licensing * Licenses (LOAs4) executed Licences with spin-offs5 Licenses with small companies Licenses with large companies Licenses with non-commercial org’s Exclusive licenses Nonexclusive licenses Software licenses6 Currently active7 LOAs Currently active LOAs yielding income (5) Spin-off creation and equity * Spin-offs (and/or start-ups) Currently active spin-offs Spin-offs with PRO/KTO equity Currently active spin-offs with P/K equity Est. employ. in currently active spin-offs Est. turnover of currently active spin-offs

17
Table 3.2: Variables of interest with data collected in two or more KTO surveys Survey/Country
Indicators1 * precedes core indicators A
UT
M U
SA/C
anad
a
DE
ST A
ustr
alia
HE
-BC
I UK
PSR
E U
K
swIT
T S
witz
erla
nd
C.U
.R.I.
E. F
ranc
e
ProT
on E
urop
e
Red
OT
RI S
pain
Net
Val
Ital
y
DA
STI D
enm
ark
AST
P E
urop
e
(6) Revenues * License income earned License income from patents License income from software License income from other IP Legend: – survey designed to collect these data; – planned for later editions. Notes for Table 3.2: 1. The comparison is made on basis of the latest readily available full questionnaires (see sources). Because questions and definitions vary between surveys, the names of many indicators are more gen-eral than those used in surveys. For the same reason, the analysis is indicative rather than definite. A selection of definitions of core indicators are compared in Table 6.2. Not all data are available. 2. FTE: Full time equivalent. 3. The number of research agreements and the gross contract value may or may not include collabora-tive research, contract research, consultancy, projects without users, and other kinds of projects, and in some cases it is limited to the contracts managed by the KTO. 4. LOAs: Licenses, options and assignments. Most surveys do not include assignments in this count; some distinguish between licenses and options. See Table 5.3 for definitions. 5. Not all surveys distinguish between spin-offs and start-ups, and the wording differs. See Chapter 2.1. 6. Many surveys that distinguish software licenses, also distinguish material transfer agreements, utility models, and others. 7. ‘Currently active’ refers to the stock of active items at the end of the year, regardless of year of ori-gin. All other variables concern the activities in the reference year only. Sources: Questionnaires as found in Stevens et al. (2005) for AUTM, DEST (2007), HEFCE (2008), Technopolis (2008) for DIUS, Fesch et al. (2008) for swITT, Bach et al. (206) for C.U.R.I.E., ProTon Europe (2008), Conesa et al. (2008) for RedOTRI, Piccaluga et al. (2007) for NetVal, DASTI (2008), Arundel and Bordoy (2006) for ASTP.
3.2.4 Differences between KTO surveys In addition to differences in the types of questions that are asked and the types of in-stitutions that are covered, KTO surveys differ across other characteristics. Target population: As shown in Table 3.1, all of the surveys collect data on the knowledge transfer activities of universities, but only half of them also collect data on other types of relevant research organisations, such as hospitals, government research organisations, or private non-profit research institutes. Voluntary or semi-mandatory: Most surveys are voluntary. The HE-BCI and DASTI surveys are not mandatory (required by law), but a response is required for eligibility for some types of government funding, resulting in a 100% response rate. Confidentiality: A few surveys, such as the HE-BCI and DASTI surveys, publish core indicators for all respondents. Other surveys offer confidentiality. In the ASTP FY

18
2006 survey, 67% of the respondents did not agree to make their results public. The Spanish survey publishes results on some indicators from those institutions (50%) that have agreed to this. The AUTM survey offers also offers confidentiality, an offer which is declined by well over 95% of the participating universities. Discussions with KTO managers show that some data are considered more sensitive than others, par-ticularly the KTO’s budget, salary expenditures14, and profit. Unfortunately, confiden-tiality prevents the use of the results by third parties for analysis, for instance to iden-tify factors that improve outputs. It also limits the possibilities for individual KTOs and PROs to benchmark themselves against others. In practice, for confidential sur-veys, the only publicly available results are the types of analyses and aggregated data provided by the survey organisation. However, not offering confidentiality in volun-tary surveys could seriously reduce response rates. Purpose and use of data: The great variety of questions asked in these surveys is not only a matter of adaptation to different national institutional contexts or a lack of co-ordination, but also due to how the data are used. HEFCE’s annual HE-BCI survey of all universities in the UK that receive public funding is intrinsically locked into the funding system of university research. The scoring system for funding uses a large number of indicators in addition to those describing knowledge transfer activities. In Denmark and Austria, authorities use the data as inputs to policy and funding deci-sions, but not in a direct manner. ProTon Europe has a fairly large survey instrument that is influenced not only by a wish to monitor certain knowledge transfer activities over time, but also by the interests of academics researching knowledge transfer is-sues. ProTon Europe’s choice of questions is also influenced by their co-operation with several national survey organisations with their own requirements, ranging from providing KTO managers with benchmarking data to collecting data of interest to universities and policy makers. ASTP’s instrument is aimed at providing KT profes-sionals with data for benchmarking and is kept short to reduce reporting effort. The possibility to benchmark one’s own institution against others, even if only against average results for other institutions, is an important driver for many surveys and in-deed a motivation for responding to voluntary surveys. KTO managers also say that the collected data are important in discussions with PRO administrations and politi-cians and in strategy work for the individual KTO. Who operate surveys: Pan-European or national professional organisations can ally with academic institutions or consultancies to operate surveys on their behalf, but not all do. Collaboration with national authorities is also found. National authorities can do the work themselves or commission academics or consultants to do it for them. In all cases, it is important to command survey skills, to understand knowledge transfer, and to test survey instruments with actual respondents. Continuity over time as to what individuals operate a specific series of surveys can be of great importance to quality.
3.2.5 What KTO surveys cannot do In conclusion, building on existing KTO surveys seems a good starting point for our exercise. They have indicators (and data) for patenting and licensing, company forma-
14 AUTM (2007a) surveys salary levels for KTO professionals.

19
tion and project work with or for firms. The data are much less available when it comes to teaching and training, networking, mobility of people, open access to publi-cations, and other channels. Furthermore, within project collaboration, some impor-tant channels (notably consulting) are missing, and within company formation, data about companies that do not involve formal assignment of PRO knowledge (e.g. start-ups with staff or students in key roles) are not sufficiently in place. In addition, only the two UK surveys to date collect good economic output indicators for inventions developed in PROs, such as the total sales or number of jobs created due to a com-mercialised invention. This is due to the difficulty of collecting comprehensive output data, since KTOs lack the resources to follow the use of all of their licensed inven-tions and their spin-offs over time, even though the KTOs might in fact be the best positioned actors for this task. Instead, a few of the survey organisations, such as the AUTM, provide case histories of commercially or socially successful PRO inventions (AUTM, 2008). AUTM is also working on expanding the variety of knowledge trans-fer channels that it covers in its survey. UNICO’s feasibility study for covering a much broader range of transfer channels (Holi et al., 2008) has arrived at a number of interesting indicators for future use in nine different channels mentioned in Chapter 2.3. About half of their proposed quan-tity measures and none of the quality measures were found to be available from uni-versities in the UK today. Many would require other units than KTOs as targets for surveys. These could be interesting to look at for long term development of indicators in this field.
3.3 Developing comparable results across KTO surveys Almost all KTO surveys collect data annually on the seven core indicators noted above. Other indicators, as shown in Table 3.2, could be of interest, but are not con-sistently collected. Their inclusion in a European set of KT indicators would require agreement between the different survey organisations to collect additional data, and not simply to adjust some of the definitions they already use. Data for two or more years are published for Denmark, France, Italy, Spain, Switzer-land, and the UK, plus the ASTP and ProTon Europe surveys of their members and others in multiple European countries. The availability of annual comparable time series data in other countries is less clear. Therefore, producing comparable results will require not only steps to improve the comparability of questions (addressed in Chapter 4) but also an improvement in survey frequency for many countries. A greater problem is the lack of a national survey for most EU countries, including some that are major contributors to public research, such as Austria, Belgium, Finland, Germany, the Netherlands, and Sweden15. One option would be to improve the coverage provided by the ProTon Europe and ASTP surveys. For example, the ASTP FY 2007 survey collected data from five or more public institutions in Finland (7), Germany (17), Greece (5), Ireland (7), and Norway (10). With the exception of Germany, these results could cover most of the leading universities or research insti-tutes. However, coverage of the new Member States is particularly poor, with the FY
15 A survey is being planned for the Netherlands and a new survey is being planned for Ireland.

20
2007 ASTP and ProTon Europe surveys, respectively, only obtaining results from nine and three public science institutions in these countries. In some new Member States there are less than five leading research institutions, but coverage is still too sparse to provide national performance indicators. The ERAWATCH (2008) results estimate that there are approximately 95 research performing universities in the 12 new Member States. By and large, however, a small set of indicators are collected more or less consistently across a number of KTO surveys, reflecting a shared interest across Europe to monitor knowledge transfer activities with a particular emphasis on patenting and licensing. There is also an interest (but not uniformly defined) in company formation based on intellectual property or knowledge available in or owned by public research institu-tions (spin-offs and other start-ups). There is also an increasing interest in covering other transfer channels, although these are much harder to measure, partly because data are not readily available and partly because of problems of definition. Further-more, the surveys show an additional interest in not only knowledge transfer outputs, but in the activities and assets of the KTOs themselves, which act as value-adding mediators in this process. However, comparability across surveys is currently not guaranteed, neither as con-cerns core indicators nor additional indicators, and this will be the question of the next chapter.

21
Chapter 4 Improving comparability across KTO surveys
4.1 Introduction Even though most surveys collect similar data for the seven core indicators, compara-bility is hampered by minor differences in definitions, plus differences in survey methodologies and methods for presenting results (Arundel and Bordoy, 2008). This makes it difficult, at this time, to provide fully comparable indicators from all avail-able surveys. Comparability issues also depend on whether one wants to aggregate to a European level for comparison with the US, compare countries against each other, compare similar groups of PROs or KTOs against each other, or compare single insti-tutions against other institutions. A number of factors that can reduce comparability, and possible solutions, are discussed below. Some of these issues concern not only comparability but data quality more generally.
4.2 Indicator definitions Apparently minor differences in definitions can result in large differences in results. A good example is for patent grants. The American AUTM survey only asks for patents granted in the United States, based on the reasonable assumption that all inventions by American universities will be patented domestically. In Europe, the situation is very different. A university in the Czech Republic might patent an invention domestically and also in the US, Germany, France, the UK, and Italy. This will result in six patents, but all of them will be for the same invention. This number is not comparable with American results based on patents at a single patenting office. One solution is to ask European KTOs for the number of technically unique patent grants in the previous year. Another problem with definitions concerns the issue of quality versus quantity (Gard-ner et al., 2007). Count data for patents or for the number of spin-offs contain no in-formation on the commercial value of each of them. This issue could be addressed by adding supplementary questions on the share of patents that are licensed and the length of time that spin-offs survive. Since the definition of each indicator is vitally important to comparability, Chapter 5 provides a proposed set of full definitions for each of the seven core indicators plus possible supplementary indicators, as well as a limited discussion of the selected defi-nitions.
4.3 Target populations, samples, and response rates There are often large differences in the knowledge transfer activities and performance of universities compared to other public research organisations. There are also differ-ences in the structure of the research sector across countries. In some countries, such as the United States, a significant share of all commercially relevant research is con-ducted by universities, whereas in countries such as Germany and Australia public

22
and private non-profit research institutes are major players. Only providing results for universities would fail to capture the commercialisation of public science in countries that invest heavily in government and private research institutes. Therefore, both na-tional and international comparability would be improved by collecting data on all types of public research organisations, including universities, research institutes and hospitals, and if results are published separately for universities and for other types of public research organisations. Research on KTO activities shows that the distribution of the seven core indicators is strongly skewed. A small percentage of universities or other public research organisa-tions usually account for the majority of patenting and licensing. For example, the ASTP survey for FY 2007 reports that the top ten percent of universities account for 59.6% of the total number of patent grants and for 73.4% of all license income (Arun-del et al., 2008). Furthermore, research expenditures are concentrated in a small frac-tion of all universities. The AUTM study for FY 2004 (Stevens et al., 2005) reported that the top 100 American research universities accounted for 87% of federal and in-dustry-financed research expenditures by American universities. The level of research concentration is likely to be lower in Europe, but still considerable. Optimally, surveys should cover all universities and other PROs within a country. This would prevent possible biases from preferentially surveying or obtaining a higher response rate from research-intensive institutions that are likely to perform better on the output indicators than second or third-tier institutions. The UK HE-BCI survey solves the problem for the university sector by obtaining results for all units. In contrast, the ASTP and AUTM survey results are likely to be biased towards institu-tions with above average performance, although an evaluation of the respondents sug-gests that the ASTP survey is less biased in this respect than the AUTM survey. KTO surveys can hardly cover PROs not served by KTOs; these PROs may be less likely to have formal KT activities, unless they are themselves set up as contract research or-ganisations with these activities distributed throughout the organisation. Survey costs associated with assessing the situation in a country (as opposed to the situation in individual institutions) could be reduced if indicators are normalised by R&D expenditures16. A census of the leading research institutions (universities and other types of PROs) in Europe would probably capture almost all patenting and li-censing activity. This could be combined with a sample of other units in order to pro-vide accurate performance estimates for an entire nation or by type of institution within a nation. A related issue is the survey response rate. With voluntary surveys, institutions with poor performance could be reluctant to respond if they believe that their results would be made publicly available, possibly leading to a reduction in future funding. Yet a failure to include poor performers in surveys will bias the results and reduce their value for policy. One solution is to guarantee confidentiality.
16 The normalisation issue is discussed in chapters 4.4 and 4.5.

23
4.4 Normalisation by research expenditure and number of researchers A main challenge for producing comparable indicators between countries or institu-tions is to find a relevant denominator to scale or normalise outputs from institutions that vary enormously in size. There are two potential options, the number of research-ers and the amount of research expenditures17. Of the eleven surveys listed in Table 3.2, four currently actually provide data on research expenditures for four surveys (AUTM, PSRE UK, ASTP, and ProTon Europe) and four on the number of research-ers (PSRE UK, RedOTRI, ASTP, and ProTon Europe). An essential step for improving comparability is to obtain high quality data for either of these two normalising variables. In some countries it might be possible to obtain this data at the level of individual PROs from non-survey sources, such as official education statistics for universities. This is the case for several of the countries where national KTO surveys are being conducted. However, if they are not available in time for the analysis of the KTO survey, normalised indicators cannot be published at the same time as the raw indicators, which makes it cumbersome and reduces the prob-ability of normalised indicators being published on an annual basis. Whichever de-nominator is used, it must be carefully defined, since the statistic will be used to com-pute all other indicators.
4.5 Presentation by KTO or affiliated institution Most universities and other PROs have a single KTO, but some have more than one KTO, or several institutions could share a single KTO. Some of course have none, but may still be engaged in active knowledge transfer. This raises the issue of whether or not results should be presented by KTO or by the affiliated institution. Our preference is to present results by the institution, as this permits normalisation by research ex-penditures or the number of researchers. Questions can be added to the survey to iden-tify KTOs that represent more than one institution or KTOs that do not manage all patenting or licensing activities by their affiliated institution. This information can be used to adjust national indicators. In addition, selected results can also be presented by KTO and normalised by the number of KTO staff. This information can be of value for KTOs as a means of benchmarking their activities against their peers.
4.6 Treatment of missing values The comparability of normalised performance indicators based on outputs per unit of research expenditure depends on how each study manages missing values. A missing value occurs when a respondent does not answer a question, such as the number of patents granted in the relevant year. Furthermore, missing data for either research ex-penditures or outputs for a small number of major respondent institutions can distort the results.
17 Research expenditure is not perfect as a normalising variable as it is affected by how expenditures are defined (see Chapter 5) and by a lack of purchasing power parity (PPP) currency equivalents for research expenditures. An alternative is to use units of research time, which would be more detailed, but data on this are probably not available.
24
At the minimum, normalised indicators must be calculated only for respondents that provide both the numerator (i.e. number of patents) and the denominator (i.e. research expenditures). The indicator must not be estimated from summing all patents and all research expenditures among unmatched respondents to each question. Given the highly skewed characteristic of both the numerator and denominator data, a large number of patents could be included for an institute that did not give research expen-ditures. This would produce a large bias in performance for a national indicator. For the purpose of calculating aggregated figures or indicators at the level of a group or a country, missing values can be imputed using other information available on the respondent. Many of the available surveys do not provide full details on the treatment of missing values. Good practice requires full disclosure of the survey response rate, the item non-response rate for each question18, the number of complete responses (numerator and denominator) for each indicator, the aggregation technique, and de-tails on imputation19, if used.
4.7 Data validation All questionnaire surveys contain errors caused by respondents not understanding a question, accidentally filling in the wrong value, or from data entry mistakes after the completed questionnaire is returned to the survey organisation. Standard data cleaning routines available in many statistical packages can be used to identify most errors. When an error is suspected, for example when a response is an outlier or conflicts with other information, the respondent should be contacted by telephone to validate the response. Some survey operators provide respondents with the values they submit-ted the previous year as a reminder and a guide for validation. Very uneven practices between surveys as concerns data validation may reduce comparability.
4.8 Time causality Normalising indicators by using outputs and research expenditures (or the number of researchers) for the same year implies that the outputs are directly due to the reported research expenditures. This is not likely to be the case, with many outputs due to re-search expenditures over several years. This can particularly apply to patent grants, which could be due to research conducted several years earlier. One possibility is to construct indicators after using different lag times for research expenditures, but this might be unnecessarily complex. Licensing income in one year may relate to inputs from multiple years. A simpler alternative is to average research expenditures (or the number of research-ers) over the previous three years. This is only possible if data are collected for the same institutions over time, as in a panel survey. However, normalising by only the 18 The item non-response rate is calculated for each question. It is the percentage of respondents that did not reply to a specific question. It differs from the survey non-response rate, which is the percent-age of the sample that did not reply at all to the survey. 19 The most common imputation method is regression analysis to obtain the expected value of a miss-ing value, given other characteristics of the institution.

25
current year ensures a simple approach with high comparability between surveys, and also between institutions, as long as individual PROs do not grow at extremely differ-ent rates.
4.9 Time series and stability over time Comparability over time is essential in policy development as well as for the devel-opment of individual institutions. The introduction of revised but unified indicator definitions may introduce breaks in existing time series. A common approach in sta-tistics bureaus is to collect data using both old and new definitions for a period of one (or sometimes two) years if it is important to bridge time series well. Obviously, this comes with a cost, particularly as concerns respondents, who may have to provide multiple sets of data. This will have to be considered by each survey operator.
4.10 Who patents? In most EU countries (with the notable exceptions of Italy and Sweden), the IP rights to inventions made by employees in public universities and many other PROS are owned by default by the institution. However, many contingencies can lead to other arrangements, in particular as concerns patenting (DLA Piper and Mason Hayes+Curran, 2007). Consequently, the KTO may not be aware of all patents linked to a university invention. Lissoni et al. (2008) show that universities owned less than 10% of patents granted to Italian academics between 1994 and 2001. This was a pe-riod where the universities had the default ownership (these rights were given to the inventor through a legal reform in 2001 in order to stimulate commercialisation of research results). Firms collaborating with researchers can also sometimes do the pat-enting of inventions made by academic staff. However, as European KTOs develop expertise over the time, the share of university patenting that they are aware of is likely to increase. Surveys can partly address this issue by asking KTO respondents for the share of university patents that they handle, although this might not provide accurate results in the few remaining European countries that give patent rights to academic inventors.20
4.11 Other methodological issues Most surveys relate to the preceding fiscal year, which in nearly all cases is identical to the calendar year. Occasionally, academic years or other definitions are in opera-tion. Standardisation on calendar years would improve comparability; however, other choices are usually well argued by the individual survey owner. This is a minor nui-sance except, perhaps, for institutions responding to surveys with different definitions. For international comparability, the most practical approach is to ask respondents to 20 The ASTP asks respondents for the percentage of all patent applications by their affiliated institu-tions that are managed by their office. In the FY 2004 survey, 29% of respondents reported that some of the patent applications were handled elsewhere. Adjusting the number of patent applications for those handled elsewhere increased the total number of 2004 patent applications, for all respondents, by 6.8% (Arundel and Bordoy, 2006). Italy and Sweden currently maintain the ‘professor’s privilege’ by default (DLA Piper and Mason Hayes+Curran, 2007).
26
panEuropean surveys which definition of a year they are reporting on in their response and to accept differences between countries or institutions. Collaboration between institutions happens and is often encouraged. In these cases, some inventions, patents and other instances of knowledge transfer may be counted more than once. For example, detailed scrutiny has identified 52 of 259 invention dis-closures in Denmark for FY 2006 to be counted twice or more. In small countries it can be manageable to sort this out but in larger economies a centralised counting sys-tem (as opposed to a survey) such as in Austria might be required to handle this prop-erly. Different approaches to this could reduce comparability.
4.12 Conclusions and caveats It is possible to obtain internationally comparable indicators for some aspects of the commercialisation of public science through surveys of KTOs. This would require relatively simple agreement over definitions, improved survey coverage in Europe, and agreement over the basics of the survey methodologies and the presentation of results. This will be the topic of the following chapters. Knowledge transfer through other channels than patenting/licensing, spin-offs, and R&D contracts with users is not measured systematically through KTO surveys. This would at the very least require surveys of firms themselves, although some data could be assembled in the PROs directly. The European Community Innovation Survey (CIS) can provide relevant indicators, such as the percentage of firms that give a high importance to knowledge obtained from public research organisations. These types of indicators should be given equal billing with indicators of formal knowledge transfer activities as far as policy development is concerned.

27
Chapter 5 Recommendations for data to be collected by KTO surveys
5.1 Introduction This chapter provides recommendations for the types of data to be collected in ques-tionnaire surveys of KTOs.21 The Expert Group early decided to limit the recommen-dation to a small number of relevant indicators for which high quality data are readily available. The recommendations are provided in three tables. The ‘question’ or ‘defi-nition’ column describes and defines the type of data. The ‘comments’ column ex-plains the purpose of the data and gives other information where relevant. The three tables provide recommendations for:
1. Data on the characteristics of the KTO and the PRO(s) it serves and denomina-tor data for calculating comparable indicators across countries.
2. Seven main performance indicators. 3. Supplementary questions that provide additional information of value for pol-
icy development. All data should be collected for a reference period of one year, ending before the sur-vey start date. For example, a survey in the spring of 2009 should collect data on KTO and PRO activities over 2008. If the reference year is not a calendar year, the start/end dates should be clearly marked. Two types of questions or indicators are given. Questions in standard font are recom-mended for all KTO surveys. The survey questions used to collect the underlying data have been successfully used in several surveys. In addition, supplementary questions in italics would be useful to include in a survey, but they can be excluded due to space constraints or if there are doubts on the ability or willingness of the respondents to reply. Of note, supplementary questions marked with a double asterisk (**) would need to undergo cognitive pilot testing before use in order to verify if the question is correctly understood and is answerable by respondents. Other supplementary ques-tions have already been tested in surveys22.
5.2 Basic data Table 5.1 provides questions for collecting basic data on the KTO, the KTO’s affili-ated institution(s), and two possible denominators for calculating standardised per-formance indicators. 21 Individual KTOs that are not covered by a survey may assemble these data on their own or approach one of the pan-European survey operators for possible inclusion. PROs without a specialised KTO may benefit from using the same set of indicators except those pertaining to the KTO per se. 22 It is always useful to conduct cognitive testing of the full survey in countries or for target populations that have not previously been surveyed. Whenever non-English versions of the questionnaire are used, a minimum test of compatibility is to let one person translate the items from English to the other lan-guage and subsequently let another person without knowledge of the original formulation do an inde-pendent reverse translation and then check for any inconsistencies.

28
Table 5.1: Recommended basic data on the KTO and on denominators to be collected from KTO surveys A. Background variables A1: The institutions served by the KTO Survey question(s): Does the KTO serve more than 1 institution? Potential additional question(s): If yes, how many?
Comments: If the KTO serves more than one institution, the questionnaire needs to instruct the respondent to provide data on all other questions about each of them.
Approximately what percent of all patent applica-tions by the affiliated institution were handled by the KTO?
The alternative is when the KTO does not handle all formal knowledge transfer activities for its affiliated institution. Data on the percent of patent applications managed by the KTO can be used to estimate the total number of patent applications.
A2: Types of institutions served by the KTO Survey question(s): Check-list of the type(s) of institution for which the KTO provides services: 1. University or other higher education institution 2. Hospital (linked to a university or independent) 3. Fully or predominantly government research institution1 4. Fully or predominantly private non-profit re-search institution 5. Other
Comments: Essential question for comparing countries with different institutional structures for publicly-funded research. Other possible sub-categories include dividing universities into technical, science, or general arts universities or asking if the university has a medical faculty.
A3: KTO size Survey question(s): Total number of KTO staff in full-time equivalents (FTEs). Include all professional, administrative and support staff for knowledge transfer activities. Potential additional question(s): Number of professional staff
Comments: Data on the size of the KTO are useful for analy-ses into efficiency and effectiveness. For exam-ple, is there a minimum KTO staff size for effi-cient and effective knowledge transfer, after con-trolling for the characteristics of the affiliated institution?
A4: Outsourcing Survey question(s): Does the KTO outsource some or part of the fol-lowing activities? (yes or no for each) 1. Preparing patent applications 2. Legal work for research contracts 3. Legal work for licensing contracts
Comments: A KTO could have a high apparent efficiency rating per FTE staff if it outsources many of its activities. Questions on outsourcing are required to control for this effect. Alternatively, outsourcing by itself could influ-ence efficiency and effectiveness.
A5: Total KTO costs Survey question(s): What percentage of the KTO’s budget is spent on outsourcing, excluding patent costs? Potential additional question(s): **What were the total expenditures of the KTO on technology transfer activities (include outsourcing costs, patent portfolio management costs, contract costs, etc)?
Comments: Ideally, it would be very useful to have data on the annual costs of the KTO, as this information could be used to determine if the KTO’s licensing income covers its costs. However, many KTOs could refuse to answer this question as it could be used to rank their effectiveness. The percentage of the budget spent on outsourc-ing (without total expenditure data) can be used to estimate the relative importance of outsourc-ing, which could influence efficiency and effec-tiveness.

29
Table 5.1: Recommended basic data on the KTO and on denominators to be collected from KTO surveys A6: Reference year Survey question(s): Does the KTO report for a calendar year (January 1st to December 31st), a fiscal year (ending what date), or an academic year, in this survey?
Comments: This question may only be required for multi-country surveys where the reference year can vary among respondents. Its main purpose is to inform the respondents that they can reply for different types of reference years and to identify differences across countries.
B. Denominators (for calculating standardised indicators) B1: Research expenditures in the reference year Survey question(s): Total expenditures on all types of basic and ap-plied research (science and humanities) in the affiliated institution(s) from all funding sources: all levels of government, industry, non-profit founda-tions, etc. Include share of academic costs dedi-cated to research, costs of administrative support and capital expenditures on new equipment. Ex-clude cost of new buildings or land. Potential additional question(s): **What percentage of research expenditures were for science research? (include all research expen-ditures for biology, physics, chemistry, engineer-ing, mathematics and computing sciences)
Comments: Expenditures on humanities research should be included because they can produce commercially useful outputs such as software or teaching mate-rials. The definition is in line with the Frascati manual (OECD, 2002). If research expenditure data at the level of indi-vidual PROs are available from official sources in a timely manner, the question can be omitted from the questionnaire. PROs in many cases will have these data available at the time the KTOs will respond to the surveys and respondents could be encouraged to inquire about them.
B2: Research personnel in the reference year Survey question(s): Average number of research personnel in the refer-ence year in FTEs. Include time spent by academic staff on research, other researchers (post-docs, PhD students, researchers on fellowships, part and full time researchers), technicians and administra-tive support personnel. Exclude time spent by academic staff on teaching.
Comments: The number will fluctuate over the year. Surveys should ask for an average or for the number of personnel as of June 1st or December 31st. Re-spondents could be encouraged to inquire about these data as in the case of question B2 above.
Notes for Table 5.1: All questions refer to a one year reference period. Text in italics indicates potential additional question. ** means that the question needs to undergo pilot cognitive testing. 1. A non-profit research institute can earn licensing revenue, but revenues above those used to cover licensing costs must be reinvested in research, experimental development, teaching, publications, or technology transfer activities (see European Commission (2006), page 9, definition of a research or-ganisation).
5.3 Performance indicators The Expert Group proposes seven core performance indicators:
• One indicator for the number of research agreements between public research organisations and firms (or other private and public sector users of research, but not counting contracts only with funding bodies that do not use the results themselves)

30
• Three input (or leading) indicators for the potential commercialisation of pub-lic science: invention disclosures, patent applications, and patent grants
• Three output indicators for the actual use of public science discoveries by the business sector: licenses executed, spin-offs established, and license revenue earned.
The three input indicators of the potential commercialisation of knowledge are of only moderate value to policy because they do not measure the actual uptake of knowledge by firms. Their main function is to identify the production of knowledge with poten-tial commercial value and to assist analysis of the factors that increase the efficiency with which public institutions (primarily through their affiliated KTOs) transfer knowledge to the business sector23. For example, the percentage of patents that have been licensed is an indicator of efficiency. Data on total patent grants is required to calculate this efficiency measure. The three output indicators are more valuable for policy because they are closer to measuring the commercialisation of public science results. A comparison of national performance on these three indicators is consequently of greater interest than a com-parison of performance on patent applications or patent grants. All core indicators, with the exception of license revenues, are collected as count data. The accuracy of each core performance measure depends on the percentage of re-spondents that can answer the relevant question. Table 5.2 gives examples of question response rates using the ASTP FY 2007 survey, with up to 140 respondents per ques-tion. Table 5.2: Question response rates for core performance indicators, ASTP FY 2007 survey
Indicator Response
rate Indicator Response
rate Spin-offs1 established 97% Technically unique patent grants 81% Invention disclosures 96% Total license income 69% Priority patent applications 95% Research agreements 65% Licenses executed 91% Notes for Table 5.2: 1. The ASTP survey used the term ‘start-up’, but the definition is the same as that for a ‘spin-off’ in this report. Source: Arundel et al. (2008). Table 5.3 provides definitions for each of the numerators for the seven core indicators. The denominator can be either research expenditures or research staff in FTEs (see Table 5.1), but research expenditure data could be easier to obtain.
23 Phan and Siegel (2006) provide a thorough review of this literature and find, not surprisingly, that efficient knowledge transfer depends on the characteristics of the institution, such as its research focus, the incentive structure, and organisational characteristics of the KTO.

31
Table 5.3: Recommended core indicators for KTO surveys 1. Research agreements Definition: All contracts where a firm funds the PRO to per-form research on behalf of the firm, with the re-sults usually provided to the firm. Include collabo-rative agreements where both partners provide funding and share the results. Exclude cases where the firm funds a research chair or other research of no expected commercial value to the firm. Also exclude consultancy contracts. Potential additional question(s): **Collaborative research agreements: Agreements where both the firm and the PRO participate in the design of the research project, contribute to its implementation and share the project outputs. **Contract research agreements: Agreements where all research is performed by the PRO. **Consultancy agreements: Agreements where the PRO provides expert advice without performing new research. Share of total research expenditures funded by the private sector. **Financial value of all research agreements; for each type of research agreement (collaboration, contract) or of consultancy contracts.
Comments: An important indicator to balance patent indica-tors, since for many PROs, research agreements are a more important form of knowledge transfer. However, many KTOs may not know the answer, since contracts may be managed by individual departments or even by individual researchers. This question had the lowest item response rate out of the seven core indicators in the ASTP survey. Space permitting, it could be possible to obtain disaggregated count data on the number of each type of research agreement. Consultancy differs from research agreements in that it does not involve new research. In some countries consultancy could be an important method of knowledge transfer. It is not clear if the KTO is likely to be aware of all consultancy contracts, which could be drawn up between firms and individual research staff. If any of the three first additional questions are asked, it is important to clarify that collaborative and contract are subsets of research agreements, whereas consultancy contracts are not included in research agreements. Data on private sector funding is useful as a mea-sure of the commercial orientation of the affili-ated institution.
2. Invention disclosures Definition: Descriptions of inventions or discoveries that are evaluated by the KTO staff or other technology experts to assess their commercial application.
Comments: Core indicator that is easy for KTOs to provide.
3. Patent applications Definition: New priority patent applications. Exclude double counting, such as a patent application for the same invention in more than one patent jurisdiction. Potential additional question(s): New patent applications to the EPO. New patent applications to the USPTO.
Comments: Core indicator that is easy for KTOs to provide. Limitation to priority patents should be sufficient to prevent double counting. If questions about EPO or USPTO patents are asked, it is important to clarify that EPO or USPTO applications may or may not be priority applications. Non-priority EPO or USPTO appli-cations may be technically equivalent to priority patent applications submitted in other jurisdic-tions in the same year or earlier.
4. Patent grants Definition: Technically unique patents granted. Count a patent grant for the same invention in two or more coun-tries as one technically unique patent. If a techni-cally unique patent grant has been counted in a previous year, it cannot be counted again. Potential additional question(s): New patent grants from the EPO. New patent grants from the USPTO.
Comments: The main problem is maintaining comparability across countries. It could be more difficult for respondents to give the number of technically unique patents than to give the number of USPTO or EPO patents. It may be best to ask for both.

32
Table 5.3: Recommended core indicators for KTO surveys 5. Licenses executed Definition: Include all licenses, options and assignments (LOAs) for all types of IP (copyright, know-how, patents, trademarks, etc.). Count multiple (iden-tical) licenses with a value each of less than 500 Euros as one license. A license grants the right to use IP in a defined field of use or territory. An option grants the potential licensee a time period to evaluate the technology and negotiate the terms of a license. An assignment transfers all or part of the right to IP to the licensee.
Comments: Core indicator that is easy for KTOs to provide. There are national differences in the survey defi-nition of licenses, with AUTM in the United States excluding software licenses worth less than 1000 dollars.
6. License income earned Definition: Total income from all types of know-how and IP (patents, copyright, designs, material transfer ag-reements, confidentiality agreements, plant breeder rights, etc.) before disbursement to the inventor or other parties. Include license issue fees, annual fees, option fees and milestone, termination and cash-in payments. Exclude license income for-warded to other institutions than those served by the KTO or to companies.
Comments: Core indicator that is difficult for KTOs to an-swer (only 69% answered the question in the ASTP survey). Corresponds with the AUTM definition. The question could benefit from cog-nitive testing to determine the cause of the prob-lem. For instance, the definition could be too complex or leave out an important component of license revenue.
7. Spin-offs established Definition: A new company expressly established to develop or exploit IP or know-how created by the PRO and with a formal contractual relationship for this IP or know-how, such as a license or equity agreement. Include, but do not limit to, spin-offs established by the institution’s staff. Exclude start-ups that do not sign a formal agreement for developing IP or know-how created by the institution.
Comments: Core indicator that is easy for KTOs to provide. The definition of a spin-off is compatible with the definition used by the AUTM for a start-up. With our definitions, a start-up is any new company involving either people (staff or students) from the PROs or a formal knowledge transfer agree-ment (or both); start-ups and spin-offs are over-lapping concepts. If a survey requests both start-ups and spin-offs, the overlap must be clear; for example, by asking for spin-offs and for start-ups that are not spin-offs.
Notes for Table 5.3: All questions refer to a one year reference period. All data are count data unless otherwise indicated. Text in italics indicates potential additional question. ** means that the question needs to undergo pilot cognitive testing.
5.4 Supplementary indicators The basic data plus the seven core indicators can be obtained in a three to four page survey questionnaire. Countries or professional associations may wish to collect addi-tional data to construct supplementary indicators. Several examples are given below, with definitions provided in Table 5.4. All supplementary questions should be fully tested, using both cognitive testing and pilot surveys. The important point is to use the following definitions if one decides to measure any of these indicators. Who licenses Data on research agreements and licensing can be collected by the type of user, for example who licenses PRO inventions – firms based within the home country or

33
abroad, or small or large firms. This data could be collected in order to construct an indicator for the percentage of licenses that are given domestically or to small firms, or the percentage of research agreements funded by domestic or small firms. This would serve a basic policy interest in encouraging knowledge flows that support do-mestic economic activity or assist SMEs (without, of course, giving some firms unfair advantage). Partners abroad could also be split between those located within and out-side the EU. The question on domestic licensing is particularly relevant for exclusive licenses, since the main justification for non-exclusive licenses is to raise funds for the public institute and consequently international licensing would be an asset. Exclusive licensing The role of non-exclusive licenses is an important policy issue by itself24. Although non-exclusive licenses can maximise income for the research organisation, they could be less effective in transferring knowledge and technology to the business sector than publications that make the results freely available to all. Conversely, exclusive li-censes for some inventions could be absolutely necessary for a firm to invest in de-veloping the invention into a commercial product. The disadvantage is that inefficient use of exclusive licensing could slow down innovation and its possible social benefits. Indicators for the share of exclusive licenses, particularly by technology field, would help policy makers determine if the rate of exclusive licensing is above or below the international norm. Share of patents that are ever licensed There is no point in a public science institution applying for IP rights, particularly a patent, if the invention is never licensed. This will only increase costs to the institute and theoretically, albeit under the unlikely assumption that no firm will infringe the patent, prevent firms from using or further developing the patented technology. For this reason it is worthwhile to collect data on the percentage of patents that have ever been licensed in order to track changes over time and benchmark national perform-ance. Patent share of all licenses and of license revenue Non-patented inventions can account for a significant share of licensing activity, even though IP policy frequently stresses patents or the need for other strong forms of IP. The OECD study (OECD, 2003) found that approximately half of all licenses did not involve a patent. This share can vary over time, by country, or technology field. Even if patents do not account for the majority of licensing, they could account for a larger share of revenue. For instance, the ASTP FY 2007 study found that 90.1% of license revenue earned by universities was from licenses for patented inventions. In order to identify the role of patents, it would be worth collecting data on the share of licenses and license income attributable to patents.
24 Several policy documents have looked at how to improve patenting by the public sector to ensure that it does not impede technical progress (see Gold et al., 2008). Similarly, in 2007 the University of California introduced guidelines on patenting in order to reduce the share of patents that do not serve the public interest. This included advice on the use of exclusive patents.

34
Regional data Four of the core indicators could be collected at the regional level, i.e. whether firms are located in the same region as the PRO or not:
• Location of firms that fund research agreements • License revenue by the location of firms • Location of licensees • Location of spin-offs
In addition, several supplementary indicators in Table 5.3 could be collected at the regional level, such as the location of partners for collaboration, contract research, and consultancy agreements. Regional data are of interest to policy to determine the success of policies to promote regional clustering or the development of regional innovative capabilities.25 We sug-gest that if there exist regional authorities with policy or funding responsibilities for PROs, then their definition of a PRO’s region should have precedence. If not, NUTS 2 would be an approximate definition of what would count as the region of influence for a PRO. The appropriate definition would have to be shown in the questionnaire and it might be difficult to ask for regional indicators in pan-European surveys. If KTOs are to produce regional data, they should tag all relevant firms etc. with re-gional information as a matter of routine and not be asked to reconstruct this informa-tion afterwards. Technological field Inventions, patents and licenses can be classified by their technological field. This information can be useful to adjust comparisons across institutions. For instance, pat-ent rates are much higher in health science faculties than in computing science or physics faculties. Consequently, part of the difference in patenting rates can be due to differences in the types of faculties within each university. Patents are classified according to a highly detailed system that is too complex for KT indicators. The Frascati Manual (OECD, 2002) suggests collecting data on the Field of Science (FOS), which could be more appropriate. An aggregated version of the FOS is as follows:
• computer and information technology • civil and mechanical engineering applications, including electrical engineer-
ing, electronics, industrial processing • medical and health applications • agriculture, forestry, and fisheries • others.
25 Regional actors are increasing their interest in knowledge transfer. One member of the Expert Group was selected on the basis of a request to the members of the programme committee ’Regions of knowl-edge, research potential, coherent development of research policies’. An Innovative Regions in Europe Working Group has recently published a handbook on knowledge transfer (IRE, 2008), which also addresses the question of metrics.
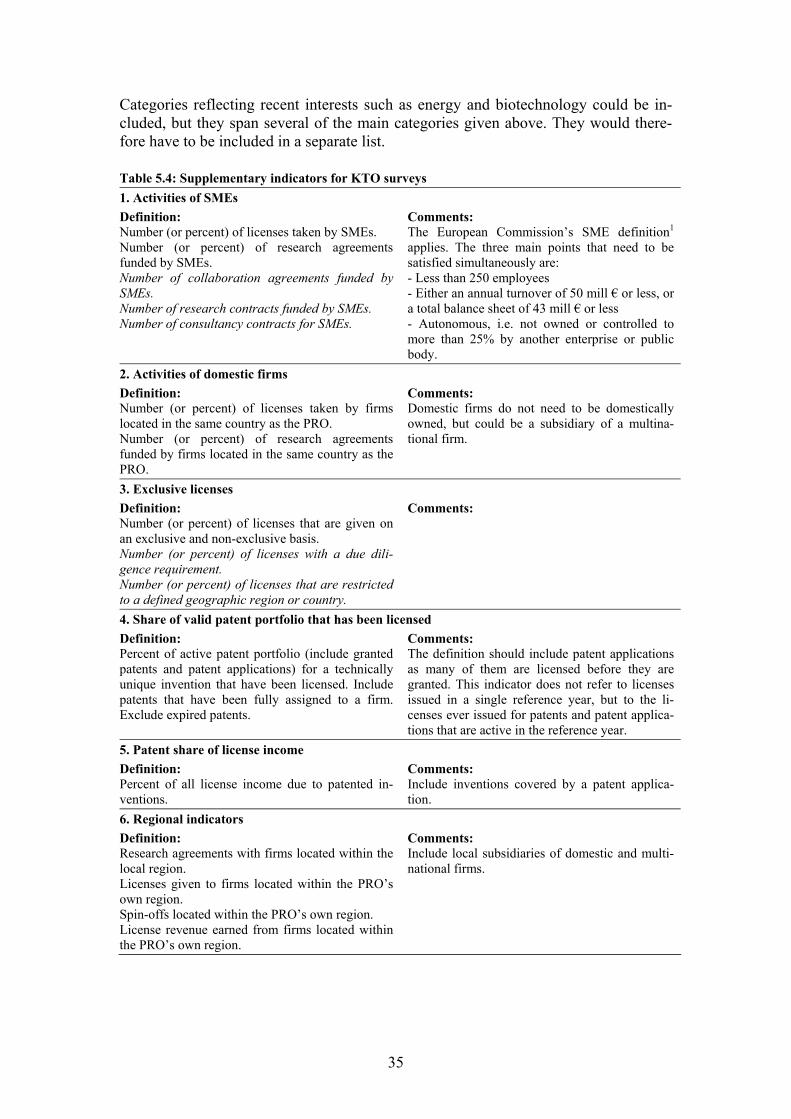
35
Categories reflecting recent interests such as energy and biotechnology could be in-cluded, but they span several of the main categories given above. They would there-fore have to be included in a separate list. Table 5.4: Supplementary indicators for KTO surveys 1. Activities of SMEs Definition: Number (or percent) of licenses taken by SMEs. Number (or percent) of research agreements funded by SMEs. Number of collaboration agreements funded by SMEs. Number of research contracts funded by SMEs. Number of consultancy contracts for SMEs.
Comments: The European Commission’s SME definition1 applies. The three main points that need to be satisfied simultaneously are: - Less than 250 employees - Either an annual turnover of 50 mill € or less, or a total balance sheet of 43 mill € or less - Autonomous, i.e. not owned or controlled to more than 25% by another enterprise or public body.
2. Activities of domestic firms Definition: Number (or percent) of licenses taken by firms located in the same country as the PRO. Number (or percent) of research agreements funded by firms located in the same country as the PRO.
Comments: Domestic firms do not need to be domestically owned, but could be a subsidiary of a multina-tional firm.
3. Exclusive licenses Definition: Number (or percent) of licenses that are given on an exclusive and non-exclusive basis. Number (or percent) of licenses with a due dili-gence requirement. Number (or percent) of licenses that are restricted to a defined geographic region or country.
Comments:
4. Share of valid patent portfolio that has been licensed Definition: Percent of active patent portfolio (include granted patents and patent applications) for a technically unique invention that have been licensed. Include patents that have been fully assigned to a firm. Exclude expired patents.
Comments: The definition should include patent applications as many of them are licensed before they are granted. This indicator does not refer to licenses issued in a single reference year, but to the li-censes ever issued for patents and patent applica-tions that are active in the reference year.
5. Patent share of license income Definition: Percent of all license income due to patented in-ventions.
Comments: Include inventions covered by a patent applica-tion.
6. Regional indicators Definition: Research agreements with firms located within the local region. Licenses given to firms located within the PRO’s own region. Spin-offs located within the PRO’s own region. License revenue earned from firms located within the PRO’s own region.
Comments: Include local subsidiaries of domestic and multi-national firms.

36
Table 5.4: Supplementary indicators for KTO surveys 7. Technological field Definition: Number (or percent) of patent applications within each field of science. Number (or percent) of patent grants within each field of science.
Comments: Fields of science: - computer and information technology - civil and mechanical engineering applications - medical and health applications - agriculture, forestry, and fisheries - others (including social science and humani-ties).
Notes for Table 5.4: 1. European Commission (2003). All questions refer to a one year reference period unless otherwise marked. Text in italics indicates potential additional question.

37
Chapter 6 Consolidating data from multiple surveys
6.1 Introduction In total, there are an estimated 918 public and private universities in the European Union (ERAWATCH, 2008) and an unknown number of other PROs. Table 6.1 pro-vides the number of universities, by country, for which some data on knowledge trans-fer activities were available for 2006, which was the most recent year for maximising comparability across surveys26. This includes data for universities which agree to make their results publicly available and data for universities that only permit their results to be included in aggregated indicators. Some data are available for 415 uni-versities, or 45.2% of the total. The best coverage is for Denmark, Spain and the UK, with data available for 100% of universities, followed by France (96.5%), Ireland (85.7%), Italy (73.5%), Slovenia (66.6%), and Belgium (46.7%). No data are avail-able for nine countries, of which eight are new Member States: Bulgaria, Cyprus, Es-tonia, Hungary, Luxembourg, Malta, Poland, Romania, and Slovakia. Table 6.1: Share of universities for which KT data are available: Fiscal Year 20061
Country Total
universities
Percent with available
data2 Country Total
universities
Percent with available
data2 Austria 21 5.0% Latvia 5 20.0% Belgium 15 46.7% Lithuania 21 - Bulgaria 43 - Luxembourg 1 - Cyprus 6 - Malta 1 - Czech Republic 25 4.0% Netherlands 14 28.6% Denmark 9 100.0% Poland 18 - Estonia 11 - Portugal 14 35.7% Finland 20 25.0% Romania 49 - France3 85 96.5% Slovakia 23 - Germany 162 3.1% Slovenia 3 33.3% Greece 22 18.2% Spain 60 100.0% Hungary 23 - Sweden 17 17.6% Ireland 7 85.7% UK 160 100.0% Italy 83 73.5% EU 27 918 45.2% Notes for Table 6.1: 1. The estimated number of universities in each country is from ERAWATCH (2008), except for the UK, Denmark, and Spain, where the data are from HEFCE, DASTI, and RedOTRI, respectively. The number of total universities in each country is approximate for many countries, due to differences in the definition of a university. Available data on KT activities are from DASTI (Denmark), C.U.R.I.E. (France), ProTon Europe (Italy), RedOTRI (Spain), HEFCE (UK), and from the ASTP and ProTon Europe surveys (all other countries). 2. Data for one or more core statistics are available on a confidential or public release basis for the university. 3. Data for FY 2005.
26 Some surveys have published their data for 2007 at the time of completion of this report. We refer to the web sites of the respective survey owners or operators for more up to date data.
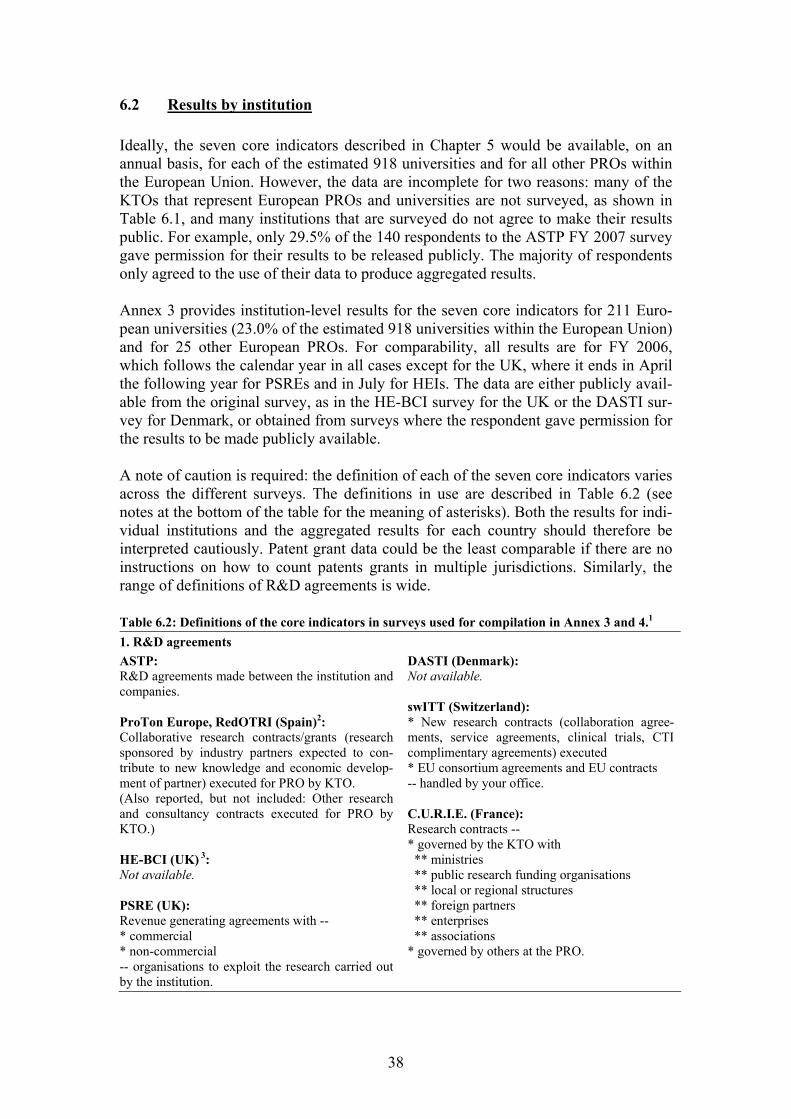
38
6.2 Results by institution Ideally, the seven core indicators described in Chapter 5 would be available, on an annual basis, for each of the estimated 918 universities and for all other PROs within the European Union. However, the data are incomplete for two reasons: many of the KTOs that represent European PROs and universities are not surveyed, as shown in Table 6.1, and many institutions that are surveyed do not agree to make their results public. For example, only 29.5% of the 140 respondents to the ASTP FY 2007 survey gave permission for their results to be released publicly. The majority of respondents only agreed to the use of their data to produce aggregated results. Annex 3 provides institution-level results for the seven core indicators for 211 Euro-pean universities (23.0% of the estimated 918 universities within the European Union) and for 25 other European PROs. For comparability, all results are for FY 2006, which follows the calendar year in all cases except for the UK, where it ends in April the following year for PSREs and in July for HEIs. The data are either publicly avail-able from the original survey, as in the HE-BCI survey for the UK or the DASTI sur-vey for Denmark, or obtained from surveys where the respondent gave permission for the results to be made publicly available. A note of caution is required: the definition of each of the seven core indicators varies across the different surveys. The definitions in use are described in Table 6.2 (see notes at the bottom of the table for the meaning of asterisks). Both the results for indi-vidual institutions and the aggregated results for each country should therefore be interpreted cautiously. Patent grant data could be the least comparable if there are no instructions on how to count patents grants in multiple jurisdictions. Similarly, the range of definitions of R&D agreements is wide. Table 6.2: Definitions of the core indicators in surveys used for compilation in Annex 3 and 4.1 1. R&D agreements ASTP: R&D agreements made between the institution and companies. ProTon Europe, RedOTRI (Spain)2: Collaborative research contracts/grants (research sponsored by industry partners expected to con-tribute to new knowledge and economic develop-ment of partner) executed for PRO by KTO. (Also reported, but not included: Other research and consultancy contracts executed for PRO by KTO.) HE-BCI (UK) 3: Not available. PSRE (UK): Revenue generating agreements with -- * commercial * non-commercial -- organisations to exploit the research carried out by the institution.
DASTI (Denmark): Not available. swITT (Switzerland): * New research contracts (collaboration agree-ments, service agreements, clinical trials, CTI complimentary agreements) executed * EU consortium agreements and EU contracts -- handled by your office. C.U.R.I.E. (France): Research contracts -- * governed by the KTO with ** ministries ** public research funding organisations ** local or regional structures ** foreign partners ** enterprises ** associations * governed by others at the PRO.

39
Table 6.2: Definitions of the core indicators in surveys used for compilation in Annex 3 and 4.1 2. Invention disclosures ASTP: Inventions subject to an evaluation by technology experts reported by your institution to your office. ProTon Europe, RedOTRI (Spain): Invention disclosures received (to evaluate the potential of an invention/result deriving from the research activities so as to be able to decide its legal protection and/or active commercialisation). HE-BCI (UK): Disclosures filed by or on behalf of the institution.
PSRE (UK): Knowledge transfer opportunities and invention disclosures notified to technology transfer, indus-trial liaison, innovation hubs, and contract offices or their equivalent. DASTI (Denmark): Inventions disclosures received from the institu-tion’s researchers. swITT (Switzerland): Invention disclosures received. C.U.R.I.E. (France): Declarations of invention (patent application projects) treated.
3. Patent applications ASTP: Priority patent filings filed for institution. ProTon Europe, RedOTRI (Spain): Priority patent applications filed. HE-BCI (UK): New patent application filed by or on behalf of the institution. (Also recorded: Sub-total for overseas applica-tions.) PSRE (UK): New -- * UK * overseas -- patent applications filed. DASTI (Denmark): Inventions for which patent applications have been filed (priority applications; if one invention results in several priority applications, they all count).
swITT (Switzerland): Priority patent applications filed. C.U.R.I.E. (France): Priority patent applications submitted -- * by the institution ** alone (full priority) ** shared with a HEI ** shared with a university or equivalent ** shared with a company * by someone else (with at least an inventor from the institution): ** an organisation ** a HEI ** a company * to the USPTO without a French priority appli-cation. (Also recorded, but not included: software depo-sitions, new plant variety certificates, copy-right/authorship files; all broken down as for priority patent applications.)
4. Patent grants ASTP: Technically unique patents granted to your institu-tion. ProTon Europe, RedOTRI (Spain): Patents granted. (Also recorded, but not included: Patents granted by -- * EPO * USPTO.) HE-BCI (UK): Patents granted (for applications submitted by or on behalf of the institution). (Also recorded: Sub-total for overseas applica-tions.)
PSRE (UK): * UK * overseas -- patents granted. DASTI (Denmark): Patents issued to the institution (only the patent issued from the first jurisdiction counts). swITT (Switzerland): Not available. C.U.R.I.E. (France): Not available.

40
Table 6.2: Definitions of the core indicators in surveys used for compilation in Annex 3 and 4.1 5. Licenses executed ASTP: Licenses (include assignments) or option agree-ments made between the institution and compa-nies. ProTon Europe, RedOTRI (Spain): Licenses, options and assignments executed. (Also recorded: Sub-totals for patent-based, soft-ware-based and know-how-based LOAs.) HE-BCE (UK): * Non-software * only software -- licenses granted. PSRE (UK): License options and licenses executed.
DASTI (Denmark): * License agreements based on ** patents ** software ** utility models * option agreements * assignments. swITT (Switzerland): Licenses/options/sales of protected or unpro-tected IP executed. C.U.R.I.E. (France): Licenses or exploitation agreements (free or sub-ject to payment) signed, based on * patents and related know-how * confidential know-how only * software * biological material * new plant variety certificates * author rights -- each of these is also split between two types of licensees: existing firms and start-ups.
6. License income earned ASTP: Total amount of license income earned by institu-tion from its intellectual property (patents, soft-ware, material transfer agreements, confidentiality agreements, etc.). Includes license issue fees, an-nual fees, option fees, etc., plus milestone, termi-nation & cash-in payments. Excludes license in-come forwarded to other companies or institutions. ProTon Europe, RedOTRI (Spain): Licenses, options, and assignments revenues at-tributable to the institutions served. HE-BCI (UK): IP income from – * non-software licenses * software licenses * other IP. (Also recorded, but not included: Income from sale of shares in spin-offs.) PSRE (UK): Income from commercialisation -- * licensing and other IP (Also recorded, but not included: income from commercialisation -- * consultancy * use of facilities and equipment * training * any additional research income generated from links with commercial organisations.)
DASTI (Denmark): Gross revenues4 from commercialisation from -- * license agreements based on ** patents ** software ** utility models * assignment of ** patents ** software ** utility models * inventor payments * cashed-in equity * dividends equity from ** spin-outs ** subsidiaries * reimbursement of IP protection costs. swITT (Switzerland): Total amount of license/option/sales income obtained by your institution. C.U.R.I.E. (France): Revenues invoiced for license fees, options, mile-stone and cash-in fees for * patents and related know-how * confidential know-how only * software * biological material * new plant variety certificates * author rights.

41
Table 6.2: Definitions of the core indicators in surveys used for compilation in Annex 3 and 4.1 7. Spin-offs established ASTP: Start-ups (companies established to exploit tech-nology or know-how created by the institution) formed. ProTon Europe, RedOTRI (Spain): Spin-offs (new companies whose business model and technology is based primarily on knowledge generated by the PRO) created with the assistance of the KTO. (Also recorded, but not included: Other start-ups (new company formed by university entrepre-neurs) created with the assistance of the KTO.) HE-BCI (UK): Spin-offs -- * with * without HEI ownership -- established. (Also recorded, but not included: Start-ups with -- * staff * graduates -- established.)
PSRE (UK): * Spin-offs ** with ** without HEI ownership * start-ups (staff) -- established. DASTI (Denmark): Spin-outs (enterprises dependent on licensing or assignment of the institution’s technology for initiation) established, based on agreement with * PRO employee inventor * third party. swITT (Switzerland): Start-up companies formed which depend upon licensing or contractual transfer of your institu-tion’s technology for their initiation. (Also recorded, but not included: Other start-up companies which depend on unprotected know-how or technology of your institution (without license agreement).) C.U.R.I.E. (France): Projects for creation of new enterprise.
Notes for Table 6.2: 1. Each indicator is either measured directly or calculated as a sum of mutually exclusive measure-ments, each of which is preceded by an asterisk (*) in the table. A double asterisk (**) marks mutually exclusive measurements that sum up to a single-asterisk measurement. Sub-totals need not add up to the total number. Not all data asked for is actually available. 2. Definitions for Italy and Spain are originally translated and adapted from those for ProTon Europe, but may differ slightly from those listed in this table. Some definitions are more extensive than what is displayed in this table. Some indicators in this table may deviate from those listed in Table 3.2 because of changes to surveys from one year to the next. Those listed here concern the data displayed in Annex 3 and 4. 3. The PSRE publishes summaries based on raw survey results (which are used in Annex 4) and im-puted (or ‘grossed-up’) results. 4. Further definition of revenue in the DASTI survey: “… directly related to the transfer of IPR and which form the basis for calculating the institutions remuneration for inventors; revenues are calculated before deductions for inventor fees.” Several other DASTI definitions are also explicitly related to the legal framework regulating inventions made by PRO employees. Sources: Arundel and Bordoy (2006), ProTon Europe (2008), HEFCE (2008), Technopolis (2007), DASTI (2008), Fesch et al. (2008), Bach et al. (2006).
6.3 Aggregated results
6.3.1 Aggregation by country and type of PRO A second method of presenting results that raises fewer confidentiality issues is to aggregate data by a variable of interest, such as the type of PRO (university or other research organisation), country, or other geographic area (for example the European Union). Annex 4 gives aggregated results for FY 2006 (2005 in the case of France)

42
for the seven core performance indicators for countries with a minimum of three re-spondent institutions.
6.3.2 Aggregation techniques Aggregated results can be constructed for the UK and Denmark from the publicly available information for each university (including other PROs in the case of Den-mark), while the results for France, Italy, and Spain were provided, respectively, by C.U.R.I.E., ProTon Europe, and RedOTRI. Aggregated results for non-university re-sults from the UK were available from the PSRE survey. For other countries, the ag-gregated results are based on data from the ASTP and ProTon Europe surveys. This requires using one of two possible methods for combining confidential data. The main challenge is to remove duplicates, such as when two or more survey organisations collect data for the same PRO. Each technique is described below. First method: This method requires two or more survey organisations to share access to confidential microdata so that results across several surveys can be combined. For example, two Surveys, A and B, could compare respondents for France, remove duplicate re-sponses, and then create aggregate results. The main advantage of this method is that it would be possible to reduce item non-response if a respondent provided some data to A that was not provided to B. Second method: An alternative option for producing aggregate indicators would minimise the sharing of confidential data. The only requirement is to temporarily share the names of re-spondent institutions. For example, the survey organisations A and B could share a list of respondent institutions to their respective surveys. Once double counting has been removed, both organisations could create aggregated results that can then be combined, but which do not break confidentiality. Table 6.3 provides a theoretical example of how this can be done. Assume that there are 9 universities in the country of interest. Three responded to Survey A, five re-sponded to Survey B, and two responded to neither survey. One institute, ‘C’, re-sponded to both surveys. In the case of C, the result to Survey B was accepted and the responses to Survey A were not counted. The estimated aggregate indicator is 1 patent per million Euros of R&D expenditures (70 patents and 70 million in R&D expendi-tures across the two surveys). The only information that Survey A needs to know, using this method, is the aggregate result from Survey B of 68 patents and 57 million of R&D expenditures for its five respondent institutes. The method ensures confiden-tiality as long as two or more respondents reply to both surveys.

43
Table 6.3: Example of how to create aggregate indicators from different surveys while maintain-ing confidentiality
Survey A Survey B
Institute # patents R&D
expenditures Institute # patents R&D
expenditures A 2 1.0 million B 10 1.5 million C 0 3.0 million C 0 3.5 million D 0 12.0 million E 50 25.0 million F 3 25.0 million G 5 2.0 million H I Total 2 13.0 million Total 68 57.0 million For the purpose of aggregating data to the national level, it is also possible to impute the patent count results for Institutes H and I that did not respond to either survey, particularly if there are other sources of R&D expenditures for these two institutes.

44
Chapter 7 Implementation In this chapter we discuss preconditions for effective implementation of the proposed measures. This will require three steps. First, achieving coherence and convergence in the short term between existing recur-ring surveys of KTOs will require their owners to agree on a harmonised set of ques-tions to collect the core indicators proposed in Chapter 5. This will not prevent them from acquiring additional indicators suited to their specific needs. Representatives of ASTP, ProTon Europe as well as national survey owners (e.g. in Denmark and Great Britain) have been part of this Expert Group. A consensus was achieved on a set of outlined core indicators and also on the value of many of the sup-plementary indicators (as listed in chapter 5). The two pan-European surveys of ASTP and ProTon Europe have decided to use as much as possible the selected core set of indicators with the same underlying defini-tions. ProTon Europe and ASTP have also agreed to normalise the published results by using the same common denominators such as number of researchers and/or amount of research expenditure. This does not exclude the use of other methods of comparison. Although both ASTP and ProTon Europe feel that a higher response rate would strengthen their respective surveys, it is a prerequisite for both associations that the participation in their pan-European surveys will always be on a voluntary basis. It is the experience of ASTP and ProTon Europe that many respondents are much more willing to give detailed answers and spend time if they are convinced about the use-fulness of the survey. In the past, perceived usefulness may have been associated with whether the KTOs have influenced the design of the surveys or not. It is the policy of ASTP and ProTon Europe that it is absolutely necessary to treat individual survey responses confidential and publish the results only in an aggregated form, unless the publication of individual results is explicitly approved by the respective survey re-spondents. It is the experience from the Danish and British national surveys that the response rate and reliability of collected data can be improved considerably by making participation (semi-)mandatory and/or by linking the reported data to funding schemes. Further-more, in some countries, for legal reasons, confidentiality of data reported from a pub-lic entity can not be guaranteed due to requirements in national information acts. Using the same core indicators in national and pan-European surveys will most likely improve the survey response rate, which is critical for achieving more reliable and comparable results at the pan-European level. Thus, both ProTon Europe and ASTP surveys would benefit from the implementation of the recommended core set of indi-cators in national surveys. However, neither ProTon Europe nor ASTP will conduct national surveys themselves in the near future. In the near future, many KTOs are likely to be asked to respond to one or two pan-European and a national survey. In the long run, data sharing might be achieved to

45
avoid this duplication of effort. Until then, it might be useful to send the questionnaire for the pan-European and national surveys in parallel to minimise the workload for the responding institution. Even if this is not feasible, surveys should reference each other to make it clear to the respondents that they are using identical questions so that re-spondents can copy their responses rather than generate them anew. The successful implementation of the core indicators will be possible if
• the data are easily “at hand” at the KTOs/PROs and answering the questions will not increase the workload at the KTOs too much
• ideally the questionnaire can be answered in less than 30 minutes • data can be re-used in other surveys, because e.g. the proposed core indicators
are used (which makes it even easier to answer additional questionnaires) • KTOs are convinced that the data, especially if a high response rate can be
achieved, are useful for their daily business (benchmarking, underpinning pol-icy development, providing information to university heads, demonstrating the value of the KT function, etc.)
• the questionnaire is consistent over many years (same indicators), and thus easy to answer on a yearly basis
• data are treated in confidence and will only be published in aggregated form on a national or pan-European level – unless the publication of individual data was approved. Publication of individual data sets might be required according to national regulations
• participation in pan-European surveys will also in the future be on a voluntary basis.
As a second step, with comparability of core indicators thus secured, arrangements need to be set up for enabling the compilation of data from the various surveys into national (or other) aggregates. As indicated before, several institutions typically re-spond to several surveys and there is a need to sort out the overlap. The technical issues for this have been discussed in Chapter 6. For effective imple-mentation, the relevant organisations collecting data will need to work out between them a practical way of bringing together the datasets under the different clauses of confidentiality and then follow the guidelines of Chapter 6 to avoid double counting. It might help if the confidentiality clause, wherever present, states that no data will be publicly released that could identify the respondent or their research organisation. This would maintain confidentiality while permitting data to be pooled in order to construct aggregate indicators. Even if release to a trusted neutral partner is not achieved, the guidelines of Chapter 6 can still be used. A compilation of this kind would in any case require a resource allocation that is currently not in place. Third, coherence and convergence in the medium to long term will require a suitable forum for discussing a possible expansion of the core set of indicators and an exten-sion towards covering more channels of knowledge transfer. Because KTOs for natu-ral reasons are not equally active in all channels, such an expansion might need to include a broader set of actors than those currently involved in surveys directed to-wards KTOs. The recent UNICO exercise (Holi et al., 2008), which included universi-ties (rather than their KTOs per se), business representatives, and public funding agencies, is an interesting example in this respect.

46
Although it was not an objective of the Expert Group to trigger new national surveys in countries where currently no surveys exist, a limited core indicator set, useful and easy to answer, might encourage these countries to get engaged in national surveys, which in turn would most likely improve the response rate on a European level and would contribute to a more complete picture. It might be natural to include discussions at this third stage with international survey operators (AUTM US and Canada, Australia, etc.) for the purpose of better harmoni-sation. These surveys, too, will most likely go through changes over time.

47
Chapter 8 Recommendations The Expert Group recommends that the European Commission work with the relevant actors to improve adherence to the following guidelines: That current KTO survey operators and others collecting similar data by other means on knowledge transfer from PROs
• include all the recommended core indicators from Chapter 5 o research agreements o invention disclosures o patent applications o patent grants o licenses executed o license income o spin-offs
• apply the recommended definitions for core and any supplementary indicators used from Chapter 5
• make their data available for constructing aggregate indicators, using the pro-cedures outlined in Chapters 6 and 7.
That institutions initiating new surveys of KTOs or PROs on questions of knowledge transfer in geographical or sectoral areas not yet (or poorly) covered, or even the monitoring of KT in individual organisations, do the same. That anyone using data and analyses from these surveys acknowledges that the trans-fer of IP is not the only important channel of knowledge transfer, that monitoring of transfer in other channels should be given more attention in the future, and that there may be better sources for data about other channels than KTOs. To acknowledge this is more important when it comes to developing policy for the broader field of knowl-edge transfer than when it comes to fine-tuning the operations of specialised KTOs. That relevant actors (such as the European Commission, national administrations, KT professional organisations, researchers and others) continue the development of in-sight into other channels and processes of knowledge transfer, through research and development of new indicators.27 We estimate that both European and national policy-makers have an interest in strengthening this work. This may also require a greater overlap among networks of researchers, those responsible for monitoring, and KTO professionals. That the professional organisations of KTOs and other knowledge transfer agents, stakeholders in the development of the universities’ ‘third mission’, policy makers engaged in monitoring of knowledge transfer, and others, routinely discuss experi-ences with the implementation of the monitoring systems and over time take initia-tives to amend (if necessary) and expand the range of shared indicators.
27 Relevant research and policy networks include (but are not limited to) the European network of indi-cator designers (ENID) and The OECD’s National experts on science and technology indicators (NESTI).

A 1
Annex 1: Composition of the Expert Group and attribution of authorship This report has been prepared by an Expert Group on Knowledge Transfer Metrics appointed by the European Commission. The group has been in operation for the pe-riod January – November 2008. The editing and the bulk of the writing has been done by a core group of five individuals with designated primary functions. Additional in-put has been provided by other members. Other individuals mentioned have been con-sulted in meetings with the group or in other manners. All individuals have contrib-uted as experts, and not as representatives of their respective Member States or or-ganisations28. The views expressed in the report are those of the Expert Group and do not necessarily represent the views of the European Commission, any Member States, or any organisations with which any member of the Expert Group is affiliated. Core members of the Expert Group Chair: Håkon Finne – Research Manager, SINTEF, Trondheim, Norway Rapporteur: Anthony Arundel – Senior Researcher, UNU-MERIT, Maastricht, the
Netherlands Rapporteur: Gert Balling – Secretary General, National Network for Technology
Transfer in Denmark, Copenhagen, Denmark ProTon Europe liaison: Pierre Brisson – Director of Valorisation, Université de Tech-
nologie Compiègne, Compiègne, France; Chair Elect of the Board, ProTon Europe; Secretary General, C.U.R.I.E. network
ASTP liaison: Jörn Erselius – Managing Director, Max Planck Innovation, Jena, Germany; Vice President, ASTP
Other appointed members of the Expert Group Georg Buchtela – Head of Intellectual Property Management, Austria Wirtschafts-
service, Vienna, Austria Adrian Day – Senior HE Policy Officer, Higher Education Funding Council for Eng-
land (HEFCE), Bristol, United Kingdom Claar-els van Delft – General Manager, Association for Science and Technology
Transfer Professionals (ASTP), Amsterdam, the Netherlands Kåre Jarl – Chief Advisor, Danish Agency for Science Technology and Innovation,
Ministry of Science Technology and Innovation, Copenhagen, Denmark Catalina Martínez – Research Fellow, Institute of Public Goods and Policies, Spanish
National Research Council (IPP-CSIC), Madrid, Spain Jeffry Matakupan – Senior Policy Advisor for Knowledge Transfer, Dutch Ministry of
Economic Affairs, the Hague, the Netherlands Andrew Stockman – Manager, Forfás, Dublin, Ireland Other contributing individuals Catalina Bordoy – Researcher, UNU MERIT, Maastricht, the Netherlands Fernando Conesa Cegarra – Deputy Director, Centre for Technology Transfer, Uni-
versidad Politecnica de Valencia, Valencia, Spain Kevin Cullen – Director, Research & Enterprise, University of Glasgow, Glasgow,
United Kingdom 28 For those organisations that provide official names in English, these have been used.

A 2
Paul van Dun – General Manager, K.U.Leuven Research & Development, Leuven, Belgium
Anders Ekeland – Head of Research, NIFU STEP, Oslo, Norway Vincent Lamande – Director of Entrepreneurship and International Affairs, Bretagne
Valorisation, Université de Bretagne Occidentale, Brest, France; President, C.U.R.I.E. network
Luciana Marins – Visiting Researcher, UNU-MERIT, Maastricht, the Netherlands Svein Olav Nås – Senior Researcher, NIFU STEP, Oslo, Norway Andrea Piccaluga – Professor, Scuola Superiore Sant’Anna, Pisa, Italy Support from the European Commission Denis Dambois – Administrator (Intellectual Property), Research Directorate-General,
Unit C2 – Private investment and technology platforms (currently Transport Directorate-General, Unit E2 – Intellectual property and public procurement)
Shalini Saxena – Policy Officer (Knowledge Transfer), Research Directorate-General, Unit C2 – Private investment and technology platforms
A 3
Annex 2: Organisations, surveys and other acronyms Networks and associations for actors in the fields of knowledge transfer and technology transfer: ASTP: The Association of European Science and Technology Transfer Professionals AUTM: Association of University Technology Managers C.U.R.I.E.: Network for Valorisation of Research and Technology Transfer (France) NetVal: Network per la Valorizzazione della Ricerca Universitaria (Italy) ProTon Europe: The pan-European network of Knowledge Transfer Offices (KTOs) and companies affiliated to universities and other Public Research Organisations RedOTRI: Spanish Network of University Knowledge Transfer Offices swiTT: Swiss Technology Transfer Association Techtrans.dk: National Network for Technology Transfer (Denmark)
Running surveys and one-off projects with their own acronyms: CIS: European Community Innovation Survey CMS Survey: Carnegie Mellon Survey (Cohen et al., 2002) DASTI Survey: Danish Commercialisation Survey ERAWATCH: ERAWATCH provides information on national and regional research policies, actors, organisations and programmes HE-BCI Survey: Higher Education – Business and Community Interaction Survey in the UK ITTE Survey: Survey of Institutions of Transfer of Technology (Inno et al., 2004) PACE Survey: Policies, Appropriation and Competitiveness in Europe (Arundel et al., 1995) PSRE Survey: Survey of Public Sector Research Establishments in the UK
Other acronyms: DEST: Department of Education, Science and Training (Australia) DIUS: Department for Innovation, Universities, and Skills (UK) ENID: European network of indicator designers EPO: European Patent Office FOS: Fields of science FTE: Full time equivalent FY: Fiscal year HEFCE: Higher Education Funding Council for England HEI: Higher education institution (which includes universities) IP: Intellectual property IPR: Intellectual property rights KT: Knowledge transfer KTO: Knowledge transfer office LOA: Licenses, options and assignments NESTI: The OECD’s National experts on science and technology indicators NUTS: The Nomenclature of Territorial Units for Statistics; a geocode standard for referencing the administrative divisions of countries for statistical purposes PRO: Public research organisation (which includes HEIs that also perform research on a regular basis) SME: Small and/or medium size(d) enterprise TT: Technology transfer TTO: Technology transfer office USPTO: United States Patent and Trademark Office

A 4
Annex 3: Institution-level results for 2006 For each country, the primary data source is listed. Additional data at the level of in-dividual PROs are typically made available by combining publicly available data from national and pan-European surveys. Table A3.1: Universities – institution-level results, 2006 Definitions vary by survey
Country (primary data source) University R
&D
ag
reem
ents
Inve
ntio
n di
sclo
sure
s
Pate
nt
appl
icat
ions
Pate
nt
gran
ts
Lic
ense
s ex
ecut
ed
Lic
ense
in
com
e ea
rned
(k
Eur
os)
Spin
-off
s es
tabl
ishe
d
Belgium (ASTP) Interface Entreprises 650 15 11 5 15 3,003 4 Université de Namur 455 3 2 0 2 8 0 Denmark (DASTI) Aalborg Universitet - 45 18 1 14 112 2 Danmarks Tekniske Universitet - 53 18 0 23 276 5 IT University of Copenhagen 3 0 0 1 0 0 0 Roskilde Universitetscenter - 2 2 0 0 0 0 Royal Veterinary and Agricultural University
134 39 5 1 4 288 0
Syddansk Universitet - 43 11 0 36 827 6 The Faculty of Pharmaceutical Sci-ences
50 7 1 0 2 7 0
University of Aarhus - 45 14 0 8 67 1 University of Copenhagen 38 25 9 0 10 279 0 Finland (ASTP) Helsinki University of Technology 1,000 150 6 2 21 50 11 Satakunta Polytechnic 72 - - - - - 16 University of Kuopio 275 7 1 0 2 0 5 University of Oulu 400 54 1 0 7 - 4 Germany (ASTP) University of Applied Sciences Muen-ster
900 0 6 2 3 - -
Greece (ASTP) Technological Educational Institute of Chalkis
2 2 6 2 4 83 0
Latvia (ASTP) University of Latvia - 10 5 0 0 0 1 Netherlands (ASTP) Delft University of Technology - 43 24 20 - - 10 Technology Foundation STW 80 20 13 - 61 1,300 4 Spain (RedOTRI) Universidad de Almería - - 7 - - - 4 Universitat Autònoma de Barcelona - - 15 - - 8 - Universidad Autónoma de Madrid - - 22 - - 385 22 Universidad de Cádiz - - 12 - - 10 7 Universidad de Cantabria - - 5 - - 0 0
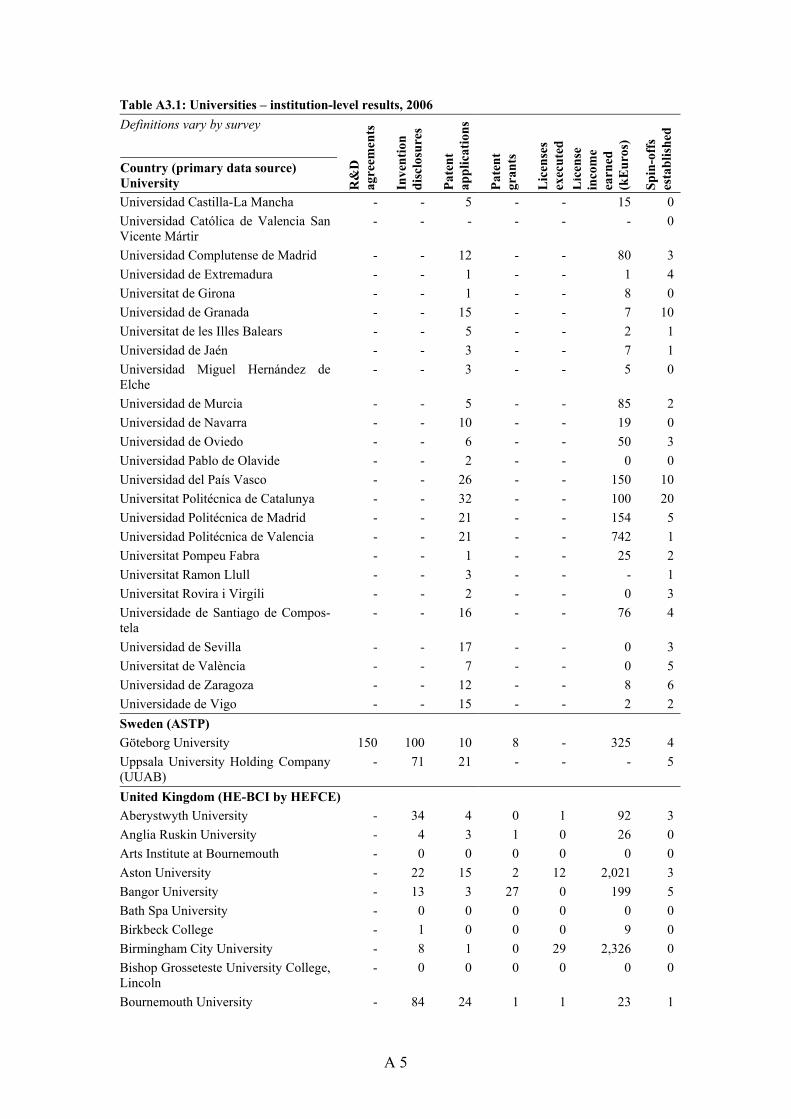
A 5
Table A3.1: Universities – institution-level results, 2006 Definitions vary by survey
Country (primary data source) University R
&D
ag
reem
ents
Inve
ntio
n di
sclo
sure
s
Pate
nt
appl
icat
ions
Pate
nt
gran
ts
Lic
ense
s ex
ecut
ed
Lic
ense
in
com
e ea
rned
(k
Eur
os)
Spin
-off
s es
tabl
ishe
d
Universidad Castilla-La Mancha - - 5 - - 15 0 Universidad Católica de Valencia San Vicente Mártir
- - - - - - 0
Universidad Complutense de Madrid - - 12 - - 80 3 Universidad de Extremadura - - 1 - - 1 4 Universitat de Girona - - 1 - - 8 0 Universidad de Granada - - 15 - - 7 10 Universitat de les Illes Balears - - 5 - - 2 1 Universidad de Jaén - - 3 - - 7 1 Universidad Miguel Hernández de Elche
- - 3 - - 5 0
Universidad de Murcia - - 5 - - 85 2 Universidad de Navarra - - 10 - - 19 0 Universidad de Oviedo - - 6 - - 50 3 Universidad Pablo de Olavide - - 2 - - 0 0 Universidad del País Vasco - - 26 - - 150 10 Universitat Politécnica de Catalunya - - 32 - - 100 20 Universidad Politécnica de Madrid - - 21 - - 154 5 Universidad Politécnica de Valencia - - 21 - - 742 1 Universitat Pompeu Fabra - - 1 - - 25 2 Universitat Ramon Llull - - 3 - - - 1 Universitat Rovira i Virgili - - 2 - - 0 3 Universidade de Santiago de Compos-tela
- - 16 - - 76 4
Universidad de Sevilla - - 17 - - 0 3 Universitat de València - - 7 - - 0 5 Universidad de Zaragoza - - 12 - - 8 6 Universidade de Vigo - - 15 - - 2 2 Sweden (ASTP) Göteborg University 150 100 10 8 - 325 4 Uppsala University Holding Company (UUAB)
- 71 21 - - - 5
United Kingdom (HE-BCI by HEFCE) Aberystwyth University - 34 4 0 1 92 3 Anglia Ruskin University - 4 3 1 0 26 0 Arts Institute at Bournemouth - 0 0 0 0 0 0 Aston University - 22 15 2 12 2,021 3 Bangor University - 13 3 27 0 199 5 Bath Spa University - 0 0 0 0 0 0 Birkbeck College - 1 0 0 0 9 0 Birmingham City University - 8 1 0 29 2,326 0 Bishop Grosseteste University College, Lincoln
- 0 0 0 0 0 0
Bournemouth University - 84 24 1 1 23 1

A 6
Table A3.1: Universities – institution-level results, 2006 Definitions vary by survey
Country (primary data source) University R
&D
ag
reem
ents
Inve
ntio
n di
sclo
sure
s
Pate
nt
appl
icat
ions
Pate
nt
gran
ts
Lic
ense
s ex
ecut
ed
Lic
ense
in
com
e ea
rned
(k
Eur
os)
Spin
-off
s es
tabl
ishe
d
Brunel University - 12 9 3 3 212 5 Buckinghamshire New University - 0 0 0 0 0 0 Canterbury Christ Church University - 0 0 0 0 0 0 Cardiff University - 82 69 0 147 2,167 2 Central School of Speech and Drama - 0 0 0 0 0 0 City University, London - 150 10 5 5 449 2 Conservatoire for Dance and Drama - 0 0 0 0 0 0 Courtauld Institute of Art - 0 0 0 0 72 0 Coventry University - 25 5 3 2 400 2 Cranfield University - 32 22 12 167 354 0 Dartington College of Arts - 0 0 0 0 0 1 De Montfort University - 11 13 5 4 91 0 Edge Hill University - 0 0 0 0 0 0 Edinburgh College of Art - 0 0 0 0 0 0 Glasgow Caledonian University - 3 2 1 0 29 0 Glasgow School of Art - 0 1 0 1 0 0 Goldsmiths College, University of London
- 0 0 0 0 14 1
Guildhall School of Music & Drama - 0 0 0 0 0 0 Harper Adams University College - 0 0 0 0 0 0 Heriot-Watt University - 29 20 3 2 105 1 Heythrop College - 0 0 0 0 0 0 Imperial College London - 366 137 73 126 3,459 13 Institute of Cancer Research - 10 10 1 39 2,062 0 Institute of Education - 0 0 0 0 0 0 Keele University - 32 27 18 17 1,221 1 King's College London - 77 38 15 120 425 0 Kingston University - 2 2 0 0 0 2 Lancaster University - 32 7 1 4 32 1 Leeds College of Music - 0 0 0 0 0 0 Leeds Metropolitan University - 0 0 0 0 52 0 Leeds Trinity & All Saints - 0 0 0 0 20 0 Liverpool Hope University - 0 0 0 0 0 0 Liverpool Institute for Performing Arts - 0 0 0 0 0 0 Liverpool John Moores University - 151 9 1 19 38 11 London Business School - 0 0 0 0 25 0 London Metropolitan University - 0 0 0 0 20 0 London School of Economics and Political Science
- 0 0 0 0 1,386 0
London School of Hygiene & Tropical Medicine
- 11 9 0 1 0 0
London South Bank University - 8 11 12 3 17 0 Loughborough University - 26 9 1 3 49 2 Manchester Metropolitan University - 1 1 0 0 0 3

A 7
Table A3.1: Universities – institution-level results, 2006 Definitions vary by survey
Country (primary data source) University R
&D
ag
reem
ents
Inve
ntio
n di
sclo
sure
s
Pate
nt
appl
icat
ions
Pate
nt
gran
ts
Lic
ense
s ex
ecut
ed
Lic
ense
in
com
e ea
rned
(k
Eur
os)
Spin
-off
s es
tabl
ishe
d
Middlesex University - 0 0 0 0 0 5 Napier University - 0 1 0 3 33 11 Newman University College - 0 0 0 0 0 0 North East Wales Institute of Higher Education
- 3 0 0 0 0 8
Norwich School of Art & Design - 0 0 0 0 0 0 Nottingham Trent University - 8 5 0 0 53 0 Open University - 11 75 0 642 4,173 0 Oxford Brookes University - 0 1 9 2 881 1 Queen Margaret University Edinburgh - 0 0 0 0 9 0 Queen Mary, University of London - 26 22 9 14 2,745 2 Queen's University Belfast - 77 64 7 79 1,232 1 Ravensbourne College of Design and Communication
- 0 0 0 0 0 0
Robert Gordon University - 28 5 2 21 117 7 Roehampton University - 0 0 0 0 0 0 Rose Bruford College - 0 0 0 0 0 0 Royal Academy of Music - 0 0 0 1 134 0 Royal Agricultural College - 0 0 0 0 0 0 Royal College of Art - 67 26 7 0 13 5 Royal College of Music - 0 0 0 0 0 0 Royal Holloway University of London 36 9 4 3 17 0 2 Royal Northern College of Music - 0 0 0 0 0 0 Royal Scottish Academy of Music and Drama
- 0 0 0 0 0 0
Royal Veterinary College - 18 8 2 10 49 2 School of Oriental and African Studies - 0 0 0 0 0 0 School of Pharmacy - 11 14 2 14 457 0 Sheffield Hallam University - 73 8 16 4 108 0 Southampton Solent University - 0 0 0 0 0 0 St George's Hospital Medical School - 16 7 0 22 103 0 St Mary's University College - 0 0 0 0 0 0 Staffordshire University - 62 0 0 0 117 0 Swansea Metropolitan University - 0 22 0 0 0 0 Swansea University - 4 8 0 0 0 9 Thames Valley University - 0 0 0 0 0 0 Trinity College Carmarthen - 0 0 0 0 0 0 Trinity Laban Conservatoire of Music and Dance
- 0 0 0 0 0 0
University College Birmingham - 0 0 0 0 0 0 University College Falmouth - 0 0 0 0 0 0 University College for the Creative Arts at Canterbury, Epsom, Farnham, Maidstone, Rochester
- 0 0 0 0 0 0

A 8
Table A3.1: Universities – institution-level results, 2006 Definitions vary by survey
Country (primary data source) University R
&D
ag
reem
ents
Inve
ntio
n di
sclo
sure
s
Pate
nt
appl
icat
ions
Pate
nt
gran
ts
Lic
ense
s ex
ecut
ed
Lic
ense
in
com
e ea
rned
(k
Eur
os)
Spin
-off
s es
tabl
ishe
d
University College London 165 68 60 44 28 3,356 7 University College Plymouth St Mark & St John
- 0 0 0 0 0 0
University of Aberdeen - 27 16 20 9 980 2 University of Abertay Dundee - 4 0 0 0 1,001 0 University of Bath - 39 25 4 21 558 1 University of Bedfordshire - 0 0 0 0 0 0 University of Birmingham - 30 17 3 9 2,160 0 University of Bolton - 0 4 0 0 0 0 University of Bradford - 39 31 6 2 225 2 University of Brighton - 3 4 1 1 13 0 University of Cambridge - 118 112 28 35 5,043 2 University of Central Lancashire - 1 0 0 3 22 0 University of Chester - 0 2 0 352 364 0 University of Chichester - 0 0 0 0 0 1 University of Cumbria - 0 0 0 0 0 0 University of Derby - 0 1 0 14 19 0 University of Dundee 425 36 13 12 15 1,808 0 University of Durham - 37 9 0 14 42 2 University of East Anglia - 21 4 1 31 233 1 University of East London - 0 1 0 7 0 0 University of Edinburgh - 120 35 4 66 13,437 5 University of Essex - 16 11 0 0 402 0 University of Exeter - 15 3 0 1 290 0 University of Glamorgan - 22 6 0 3 6 1 University of Glasgow 534 55 36 6 20 1,127 2 University of Gloucestershire - 0 0 0 0 0 0 University of Greenwich - 10 9 2 99 236 1 University of Hertfordshire - 0 6 1 40 113 0 University of Huddersfield - 0 0 0 1 1,923 1 University of Hull - 9 10 10 0 23 2 University of Kent - 7 12 0 4 64 4 University of Leeds - 58 31 4 11 529 5 University of Leicester - 32 15 2 26 201 16 University of Lincoln - 0 1 0 0 6 0 University of Liverpool - 32 13 5 21 285 7 University of London - 0 0 0 0 0 0 University of Manchester - 276 38 34 140 7,248 8 University of Newcastle upon Tyne - 72 44 6 4 535 0 University of Northampton - 0 2 0 0 16 0 University of Northumbria at Newcas-tle
- 13 1 0 0 312 0
University of Nottingham - 86 61 4 14 941 4 University of Oxford - 184 122 108 80 7,057 7

A 9
Table A3.1: Universities – institution-level results, 2006 Definitions vary by survey
Country (primary data source) University R
&D
ag
reem
ents
Inve
ntio
n di
sclo
sure
s
Pate
nt
appl
icat
ions
Pate
nt
gran
ts
Lic
ense
s ex
ecut
ed
Lic
ense
in
com
e ea
rned
(k
Eur
os)
Spin
-off
s es
tabl
ishe
d
University of Plymouth - 12 13 0 7 59 3 University of Portsmouth - 4 0 15 2 0 5 University of Reading - 42 6 0 4 223 0 University of Salford - 31 1 0 0 14 1 University of Sheffield - 92 44 1 20 324 8 University of Southampton - 83 127 14 239 3,310 0 University of St Andrews - 16 30 5 5 458 0 University of Stirling - 0 0 0 0 1 0 University of Strathclyde 75 35 13 8 18 1,926 2 University of Sunderland - 4 3 1 3 0 1 University of Surrey 33 26 22 11 30 150 4 University of Sussex - 11 13 1 0 64 0 University of Teesside - 48 1 0 0 0 0 University of the Arts London - 3 3 0 29 438 2 University of the West of England, Bristol
- 18 21 9 202 131 0
University of the West of Scotland - 20 1 0 0 0 0 University of Ulster - 43 29 18 1 12 1 University of Wales Institute, Cardiff - 0 1 0 0 0 2 University of Wales, Lampeter - 0 0 0 0 0 1 University of Wales, Newport - 0 0 0 0 4 1 University of Warwick - 47 6 1 6 394 0 University of Westminster - 0 5 0 0 0 0 University of Winchester - 0 0 0 0 16 1 University of Wolverhampton - 29 13 1 2 3 0 University of Worcester - 0 0 0 0 0 0 University of York - 22 15 1 1 123 1 Writtle College - 0 0 0 0 0 0 York St John University - 0 0 0 0 0 0 Notes for Table A3.1: Definitions of indicators, see Table 6.2. Some data may come from other than the primary sources. Sources: HEFCE (2008), DASTI (2007), Conesa et al. (2007), data from ASTP and ProTon Europe.

A 10
Table A3.2: Other PROs – institution-level results, 2006 Definitions vary by survey
Country (primary data source) Research institution / hospital R
&D
ag
reem
ents
Inve
ntio
n di
sclo
sure
s
Pate
nt
appl
icat
ions
Pate
nt
gran
ts
Lic
ense
s ex
ecut
ed
Lic
ense
in
com
e ea
rned
(k
Eur
os)
Spin
-off
s es
tabl
ishe
d
Belgium (ProTon Europe) Université de Liège and Gesval S.A. (TT Company)
- 24 2 3 20 209 4
Czech Republic (ProTon Europe) Societas Rudolphina - 4 2 2 1 0 1 Denmark (DASTI) Rigshospitalet 0 18 4 0 1 151 1 Copenhagen County - 13 6 0 3 29 1 Århus Amt - 17 1 0 1 0 0 Odense Universitetshospital - 11 0 0 0 0 0 Aalborg Sygehus 40 3 1 1 1 144 0 Risø National Laboratory - 23 6 3 6 774 0 Statens Serum Institut - 8 3 7 2 1 0 National Environment Research Insti-tute (NERI)
- 4 0 0 0 0 0
Danmarks Fiskeriundersøgelser - 0 0 0 0 0 0 Danmarks Fødevareforskning - 2 0 0 2 0 0 Danmarks JordbrugsForskning - 10 14 1 1 124 0 Danmarks og Grønlands Geologiske Undersøgelse
- 0 0 1 0 0 0
Danmarks Rumcenter - 0 0 0 0 0 0 Statens Byggeforskningsinstitut - 0 0 0 0 10 0 Germany (ASTP and ProTon Europe) Technologie-Lizenz-Büro (TLB) GmbH - Baden-Württembergischen Hochschulen GmbH
- 150 29 5 12 2,200 0
Forschungszentrum Dresden-Rossendorf e. V.
- 16 15 9 6 65 1
EMBLEM 27 54 10 8 176 2,400 2 Max Planck Society Innovation - 151 66 - 81 9,500 2 German Cancer Research Center 12 45 26 24 14 1,200 0 Greece (ASTP) Hellenic Pasteur Institute 2 0 0 0 0 0 0 'Alexander Fleming' Biomedical Sci-ences Research Center
5 6 2 0 0 0 1
Portugal (ProTon Europe) Madeira Tecnopolo - 1 - - 1 1,000 5 Romania (ProTon Europe) Technological Transfer Centre CTT ICPE-CA
- 15 2 16 1 0 1
Notes for Table A3.2: Definitions of indicators, see Table 6.2. Some data may come from other than the primary sources. Sources: DASTI (2007), data from ASTP and ProTon Europe.

A 11
Annex 4: Aggregated country-level results for 2006 These tables should be considered more as a demonstration of what data are available than a good basis for comparison between KT results in different countries. In Annex 3, the differences in definitions between surveys impose an important limitation on direct comparison. These differences may be even more important when it comes to the interpretation of aggregated results. In the following, the best available KTO survey sources have been used. Both pub-licly available data for individual PROs and data given in confidence have been ag-gregated within the permissions granted by the respondents; see also Chapter 6.3.2. Numbers have been aggregated only on the basis of available data from these sources and no attempt has been made at aggregating the raw results to the total number of institutions in the country. Table 6.1 gives an indication of the coverage for each country in the case of universities. Tables showing results per million Euros research expenditure are in principle a better case for national comparisons than the tables giving raw results. However, given the data sets that were available to the Expert Group, it has not been feasible to produce meaningful indicator sets in compliance with the aggregation rules of Chapter 4.6 (on how to handle missing data). The main problem has been the lack of available data on R&D expenditure in several of the surveys where the group has had access to institu-tion level data, and the lack of sufficient information on non-response per item for data sets where only aggregate results have been available. This underlines the needs to produce R&D expenditure data at the level of the individual PRO and to have more survey operators agree on sharing data sets according to the rules of Chapter 6.3.

A 12
Table A4.1: Universities – raw country-level results, 2006 Definitions vary by survey Country N
umbe
r of
re
spon
dent
s
R&
D
agre
emen
ts
Inve
ntio
n di
sclo
sure
s
Pate
nt
appl
icat
ions
Pate
nt
gran
ts
Lic
ense
s ex
ecut
ed
Lic
ense
in
com
e ea
rned
(k
Eur
os)
Spin
-off
s es
tabl
ishe
d
Belgium 7 2,641 118 126 27 65 23,909 13 Denmark 9 225 259 78 3 97 1,856 14 Finland 5 2,047 224 8 3 30 76 38 France* 82 16,134 - 397 - - 9,383 106 Germany 5 1,713 171 100 95 49 908 16 Greece 4 336 3 7 2 10 83 12 Ireland 6 29 84 28 0 12 218 8 Italy 61 - 323 298 65 73 1,200 77 Netherlands 4 655 124 85 44 116 1,300 26 Portugal 5 22 63 33 17 7 130 12 Spain 60 - - 171 - 192 2,401 143 Sweden 3 150 221 39 8 1 325 19 Switzerland 16 2,289 363 182 - 183 5,351 39 United Kingdom 160 - 3,746 1,913 647 3,286 84,381 226 Notes for Table A4.1: Definitions of indicators, see Table 6.2. Only countries with three or more respondents are included. *: Data for FY 2005. Data for spin-offs are annualised from aggregated results 2000 – 2005. Sources: DASTI (2007), Fesch et al. (2008), Conesa et al. (2007), Piccaluga et al. (2007), HEFCE (2007), data from ASTP, ProTon Europe and C.U.R.I.E. Table A4.3: Other PROs – raw country-level results, 2006 Definitions vary by survey Country N
umbe
r of
re
spon
dent
s
R&
D
agre
emen
ts
Inve
ntio
n di
sclo
sure
s
Pate
nt
appl
icat
ions
Pate
nt
gran
ts
Lic
ense
s ex
ecut
ed
Lic
ense
in
com
e ea
rned
(k
Eur
os)
Spin
-off
s es
tabl
ishe
d
Denmark 16 260 132 43 13 33 1,327 3 Germany 6 86 416 161 46 291 15,375 6 Netherlands 3 27 39 18 3 20 - 1 Switzerland 3 365 41 30 - 13 353 2 United Kingdom 144 1,800 2,141 290 193 1,604 268,747 74 Notes for Table A4.3: Definitions vary by survey, see Table 6.2. Only countries with three or more respondents are included. Sources: DASTI (2007), Fesch et al. (2008), Technopolis (2007), data from ASTP and ProTon Europe.

A 13
Annex 5: References Arundel A and Bordoy C: The 2006 ASTP survey. The Hague: ASTP, 2006. Arundel A and Bordoy C: “Developing internationally comparable indicators for the
commercialization of publicly-funded research.” Working Papers Series 2008-075, Maastricht: UNU-MERIT, 2008.
Arundel A, Bordoy C and Kanerva A: Final results of the ASTP survey for fiscal year 2007. Amsterdam: ASTP, 2008.
Arundel A and Geuna A: “Proximity and the use of public science by innovative Eu-ropean firms.” Economics of Innovation and New Technology, 13: 559-580, 2004.
Arundel A, van de Paal G and Soete L: Innovation strategies of Europe's largest firms. Results of the PACE survey. European Innovation Monitoring System, Report No. 23, Luxembourg: European Commission, 1995.
AUTM: AUTM 2006 salary survey. Deerfield IL: AUTM, 2007a. AUTM: The better world report, parts I and II. Deerfield IL: AUTM, 2008. Bach L, Carayol N, Llerena P and Matt M: Les activités de valorisation dans les éta-
blissements universitaires français. Enquête 2005. Brest: Réseau C.U.R.I.E., 2006.
Bekkers R and Freitas I: “Analysing preferences for knowledge transfer channels be-tween universities and industry: To what degree do sectors also matter?” Re-search Policy, 37: 1837-1853, 2008.
Best M: “Regional specialization and cluster drivers: Medical devices in Massachu-setts.” Business and Economic History On-Line, 3: 1-35, 2005.
Blackler F: “Knowledge, knowledge work and organizations: An overview and inter-pretation.” Organization Studies, 16 (6): 1012-1046, 1995.
C(2008)1329: Commission Recommendation on the management of intellectual prop-erty in knowledge transfer activities and Code of Practice for universities and other public research organisations. Brussels: European Commission, 2008.
Cohen WM, Nelson RR and Walsh JP: “Links and impacts: The influence of public research on industrial R&D.” Management Science, 48: 1-23, 2002.
COM(2007)161: The European Research Area: new perspectives. Brussels: European Commission, 2007.
COM(2007)182: Improving knowledge transfer between research institutions and industry across Europe: embracing open innovation. Brussels: European Commission, 2007.
Conesa F, Martínez I, Muro M, Lucena F, de la Peña Y, Ramírez M, Guilera MJ and Cámara S: Informe encuesta RedOTRI 2006. Madrid: RedOTRI Universida-des, 2007.
Conesa F, Guilera MJ, López MA, Lucena F, Mura M, de la Peña Y and Ramírez M: Informe de la encuesta RedOTRI 2007. Madrid: RedOTRI Universidades (CRUE), 2008.
Cullen K: “Knowledge transfer; the role of the university in economic development.” Pp. 10-25 in Balling G and Gadsboell MS (eds.): Technology transfer 1; Tech-nology transfer and economic development. Aarhus: Hovedland, 2007.
Cullen K: “Scottish universities in the marketplace.” Pp. 89-101 in Engwall L and Weaire D (eds.): The university in the market. London: Portland Press, 2008.
DASTI: Public research commercialisation survey – Denmark 2006. Copenhagen: Danish Agency for Science, Technology and Innovation, 2007.

A 14
DASTI: Public research commercialisation survey – Denmark 2007. Copenhagen: Danish Agency for Science, Technology and Innovation, 2008.
DEST: National survey of research commercialisation 2003 and 2004. Canberra: Australian Government, Department of Education, Science and Training, 2007.
DLA Piper and Mason Hayes+Curran: Professor’s privilege. Draft report to the Commission (DG Research). Brussels and Dublin: DLA Piper and Mason Hayes+Curran, 2007.
European Commission: “Commission Recommendation of 6 May 2003 concerning the definition of micro, small and medium-sized enterprises.” Official Journal of the European Union, 46 (May 20): L124/36, 2003.
European Commission: “Community framework for state aid for research and devel-opment and innovation.” Official Journal of the European Union, 49 (Decem-ber 30): C323, 2006.
ERAWATCH: Research inventory reports for higher education institutions. European Communities, 2008. http://cordis.europa.eu/erawatch.
Fesch C, Baumberger F and Clerc G: Swiss technology transfer – report 2006. Bern: swiTT, 2008.
Finne H: Innovasjon i Trøndelag - samhandling, kreativitet og verdiskaping? Trond-heim: SINTEF, 2007.
Finne H and Hubak M: Nye arbeidsformer for MOBI? Om kompetansebruk i bedrifter og samhandling mellom forskning og bedrift. Oslo: Norges forskningsråd, 2004.
Flanigan S and Glavicic-Théberge (eds.): AUTM Canadian licensing activity survey: FY2007 survey summary. Deerfield IL: AUTM, 2008.
Gardner PL, Fong AY, and Huang RL: “Measuring the impact of knowledge transfer from public research organisations: A comparison of metrics used around the world.” Pp. 611-615 in Proceedings of ISMOT 2007, Hangzhou: Zheijang University, 2007.
Gold ER et al.: Toward a new era of intellectual property: From confrontation to ne-gotiation. Montreal: McGill University, 2008.
Grimpe C and Hussinger K: “Formal and informal technology transfer from academia to industry: Complementary effects and innovation performance.” ZEW Dis-cussion Paper 08-080, Mannheim: ZEW, 2008.
Gulbrandsen M and Rasmussen E: “Indicators for the commercialization of research: What do they tell us? The case of Norway.” Paper, PRIME Indicators Confer-ence, Oslo: May 2008.
Harhoff D: “Strategic patenting, innovation and competition. Towards sub-prime pat-ents?” Presentation, Jacquemin Seminar Series, Brussels: November 2008.
Hauknes J and Knell M: “Embodied knowledge and sectoral linkages: An input-output approach to the interaction of high- and low-tech industries.” Research Policy, in press, 2008.
HEFCE: Higher education-business and community interaction survey 2006-07. Bath: Higher Education Funding Council for England, 2008.
Holi MT, Wickramasinghe R and van Leeuwen M: Metrics for the evaluation of knowledge transfer activities at universities. Cambridge: Library House, 2008.
Inno, Logotech and Angle: Technology transfer institutions in Europe. An overview. [Karlsruhe]: Inno, 2004.
InterTradeIreland: University collaboration on technology transfer: An all-island fea-sibility study. Newry: InterTradeIreland, 2006.

A 15
IRE: Knowledge transfer strategies for regional development and competitiveness. Luxembourg: Innovative Regions in Europe Secretariat, 2008.
Jaffe A, Trajtenberg M and Henderson R: “Geographic localization of knowledge spillovers as evidenced by patents citations.” Quarterly Journal of Economics, 63: 577-98, 1993.
Library House: The impact of the University of Cambridge on the UK economy and society. Cambridge: Library House, 2006.
Lissoni F, Llerena P, McKelvey M and Sanditov B: “Academic patenting in Europe: new evidence from the KEINS database.” Research Evaluation, 17 (2): 87-102, 2008.
Narin F, Hamilton KS and Olivastro D: “The increasing linkage between U.S. tech-nology and public science.” Research Policy, 26: 317-20, 1997.
OECD: Frascati manual 2002. Proposed standard practice for surveys on research and experimental development. Paris: OECD, 2002.
OECD: Turning science into business. Patenting and licensing at public research organisations. Paris: OECD, 2003.
OECD: Oslo manual. Guidelines for collecting and interpreting innovation data. 3rd edition. Paris: OECD, 2005.
Phan PH and Siegel DS: “The effectiveness of university technology transfer: Lessons learned from quantitative and qualitative research in the US and the UK.” Rensselaer Working Papers in Economics, Number 0609, Troy NY: Rensse-laer Polytechnic Institute, 2006.
Piccaluga A, Balderi C, Conti G, Pievani L and Butelli P: Il salto di qualitá. Quinto rapporto annuale sulla valorizzazione della ricerca nelle università italiane. Milano: NetVal, 2007.
ProTon Europe: The ProTon Europe fourth annual survey report (fiscal year 2006). Brussels: ProTon Europe, 2008.
Ramos-Vielba I, Jiménez-Buedo M and Fernández-Esquinas M: “Third mission indi-cators: A view from the ground. A study of Andalusian firms.” Paper, PRIME Indicators Conference, Oslo: May 2008.
Read C: “Survey of intellectual property commercialisation in the higher education sector, 2004.” Working Paper 88F0006XIE – 011, Ottawa: Statistics Canada, 2006.
SEC(2007)449: Voluntary guidelines for universities and other research institutions to improve their links with industry across Europe. Brussels: European Com-mission, 2007.
Stevens AJ, Toneguzzo F and Bostrom D (eds.): AUTM U.S. licensing survey. FY 2004 Survey summary. Northbrook IL: AUTM, 2005.
Technopolis: Third annual survey of knowledge transfer activities in public sector research establishments. Brighton: Technopolis, 2007.
Technopolis: Fourth annual survey of knowledge transfer activities in public sector research establishments. Brighton: Technopolis, 2008.
Tieckelmann R, Kordal R and Bostrom D (eds.): AUTM U.S. licensing activity sur-vey: FY2007 survey summary. Deerfield IL: AUTM, 2008.
Links to surveys and other relevant material, including many of the documents refer-enced in this report, can be found at http://ec.europa.eu/invest-in-research/policy/ipr_en.htm

A 16
KT surveys A. Arundel and C. Bordoy (2006) Summary report: The 2006 ASTP survey http://www.astp.net/Survey/Summary%20ASTP%20report-June%2026.pdf A. Arundel and C. Bordoy (2007) Summary report for respondents: The ASTP survey for fiscal year 2006 http://www.astp.net/Survey/Summary_2007_ASTP_report.pdf A. Arundel, M. Kanerva and C. Bordoy (2008) Summary report for respondents: The ASTP survey for fiscal year 2007 http://www.astp.net/Survey%202008/Summary_2008_ASTP_report.pdf L. Bach, N. Carayol, P. Llerena and M. Matt (2006) Les activités de valorisation dans les établissements universitaires français. Enquête 2005 http://media.education.gouv.fr/file/Valorisation/39/8/Enquete_valo_1_(page_2)_33398.pdf D. Bostrom, C. Bruce and S. Flanigan (2007) AUTM Canadian licensing activity survey, FY 2006: A survey summary of technol-ogy licensing (and related) performance for Canadian academic and nonprofit institu-tions and technlogy investment firms FILE SOURCE Knowledge Transfer Metrics project D. Bostrom and R. Tieckelmann (2007) AUTM U.S. licensing survey, FY 2005: A survey summary of technology licensing (and related) performance for U.S. academic and nonprofit institutions and technlogy investment firms http://www.autm.net/AM/Template.cfm?Section=FY_2005_Licensing_Survey D. Bostrom and R. Tieckelmann (2007) AUTM U.S. licensing activity survey, FY 2006: Survey summary. A survey of tech-nology licensing (and related) activity for U.S. academic and nonprofit institutions and technlogy investment firms http://www.autm.net/AM/Template.cfm?Section=Licensing_Surveys_AUTM&CONTENTID=2407&TEMPLATE=/CM/ContentDisplay.cfm F. Conesa, E. Castro and M. Zárate (2005) ProTon Europe annual survey financial year 2004 results report http://www.protoneurope.org/reports/surres2004/attachment_download/file

A 17
F. Conesa, E. Castro and M. E. Zárate (2007) The ProTon Europe 2005 annual survey report http://www.protoneurope.org/reports/2005AnnualSurveyReport/attachment_download/file F. Conesa, M. J. Guilera, M. Á. López, F. Lucena, M. Muro, Y. de la Peña and M. Ramírez (2008) Informe de la encuesta RedOTRI 2007 http://www.redotriuniversidades.net/index.php?option=com_docman&task=doc_download&gid=768&mode=view F. Conesa, I. Martínez, M. Muro, F. Lucena, Y. de la Peña, M. Ramírez, M. J. Guilera and S. Cámara (2007) Informe encuesta Redotri 2006 http://www.redotriuniversidades.net/index.php?option=com_docman&task=doc_download&gid=767&mode=view DASTI (2006) Public research commercialisation survey Denmark 2005 http://en.fi.dk/publications/2006/public-research-commercialisation-survey-denmark-2005/public-research-commercialisation-report-2005.pdf DASTI (2007) Public research commercialisation survey Denmark 2006 http://en.fi.dk/publications/publications-2007/public-research-commercialisation-survey-denmark-2006/Public%20Research%20Commercialisation%20Survey%20-%20Denmark%202006.pdf DASTI (2008) Public research commercialisation survey Denmark 2007 http://en.fi.dk/publications/publications-2008/public-research-commercialisation-survey-denmark-2007/UK-Kommercialisering07-screen.pdf C. Fesch, F. Baumberger and G. Clerc (2008) Swiss technology transfer - report 2006 http://www.switt.ch/files/reports/swiTT_TT_survey_2006.pdf S. Flanigan and T. Glavicic-Théberge (2008)

A 18
AUTM Canadian licensing activity survey, FY2007: A survey summary of technol-ogy licensing (and related) performance for Canadian academic and nonprofit institu-tions and technlogy investment firms http://www.autm.net/Content/NavigationMenu/Surveys/LicensingSurveysAUTM/FY2007LicensingActivitySurvey/AUTMCanadianLS07FINAL.pdf HEFCE (2007) Higher education-business and community interaction survey 2004-05 and 2005-06 http://www.hefce.ac.uk/pubs/hefce/2007/07_17/ HEFCE (2008) Higher education - business and community interaction survey 2006-07 http://www.hefce.ac.uk/pubs/hefce/2008/08_22 OECD (2003) Turning science into business. Patenting and licensing at public research organisations http://213.253.134.43/oecd/pdfs/browseit/9203021e.pdf A. Piccaluga, C. Balderi, G. Conti and L. Pievani ([2007]) Il salto di qualità. Quinto rapporto annuale sulla valorizzazione della ricerca nelle università italiane http://www.netval.it/contenuti/file/Rapporto_Netval_2007.pdf A. Piccaluga, C. Balderi, G. Conti and L. Pievani ([2007]) Step up in quality. Fifth annual report on the research exploitation in Italian universi-ties. Executive summary Netval survey 2007 FILE SOURCE: Knowledge Transfer Metric project A. Piccaluga, C. Balderi, L. Pievani, G. Conti and P. Butelli ([2006]) La valorizzazione della ricerca nelle università italiane. Quarto rapporto annuale (dati relativi al periodo 2002-2005) http://www.netval.it/contenuti/file/Rapporto_Netval_2006.pdf A. Piccaluga, F. Cesaroni and P. C. Moscara ([2005]) Seconda indagine sull'attività di valorizzazione della ricerca scientifica presso le uni-versità italiane (dati relativi al 2003) http://www.netval.it/contenuti/file/Rapporto_Netval_2004.pdf A. Piccaluga, P. C. Moscara, F. Cesaroni, A. Bax, L. Pievani and G. Conti ([2006]) Terza indagine sulla valorizzazione della ricerca nelle università italiane (dati relativi al 2004) http://www.netval.it/contenuti/file/Rapporto_Netval_2005.pdf

A 19
ProTon Europe (2006) 1st ProTon Europe survey financial year 2003 http://www.protoneurope.org/reports/surres2003/attachment_download/file ProTon Europe (2008) The ProTon Europe fourth annual survey report (fiscal year 2006) http://www.protoneurope.org/reports/copy_of_2006AnnualSurveyReport/attachment_download/file H. Reutimann and C. Fesch (2007) Survey report on swiss technology transfer activities for the year 2005 http://www.switt.ch/files/reports/switt_TT_survey_2005.pdf A. J. Stevens, F. Toneguzzo and D. Bostrom (2005) AUTM U.S. licensing survey, FY 2004 survey summary http://www.autm.org/events/File/04AUTMSurveySum-USpublic.pdf A. J. Stevens, F. Toneguzzo and D. Bostrom (2005) AUTM U.S. licensing survey, FY 2004: A survey summary of technology licensing (and related) performance for U.S. academic and nonprofit institutions, and technol-ogy investment firms FILE SOURCE Knowledge Transfer Metrics project Technopolis (2006) Second annual survey of knowledge transfer activities in public sector research estab-lishments http://www.technopolis-group.com/resources/downloads/reports/516_2005_PSRE_Report.pdf Technopolis (2007) Third annual survey of knowledge transfer activities in public sector research estab-lishments http://www.berr.gov.uk/files/file40489.pdf Technopolis (2008) Fourth annual survey of knowledge transfer activities in public sector research estab-lishments http://www.berr.gov.uk/files/file40489.pdf R. Tieckelmann, R. Kordal and D. Bostrom (2008)

A 20
AUTM U.S. licensing activity survey, FY2007: A survey summary of technology licensing (and related) activity for U.S. academic and nonprofit institutions and tech-nlogy investment firms http://www.autm.net/Content/NavigationMenu/Surveys/LicensingSurveysAUTM/FY2007LicensingActivitySurvey/AUTMUSLS07FINAL.pdf


European CommissionEUR 23894 - Metrics for Knowledge Transfer from Public Research Organisations in Europe
2009 — 72 pp. — 21,0 x 29,7 cmLuxembourg: Office for Official Publications of the European Communities
ISBN 978-92-79-12009-1
-knowledgde transfer_cover:Layout 1 16/04/09 17:09 Page 5

How to obtain EU publications
Publications for sale:• via EU Bookshop (http://bookshop.europa.eu);• from your bookseller by quoting the title, publisher and/or ISBN number;• by contacting one of our sales agents directly. You can obtain their contact details on the Internet
(http://bookshop.europa.eu) or by sending a faxto +352 2929-42758.
Free publications:• via EU Bookshop (http://bookshop.europa.eu);• at the European Commission's representations or delegations. You can obtain their contact details on the Internet
(http://ec.europa.eu) or by sending a faxto +352 2929-42758.
-knowledgde transfer_cover:Layout 1 16/04/09 17:09 Page 7

KI-NA-23894-EN-N
-knowledgde transfer_cover:Layout 1 16/04/09 17:09 Page 8