metrics for mitigating cybersecurity threats to networks · metrics for mitigating cybersecurity...
TRANSCRIPT
Calhoun: The NPS Institutional Archive
Faculty and Researcher Publications Faculty and Researcher Publications
2010-01
Metrics for Mitigating Cybersecurity
Threats to Networks
Schneidewind, Norman
Monterey, California. Naval Postgraduate School
http://hdl.handle.net/10945/35059

Net
wor
k Se
curi
ty
64 Published by the IEEE Computer Society 1089-7801/10/$26.00 © 2010 IEEE IEEE INTERNET COMPUTING
T he significant threat of cyberat-tacks on critical infrastructure can motivate metric development.
Physical destruction is not the only threat to critical infrastructure sys-tems1 — if a system such as an electric grid suffers a cyberattack and cannot accurately control power distribution using computer networks, such as the Internet, the effect could be as disas-trous as a direct terrorist attack on power plants or transmission lines.2 In the US, almost every economic and social function is based in some way on energy distribution, telecommunication services, and transportation services. A successful cyberattack on these infra-structures would have devastating effects on the economy and public life.3
In addition, President Barack Obama says that the US must begin building a “smart grid,” which would make the country less vulnerable to blackouts or even attacks, in addition to saving money and aiding renewable energy.
The costs of worms, viruses, and other malicious software (malware) attacks have been significant. The num-ber of such attacks reported has gone from near zero in the mid 1990s (four attacks reported in 1995) to roughly 200,000 in 2003. Cost estimates for cyberattacks, including hacking, mal-ware, and spam, have gone from US$1 billion in 1996 to $56 billion in 2004.1 The estimated costs include business interruption, denial of service (DoS), data theft or deletion, loss of sensitive
To achieve their full potential, networks must be secure as well as functional.
With this in mind, the author identifies metrics designed to mitigate
vulnerabilities to cyberattacks in networks that are key to the critical
infrastructure of the US. He discusses both growth metrics — based on
data obtained from the US National Institute of Standards and Technology
and Department of Homeland Security vulnerability database — and metrics
designed to mitigate the risk of security vulnerabilities in networks. If used
together, these two types of metrics can help make networks more secure.
Norman SchneidewindNaval Postgraduate School
Metrics for Mitigating Cybersecurity Threats to Networks
Authorized licensed use limited to: University of Pittsburgh. Downloaded on January 6, 2010 at 16:43 from IEEE Xplore. Restrictions apply.

JANUARY/FEBRUARY 2010 65
Metrics for Mitigating Cybersecurity Threats
intelligence or intellectual property, loss of repu-tation, and share-price declines.4 Unfortunately, the threat is not confined to organizations such as public utilities. Rather, it’s pervasive, involv-ing, for example, financial, investment, and information distribution institutions; even pop-ular social networking organizations are vul-nerable to attack. Thus efforts to mitigate the threat of vulnerabilities should be universal.
Multivector threat weapons attempt to exploit a diverse array of security vulnerabili-ties to gain access to a system. Buffer over-flows, HTTP input validation vulnerabilities, and known default passwords are just a few common entry points for these hybrid threats. We are continually discovering vulnerabilities in all kinds of email, Web, chat, file transfer, and other services and functions. It is well known that many of these vulnerabilities are not patched immediately (or at all) because system administrators are increasingly overwhelmed by the sheer volume of vulnerability reports and advisories. Attackers can incorporate any combination of these ubiquitous vulnerabilities — or even as yet undisclosed flaws — into a dan-gerous tool. Once the malicious code has gained access to a system, it can propagate and execute its payload. So, we can assume that the inci-dence of attacks is proportional to the presence of vulnerabilities5 and thus mitigate the conse-quences of an attack on facilities such as the electric grid by forecasting such vulnerabilities and their rate of change.
The existing federal incident reporting sys-tem contains qualitative attack information but does not support quantitative vulnerability assessment. Thus, the security community must focus on developing vulnerability forecasting equations from publicly available sources that organizations can use to predict vulnerability to cyberattacks based on various factors. I have designed several metrics that could help avert the risks of vulnerabilities.
Cyber Incident Reporting SystemOne reason for developing metrics systems is that although the following incident catego-ries and reporting system are useful, they are qualitative; require too much information to be reported, which can lead to disuse; and have no statistical or forecasting capability. The last point is crucial because although we cannot do anything about the past, we can proactively
mitigate the effects of cyberattacks that are likely to occur in the future by quantitatively forecasting vulnerabilities.
The US federal government’s cyberattack reporting system is issued by the National Institute of Standards and Technology (NIST) and Department of Homeland Security (DHS). As NIST Special Publication 800-61 defines, a computer security incident within the fed-eral government is a violation or imminent threat of violation of computer security poli-cies, acceptable use policies, or standard com-puter security practices (see http://csrc.nist.gov/publications/nistpubs/800-61/sp800-61.pdf ). Reports of computer security incidents should include a description of the incident or event, using the appropriate taxonomy and as much of the following information as possible (however, reporting shouldn’t be delayed to gain addi-tional information):
• agency name;• point-of-contact information, including
name, telephone number, and email address;• incident category type (that is, CAT 1 or CAT
2; see Table 1); • incident date and time, including time zone;• source IP, port, and protocol;• destination IP, port, and protocol;• operating system, including the version,
patches; • system function (for example, DNS/Web
server or workstation);• antivirus software installed, including ver-
sion and latest updates;• location of the systems involved in the inci-
dent (Washington, DC, or Los Angeles, for example);
• method used to identify the incident, audit log analysis, system administrator);
• impact to agency; and • resolution.
Technical Approach The approach I propose is to develop risk-based metrics that can identify system vulnerabili-ties and detect anomalous system behavior6 to mitigate Internet cyberattack effects.7 The goal is to reduce the risk of cyberattack on the US’s critical infrastructure. We can link these met-rics to the operations of critical infrastructure control functions, such as multilayered electric grid systems (for instance, substation networks
Authorized licensed use limited to: University of Pittsburgh. Downloaded on January 6, 2010 at 16:43 from IEEE Xplore. Restrictions apply.

Network Security
66 www.computer.org/internet/ IEEE INTERNET COMPUTING
linked via the Internet). Although I use the electric grid as an example for explaining the technical approach, the metrics and the metrics development process are applicable to all criti-cal infrastructure systems. It would be conve-nient to have a single metric, say, on a scale of 1 to 100, to capture the cyberattack threat. How-ever, cybersecurity is a multivariable problem, and attempting to mix the variables in a single metric would obscure each variable’s contribu-tion to a system’s vulnerability.
Vulnerability Forecasting MetricsTo provide a framework for analyzing metrics, we can divide the metrics into the following categories: severity, type of vulnerability (for example, buffer-overflow error), vulnerabil-ity by type of system access (network, adja-cent network, and local), and vendor source of vulnerability. I base this categorization on the Common Vulnerability Scoring System (CVSS).8 The data I used in computing the metrics is
from the publicly available NIST/DHS National Vulnerability Database (http://nvd.nist.gov), which comprises data collected from real-world networks. Because these are time-series data, and the objective is to develop forecast-ing metrics, I plot the data and use regression analysis to construct forecasting equations. If you wish to analyze cybersecurity for your particular network, you would start by deter-mining whether there is any historical vulner-ability data for that network. If so, you would plot the vulnerability count over time and use regression analysis to develop forecasting equa-tions. If you lack data, use the NIST/DHS data to develop forecasting equations. In addition to being collected from actual networks, the data is reported by major network vendors. Thus, you could use data corresponding to your vendor-supplied network and develop representative forecasting equations.
The National Vulnerability Database con-tains a CVSS 2 calculator that was used for
Table 1. Federal agency incident categories.
Category Name Description Reporting time frame
CAT 0 Exercise: network defense testing
Used during state, federal, national, and international exercises, and approved activity testing of internal/external network defenses or responses.
Not applicable; is for each agency’s internal use during exercises
CAT 1 Unauthorized access Used when an individual gains unauthorized logical or physical access to a federal agency network, system, application, data, or other resource.
Within one hour of discovery/detection
CAT 2 Denial of service (DoS)
Used when an attack successfully prevents or impairs the normal authorized functionality of networks, systems, or applications by exhausting resources (includes being the victim or participating in the DoS).
Within two hours of discovery/detection if the successful attack is still ongoing and the agency is unable to successfully mitigate activity
CAT 3 Malicious code Used when successful installation of malicious software (such as a virus, worm, Trojan horse, or other code-based malicious entity) infects an operating system or application. Agencies aren’t required to report malicious logic that has been successfully quarantined by antivirus software.
Daily (within one hour of discovery/detection if widespread across agency)
CAT 4 Improper usage Used when someone violates acceptable computing use policies.
Weekly
CAT 5 Scans/probes/attempted access
Includes any activity that seeks to access or identify a federal agency computer, open ports, protocols, service, or any combination for later exploit. This activity doesn’t directly result in a compromise or DoS.
Monthly (if system is classified, report within one hour of discovery)
CAT 6 Investigation Includes unconfirmed incidents that are potentially malicious or anomalous activity that the reporting entity deems warrants further review.
Not applicable; is for each agency’s use to categorize a potential incident that’s currently being investigated
Authorized licensed use limited to: University of Pittsburgh. Downloaded on January 6, 2010 at 16:43 from IEEE Xplore. Restrictions apply.

JANUARY/FEBRUARY 2010 67
Metrics for Mitigating Cybersecurity Threats
these calculations. The calculator computes the vulnerability severity score based on sev-eral subjective metrics, such as related exploit range, undefined local adjacent network, and network attack complexity. This is one way to assess vulnerability that practitioners might find useful. An advantage is that it lets you immediately assess vulnerability. It’s often tempting to assign qualitative values to sub-jective factors and then compute an overall score, but a better approach is to just use the qualitative assessments and not compute a numerical score that could be devoid of mean-ing. My proposed approach, taking the long view, uses the CVSS vulnerability categories to develop forecasting equations with the impor-tant objective of predicting vulnerabilities’ future impact.
SeverityFigures 1 and 2 show the first category, sever-ity. Figure 1 plots the actual any (that is, all severities), high, medium, and low severities for the period from 1988 to 2007, as the NIST/DHS vulnerability database defines them. The rea-son for the decrease in 2007 is that not all of the data for that year had been reported when I conducted this analysis. In addition, I fitted a curve to the any category plot so that I could develop a vulnerability predictor for 2008. A very good fit, represented by R2, shows that vulnerabilities are increasing at an exponen-tial rate, which would be an alert to security personnel to mitigate those vulnerabilities’ consequences. Figure 2 shows both the pre-dicted any count and its rate of change. Given that the predictor is an exponential function, the rate of change is proportional to the count. Because we can expect attacks proportional to vulnerabilities, this doesn’t bode well for the IT community. These forecasts serve as alerts that it should take action to mitigate the threat of cyberattacks, such as intrusion-detection moni-tors installed at the interface of local networks and the Internet, as Figure 3 shows. (I could have used many networks to portray the cyber threat — I use the substation diagram in Fig-ure 3 because it illustrates the threat to the US’s electric grid mentioned previously.) Thus, you can see that a good way to assess the criticality of vulnerabilities over time is to forecast their rate of change. An increasing trend foretells an increasing threat.
Type of VulnerabilityThe second category — type of vulnerability — also exhibits exponential growth. To illus-trate this growth, Figure 4 shows two types of vulnerability: buffer overflow and software design errors. The first type represents the con-sequences of DoS attacks, which in many cases lead to buffer overflow; this type is growing at a fast clip. A good countermeasure is to use a buffer size limit and check it on every access to the buffer. The second type is under the software engineer’s control; all code should be secure from internal and external corruption. Fitting a predictor function to these data was not possible because R2, the fraction of depen-
0
2,000
4,000
6,000
8,000
10,000
12,000
14,000
16,000
18,000
20,000
1 2 3 4 5 6 7 8 9 10 11 12 13 14 15 16 17 18 19 20 21t (1988–2008)
V (t
) R
ate
of c
hang
e
V (t ) = 1.6707 *e(0.4437t )
R 2 = .9614
Series 1: actual any severity countSeries 2: actual high severity countSeries 3: actual medium severity countSeries 4: actual low severity countSeries 5: predicted any severity count
Figure 1. The vulnerability count V(t) vs. time t. We can see the actual any (that is, all severities), high, medium, and low severities for the period from 1988 to 2007.
0
2,000
4,000
6,000
8,000
10,000
12,000
14,000
16,000
18,000
20,000
1 2 3 4 5 6 7 8 9 10 11 12 13 14 15 16 17 18 19 20 21t (1988–2008)
V (t
) R
ate
of c
hang
e
Series 1: Predicted any vulnerability count V (t )Series 2: Rate of change of V (t )
0.4437 V (t )
Figure 2. The vulnerability count V(t) and the rate of change in V(t). Given that the predictor is an exponential function, the rate of change is proportional to the count.
Authorized licensed use limited to: University of Pittsburgh. Downloaded on January 6, 2010 at 16:43 from IEEE Xplore. Restrictions apply.

Network Security
68 www.computer.org/internet/ IEEE INTERNET COMPUTING
dent variable variation accounted for by inde-pendent variable variation, was low.
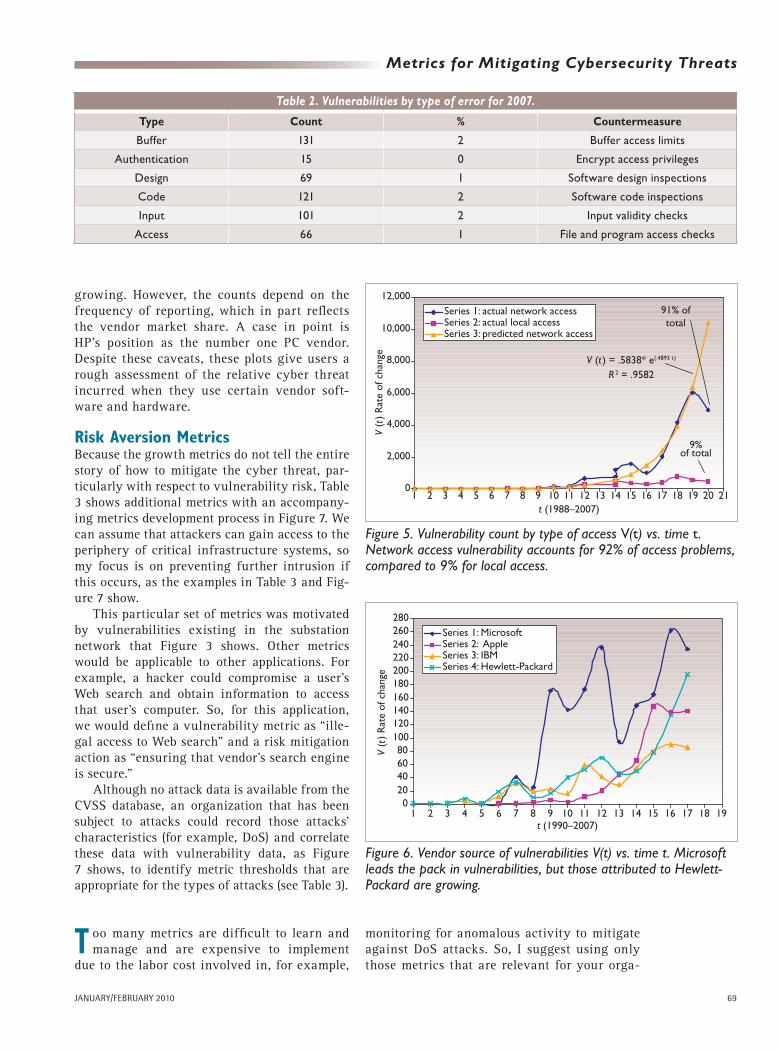
Table 2 shows the major contributors to soft-ware flaws in 2007 by type of vulnerability error, along with the corresponding counter-measures. The database has so many categories that a given one doesn’t represent a large per-centage of total vulnerabilities for 2007, but the table shows the more significant ones. Many of the vulnerability types in Table 2 aren’t new to IT. Protection against buffer overflow, design and code inspections, checking input data to
see that it doesn’t corrupt the program, and checks to determine the validity of access were considered good software development prac-tices long before the cyber threat — thus, just enforcing these practices would go a long way toward mitigating that threat.
Type of Access CategoryFigure 5 dramatically shows that when we ana-lyze the type of access, we should really worry about network connectivity and the conse-quences of Internet attacks.9,10 Not only does this vulnerability grow exponentially, but it also accounts for 91 percent of access problems reported in 2007 (as opposed to 9 percent for local access). Furthermore, network vulnerabili-ties’ rate of change will track vulnerabilities at a proportionality constant of 0.4893, as the prediction equation shows. We can have confi-dence in the predictor V (t) because of R2’s high value. An example of a countermeasure is the packet filter that’s installed between the substa-tion network and the Internet in Figure 3.
Vendor Source CategoryFigure 6 shows the last category, vendor source of vulnerabilities, which is both interest-ing and requires some caveats. As expected, Microsoft leads the pack, but vulnerabilities attributed to Hewlett-Packard (HP) are rapidly
Ethernet
Gateway 1 Buffer
Relay Remote transfer unit Meter Sequence ofevents recorder
Gateway 2 buffer Gateway 3 buffer
Substation communication networkPersonal computer
Power quality Digital fault recorder
Intelligent electronic devices
L
L: link attack: severe; affects a major part of the networkN: node attack: less severe; affects only Gateway 2
Anomalous activity monitor
Router
Othersubstationnetworks
External attack(�ooding)
entrypoints
External attack entry point examples:modemcable modemDSLwireless
N
Packet �lter
Internet
Figure 3. Substation network vulnerabilities. This diagram illustrates the threat to the US’s electrical grid.
t (2001–2007)
0102030405060708090
100110120130140
1 2 3 4 5 6 7
Erro
rs
Series 1: buffer over�ow errorsSeries 3: software design errors
Figure 4. Vulnerability count. We can see two types of vulnerability — buffer-overflow errors and design errors — vs. time t.
Authorized licensed use limited to: University of Pittsburgh. Downloaded on January 6, 2010 at 16:43 from IEEE Xplore. Restrictions apply.
JANUARY/FEBRUARY 2010 69
Metrics for Mitigating Cybersecurity Threats
growing. However, the counts depend on the frequency of reporting, which in part reflects the vendor market share. A case in point is HP’s position as the number one PC vendor. Despite these caveats, these plots give users a rough assessment of the relative cyber threat incurred when they use certain vendor soft-ware and hardware.
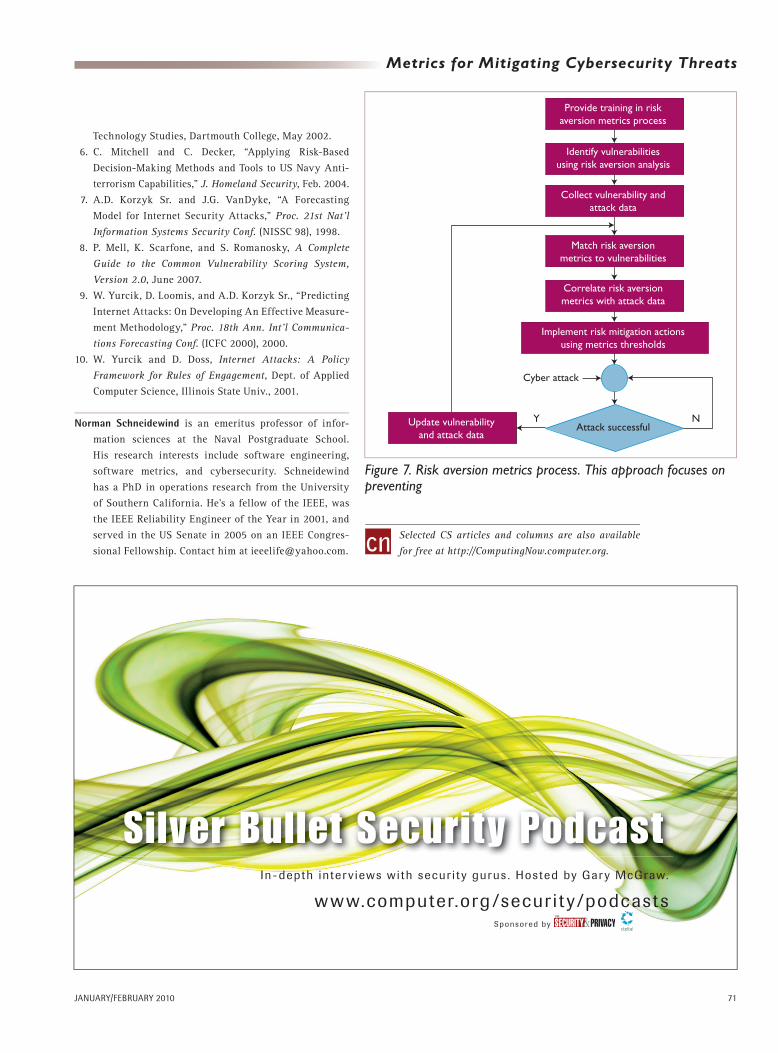
Risk Aversion MetricsBecause the growth metrics do not tell the entire story of how to mitigate the cyber threat, par-ticularly with respect to vulnerability risk, Table 3 shows additional metrics with an accompany-ing metrics development process in Figure 7. We can assume that attackers can gain access to the periphery of critical infrastructure systems, so my focus is on preventing further intrusion if this occurs, as the examples in Table 3 and Fig-ure 7 show.
This particular set of metrics was motivated by vulnerabilities existing in the substation network that Figure 3 shows. Other metrics would be applicable to other applications. For example, a hacker could compromise a user’s Web search and obtain information to access that user’s computer. So, for this application, we would define a vulnerability metric as “ille-gal access to Web search” and a risk mitigation action as “ensuring that vendor’s search engine is secure.”
Although no attack data is available from the CVSS database, an organization that has been subject to attacks could record those attacks’ characteristics (for example, DoS) and correlate these data with vulnerability data, as Figure 7 shows, to identify metric thresholds that are appropriate for the types of attacks (see Table 3).
T oo many metrics are difficult to learn and manage and are expensive to implement
due to the labor cost involved in, for example,
monitoring for anomalous activity to mitigate against DoS attacks. So, I suggest using only those metrics that are relevant for your orga-
Table 2. Vulnerabilities by type of error for 2007.
Type Count % Countermeasure
Buffer 131 2 Buffer access limits
Authentication 15 0 Encrypt access privileges
Design 69 1 Software design inspections
Code 121 2 Software code inspections
Input 101 2 Input validity checks
Access 66 1 File and program access checks
1 2 3 4 5 6 7 8 9 10 11 12 13 14 15 16 17 18 19 20 21t (1988–2007)
V (t
) R
ate
of c
hang
e
0
2,000
4,000
6,000
8,000
10,000
12,000Series 1: actual network accessSeries 2: actual local accessSeries 3: predicted network access
91% oftotal
9%of total
V (t ) = .5838* e(.4893 t )
R 2 = .9582
Figure 5. Vulnerability count by type of access V(t) vs. time t. Network access vulnerability accounts for 92% of access problems, compared to 9% for local access.
t (1990–2007)
V (t
) R
ate
of c
hang
e
020406080
100120140160180200220240260280
1 2 3 4 5 6 7 8 9 10 11 12 13 14 15 16 17 18 19
Series 1: MicrosoftSeries 2: AppleSeries 3: IBMSeries 4: Hewlett-Packard
Figure 6. Vendor source of vulnerabilities V(t) vs. time t. Microsoft leads the pack in vulnerabilities, but those attributed to Hewlett-Packard are growing.
Authorized licensed use limited to: University of Pittsburgh. Downloaded on January 6, 2010 at 16:43 from IEEE Xplore. Restrictions apply.

Network Security
70 www.computer.org/internet/ IEEE INTERNET COMPUTING
nization’s security system. In Table 3, “met-ric threshold” corresponds to the metric value when risk mitigation is invoked. Not all these metrics would necessarily be allocable to all organizations. Based on past vulnerabilities, an organization could select metrics that are most applicable to its environment. For exam-ple, if an attacker has hacked an organization from the outside, installing a firewall is easy to do and could provide the most benefit for the investment.
Many attacks originate from inside an orga-nization, however, so organizations should adopt risk aversion metrics, such as the access control lists and code-scanning tools Table 3 lists, to prevent access to critical resources by unauthorized personnel.
In addition to these risk-mitigation ac tions,
cryptography and user authentication are useful for preventing break-ins to critical infrastructures.
References1. J. Moteff and P. Parfomak, “Critical Infrastructure and
Key Assets: Definition and Identification,” Congressio-
nal Research Service Report for Congress, 1 Oct. 2004.
2. “A Crisis of Prioritization,” President’s Information
Technology Advisory Committee, Feb. 2005.
3. “Department of Homeland Security Faces Challenges
in Fulfilling Cybersecurity Responsibilities,” report
to congressional requesters, US Government Account-
ability Office, May 2005.
4. B. Cashell et al., “The Economic Impact of Cyber
Attacks,” Congress Research Service Report for Con-
gress, 1 Apr. 2004.
5. Diversification of Cyber Threats, Inst. for Security
Table 3. Risk aversion metrics.
Vulnerability Example consequence
Example risk mitigation action
Metric Metric computation
Example metric threshold
No access control to critical resources
Loss of substation digital fault recorder (see Figure 3)
Access-control lists M1 = number of critical access points not checked
Count number of critical access points not checked
M1 > 0
Multipath entries to facility (for example, modem, cable modem, DSL, wireless access; see Figure 3)
Malicious access to substation network assets (for example, gateways; see Figure 3)
Install firewalls at entry points
M2 = number of paths
Count number of paths that could be used to enter the facility
M2 > 1
Lack of security controls at multiple entry points in substation network
Denial-of-service attack
Install anomalous activity monitor (see Figure 3)
M3 = number of entry points unprotected
Count number of unprotected entry points
M3 > 1
Lack of tamper-proof computer code
Computer code lacks checks of unauthorized access and input
Use code-scanning tool and inspection teams to determine whether code is tamper-proof (see Figure 3)
M4 = fraction of code not protected
Divide number of source lines of code not protected by number of source lines in program
M4 > .50
Lack of security in vendor-provided software
Invitation for attackers to exploit security holes
Require security certification of vendor software
M5 = time-series trend of reported security holes
Observe trend in security hole data over time
M5 = mean + 3 standard deviations of reports over time
Critical network links and nodes that are exposed to attack
Major part of substation network rendered inoperative (see Figure 3)
Install packet filter in link* (see Figure 3)
M6 = fraction of scheduled operating time when outages have occurred
Divide number of outage hours by number of scheduled hours
M6 > .05
*N. Brownlee and K.C. Claffy, “Internet Measurement,” IEEE Internet Computing, vol. 8, no. 5, 2004, pp. 30–34.
Authorized licensed use limited to: University of Pittsburgh. Downloaded on January 6, 2010 at 16:43 from IEEE Xplore. Restrictions apply.
JANUARY/FEBRUARY 2010 71
Metrics for Mitigating Cybersecurity Threats
Technology Studies, Dartmouth College, May 2002.
6. C. Mitchell and C. Decker, “Applying Risk-Based
Decision- Making Methods and Tools to US Navy Anti-
terrorism Capabilities,” J. Homeland Security, Feb. 2004.
7. A.D. Korzyk Sr. and J.G. VanDyke, “A Forecasting
Model for Internet Security Attacks,” Proc. 21st Nat’l
Information Systems Security Conf. (NISSC 98), 1998.
8. P. Mell, K. Scarfone, and S. Romanosky, A Complete
Guide to the Common Vulnerability Scoring System,
Version 2.0, June 2007.
9. W. Yurcik, D. Loomis, and A.D. Korzyk Sr., “Predicting
Internet Attacks: On Developing An Effective Measure-
ment Methodology,” Proc. 18th Ann. Int’l Communica-
tions Forecasting Conf. (ICFC 2000), 2000.
10. W. Yurcik and D. Doss, Internet Attacks: A Policy
Framework for Rules of Engagement, Dept. of Applied
Computer Science, Illinois State Univ., 2001.
Norman Schneidewind is an emeritus professor of infor-
mation sciences at the Naval Postgraduate School.
His research interests include software engineering,
software metrics, and cybersecurity. Schneidewind
has a PhD in operations research from the University
of Southern California. He’s a fellow of the IEEE, was
the IEEE Reliability Engineer of the Year in 2001, and
served in the US Senate in 2005 on an IEEE Congres-
sional Fellowship. Contact him at [email protected].
Selected CS articles and columns are also available
for free at http://ComputingNow.computer.org.
Provide training in riskaversion metrics process
Identify vulnerabilitiesusing risk aversion analysis
Collect vulnerability andattack data
Match risk aversionmetrics to vulnerabilities
Correlate risk aversionmetrics with attack data
Implement risk mitigation actionsusing metrics thresholds
Attack successful
Cyber attack
NUpdate vulnerabilityand attack data
Y
Figure 7. Risk aversion metrics process. This approach focuses on preventing
Silver Bullet Security PodcastIn-depth inter v iews w i th secur i t y gurus . Hos ted by Gar y McGraw.
w w w.computer.org /secur i t y /podcastsSponsored by
Authorized licensed use limited to: University of Pittsburgh. Downloaded on January 6, 2010 at 16:43 from IEEE Xplore. Restrictions apply.