metroaccess customer annual satisfaction study 2002 16, 2002 · wb&a market research 2191...
TRANSCRIPT

WB&A Market Research2191 Defense Highway • Suite 401 • Crofton, MD 21114 • 410-721-0500
MetroAccess Annual Customer Satisfaction Study2002
Prepared for:
Prepared by:
Date: December 16, 2002
Job #: 02-718

1WB&A Market Research2191 Defense Highway • Suite 401 • Crofton, MD 21114 • 410-721-0500
Table of Contents
Page Background and Objectives ............................................................................................................................................................... 2 Methodology ...................................................................................................................................................................................... 4 Executive Summary/Conclusions ....................................................................................................................................................... 7 Detailed Findings Rider Profile ............................................................................................................................................................................. 15 Overall Scores.......................................................................................................................................................................... 19 Application Process.................................................................................................................................................................. 25 Eligibility Process ..................................................................................................................................................................... 32 Reservation Process ................................................................................................................................................................ 40 MetroAccess Service................................................................................................................................................................ 51 Drivers...................................................................................................................................................................................... 65 Appendix Overall Satisfaction – Given Score Questionnaire

2WB&A Market Research2191 Defense Highway • Suite 401 • Crofton, MD 21114 • 410-721-0500
Background & Objectives
In 1990, the American Disabilities Act (ADA) established standards for public services and buildings to include transportation systems such as the Washington Metropolitan Area Transit Authority (WMATA). Therefore, in 1994, WMATA developed MetroAccess paratransit service to provide service to ADA eligible citizens. People who are eligible to use MetroAccess are those:
• Who are unable, as a result of physical or mental impairments, to get on, ride, or get off any vehicle on the transit system,
• Who need the assistance of a wheelchair lift or other boarding device and are able, with such assistance, to get on, ride and get off an accessible vehicle but such a vehicle is not available on the route when they want to travel, or
• Who have specific impairment-related conditions which prevent travel to and from a bus stop or rail station.
WMATA contracts the services to an outside vendor (LogistiCare) which provides a curb-to-curb service with limited assistance getting on and off the vehicle and to and from the sidewalk or bus stop. If more assistance is required, the individual may ride with a personal attendant, who will ride free of charge. MetroAccess is available throughout all of the fixed bus and Metrorail routes. The contractor provides services to individuals who are ADA certified and cannot use regular public transportation. The contractor screens individuals, handles reservation scheduling, and dispatches vehicles while monitoring and managing the entire process.
During the first contractor cycle (1994-2000), several MetroAccess customers were met with unsatisfactory conditions because rides were denied due to capacity constraints or contractor errors. During the current cycle (2001-2004), there have been fewer complaints. However, WMATA still found a great need to measure MetroAccess passenger satisfaction. In the last few years, there have been numerous reported cases of dissatisfaction that have been registered by MetroAccess users. Accusations against LogistiCare and the service they provide have appeared in local Washington D.C. newspapers stating that they are not adequately responding to the needs of MetroAccess riders. However, LogistiCare has argued that they are operating under a tight budget while MetroAccess ridership continues to grow. LogistiCare also stated that their drivers arrive on time to pick up MetroAccess users 90 percent of the time. Other complaints involve poorly trained drivers and their inability to be properly educated about unique issues that apply to these customers. There have been as many as 600 complaints a month in 2001.
It is difficult for WMATA to verify the accuracy and efficiency of the service provided by LogistiCare, but they would like to see the number of complaints decrease. WMATA and LogistiCare have been working together to address many of the issues that may have resulted in these complaints.

3WB&A Market Research2191 Defense Highway • Suite 401 • Crofton, MD 21114 • 410-721-0500
Background & Objectives (continued)
Based on these issues, WMATA commissioned WB&A Market Research to create a MetroAccess customer satisfaction survey to be used from year to year in order to chart progress.
The objectives of the proposed research study are to:
• Develop a profile of MetroAccess users;
• Assess customer attitudes and preferences regarding service design and delivery;
• Assess customer satisfaction with several areas of service; including the application process, eligibility process, reservation process, service and drivers;
• Create indices of customer satisfaction that will be used for tracking purposes;
• Provide measures of overall customer satisfaction regarding MetroAccess; and
• Identify areas to improve that would have the greatest impact on overall satisfaction.
What follows are a summary of the results of the first year of that research.

4WB&A Market Research2191 Defense Highway • Suite 401 • Crofton, MD 21114 • 410-721-0500
Methodology
In order to meet the research objectives, a total of 507 telephone interviews were conducted among a randomly selected sample ofMetroAccess users who were identified as having used the service within 90 days of the beginning of data collection. Interviews were conducted between October 17 and November 12, 2002 by professional WB&A interviewers from WB&A’s central telephone facility located in Crofton, Maryland. The average interview length was approximately 21 minutes.
Respondents were either actual riders of MetroAccess or caregivers responsible for those riders. In order to qualify for the study, respondents had to meet the criteria listed below.
− Had to be at least 16 years of age; and
− They (or the person they were responsible for) had to have used MetroAccess in the past 90 days.
− In addition, quotas were set in order to draw a sample geographically representative of the MetroAccess ridership, as shown in the table below:
Area Total Montgomery County 142 District of Columbia 131 Prince George’s County 116 Fairfax County 66 Arlington County 38 Alexandria 10 Fairfax City 2 Falls Church 2 Total 507

5WB&A Market Research2191 Defense Highway • Suite 401 • Crofton, MD 21114 • 410-721-0500
Methodology (continued)
When reading the charts in this report, note that some charts may not equal 100% due to rounding. Within the charts and graphs of this report, subtext letters are used to show where statistical differences exist at the 95% confidence level.
In research, because the entire population is typically not interviewed, but rather a sample of that population is surveyed, the data are subject to sampling error. The maximum sampling error of the data for the Total Sample of 507 interviews is ±4.4 percentage points at the 95% confidence level. However, depending upon the data being examined, the fluctuation may be smaller.
If the percentage found is around:
50%
40% or 60%
30% or 70%
20% or 80%
10% or 90%
1% or 99%
Then, the standard error, in percentage points would be:
Total Sample (n = 507) ±4.4 ±4.3 ±4.0 ±3.5 ±2.6 ±0.9
For example, if a question in the study asked among the Total Sample yielded a percentage of 20%, then we can be sure 95 out of 100 times that the true percentage would lie between 16.5% and 23.5% (20% ±3.5 percentage points).

WB&A Market Research2191 Defense Highway • Suite 401 • Crofton, MD 21114 • 410-721-0500
Executive Summary/Conclusions

7WB&A Market Research2191 Defense Highway • Suite 401 • Crofton, MD 21114 • 410-721-0500
Executive SummaryRider Profile
• MetroAccess riders are on average about 60 years of age and have an annual income of about $21,000.
− Approximately one-half of the MetroAccess riders surveyed are Black/African-Americans with White/Caucasians (36%) accounting for the next largest ethnic segment. Furthermore, almost two-thirds (64%) of the riders are female.
− About one-fourth (24%) use a wheelchair.
• Three in ten survey participants currently have a MetroAccess subscription (30%).
− However, the majority of riders (60%) have never had a subscription.
− The survey also includes some former-MetroAccess subscribers (7%).
• A substantial proportion of riders (58%) say they use MetroAccess to make one trip or more during a typical week, with many taking between one and six trips (52%).
− Trips for medical appointments (83%) clearly emerged as the leading destination for MetroAccess riders.
Application Process
• Of the five MetroAccess service areas measured, the Application Process received the lowest Composite Satisfaction Score (82%).
• Those MetroAccess riders who were able to rate the seven Application Process performance attributes were most satisfied with the process in terms of the ease of filling out the application form (87% gave a rating of 8, 9 or 10 on a 10-point scale).
• Riders appeared somewhat less satisfied with other aspects of the Application Process, in particular:
− The time taken to learn if the application was accepted (81% satisfied),
− The ability of MetroAccess to answer questions clearly over the phone (80% satisfied),
− The time taken to complete the application process (79% satisfied), and
− The timeliness in responding to questions (78% satisfied).
• When asked how they had first applied for MetroAccess, more than one-half (55%) said they applied over the telephone.
− No other method was mentioned by more than one in ten riders.

8WB&A Market Research2191 Defense Highway • Suite 401 • Crofton, MD 21114 • 410-721-0500
Executive Summary (continued)
Eligibility Process
• Those MetroAccess riders who had received an in-person assessment (65% of the total sample) were surveyed about their experience with the Eligibility Process.
• The Eligibility Process received the highest Composite Satisfaction Score (91%) of the five MetroAccess service areas measured.
• Respondents seemed particularly satisfied with the professionalism of the interviewer (93% gave a rating of 8, 9 or 10) and with the reasonableness and fairness of the questions asked in the in-person assessment (93% satisfied).
• MetroAccess was also seen as performing well in terms of the amount of time taken to complete the in-person assessment (88% satisfied).
• Riders who received an in-person assessment were somewhat less satisfied with the Eligibility Process when it comes to the transportation received to and from the assessment (84% satisfied) and/or being required to receive a recertification assessment(82% satisfied).
• While the majority of the MetroAccess riders who had received an in-person assessment were provided transportation to and from the assessment, many (16%) indicated that no transportation was provided them.
Reservation Process
• Most MetroAccess riders (89%) have used the Reservation Process during the past three months.
− Of these, about one-half (51%) said they called to make the reservation just one day prior to their trip.
• The Reservation Process received the second highest Composite Satisfaction Score (87%) of the five MetroAccess service areas measured.
• Notably, the level of satisfaction expressed by riders was very consistent across the seven Reservation Process performance attributes. More than eight in ten respondents gave 8,9 or 10 ratings for each of the attributes.
− The ability of the reservationist to provide information (88% satisfied),
− The time taken to complete the reservation process (88% satisfied),
− The professionalism of the reservationist (87% satisfied),

9WB&A Market Research2191 Defense Highway • Suite 401 • Crofton, MD 21114 • 410-721-0500
Executive Summary (continued)
Reservation Process (cont’d)
− The politeness of the reservationist (87% satisfied),
− The helpfulness of the reservationist (87% satisfied),
− The reservationist seeming to understand your specific needs (86% satisfied), and
− The friendliness of the reservationist (85% satisfied).
• Although most of the riders who do not currently have a MetroAccess subscription are aware of this service (68%), there are many who said they were not aware (31%) that MetroAccess offers subscription service.
• About one-half (52%) of those riders who do not have subscription service expressed at least some interest in setting up a subscription.
− The most frequently cited reason for lack of interest in subscription service is the rider has no need for regular trips (81%).
• The majority of all respondents believe the quality of the MetroAccess Reservation Process has either improved (50%) in the past year or has remained the same (30%).
− Notably, very few (6%) believe that the quality of service has diminished.
• Interestingly, whether or not their ride arrives when scheduled appears to greatly influence their opinion as to if the quality of the Reservation Process has improved or diminished.
MetroAccess Service
• The MetroAccess Service ranked fourth of the five MetroAccess service areas in the level of its Composite Satisfaction Score (85%).
• Riders believe that MetroAccess performs very well in terms of the amount of room they had in the vehicle (91% gave a rating of 8, 9 or 10) and for the cost of the service (91% satisfied).
• Furthermore, the vast majority were satisfied with the quality of the special boarding equipment, such as ramps or lifts (89%) and the cleanliness of the MetroAccess vehicles (86%).
• Riders tended to be somewhat less satisfied with MetroAccess service when it comes to the ability of the drivers to get to their destination in a reasonable amount of time (82%) and/or the level of noise in the MetroAccess vehicles (80%).

10WB&A Market Research2191 Defense Highway • Suite 401 • Crofton, MD 21114 • 410-721-0500
Executive Summary (continued)
MetroAccess Service (cont’d)
• Notably, the ability of drivers to arrive on-time for scheduled pick-ups received the lowest satisfaction score (72%), not only of the MetroAccess Service attributes, but of all of the performance attributes measured in the survey.
− Fewer than four in ten (38%) riders said they were “completely satisfied” with MetroAccess’ performance regarding the ability of drivers to arrive on-time for scheduled pick-ups. This also represents the lowest proportion of any of the attributes measured.
• Riders said that most often they traveled by a MetroAccess van (87%), rather than a MetroAccess taxi (71%).
− Approximately four in ten have ever used the Metrobus (40%) or Metrorail (39%).
− Respondents who have used Metrobus or Metrorail overwhelmingly said they prefer to use MetroAccess (95%).
• The majority of respondents said that their MetroAccess ride arrives either “always” (18%) or “most of the time” (52%) within 15minutes of the scheduled time.
− Only one in twenty (5%) believe their ride “rarely” or “never” arrives at the scheduled time.
• More than one-half of all respondents believe the quality of the service provided by MetroAccess has improved (53%) in the past year.
− In fact, almost one-fourth (23%) believe the service has “greatly improved.”
− Respondents most often cite that the service was reliable and the rides show up on-time (51%) as the reason for the improvement.
− Notably, very few (5%) believe that the quality of service has diminished. Again, late pick-ups (50%) appear to be an important factor in their feeling that the level of service has declined.
MetroAccess Drivers
• The MetroAccess Drivers ranked third of the five MetroAccess service areas in the level of its Composite Satisfaction Score (86%).
• Of the 12 performance attributes, drivers’ received the highest satisfaction rating from riders who use a wheelchair for the drivers’ ability to operate the wheelchair lift (90% gave a rating of 8, 9 or 10).

11WB&A Market Research2191 Defense Highway • Suite 401 • Crofton, MD 21114 • 410-721-0500
Executive Summary (continued)
MetroAccess Drivers (cont’d)
• Overall, riders were generally satisfied with several other areas of the Drivers’ performance, in particular:
− The ability to drive safe (89% satisfied),
− The friendliness of the drivers (88% satisfied),
− Ability to understand the special needs of the passengers (88% satisfied),
− The approachability of the drivers (86% satisfied),
− The helpfulness of the drivers (85% satisfied), and
− The competency of the drivers (85% satisfied).
• Riders were somewhat less satisfied with other aspects of the Drivers:
− The sensitivity of the drivers (84% satisfied),
− The professionalism of the drivers (84% satisfied),
− The ability to secure wheelchairs safely (84% satisfied of those who use a wheelchair), and
− The knowledge of disabled issues of the drivers (81% satisfied).
• Respondents gave the MetroAccess Drivers the lowest satisfaction rating for their familiarity with the respondents’ routes (78%).
• Approximately one-half of the respondents believe the quality of the service provided by MetroAccess Drivers has improved (47%) in the past year.
− At the same time, only four percent feel the quality has diminished.

12WB&A Market Research2191 Defense Highway • Suite 401 • Crofton, MD 21114 • 410-721-0500
Executive Summary - Conclusions
• There are two service areas which the research has identified as having the most impact on overall satisfaction with MetroAccess. These are areas where riders believe MetroAccess is performing only moderately well. Efforts should be made to improve the level of satisfaction regarding MetroAccess Drivers and MetroAccess Services.
• Although MetroAccess appears to be performing well on some of the service attributes in these two important areas, attention should be given specifically to:
− MetroAccess Drivers
The familiarity with the respondents’ routes
The knowledge of disabled issues
Sensitivity of the drivers
The professionalism of the drivers
The ability to secure wheelchairs safely
− MetroAccess Services
The ability of drivers to arrive on-time for scheduled pick-ups
The level of noise in the MetroAccess vehicles
The ability of the drivers to get to their destination in a reasonable amount of time
• Although the Application Process has less impact on overall satisfaction with MetroAccess, it is an area where riders believe MetroAccess is performing relatively poorly.
− Consideration should be given to improving service, particularly in the areas of:
The timeliness in responding to questions
The time taken to complete the application process
• The Reservation Process is another area that has moderate impact on overall satisfaction. While riders believe MetroAccess is performing moderately well, there is room for improvement.

13WB&A Market Research2191 Defense Highway • Suite 401 • Crofton, MD 21114 • 410-721-0500
Executive Summary – Conclusions (continued)
• The Eligibility Process is a service area where riders believe MetroAccess is performing well. MetroAccess needs to maintain its level of performance in this area.
− Although this is a lower priority, improvement can be made in the areas of:
Being required to receive a recertification assessment
The transportation received to and from the assessment
− Furthermore, a substantial proportion of riders appear not to have transportation provided to them to and from their assessment.
• One key theme that has emerged from the research is the importance of on-time ride arrival. Whether or not their ride arrives within 15 minutes of the scheduled time appears to be very influential in how riders view MetroAccess.
− While most of the riders whose rides were late contacted (or were contacted by) MetroAccess, many were not satisfied with the response they were given about the status of their ride.
− Thought should be given to developing ways of maintaining or improving on-time arrivals, as well as ways of better managing expectations when rides are running late.

WB&A Market Research2191 Defense Highway • Suite 401 • Crofton, MD 21114 • 410-721-0500
Detailed Findings – Rider Profile

15WB&A Market Research2191 Defense Highway • Suite 401 • Crofton, MD 21114 • 410-721-0500
Rider Profile
Respondents were asked a series of questions in order to develop a demographic profile of MetroAccess riders.
• The average annual income of riders was approximately $21,000 (median of $23,950).
• Nearly two-thirds (65%) were 55 years of age or older, with the median and average age being about 60 years old (59.5/59.9).
• One-half of all respondents (51%) are Black/African-American, while just over one-third (36%) were White/Caucasian.
• One in four respondents (24%) said that they use a wheelchair.
• More than six in ten respondents (64%) were female.
Demographics
Total Total n= (507) n= (507) Residence1 Age
Montgomery County 28% 18 to 24 4%
District of Columbia 26 25 to 34 7
Prince George’s County 23 35 to 44 10
Fairfax County 13 45 to 54 14
Arlington 7 55 to 64 19
Alexandria 2 65 to 74 18
Fairfax City <1 75 or older 28
Falls Church <1 Refused 1
Average (in years) 59.9
Annual Income Median (in years) 59.5
Less than $10,000 26%
$10,000 to $19,999 22 Ethnicity
$20,000 to $29,999 11 Black/African-American 51%
$30,000 to $49,999 11 White 36
$50,000 to $99,999 7 Asian 3
$100,000 or more 2 Hispanic/Latino 1
Don’t know/Refused 21 Other 5
Average income $20,960 Don’t know/Refused 4
Median income $23,950
Gender Use Wheelchair
Male 36% Yes 24%
Female 64 No 76
Base=Total SampleS.2/Q.27/D.1-41Based on quotas (see Methodology section)

16WB&A Market Research2191 Defense Highway • Suite 401 • Crofton, MD 21114 • 410-721-0500
Rider Profile (continued)
Respondents were asked if they currently had a MetroAccess subscription. Those who said they did not have one were asked if they had ever had a MetroAccess subscription.
• Three in ten (30%) said they currently have a subscription with MetroAccess.
• Seven percent (7%) of the respondents are former-MetroAccess subscribers, but do not currently have a subscription.
• In addition, among those interviewed six in ten users (60%) say that they have never subscribed to MetroAccess.
MetroAccess Subscription
Refused3%
Never subscribed
60%
Subscriber30%
Previous Subscriber
7%
Base=Total Sample (n=507)S.3

17WB&A Market Research2191 Defense Highway • Suite 401 • Crofton, MD 21114 • 410-721-0500
Rider Profile (continued)
Base=Total Sample (n=507)S.4
Base=Total Sample (n=507)Multiple Responses Accepted; Top Mentions S.5
Respondents were also asked how many one-way trips they took each week using MetroAccess and to what places they typically traveled using the service.
• Nearly six in ten respondents (58%) said they use the service for at least one trip per week, with six percent of the respondents saying they use it for seven or more one-way trips each week. However, more than one-third (36%) do not use MetroAccess at all in a typical week.
• Overwhelmingly, the most often mentioned destinations with MetroAccess is to medical appointments (83%). This includes trips to doctors, rehabilitation and therapy sessions.
• In addition, other common destinations include:
− The homes of friends and/or family (27%),
− Shopping (24%),
− Work (20%),
− Restaurants and/or for entertainment (15%),
− Church (9%), and/or
− School (7%).
Places Traveled To
7%
9%
15%
20%
24%
27%
83%
0% 20% 40% 60% 80% 100%
School
Church
Restaurant/Entertainment
Work
Shopping
Friends/Family
Medical Appointment
Average One-Way Trips Per Week
5%
36%
52%
6%
0% 20% 40% 60% 80% 100%
Don'tknow /Refused
Less than oncea w eek
1 to 6
7 or more

WB&A Market Research2191 Defense Highway • Suite 401 • Crofton, MD 21114 • 410-721-0500
Detailed Findings – Overall Scores

19WB&A Market Research2191 Defense Highway • Suite 401 • Crofton, MD 21114 • 410-721-0500
Overall Scores
Each of the following sections of this report correspond with five areas of MetroAccess service (Application Process, Eligibility Process, Reservation Process, MetroAccess Service and Drivers). For each of the five sections, respondents were asked to rate their satisfaction with a series of attributes which directly relate to the service performance of each section. The scores for these questions were averaged into an Overall Section Satisfaction Composite Score. A satisfied score is given to someone whose answers averaged between 8 and 10 on a 10-point satisfaction scale, with 10 being “completely satisfied” and 1 being “not at all satisfied.” Once this was completed, then the five sectional scores were averaged together (with each section being of equal value) into the Overall Satisfaction Score. This score can then be used to determine an Overall Composite Satisfaction Score among MetroAccess riders for the aspects or attributes that are controlled by MetroAccess and/or LogistiCare.
Overall Satisfaction Score - Composite
87%
13%
0%
20%
40%
60%
80%
100%
Satisfied (8-10) Neutral/Not satisf ied (1-7)
Base=Total Sample (n=507)The Overall Satisfaction Score is the average of all Sectional Satisfaction Scores
• The Overall Composite Satisfaction Score for MetroAccess is 87%.
Analysis of the findings reveal several areas where satisfied MetroAccess customers differ from the less satisfied customers, in particular:
• 84% of satisfied customers use MetroAccess to travel to their doctor’s office (compared to 73% of those less satisfied).
• 75% of satisfied customers say their rides “always” or “most of the time” arrive within 15 minutes of the schedule time (compared to 34% of those less satisfied).
• 83% of satisfied customers say their last ride arrived within 15 minutes of the scheduled time (compared to 61% those less satisfied).
• Satisfied customers are less likely to travel by taxi (70%) compared to those less satisfied (83%).
• Satisfied customers are less likely to have tried to use the Metrobus (38% vs. 53%) and/or Metrorail (37% vs. 55%).
• They are more likely to believe the quality of MetroAccess service has improved (56% vs. 36%) and/or that the quality of the MetroAccess drivers has improved (49% vs. 34%).
• And, the satisfied customer tends to be older, with an average age of 61 years old (compared to 51 years for all others).

20WB&A Market Research2191 Defense Highway • Suite 401 • Crofton, MD 21114 • 410-721-0500
Overall Scores (continued)
In each section, respondents were asked a series of questions relating to specific aspects of that area of MetroAccess service. These questions were averaged into an Overall Section Composite Score. A satisfied score is given to someone whose answers averaged between 8 and 10 on a 10-point satisfaction scale, with 10 being “completely satisfied” and 1 being “not at all satisfied.”
• The Overall Section Composite Score for each Section was at least 82%.
• The MetroAccess Eligibility Process received the highest Overall Section Composite Score, at 91% (these questions were asked only of people who had received an in-person assessment).
• Several areas of the MetroAccess service received somewhat similar composite scores:
− Reservation Process (87%),
− Drivers (86%), and
− MetroAccess Service (85%).
• At the same time, the Application Process received the lowest Overall Section Composite Score (82%) of the five service areas.
Composite Satisfaction Scores - by Section
91% 87% 86% 85% 82%
9% 13% 14% 15% 18%
0%
20%
40%
60%
80%
100%
Eligibility Process ReservationProcess
Drivers MetroAccessService
ApplicationProcess
Satisf ied (8-10) Neutral/Not satisf ied (1-7)
Base=Those Able to Rate At Least One Attribute (n=329-507)The Overall Satisfaction Score is the average of all Individual Satisfaction Scores

21WB&A Market Research2191 Defense Highway • Suite 401 • Crofton, MD 21114 • 410-721-0500
Overall Scores (continued)
In an effort to identify the underlying components of satisfaction with MetroAccess, advanced statistical techniques were employed. A correlation analysis was conducted on each of the five overall sections of MetroAccess (Application Process, Eligibility Process, Reservation Process, MetroAccess Service and Drivers) in order to ascertain which factors most closely correlated with the overall satisfaction with MetroAccess.
The specific sections having the highest correlation with overall satisfaction have been identified as the “key drivers” of satisfaction with MetroAccess. The remaining performance sections have been categorized as having “moderate impact” based on their correlation with the overall satisfaction with MetroAccess.
The chart below classifies the individual sections into these two categories.
Key Drivers Moderate Impact
Drivers
MetroAccess Service
Eligibility Process
Reservation Process
Application Process

22WB&A Market Research2191 Defense Highway • Suite 401 • Crofton, MD 21114 • 410-721-0500
Overall Scores (continued)
A key objective of any customer satisfaction research is to identify priorities for improving customer satisfaction. Doing this will allow MetroAccess to focus resources to areas that are most important to customers and where improvement is needed. These areas are referred to as “unmet needs.” In addition, areas that are very important to customers and on which MetroAccess performs well are the “driving strengths” of the service. Insights can be gained by plotting the five overall sections of MetroAccess (Application Process, Eligibility Process, Reservation Process, MetroAccess Service and Drivers) on their impact on satisfaction and MetroAccess’ performance, as shown on the following page.
• Drivers and MetroAccess Service are key drivers of satisfaction for which MetroAccess performs only moderately well. Improvements in these areas will greatly impact overall satisfaction with MetroAccess.
• The Application Process and the Reservation Process are also areas of moderate impact on satisfaction with MetroAccess. However, respondents feel that MetroAccess can improve the level service it delivers to customers in these areas. Improvement in these areas will have a moderate impact on overall satisfaction with MetroAccess.
• The Eligibility Process is an area where respondents feel MetroAccess performs well. Although the Eligibility Process has moderate impact on overall satisfaction, it is important that MetroAccess continue its efforts of delivering a high level of performance in this area.

23WB&A Market Research2191 Defense Highway • Suite 401 • Crofton, MD 21114 • 410-721-0500
Overall Scores (continued)
Prioritizing Actions
Drivers
MetroAccess Service
Application Process
Reservation Process
Eligibility Process
High
Low
Low High
PerformanceModerate
Imp a
c t o
n S a
tisfa
ctio
n

WB&A Market Research2191 Defense Highway • Suite 401 • Crofton, MD 21114 • 410-721-0500
Detailed Findings - Application Process

25WB&A Market Research2191 Defense Highway • Suite 401 • Crofton, MD 21114 • 410-721-0500
Application Process
Respondents were asked a series of seven questions about the application process. These questions were averaged into an Overall Application ProcessComposite Score.
A satisfied score is given to someone whose answers averaged between 8 and 10 on a 10-point satisfaction scale, with 10 being “completely satisfied” and 1 being “not at all satisfied.”
• The Overall Application Process Composite Score for MetroAccess was 82%.
Satisfaction with Application Process - Composite Score
82%
18%
0%
20%
40%
60%
80%
100%
Satisfied (8-10) Neutral/Not satisfied (1-7)
Base=Those Able to Rate At Least One Attribute (n=507)The Overall Satisfaction Score is the average of all Individual Satisfaction Scores

26WB&A Market Research2191 Defense Highway • Suite 401 • Crofton, MD 21114 • 410-721-0500
Application Process (continued)
Respondents were asked to rate seven aspects of the Application Process on a 10-point scale, with 10 meaning they were “completely satisfied” with this aspect and 1 meaning they were “not at all satisfied.”
• Of those who were able to rate the attributes, the highest level of satisfaction was expressed with the ease of filling out application forms (87% giving a rating of 8 to 10).
− In fact, about six in ten (59%) said they were “completely satisfied” (rating of 10) with the ease of filling out the forms. − However, this does not include the ease of navigating the Web site when applying on-line. Only three respondents applied
on-line and were able to rate this question, two of whom said that they were completely satisfied with the ease of navigating the Web site.
• Approximately eight in ten of the respondents who were able to rate the attributes said they were satisfied (a rating of 8 to 10) with each of the other Application Process areas.
• Time taken to learn if the application was accepted (81%).
− In addition, one-half (50%) said they were “completely satisfied.”
• Ability of MetroAccess to answer questions clearly over the phone (80%).
− Slightly more than one-half (53%) of those answering said they were “completely satisfied.”
• Time taken to complete the application process (79%)
− Somewhat over one-half (53%) said they are “completely satisfied.”
• Timeliness in responding to questions (78%).
− Again, more than one-half (53%) believe they are “completely satisfied.”
• Only one person was able to rate the ability of MetroAccess to answer questions clearly over the Internet.
− They gave this attribute a rating of 8 (on the 10-point scale).

27WB&A Market Research2191 Defense Highway • Suite 401 • Crofton, MD 21114 • 410-721-0500
Application Process (continued)
Base=Those Answering (n=453-467)1Base=Those Applying on Internet and Answering (n=1-3)CAUTION: Small Base2Base=Those Applying on Phone and Answering (n=258)Q.3
Timeliness in responding to questions
9.0
Mean
Ease of navigation process1
9.0Ease of filling out application form
8.7Ability of MetroAccess to answer
questions clearly over phone2
8.6Time taken to complete
application process
8.6Time taken to learn if
application was accepted
8.5
Ability of MetroAccess to answer questions clearly over Internet1 8.0
87%
80%
79%
81%
78%
Application Process Rating Scores - Those Answering
53%
50%
53%
53%
59%
12%
14%
10%
14%
12%
13%
16%
16%
14%
15%
17%
15%
17%
17%
12%
4%
4%
4%
3%
2%
10 (Completely satisf ied) 9 8 4-7 1-3 (Not satisf ied)

28WB&A Market Research2191 Defense Highway • Suite 401 • Crofton, MD 21114 • 410-721-0500
Application Process (continued)
Timeliness in responding to questions
Ease of Navigation Process1
Ease of filling out application form
Ability of MetroAccess to answer questions clearly over phone2
Time taken to complete application process
Time taken to learn if application was accepted
Ability of MetroAccess to answer questions clearly over Internet1
Base=Total Sample (n=507)1Base=Those Applying on Internet (n=4) CAUTION: Small Base2Base=Those Applying on Phone (n=278)Q.3
Ability to Rate Application Process Attributes
89%
92%
92%
93%
87%
4%
5%
4%
1%
<1%
9%
7%
7%
7%
2%
Able to rate Not Applicable Don't know /Refused

29WB&A Market Research2191 Defense Highway • Suite 401 • Crofton, MD 21114 • 410-721-0500
Application Process (continued)
Respondents were asked how they had first applied for MetroAccess service.
• The most common means of applying for MetroAccess service was by telephone (55%), with fewer than one in ten (7%) mentioning any other method.
• Other methods included:
− A friend or relative helped (7%),
− A social worker set it up (5%),
− A doctor recommended it (4%), or
− Applying was done through the hospital (4%).
• Non-subscribers were particularly likely to have applied by telephone (60% vs. 44% of current subscribers).
How First Applied for MetroAccess Service
Respondent Type
Total Current
SubscribersNon-
Subscribers (B) (C)
n= (507) (154) (352)
Call on telephone 55% 44% 60%B Friend/Relative helped me 7 6 7
Social worker set it up 5 8 4 Doctor recommended it 4 3 5 Hospital 4 6 3 Went to the MetroAccess office
3 5 2
Through rehab facility 2 2 2 Some other means 5 8C
3 Don’t know 6 7 5
Base=Total SampleQ.2

30WB&A Market Research2191 Defense Highway • Suite 401 • Crofton, MD 21114 • 410-721-0500
Application Process (continued)
Respondents were asked how long ago they had applied for MetroAccess service.
• Nearly four in ten (38%) had applied in the past year.
• Conversely, six in ten (60%) had applied more than one year ago.
• Among the non-subscribers more than four in ten (42%) say that they first applied to MetroAccess within the past year, this compares to three in ten of the current-MetroAccess subscribers (29%).
When Applied for MetroAccess
2%
12%
48%
31%
7%
<1%
0% 20% 40% 60% 80% 100%
Don’t know
More than f ive years ago
More than one year ago
More than three months ago
More than a month ago
Within the past month
Base=Total Sample (n=507)Q.6

WB&A Market Research2191 Defense Highway • Suite 401 • Crofton, MD 21114 • 410-721-0500
Detailed Findings - Eligibility Process

32WB&A Market Research2191 Defense Highway • Suite 401 • Crofton, MD 21114 • 410-721-0500
Eligibility Process
Next, respondents who had received an in-person assessment were asked a series of questions about the eligibility process.
In-person assessments are given to all MetroAccess applicants except those with certain disabilities (e.g., blindness) and a small number who were grandfathered into MetroAccess from other systems.
All respondents were asked if they had received an in-person assessment from MetroAccess.
• Nearly two-thirds (65%) of those interviewed said that they had received an in-person assessment.
− About two in ten (19%) said they did not receive an in-person assessment, while 16% did not remember if they had.
Received In-Person Assessment
Don’t Know16%
No19%
Yes65%
Base=Total Sample (n=507)Q.7

33WB&A Market Research2191 Defense Highway • Suite 401 • Crofton, MD 21114 • 410-721-0500
Eligibility Process (continued)
Respondents who had received an in-person assessment (65% of the total sample) were asked five questions relating to specific aspects of the eligibility process.
These questions were averaged into an Overall Eligibility ProcessComposite Score. A satisfied score is given to someone whose answers averaged between 8 and 10 on a 10-point satisfaction scale, with 10 being “completely satisfied” and 1 being “not at all satisfied.”
• The Overall Eligibility Process Score for MetroAccess is 91%.
Satisfaction with Eligibility Process - Composite Score
91%
9%
0%
20%
40%
60%
80%
100%
Satisfied (8-10) Neutral/Not satisfied (1-7)
Base=Those Able to Rate At Least One Attribute (n=329)The Overall Satisfaction Score is the average of all Individual Satisfaction Scores

34WB&A Market Research2191 Defense Highway • Suite 401 • Crofton, MD 21114 • 410-721-0500
Eligibility Process (continued)
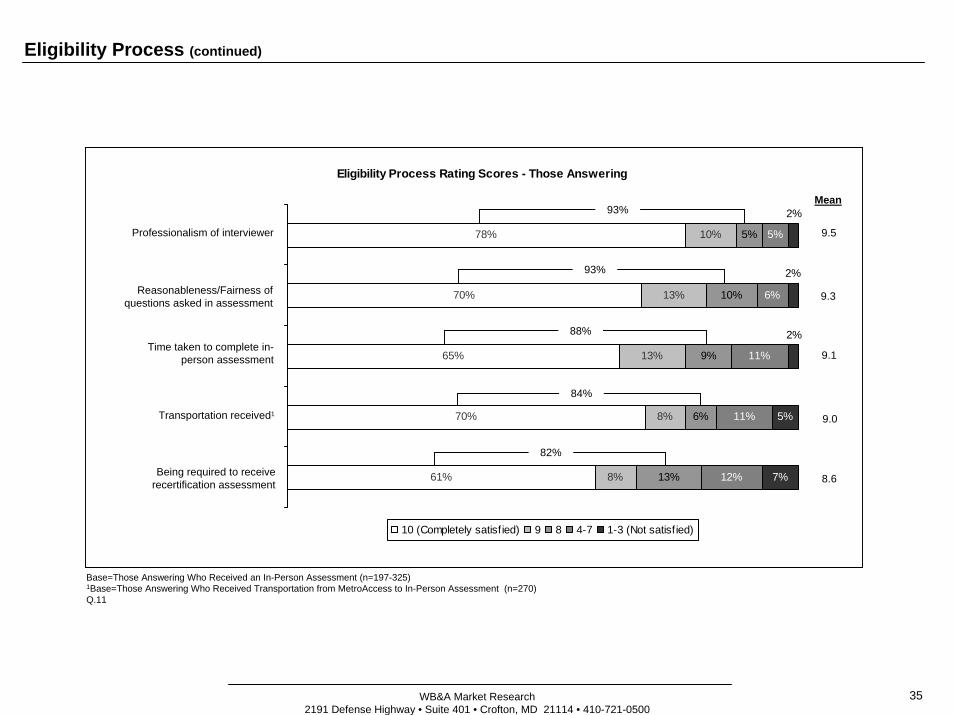
Respondents who received an in-person assessment were asked to rate five aspects of the Eligibility Process on a 10-point scale, with 10 meaning they were “completely satisfied” with this aspect and 1 meaning they were “not at all satisfied.”
• Similar proportions of the respondents able to rate the attributes, were satisfied (a rating of 8 to 10) with the Eligibility Process in terms of the professionalism of the person (93%) who interviewed them during the assessment and/or with the reasonableness and fairness of the questions asked in the assessment (93%).
− In fact, at least seven in ten said they were “completely satisfied” (a rating of 10) with the professionalism of the interviewer (78%) and/or the reasonableness and fairness of the questions asked (70%).
• Approximately nine in ten respondents (88%) said they were satisfied with the time taken to complete the in-person assessment.
− About two-thirds (65%) said they were “completely satisfied.”
• Among those respondents who received transportation, the majority (84%) were satisfied with the transportation they received to and from the assessment by MetroAccess.
− Seven in ten (70%) said they were “completely satisfied” with this aspect of the Eligibility Process.
• In addition, slightly more than eight in ten (82%) were satisfied about being required to receive a recertification assessment.
− About six in ten (61%) said they were “completely satisfied” with this aspect of the Eligibility Process.
It is worth noting that more than two in ten (22%) said that the requirement to receive a recertification assessment did not apply to them, even though they had received an initial in-person assessment.
35WB&A Market Research2191 Defense Highway • Suite 401 • Crofton, MD 21114 • 410-721-0500
Eligibility Process (continued)
Base=Those Answering Who Received an In-Person Assessment (n=197-325)1Base=Those Answering Who Received Transportation from MetroAccess to In-Person Assessment (n=270)Q.11
9.5
Mean
Professionalism of interviewer
9.3Reasonableness/Fairness of questions asked in assessment
9.1Time taken to complete in-
person assessment
9.0Transportation received1
Being required to receive recertification assessment 8.6
93%
93%
88%
84%
82%
Eligibility Process Rating Scores - Those Answering
61%
70%
65%
70%
78%
8%
8%
13%
13%
10%
13%
6%
9%
10%
5%
12%
11%
11%
6%
5%
7%
5%
2%
2%
2%
10 (Completely satisf ied) 9 8 4-7 1-3 (Not satisf ied)

36WB&A Market Research2191 Defense Highway • Suite 401 • Crofton, MD 21114 • 410-721-0500
Eligibility Process (continued)
Base=Those Who Received an In-Person Assessment (n=329)1Base=Those Who Received Transportation from MetroAccess to In-Person Assessment (n=273)Q.11
Professionalism of interviewer
Reasonableness/Fairness of questions asked in assessment
Time taken to complete in-person assessment
Transportation received1
Being required to receive recertification assessment
Ability to Rate Eligibility Process Attributes
22%
99%
59%
97%
99%
97%
<1%
<1%
1%
1%
19%
2%
2%
1%
1%
Able to rate Not Applicable Don't know /Refused

37WB&A Market Research2191 Defense Highway • Suite 401 • Crofton, MD 21114 • 410-721-0500
Eligibility Process (continued)
Respondents who had received an in-person assessment were asked if they had received transportation by MetroAccess to and from the assessment.
• More than eight in ten (83%) said that they had received transportation from MetroAccess.
• At the same time, about one in six (16%) said that they did not receive transportation by MetroAccess to and from the assessment.
MetroAccess Provided Transportation
Don’t know1%
No16%
Yes83%
Base=Those Who Received In-Person Assessment (n=329)Q.8

38WB&A Market Research2191 Defense Highway • Suite 401 • Crofton, MD 21114 • 410-721-0500
Eligibility Process (continued)
Respondents who had received an in-person assessment were asked if they had yet received a recertification assessment. Those who had received one were then asked when their last recertification assessment had taken place.
• Slightly more than two in ten of those who received an in-person assessment (22%) said they had received a recertificationassessment.
− This means that one in seven of all respondents (14%) had received a recertification assessment. (65% received an in-person assessment, and of those, 22% had also received a recertification assessment).
• Three-fourths of those who had received a recertification assessment (75%) had done so in the past year. All respondents who were able to recall when they had last received a recertification assessment had done so in the past five years.
Received Recertification Assessment
No74%
No73% Yes
22%
Most Recent Recertification Assessment
8%
0%
17%
51%
20%
4%
0% 20% 40% 60% 80% 100%
Don’t know
More than 5 years ago
More than 1 year ago
More than 3 months ago
More than a month ago
Within past month
Base=Those Who Received a Recertification Assessment (n=71)Q.10
Base=Those Who Received In-Person Assessment (n=329)Q.9

WB&A Market Research2191 Defense Highway • Suite 401 • Crofton, MD 21114 • 410-721-0500
Detailed Findings – Reservation Process

40WB&A Market Research2191 Defense Highway • Suite 401 • Crofton, MD 21114 • 410-721-0500
Reservation Process
In the next section of the questionnaire, respondents were asked a series of questions about the reservation process. First, respondents were asked when the last time that they had contacted MetroAccess to make a reservation or to set up a subscribed set of trips.
• About nine in ten (89%) had called to make a reservation or set up a subscribed set of trips in the past three months. − Notably, nearly one-half of all respondents (47%) had called within the past week.
Those who had called to make a reservation or to set up a subscribed series of rides were asked how many days prior to that trip they had called to make the reservation.
• One-half (51%) had called the day before the trip to make the reservation.− Non-subscribers tended to be more likely than subscribers to say they called the day prior to the trip to make the
reservation (53% vs. 43%).• It is worth noting that 1% of the respondents who had made a reservation in the past three months said they had called on the
day of the trip to make the reservation. In fact, one cannot make a reservation on the day of the trip, indicating a misperception on the part of some riders in this area.
Respondent Type
Total Current
Subscribers Non-
Subscribers (B) (C) Last Time Contacted MetroAccess to Make a Reservation/Set Up Subscribed Set of Trips n= (507) (154) (352) Net: Within past three months 89% 72% 97%B
Within past week 47 41 50 More than one week ago but within the past month 28 19 32B
More than one month ago but within the past three months 14 12 15 More than three months ago 6 16C 1 Don’t know/Refused 5 12C 2 Number of Days Before Called to Make a Reservation1 n= (452) (111) (340) Same day 1% 2% 1% One day prior to trip 51 43 53 Net: More than one day 46 51 45 More than one day but within one week 43 46 42 More than one week prior to trip 3 5 3 Don’t know/Refused 2 5 1
Base=Total Sample1Base=Those Who Made a Reservation in the Past Three MonthsQ.12/13

41WB&A Market Research2191 Defense Highway • Suite 401 • Crofton, MD 21114 • 410-721-0500
Reservation Process (continued)
Respondents were asked seven questions relating to specific aspects of the reservation process. These questions were averaged into an Overall Reservation Process Composite Score.
A satisfied score is given to someone whose answers averaged between an 8 and 10 on a 10-point satisfaction scale, with 10 being “completely satisfied” and 1 being “not at all satisfied.”
• The Overall Reservation Process Composite Score for MetroAccess is 87%.
Satisfaction with Reservation Process - Composite Score
87%
13%
0%
20%
40%
60%
80%
100%
Satisfied (8-10) Not satisf ied (1-7)
Base=Those Able to Rate At Least One Attribute (n=452)The Overall Satisfaction Score is the average of all Individual Satisfaction Scores

42WB&A Market Research2191 Defense Highway • Suite 401 • Crofton, MD 21114 • 410-721-0500
Reservation Process (continued)
Respondents who had made a reservation or set up a subscribed set of trips in the past three months were asked to rate seven aspects of the Reservation Process on a 10-point scale, with 10 meaning they were “completely satisfied” with this aspect and 1 meaning they were “not at all satisfied.”
• Of all the sections of MetroAccess analyzed in this study, the ratings among the different aspects of the Reservation Process showed the least variance.
• Between eight and nine in ten, who were able to answer and had made a reservation or set up a subscribed set of trips in the past three months, said they were satisfied with each aspect of the reservation process (giving a rating of 8 to 10).
− The ability of the reservationist to provide them with information (88%);
− The time it took to complete the reservation process (88%);
− The politeness of the reservationist (87%);
− The professionalism of the reservationist (87%);
− The helpfulness of the reservationist (87%);
− The reservationist seeming to understand the respondent’s specific needs (86%); and
− The friendliness of the reservationist (85%).
• In fact, about two-thirds of those answering (64%-67%) said they were completely satisfied (a rating of 10) with each of these aspects.

43WB&A Market Research2191 Defense Highway • Suite 401 • Crofton, MD 21114 • 410-721-0500
Reservation Process (continued)
Base=Those Answering Who Made Reservation in Past 3 Months (n=423-449)Q.14
Reservationist seeming to understand your specific needs
9.0
Mean
Politeness of reservationist
9.0Ability of reservationist to provide info
9.0Professionalism of reservationist
9.0Helpfulness of reservationist
9.0Time taken to complete
reservation process
8.9
Friendliness of reservationist 8.9
87%
88%
87%
87%
88%
86%
85%
Reservation Process Rating Scores - Those Answering
65%
65%
64%
66%
67%
66%
66%
10%
11%
13%
11%
11%
11%
11%
9%
10%
11%
10%
9%
10%
9%
12%
9%
10%
9%
9%
10%
10%
4%
4%
4%
3%
2%
4%
3%
10 (Completely satisf ied) 9 8 4-7 1-3 (Not satisf ied)

44WB&A Market Research2191 Defense Highway • Suite 401 • Crofton, MD 21114 • 410-721-0500
Reservation Process (continued)
Base=Those Who Made Reservation in Past 3 Months (n=452)Q.14
Reservationist seeming to understand your specific needs
Politeness of reservationist
Ability of reservationist to provide info
Professionalism of reservationist
Helpfulness of reservationist
Time taken to complete reservation process
Friendliness of reservationist
Ability to Rate Reservation Process Attributes
99%
98%
99%
97%
98%
93%
99%
3%
1%
<1%
4%
1%
1%
2%
2%
<1%
1%
Able to rate Not Applicable Don't know /Refused

45WB&A Market Research2191 Defense Highway • Suite 401 • Crofton, MD 21114 • 410-721-0500
Reservation Process (continued)
Those respondents who did not currently have a MetroAccess subscription (30%) were asked if they were aware that MetroAccess provides a subscription service.
• About two-thirds of those who did not have a subscription (68%) said they were aware that MetroAccess provides such a service.
− However, a substantial proportion of non-subscribers (31%) was unaware that MetroAccess offers a subscription service.
• Furthermore, relatively few (15%) of those respondents who were aware of the MetroAccess subscription service said that they have ever requested or otherwise looked for information on MetroAccess subscriptions.
− In fact, the vast majority (83%) said that they have not attempted to obtain information about the subscription service.
Awareness of Subscription Service
Yes68%
Don't know1%
No31%
Base=Non-Subscribers/Unknown (n=353)Q.15
Attempted to Obtain Info on Subscription Service
Yes15%
Don't know2%
No83%
Base=Non-Subscribers Aware of Subscription Service (n=241)Q.17

46WB&A Market Research2191 Defense Highway • Suite 401 • Crofton, MD 21114 • 410-721-0500
Reservation Process (continued)
Respondents who did not have a MetroAccess subscription were also asked how interested they would be in obtaining this service.
• Overall, about one-half (52%) of the non-subscribers expressed at least some interest in setting up a subscription with MetroAccess.
− In particular, almost three in ten (29%) said they would be “very interested” in a MetroAccess subscription.
− Likewise, more than two in ten (23%) said they would be “somewhat interested” in the subscription service.
• At the same time, approximately four in ten (39%) indicated limited or no interest in the service.
− Very similar proportions of respondents said they are “not very interested” (18%) or “not at all interested” (21%) in setting up a subscription with MetroAccess.
• Among those who said they would not be interested in a subscription, the predominant reason was that they simply had no need forregular trips (81%).
Reason For Lack of Interest
No need for regular trips (81%)Have other transportation (5%)
MetroAccess in not reliable (3%)
52% 39%
Base=Non-Subscribers/Unknown (n=353)Q.16
Interest in Subscription
29% 23% 18% 21% 9%
Very interested Somew hat interested Not very interested Not at all interested Don't know /RefusedBase=Non-Subscribers not Interested in Subscription (n=137)Multiple Responses Accepted; Top MentionsQ.16A

47WB&A Market Research2191 Defense Highway • Suite 401 • Crofton, MD 21114 • 410-721-0500
Reservation Process (continued)
All subscribers, as well as those without a subscription (but who had actually sought information on the service), were asked where they had gone to find information about the MetroAccess subscriptions.
• The most common source used was to call WMATA/MetroAccess directly (27%). − The non-subscribers were much more likely to call WMATA/MetroAccess directly for information on the service compared
to those who currently have subscriptions (53% vs. 21%).• No other source was cited by more than one in ten respondents. Other mentions include: read information sent by MetroAccess
(8%), a friend or relative (7%), a social worker (5%) and/or a hospital (5%).• Notably, the majority of the non-subscribers who had sought information on subscription services said they were able to find
what they were looking for (75%).− Only about one in ten (11%) said that they had not been successful in their efforts to obtain information about the
MetroAccess subscriptions.
Seeking Information on Subscription Services
Respondent Type Total Subscribers Non-Subscribers (B) (C) Sources of Information Used n= (190) (154) (36)
Called WMATA/MetroAccess 27% 21% 53%B
Read info sent by MetroAccess 8 6 17
Friend/Relative 7 8 6
Social Worker 5 6 -
Hospital 5 6 -
Doctor/Nurse 4 5 -
MetroAccess Brochure 4 3 8
Internet/Web site 3 3 3
Able to Find Information1 n= (36) N/A (36)
Yes 75% N/A 75%
No 11 N/A 11
Don’t know 14 N/A 14 Base=Those Who Sought Info on Subscription Service
Multiple Responses Accepted; Top Mentions1Base=Non-Subscribers Who Sought Info on Subscription Service Q.18/19

48WB&A Market Research2191 Defense Highway • Suite 401 • Crofton, MD 21114 • 410-721-0500
Reservation Process (continued)
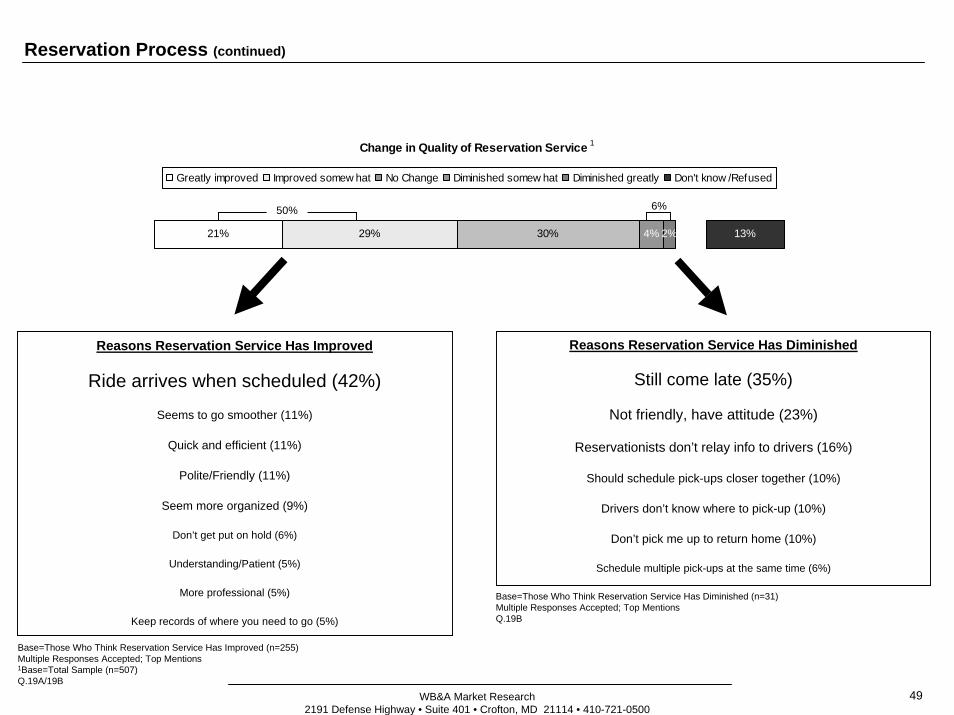
All respondents were asked if they felt that the quality of MetroAccess’ reservation process had improved or diminished over the past year, and if they thought it had changed, what changes did they feel had taken place.
• One-half of the respondents (50%) said they thought the reservation service had improved, with two in ten respondents (21%) saying they thought it had greatly improved.
− Of those who thought the reservation service had improved, the reason cited most often was that their rides arrive on-time, that is, when the reservationists say they will (42%). Other commonly given reasons included:
Respondents not having the problems they used to/the process going smoother (11%);The reservation process being quick and efficient (11%);The reservationists being polite, friendly and otherwise treating people with more respect (11%);MetroAccess seeming more organized (9%);Respondents not being put on-hold as often when calling to make reservations (6%);Reservationists being more patient and understanding when respondents tell them where they need to go (5%);
Reservationists being more professional (5%); and/orMetroAccess keeping (better) records of where riders need to go (5%).
• Only six percent of respondents said they felt as if the reservation process had diminished over the past year.
− Of those who thought the reservation service had diminished, the most common reasons given for saying this included:
Rides still come late (35%);Reservationists are not friendly, some can be sharp or get an attitude (23%);
Poor communication between reservationists and drivers (16%);Scheduling not making sense to respondents, with pick-ups being ‘all over the place’ (10%); Drivers not knowing where to pick-up respondents (10%);Drivers failing to pick-up for return trips (10%); and/orScheduling multiple pick-ups at the same time (6%).
49WB&A Market Research2191 Defense Highway • Suite 401 • Crofton, MD 21114 • 410-721-0500
Reservation Process (continued)
1
50% 6%
Change in Quality of Reservation Service
21% 29% 30% 13%4% 2%
Greatly improved Improved somew hat No Change Diminished somew hat Diminished greatly Don't know /Refused
Reasons Reservation Service Has Diminished
Still come late (35%)
Not friendly, have attitude (23%)
Reservationists don’t relay info to drivers (16%)
Should schedule pick-ups closer together (10%)
Drivers don’t know where to pick-up (10%)
Don’t pick me up to return home (10%)
Schedule multiple pick-ups at the same time (6%)
Reasons Reservation Service Has Improved
Ride arrives when scheduled (42%)
Seems to go smoother (11%)
Quick and efficient (11%)
Polite/Friendly (11%)
Seem more organized (9%)
Don’t get put on hold (6%)
Understanding/Patient (5%)
More professional (5%)
Keep records of where you need to go (5%)
Base=Those Who Think Reservation Service Has Diminished (n=31)Multiple Responses Accepted; Top MentionsQ.19B
Base=Those Who Think Reservation Service Has Improved (n=255)Multiple Responses Accepted; Top Mentions1Base=Total Sample (n=507)Q.19A/19B

WB&A Market Research2191 Defense Highway • Suite 401 • Crofton, MD 21114 • 410-721-0500
Detailed Findings – MetroAccess Service

51WB&A Market Research2191 Defense Highway • Suite 401 • Crofton, MD 21114 • 410-721-0500
MetroAccess Service
Respondents were asked a series of questions about the MetroAccess’ general quality of service. Among these were seven questions relating to specific aspects of general service.
These seven questions were averaged into an Overall MetroAccess Service Composite Score. A satisfied score is given to someone whose answers averaged between 8 and 10 on a 10-point satisfaction scale, with 10 being “completely satisfied” and 1 being “not at all satisfied.”
• The Overall Service Composite Score for MetroAccess was 85%.
Satisfaction with MetroAccess Service - Composite Score
85%
15%
0%
20%
40%
60%
80%
100%
Satisfied (8-10) Neutral/Not satisfied (1-7)
Base=Those Able to Rate At Least One Attribute (n=507)The Overall Satisfaction Score is the average of all Individual Satisfaction Scores

52WB&A Market Research2191 Defense Highway • Suite 401 • Crofton, MD 21114 • 410-721-0500
MetroAccess Service (continued)
Respondents were asked to rate seven aspects of MetroAccess’ service on a 10-point scale, with 10 meaning they were “completely satisfied” with this aspect and 1 meaning they were “not at all satisfied.” (NOTE: Respondents were asked to consider both taxis and vans when answering these questions.)
• Of the seven service attributes, three received satisfaction ratings of 8, 9 or 10 by approximately nine in ten of the respondents who were able to rate them.
• The vast majority of respondents (91%) were satisfied with the amount of room they had in the vehicle (giving a rating of 8 to 10).− In fact, three-fourths (75%) said they were “completely satisfied” (a rating of 10).
• A similar proportion (91%) said they were satisfied with the cost of the service.− Notably, almost eight in ten (77%) said they were “completely satisfied” with the cost.
• Likewise, the majority (89%) gave the quality of special boarding equipment, such as ramps or lifts a rating of 8, 9 or 10.− Furthermore, almost seven in ten (68%) were “completely satisfied” with this aspect of the service.
It is worth noting that less than two-thirds of all respondents (63%) said that the quality of special boarding equipment applied to them.
• Most respondents said they were satisfied with the cleanliness of MetroAccess vehicles (86%).− Many (61%) were “completely satisfied” with the cleanliness of the vehicles.
• About eight in ten (82%) expressed satisfaction with the ability of MetroAccess drivers to get them to their destination in a reasonable amount of time.− More than one-half (56%) rate this attribute a 10.
• A somewhat similar proportion of respondents (80%) said that they are satisfied with the level of noise in vehicles.− Over one-half (56%) said they are “completely satisfied.”
NOTE: While provisions were made to interview hearing-impaired respondents, none of those interviewed suffered from significant hearing problems. Significant hearing problems being defined as those in need of a special call-in phone service.
• Slightly more than seven in ten (72%) said that they were satisfied with the ability of MetroAccess drivers to arrive on-time for scheduled pick-ups.− Notably, slightly less than four in ten respondents (38%) said they were completely satisfied with the ability of drivers to
arrive on-time.

53WB&A Market Research2191 Defense Highway • Suite 401 • Crofton, MD 21114 • 410-721-0500
MetroAccess Service (continued)
Base=Those Answering (n=321-504)Q.24
Level of noise in vehicles
9.3
Mean
Amount of room in vehicle
9.2Quality of special boarding
equipment such as ramps or lifts
9.0Cleanliness of vehicles
8.7Ability of drivers to get to destination
in reasonable amount of time
8.7
Ability of drivers to arrive on-time for scheduled pick-ups 8.0
91%
91%
89%
86%
82%
80%
Cost 9.3
72%
MetroAccess Service Rating Scores - Those Answering
38%
56%
56%
61%
68%
77%
75%
15%
11%
15%
12%
12%
9%
7%
19%
13%
11%
13%
9%
5%
8%
20%
17%
13%
12%
9%
7%
8%
8%
4%
4%
2%
2%
2%
3%
10 (Completely satisf ied) 9 8 4-7 1-3 (Not satisf ied)

54WB&A Market Research2191 Defense Highway • Suite 401 • Crofton, MD 21114 • 410-721-0500
MetroAccess Service (continued)
Base=Total Sample (n=507)Q.24
Level of noise in vehicles
Amount of room in vehicle
Quality of special boarding equipment such as ramps or lifts
Cleanliness of vehicles
Ability of drivers to get to destination in reasonable amount of time
Ability of drivers to arrive on-time for scheduled pick-ups
Cost
Ability to Rate MetroAccess Service Attributes
98%
97%
99%
97%
63%
99%
99%
33%
<1%
1%
<1%
<1%
3%
2%
1%
2%
1%
1%
4%
Able to rate Not Applicable Don't know /Refused

55WB&A Market Research2191 Defense Highway • Suite 401 • Crofton, MD 21114 • 410-721-0500
MetroAccess Service (continued)
Respondents were asked whether a van or a taxi was the most common vehicle they traveled in when using MetroAccess.
• Nearly nine in ten (87%) said they often traveled in vans.
• About seven in ten (71%) said they often traveled in taxis.
• About six in ten respondents (59%) said they most often traveled with MetroAccess using a combination of vans and taxis. This means that…
− About three in ten (28%) said they almost always travel in vans, and
− One in eight (12%) say they almost always travel in taxis.
Most Common MetroAccess Vehicle
59%
59% 28%
12%
0% 20% 40% 60% 80% 100%
Taxi
Van
Combination Van only Taxi Only
87%
71%
Base=Total Sample (n=507)NOTE: 1% of respondents could not answerQ.20

56WB&A Market Research2191 Defense Highway • Suite 401 • Crofton, MD 21114 • 410-721-0500
MetroAccess Service (continued)
Respondents were asked how often their MetroAccess ride arrives within 15 minutes of their scheduled pick-up time, the 30-minute window being deemed as the acceptable time frame by MetroAccess.
• Nearly two in ten (18%) said that their ride always arrives within 15 minutes of the scheduled pick-up time.
• Slightly more than one-half (52%) said their ride arrives within 15 minutes most of the time.
• Conversely, one in twenty (5%) said their ride rarely or never arrives on-time.
Frequency of On-Time Arrival
18% 52% 23% 4%
1% 2%
Alw ays Most of the time Sometimes Rarely Never Don't know /Refused
Base=Total Sample (n=507)Q.20A

57WB&A Market Research2191 Defense Highway • Suite 401 • Crofton, MD 21114 • 410-721-0500
MetroAccess Service (continued)
Most Recent Ride On-Time
Don't know1%
Not On-Time18%
Yes, On-Time80%
Respondent Near Phone While Waiting
86%
80%
81%
12%
18%
17%
2%
2%
2%
Not On-Time
On-Time
TOTAL
Yes No Don't know /Refused
Base=Total Sample (n=507)Q.20B
For the purposes of establishing MetroAccess’ ability to respond to late pick-ups, respondents were asked whether or not their most recent ride had arrived within 15 minutes of the scheduled pick-up.
All respondents were also asked if they were reachable by telephone while they waited for their most recent MetroAccess ride.
Those whose most recent ride was not on time were then asked a series of questions about how they and MetroAccess had responded.
• Eight in ten MetroAccess riders (80%) said their most recent ride was on time.
− However, nearly two in ten (18%) said that their most recent MetroAccess ride had not arrived within 15 minutes of the scheduled pick-up time.
• About eight in ten respondents (81%) said that they were near a telephone while waiting for their most recent ride.
− This included 86% of those whose most recent ride was not on-time.
Base=Total Sample (n=507)Q.21

58WB&A Market Research2191 Defense Highway • Suite 401 • Crofton, MD 21114 • 410-721-0500
MetroAccess Service (continued)
Yes76%
No24%
Those respondents whose most recent MetroAccess ride had not arrived within 15 minutes of the scheduled pick-up time were asked if they had tried to notify MetroAccess about their late ride.
• About three-fourths (76%) said that they had tried to contact MetroAccess.
− Conversely, many (24%) did not attempt to notify MetroAccess that their ride was late.
• Virtually all of the respondents (97%) who said they tried to contact MetroAccess when their ride was late were successful in notifying MetroAccess of the problem.
• Among those respondents who had not tried to notify MetroAccess, one-third (33%) said that MetroAccess had contacted them regarding their late pick-up time.
• Overall, this means that between those respondents who unsuccessfully attempted to contact MetroAccess and those who were not contacted by MetroAccess, one in six respondents whose ride was late (17%) did not have any contact with MetroAccess during this time.
Base 1 =Those Whose Ride Was Late (n=93)Q.22Base 2 =Those Who Did Not Try to Contact MetroAccess But Were Reachable by Phone (n=18)CAUTION: Small BaseQ.23ABase 3 =Those Who Tried to Contact MetroAccess (n=71)Q.23
Yes33%
No67%
MetroAccess Contacted Rider 2
Yes97%
No1%
Don't know1%
Were Able to Contact MetroAccess 3
Tried to Notify MetroAccess that Ride was Late 1

59WB&A Market Research2191 Defense Highway • Suite 401 • Crofton, MD 21114 • 410-721-0500
MetroAccess Service (continued)
Those respondents who either were able to contact MetroAccess or were contacted by the service were asked how satisfied they were with the response they received. They were asked to rate their level of satisfaction on a 10-point scale, with 10 meaning they were “completely satisfied” with the response and 1 meaning they were “not at all satisfied.”
• Notably, only about one-third of respondents who were in contact with MetroAccess said they were satisfied with the response they were given (32% giving a rating of 8 to 10).
• At the same time, a substantial proportion (39%) said they were not satisfied with the response they received (giving a rating of 1to 3).
Satisfaction with Late Ride Response
16% 15% 28% 39%
1%
1%
10 (Completely satisf ied) 9 8 4-7 (Neutral) 1-3 (Not satisf ied) Refused
Base=Those Who Contacted/Were Contacted by MetroAccess (n=75)Q.23B
32%Mean
5.1

60WB&A Market Research2191 Defense Highway • Suite 401 • Crofton, MD 21114 • 410-721-0500
MetroAccess Service (continued)
Respondents were asked what other modes of transportation they regularly used besides MetroAccess. Respondents were also probedfurther to see if they had ever used either Metrobus and/or Metrorail.
• Aside from MetroAccess, the most commonly used mode(s) of transportation were friends or family members’ vehicles (42%).
− In addition, at least one in ten respondents said they commonly used taxis (13%) and/or their own personal cars (12%) as a means of transportation.
− About one in twenty respondents said that they also regularly used the Metrobus (7%) and/or the Metrorail (5%) on a regular basis.
• About four in ten respondents said that they had ever used either the Metrobus (40%) and/or Metrorail (39%).
Other Forms of Transportation - Unaided
1%
25%
8%
2%
5%
7%
12%
13%
42%
0% 20% 40% 60% 80% 100%
Don't know /Refused
None
Other
"The Bus"
Metrorail
Metrobus
Personal car
Taxi
Family/Friend's vehicleUse of Other WMATA Systems - Total
5%
7%
35%
34%
0% 20% 40% 60% 80% 100%
Metrorail
Metrobus
Unaided Aided
Base=Total Sample (n=507)Q.25-Q25AA
40%
39%
Base=Total Sample (n=507)Multiple Responses AcceptedQ.25

61WB&A Market Research2191 Defense Highway • Suite 401 • Crofton, MD 21114 • 410-721-0500
MetroAccess Service (continued)
Respondents who had used either Metrobus or Metrorail were asked whether they preferred Metrobus and/or Metrorail to MetroAccess and, if they preferred MetroAccess, what the reason(s) were for their preference. This can be looked at on three levels: Those who have used just Metrobus, those who have used just Metrorail, and those who have used both.
• In all cases, a large majority of respondents preferred MetroAccess to the other two services.
− Almost all who had used only Metrobus or Metrorail preferred MetroAccess (95% each).
MetroAccess Compared to Other WMATA Systems
Have Used Metrobus Only Metrorail Only Both (B) (C) (D) Prefer MetroAccess n= (62) (56) (142)
Yes 95%D 95%D 80%
No 2 5 12B
Don’t know/Refused 3 - 8B Compared To Metrobus Metrorail Both (B) (C) (D) Reasons for Preferring MetroAccess1 n= (59) (53) (114)
Door-to-door service 47% 32% 47%
Net: Handicapped Issues 56C 36 44
Hard to get around/Can’t walk much 46C 25 37
Wide steps/Helpful lifts 8 8 10
Accommodate Wheelchair 5 6 2
Metrobus/rail won’t take you everywhere 14 23D 10
Drivers are helpful/courteous 14 15 5
On time/Don’t have to wait 8 6 11
Not crowded 7 6 8
Less expensive than public transportation 3 11 7
Drivers make sure you get where you need to go 3 8 7
Faster service 3 8 5
Don’t have to worry about getting on the wrong bus 3 6 7 Base=Those Having Used One Other WMATA System
1Base=Those Who Prefer MetroAccess to Other WMATA Systems They Have Used Multiple Responses Accepted; Top Mentions Q.25B/25C
− Eight in ten respondents who had used both Metrorail and Metrobus (80%) preferred MetroAccess to either other system.
• The most common reasons given for preferring MetroAccess were the door-to-door service and its ability to take people anywhere (32% to 47%) and because of handicapped issues (36% to 56%).
− Interestingly, those who had used just Metrobus were more likely than those who had used only Metrorail to say they preferred MetroAccess because of its ability to deal with handicapped issues (56% vs. 36%).

62WB&A Market Research2191 Defense Highway • Suite 401 • Crofton, MD 21114 • 410-721-0500
MetroAccess Service (continued)
All respondents were asked if they felt that the quality of MetroAccess’ service had improved or diminished over the past year, and, if they thought it had changed, what changes did they feel had taken place.
• Slightly more than one-half of the respondents (53%) said they thought MetroAccess’ service had improved over the past year, with nearly one-fourth of the respondents (23%) saying they thought it had greatly improved.
− The most common reason given by those who said service has improved was that it was reliable and seems to show up on time (51%).
− In addition, other reasons given for feeling service had improved included:
Drivers are helpful, nicer and more courteous (15%);
Drivers know where respondents need to go (14%);
Service has been good/A smooth process (10%);
The use of new buses and vans, as well as upgraded equipment (6%); and/or
MetroAccess has more drivers and vehicles now (5%).
• One in twenty (5%) said that the quality of MetroAccess’ service has diminished either somewhat or greatly in the past year. The most common reasons given for this included:
Late pick-ups (50%, or 13 respondents);
Unreliable for return pick-ups (23%, or 6 respondents);
Drivers have attitudes and are rude (19%, or 5 respondents);
Drivers don’t know where they are going (15%, or 4 respondents); and/or
Scheduling doesn’t make sense, makes passengers ride a long way out of their way (12%, or 3 respondents).

63WB&A Market Research2191 Defense Highway • Suite 401 • Crofton, MD 21114 • 410-721-0500
MetroAccess Service (continued)
53%
Change in Quality of MetroAccess Service
23% 30% 27% 14%4%
1%
Greatly improved Improved somew hat No Change Diminished somew hat Diminished greatly Don't know /Refused
1
Reasons MetroAccess Service Has Improved
Show up on time (51%)
Drivers are helpful/nicer (15%)
Drivers know where I need to go (14%)
Has been good/smooth process (10%)
New buses and vans (6%)
Have more drivers and vehicles now (5%)
Reasons MetroAccess Service Has Diminished
Late pick-ups in general (50%)
Unreliable for return pick-ups (23%)
Drivers are rude (19%)
Drivers don’t know where they are going (15%)
Scheduling makes passengers go a long way out of their way (12%)
Base=Those Who Think MetroAccess Service Has Diminished (n=26)Multiple Responses Accepted; Top MentionsCAUTION: Small BaseQ.26A
Base=Those Who Think MetroAccess Service Has Improved (n=270)Multiple Responses Accepted; Top Mentions1Base=Total Sample (507)Q.26/26A

WB&A Market Research2191 Defense Highway • Suite 401 • Crofton, MD 21114 • 410-721-0500
Detailed Findings - Drivers

65WB&A Market Research2191 Defense Highway • Suite 401 • Crofton, MD 21114 • 410-721-0500
Drivers
Respondents were asked a series of questions about the quality of MetroAccess’ drivers. Among these were 12 questions targeting specific aspects related to the drivers.
These 12 questions were averaged into an Overall Drivers’ Composite Score. A satisfied score is given to someone whose answers averaged between 8 and 10 on a 10-point satisfaction scale, with 10 being “completely satisfied” and 1 being “not at all satisfied.”
• The Overall Drivers’ Composite Score for MetroAccess was 86%. .
Satisfaction with Drivers - Composite Score
86%
14%
0%
20%
40%
60%
80%
100%
Satisfied (8-10) Neutral/Not satisf ied (1-7)
Base=Those Able to Rate At Least One Attribute (n=506)The Overall Satisfaction Score is the average of all Individual Satisfaction Scores

66WB&A Market Research2191 Defense Highway • Suite 401 • Crofton, MD 21114 • 410-721-0500
Drivers (continued)
Respondents were asked to rate 12 aspects of MetroAccess’ drivers’ performance on a 10-point scale, with 10 meaning they were “completely satisfied” with this aspect and 1 meaning they were “not at all satisfied.”
• Of the 12 driver attributes, respondents were most satisfied with their performance in four areas with approximately nine in ten of those answering giving a rating of 8 to 10.
• Most of the respondents who use a wheelchair were satisfied (90%) with the drivers’ ability to operate the wheelchair lift.
− In fact, seven in ten (70%) said they were “completely satisfied” (a rating of 10).
• The vast majority of respondents (89%) were satisfied with the drivers in regards to their ability to drive safe.
− About six in ten (61%) were “completely satisfied” (a rating of 10).
• Likewise most respondents (88%) were satisfied with the friendliness of the drivers.
− Approximately six in ten (61%) were “completely satisfied” with this attribute (a rating of 10).
• A similar proportion of respondents (88%) said they were satisfied with the drivers’ ability to understand the special needs of passengers.
− Almost six in ten (59%) were “completely satisfied” (a rating of 10).
• There were six driver performance attributes which received very similar overall satisfaction ratings from these respondents:
− Approachability (86% satisfied, with 56% “very satisfied);
− Helpfulness (85% satisfied, with 57% “very satisfied);
− Competency (85% satisfied, with 54% “very satisfied);
− Ability to secure wheelchairs safely (84% satisfied, with 59% “very satisfied);* This was only asked of those who used a wheelchair.
− Sensitivity (84% satisfied, with 56% “very satisfied); and
− Professionalism (84% satisfied, with 55% “very satisfied).
• Approximately eight in ten respondents (81%) said they were satisfied with the drivers’ knowledge of disabled issues.
− Approximately one-half (51%) were “completely satisfied” with this attribute (a rating of 10).
• Slightly less than eight in ten (78%) said they were satisfied with the drivers’ familiarity with respondents’ routes.
− More than four in ten (46%) were “completely satisfied” (a rating of 10).

67WB&A Market Research2191 Defense Highway • Suite 401 • Crofton, MD 21114 • 410-721-0500
Drivers (continued)
Base=Those Answering (n=119-501)1Base=Those Answering Who Use a Wheelchair Q.28
Mean
9.4Ability to operate wheelchair lift190%
9.1Friendliness88%
9.0Ability to drive safe89%
9.0Understanding special
needs of passengers
88%
8.9Ability to secure wheelchair safely1
84%
8.9Helpfulness85%
8.9Approachability86%
8.9
Competency
84%
8.8
Sensitivity
84%
8.8
Professionalism
85%
8.6Knowledge of disabled issues81%
8.5Familiarity with route78%
Drivers' Rating Scores - Those Answering
46%
51%
54%
55%
56%
56%
57%
59%
59%
61%
61%
70%
16%
14%
16%
15%
13%
15%
15%
14%
14%
15%
14%
16%
16%
16%
15%
14%
15%
14%
13%
11%
14%
13%
13%
4%
18%
16%
13%
13%
13%
11%
12%
13%
10%
9%
10%
9%
4%
3%
3%
3%
4%
2%
1%
2%
2%
3%
2%
2%
10 (Completely satisf ied) 9 8 4-7 1-3 (Not satisf ied)

68WB&A Market Research2191 Defense Highway • Suite 401 • Crofton, MD 21114 • 410-721-0500
Drivers (continued)
Base=Total Sample (n=507)1Base=Those Who Use a Wheelchair (n=121)Q.28
Ability to operate wheelchair lift1
Friendliness
Ability to drive safe
Understanding special needs of passengers
Ability to secure wheelchair safely1
Helpfulness
Approachability
Competency
Sensitivity
Professionalism
Knowledge of disabled issues
Familiarity with route
Abilit to Rate Drivers' Attributes
99%
87%
98%
97%
96%
94%
99%
98%
93%
98%
98%
99%
2%
2%
<1%
<1%
5%
4%
6%
3%
11%
1%
2%
2%
2%
2%
1%
1%
Able to rate Not Applicable Don't know /Refused

69WB&A Market Research2191 Defense Highway • Suite 401 • Crofton, MD 21114 • 410-721-0500
Drivers (continued)
Respondents were asked if they felt that the quality of MetroAccess’ drivers had improved or diminished over the past year, and, if they thought it had changed, what changes did they feel had taken place.
• Nearly one-half (47%) said they thought the quality of MetroAccess’ drivers had improved in the past year, with more than two in ten respondents (22%) saying they thought drivers had improved greatly.
− The reasons given most often for this by those who said drivers had improved were:
Drivers are more friendly, laugh and talk with riders (26%);Drivers try to be on time (23%); and/orDrivers are helpful/help with boarding and fastening seatbelts (20%).
− Other reasons often given for thinking there has been an improvement included:
Drivers know where they are going (18%);Drivers’ courtesy has improved (16%);Drivers seem more concerned/are more caring, patient and understanding (11%);By sending the same driver respondents get to know them (6%); and/orThey drive safe/handle the vehicles better (5%).
• Only four percent of respondents (4%) said they thought the quality of drivers had diminished either somewhat or greatly. The reasons given by them included:
Sometimes respondents get a driver who has an attitude (20%, or 4 respondents);Drivers don’t know the route (20%, or 4 respondents);MetroAccess has gone through a lot of drivers recently (15%, or 3 respondents); Driver wouldn’t drop respondent off at their door, made them walk (15%, or 3 respondents);Late pick-ups (15%, or 3 respondents); and/orThey drive too fast and/or recklessly (10%, or 2 respondents).

70WB&A Market Research2191 Defense Highway • Suite 401 • Crofton, MD 21114 • 410-721-0500
Drivers (continued)
Change in Quality of Drivers
22% 25% 34% 3%
1%
15%
Greatly improved Improved somew hat No Change Diminished somew hat Diminished greatly Don't know /Refused
1
47%
Reasons Drivers Have Diminished
Some drivers have an attitude (20%)
Don’t know route (20%)
MetroAccess has gone through a lot of new drivers (15%)
Driver wouldn’t drop me at door (15%)
Late pick-ups (15%)
Drive too fast (10%)
Reasons Drivers Have Improved
Laugh and talk with you (26%)
Try to be on time (23%)
Help in boarding (20%)
Know where they are going (18%)
Courtesy has improved (16%)
More caring/patient/understanding (11%)
Get to know driver/Send same driver (6%)
Drivers safe/handle vehicles better (5%)
Base=Those Who Think Drivers Have Diminished (n=20)CAUTION: Small BaseMultiple Responses Accepted; Top MentionsQ.30
Base=Those Who Think Drivers Have Improved (n=239)Multiple Responses Accepted; Top Mentions1Base=Total Sample (n=507)Q.29/30

WB&A Market Research2191 Defense Highway • Suite 401 • Crofton, MD 21114 • 410-721-0500
Appendix

72WB&A Market Research2191 Defense Highway • Suite 401 • Crofton, MD 21114 • 410-721-0500
Overall Satisfaction Score – Given
In addition to the Overall Satisfaction Composite Score, respondents were asked directly what their overall level of satisfaction was with MetroAccess. Those who were not satisfied were asked what the reasons were for their dissatisfaction.
• More than six in ten (64%) said they were satisfied with MetroAccess (a rating of 8 to 10 on a 10-point scale).
• Conversely, slightly less than one in ten (7%) said they were dissatisfied.
• Overwhelmingly, the reason given for dissatisfaction was that they do not get picked up on time (61%).
64%
Overall Rating - Given
27% 17% 20% 29% 7%
1%
10 (Completely satisf ied) 9 8 4-7 1-3 (Not satisf ied) Don't know
Mean
7.7
Base=Total Sample (n=507)Q.1
Reason for Dissatisfaction
Don’t get picked up on time (61%)Don’t show up for return trip (27%)
Drivers don’t know where they’re going (24%)
Reservations are lost (18%)
Drivers don’t help with boarding (9%)
Shared rides take too long (9%)Base=Those Giving Dissatisfied Rating (n=33)Multiple Responses Accepted; Top MentionsQ.1A