metropolitan open space...
TRANSCRIPT
Metropolitan Open Space NetworkProvision and Distribution
June 2017
METROPOLITAN OPEN SPACE NETWORK DISTRIBUTION - June 20172
Contents
1.0 INTRODUCTION 4
1.1 Open space definitions 41.1.1 Open space 4
1.1.2 Public open space 4
1.1.3 Restricted public land 4
1.1.4 Private open space 5
2.0 NETWORK PLANNING PRINCIPLES 5
2.1 The six pillars 6
3.0 OPEN SPACE PROVISION AND DISTRIBUTION 7
3.1 Quantifying access to open space 73.2 Results of the analysis 73.3 Data tables 8
4.0 APPENDIX - OPEN SPACE CLASSIFICATION AND HIERARCHY 22
METROPOLITAN OPEN SPACE NETWORK DISTRIBUTION - June 2017 3
TABLES
Table 1 Distribution of public open space types per municipality 8Table 2 Distribution of public open space types per subregion
- inclusive of growth areas 9Table 3 Distribution of public open space types per subregion
- excluding growth area LGAs 9Table 4 Distribution of restricted public land types per municipality 10Table 5 Public open space as a proportion of municipal area 11Table 6 Public open space as a proportion of subregion area
- inclusive of growth areas 12Table 7 Public open space as a proportion of subregion area
- excluding growth area LGAs 12Table 8 Area of public open space per person 13Table 9 Area of public open space per person - inclusive of growth areas 14Table 10 Area of public open space per person - excluding growth area LGAs 14Table 11 Population within 400m walkable distance of public open space (POS) per
municipality 15Table 12 Summary of public open space ownership per municipality 16Table 13 Summary of public open space ownership per subregion
- inclusive of growth areas 17Table 14 Summary of public open space ownership per subregion
- excluding growth area LGAs 17Table 15 Summary of public open space ownership by percentage of ownership type
per municipality 18Table 16 Public open space ownership by percentage of ownership type per subregion
- inclusive of growth areas 19Table 17 Public open space ownership by percentage of ownership type per subregion
- excluding growth area LGAs 19Table 18 Summary of restricted public land ownership per municipality 20Table 19 Summary of restricted public land ownership per subregion
- inclusive of growth areas 21Table 20 Summary of restricted public land ownership per subregion
- excluding growth area LGAs 21

METROPOLITAN OPEN SPACE NETWORK DISTRIBUTION - June 20174
1.0 INTRODUCTIONMetropolitan Melbourne’s vibrant open space network includes gardens and heritage parks, neighbourhood and pocket parks, sports fields, regional and national parks, trails, beaches, wetlands, waterways, piers, jetties, rooftop gardens, plazas, squares and civic areas. Each type of open space holds its own unique values and provides a range of social, economic and environmental outcomes that contribute to the overall liveability of the city’s metropolitan area.
In order to understand Melbourne’s open space network, the VPA reviewed existing data, and the many definitions and categories of open space that are utilised by state and local governments. From this the following work was produced:
• A clear definition of open space alongside a hierarchy and categorisation system;
• The production of a comprehensive GIS based open space network map based on quality assured data from state and local government sources for the entire Melbourne metropolitan area;
• The creation of an online portal for interactive use of the map, including the potential for users to access and utilise the primary data that generates the map;
• Updated provision statistics down to LGA level, but with adaptability to any scale; and
• The first walkable access mapping for the entire metropolitan area to test distribution of the network and to identify areas of relative under-provision.
This document provides a summary overview of results from the VPA’s analysis of open space provision and distribution thoughout the Melbourne metropolitan region.
1.1 Open space definitions
Open space can include parks, pathways, roadway greens, land for recreation, environmental purposes, visual amenity, golf courses, cemeteries and other types of alternative use open space. Indeed, the definition of open space depends on the context – in a highly urban area, a narrow cycling trail or small vacant lot can be open space, while in areas with less built form it might take the shape of a lake, national park or set of playing fields.
Building on a range of concepts and definitions for open space, the VPA has developed a multi-tiered definition of open space, reflecting the range of land types and their diversity of functions and roles.
1.1.1 Open space
Land that provides outdoor recreation, leisure and/or environmental benefits and/or visual amenity.
This definition can be disaggregated into component parts as folows:
1.1.2 Public open space
Publicly owned land that:
1. Is accessible to the community;
2. Is set aside for the primary purpose of outdoor recreation and leisure, conservation, waterways, and/or heritage; and
3. Provides one or more of outdoor recreation, leisure and environmental benefits and/or visual amenity.
1.1.3 Restricted public land
Publicly owned land:
1. Where public access and/or use is restricted;
2. That is set aside for the primary purpose of outdoor recreation, conservation, heritage and/or services including transport, education, water, health or utilities; but
3. That provides one or more of outdoor recreation, leisure and environmental benefits and/or visual amenity.

METROPOLITAN OPEN SPACE NETWORK DISTRIBUTION - June 2017 5
1.1.4 Private open space
Land that is privately owned or leased on a long term basis to private operators, and where public access is prohibited or significantly restricted, but that may still contribute environmental benefits and visual amenity.
2.0 NETWORK PLANNING PRINCIPLESThe VPA has identified a series of six fundamental network planning principles to guide assessment of open space provision across the metropolitan region, and to assist in identifying and prioritising potential interventions. The principles / pillars rest on the foundation objective of optimising access to, and use of, all practically available publicly owned land (inclusive of Restricted Public Land) for net community benefit.
The principles are based on the contention that no one element or factor in isolation can deliver a high quality open space network. Instead there are a range of universal “ingredients” that can be mixed and matched and used in different proportions to underpin spatial planning solutions that are responsive to local or regional circumstances.
The principles have been crafted to:
• Provide direction and strategic planning for the metropolitan open space network as a whole;
• Provide a framework for local governments as they review and revise their existing open space strategies;
• Complement the guidance contained in the PSP guidelines, where specific quantitative provision standards are in place; and
• Inform the process to arrive at an appropriate open space contribution rate in established areas where there are no pre-determined open space development contribution rates.
The overarching goal of the network planning principles is to achieve an integrated and accessible open space network that facilitates high quality and affordable communities, maximises the community benefit of all available public land and underpins and strengthens Melbourne’s liveability, resilience and biodiversity.

METROPOLITAN OPEN SPACE NETWORK DISTRIBUTION - June 20176
2.1 The six pillars
The six network planning principles (or the ‘six pillars’) are as follows.
EQUITABLE DISTRIBUTION
Deliver a network of open spaces that are located to ensure community access within a safe 5 minute walk (approximately 400m) of 95% of residents.
QUALITY
Design, build and maintain open spaces to optimise their capacity and resilience, and to enhance community appreciation.
QUANTITY
Provide an appropriate amount of open space to cater for a range of community uses.
ACCESS & CONNECTIVITY
Create a network of open spaces that are accessible to all, free of charge and connected by safe pedestrian and cycle links, public transport options and where practicable co-located with community infrastructure.
DIVERSITY
Deliver a network of open space types (pocket, neighbourhood, community, district, municipal and regional parks) that provide for a range of uses, functions and differing levels of amenity.
SUSTAINABILITY
Create a network that is planned and managed to support biodiversity and city amenity which is also fit for purpose, fiscally responsible and resource efficient.
METROPOLITAN OPEN SPACE NETWORK DISTRIBUTION - June 2017 7
3.0 OPEN SPACE PROVISION AND DISTRIBUTION
3.1 Quantifying access to open space
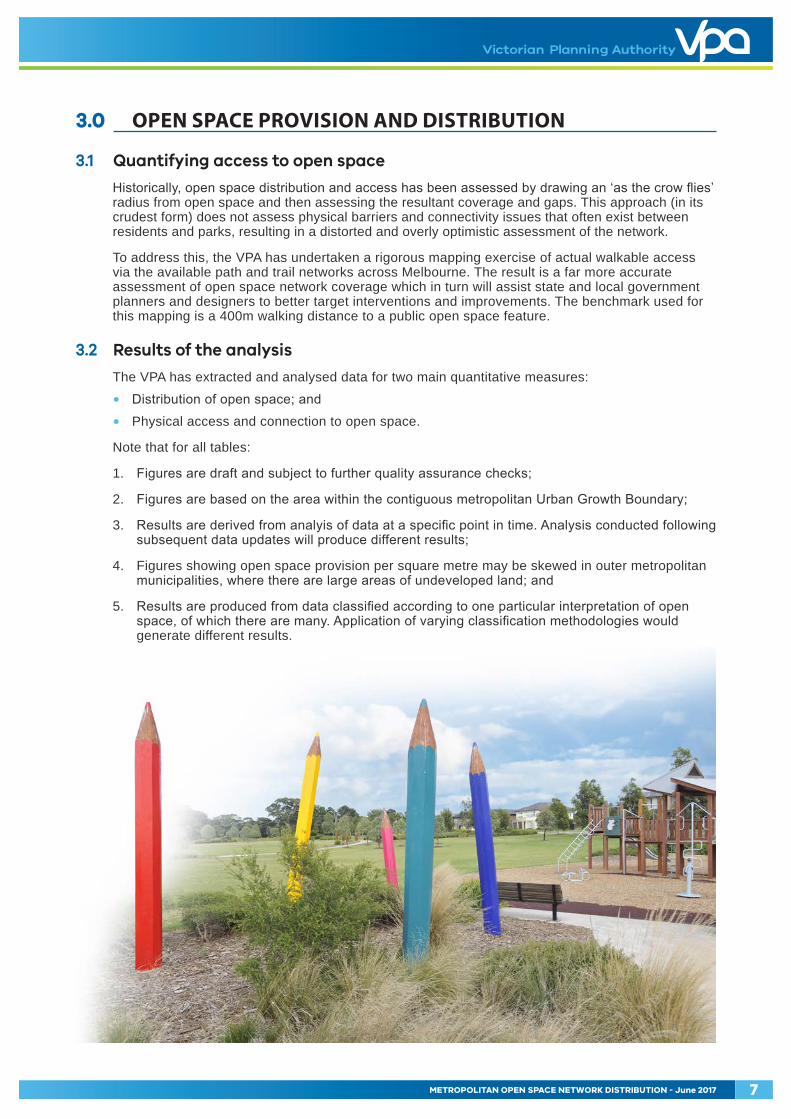
Historically, open space distribution and access has been assessed by drawing an ‘as the crow flies’ radius from open space and then assessing the resultant coverage and gaps. This approach (in its crudest form) does not assess physical barriers and connectivity issues that often exist between residents and parks, resulting in a distorted and overly optimistic assessment of the network.
To address this, the VPA has undertaken a rigorous mapping exercise of actual walkable access via the available path and trail networks across Melbourne. The result is a far more accurate assessment of open space network coverage which in turn will assist state and local government planners and designers to better target interventions and improvements. The benchmark used for this mapping is a 400m walking distance to a public open space feature.
3.2 Results of the analysis
The VPA has extracted and analysed data for two main quantitative measures:
• Distribution of open space; and
• Physical access and connection to open space.
Note that for all tables:
1. Figures are draft and subject to further quality assurance checks;
2. Figures are based on the area within the contiguous metropolitan Urban Growth Boundary;
3. Results are derived from analyis of data at a specific point in time. Analysis conducted following subsequent data updates will produce different results;
4. Figures showing open space provision per square metre may be skewed in outer metropolitan municipalities, where there are large areas of undeveloped land; and
5. Results are produced from data classified according to one particular interpretation of open space, of which there are many. Application of varying classification methodologies would generate different results.

METROPOLITAN OPEN SPACE NETWORK DISTRIBUTION - June 20178
3.3 Data tables
Table 1 Distribution of public open space types per municipality
AREA (HA)
MUNICIPALITYCIVIC
SQUARES & PROMENADES
CONSERVATION RESERVES
NATURAL & SEMI-NATURAL OPEN
SPACE
PARKS & GARDENS
RECREATION CORRIDORS
SPORTSFIELDS & ORGANISED RECREATION
TRANSPORT RESERVATIONS
TOTAL
Banyule - 0.2 512.8 127.3 3.0 244.1 2.4 890
Bayside 2.0 2.3 159.6 52.3 0.1 109.1 1.5 327
Boroondara - 9.7 264.0 171.8 0.5 174.8 1.8 623
Brimbank - 242.7 845.6 386.4 38.7 179.8 3.4 1,697
Cardinia - 1.8 251.0 84.2 9.6 80.8 1.2 429
Casey 0.1 29.1 805.0 947.7 58.2 407.0 4.3 2,251
Darebin 0.1 95.0 147.7 199.1 8.8 197.4 0.6 649
Frankston - 108.7 285.6 149.3 34.3 198.7 0.5 777
Glen Eira - - - 43.7 0.3 122.0 4.7 171
Greater Dandenong 0.04 - 263.4 93.3 31.8 182.9 0.1 572
Hobsons Bay - 87.6 601.7 105.8 7.9 186.5 2.9 992
Hume - 197.7 818.3 199.0 26.5 144.6 0.2 1,386
Kingston 0.01 1.7 479.5 147.2 8.7 169.4 0.5 807
Knox 0.1 3.1 777.8 102.3 53.9 258.8 4.6 1,200
Manningham - 34.3 655.3 222.1 5.2 142.5 0.6 1,060
Maribyrnong 0.2 - 150.3 97.9 5.9 94.5 0.4 349
Maroondah - 28.5 179.1 108.2 7.0 303.4 2.8 629
Melbourne 12.3 - 251.3 419.4 2.0 100.1 3.1 788
Melton 1.0 140.7 624.1 162.3 26.0 111.5 4.4 1,070
Mitchell - - 16.9 22.7 2.3 18.8 - 61
Monash - - 324.3 154.7 5.0 229.2 3.3 716
Moonee Valley - - 224.4 117.7 6.5 178.4 0.1 527
Moreland 0.1 - 215.0 143.7 21.5 143.4 1.2 525
Mornington - - 68.8 17.1 0.1 4.1 - 90
Nillumbik - 21.8 118.8 138.3 26.9 46.6 - 352
Port Phillip - - 150.2 90.7 0.2 162.4 7.9 411
Stonnington - - 26.7 62.9 3.3 58.5 - 151
Whitehorse - 0.9 301.9 132.3 12.1 158.7 1.0 607
Whittlesea 11.1 411.3 459.0 367.5 32.2 202.1 7.0 1,490
Wyndham - 22.5 775.7 229.7 71.3 299.4 5.7 1,404
Yarra - - 109.3 91.0 0.3 99.3 0.7 301
Yarra Ranges 0.9 5.9 136.5 159.3 26.0 91.8 0.1 420
Total 28 1,445 11,000 5,547 536 5,100 67 23,723
METROPOLITAN OPEN SPACE NETWORK DISTRIBUTION - June 2017 9
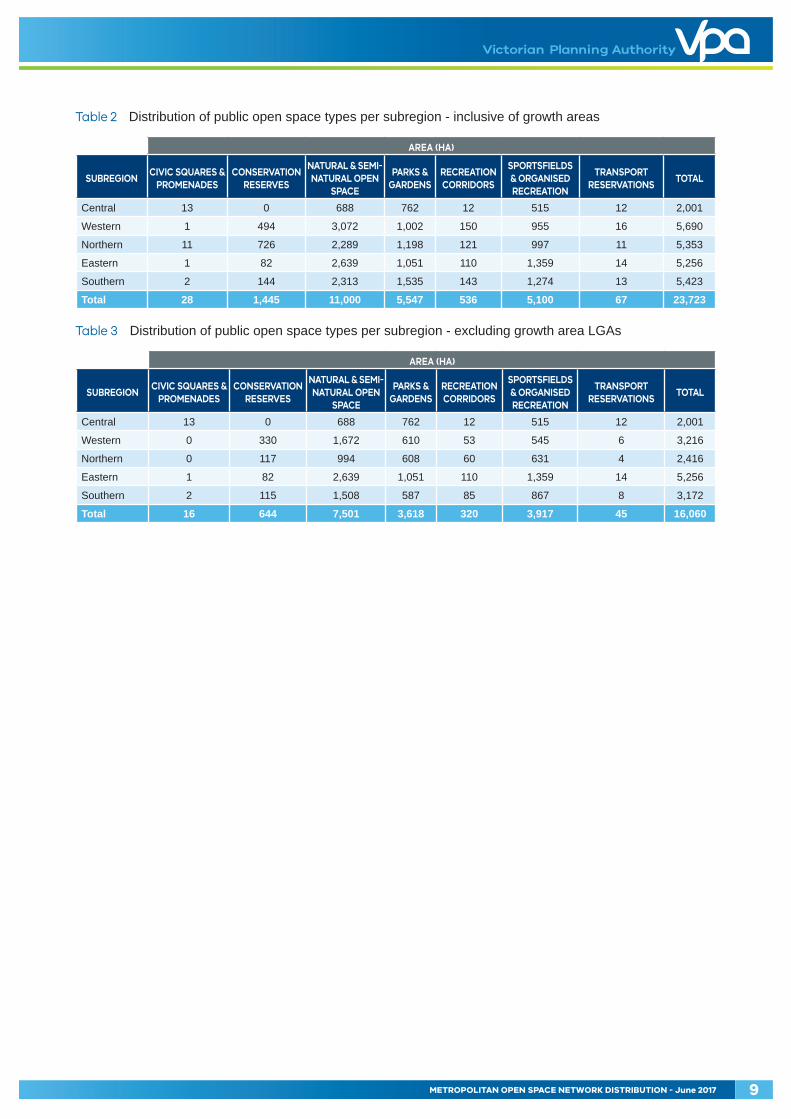
Table 2 Distribution of public open space types per subregion - inclusive of growth areas
AREA (HA)
SUBREGIONCIVIC SQUARES &
PROMENADESCONSERVATION
RESERVES
NATURAL & SEMI-NATURAL OPEN
SPACE
PARKS & GARDENS
RECREATION CORRIDORS
SPORTSFIELDS & ORGANISED RECREATION
TRANSPORT RESERVATIONS
TOTAL
Central 13 0 688 762 12 515 12 2,001
Western 1 494 3,072 1,002 150 955 16 5,690
Northern 11 726 2,289 1,198 121 997 11 5,353
Eastern 1 82 2,639 1,051 110 1,359 14 5,256
Southern 2 144 2,313 1,535 143 1,274 13 5,423
Total 28 1,445 11,000 5,547 536 5,100 67 23,723
Table 3 Distribution of public open space types per subregion - excluding growth area LGAs
AREA (HA)
SUBREGIONCIVIC SQUARES &
PROMENADESCONSERVATION
RESERVES
NATURAL & SEMI-NATURAL OPEN
SPACE
PARKS & GARDENS
RECREATION CORRIDORS
SPORTSFIELDS & ORGANISED RECREATION
TRANSPORT RESERVATIONS
TOTAL
Central 13 0 688 762 12 515 12 2,001
Western 0 330 1,672 610 53 545 6 3,216
Northern 0 117 994 608 60 631 4 2,416
Eastern 1 82 2,639 1,051 110 1,359 14 5,256
Southern 2 115 1,508 587 85 867 8 3,172
Total 16 644 7,501 3,618 320 3,917 45 16,060
METROPOLITAN OPEN SPACE NETWORK DISTRIBUTION - June 201710
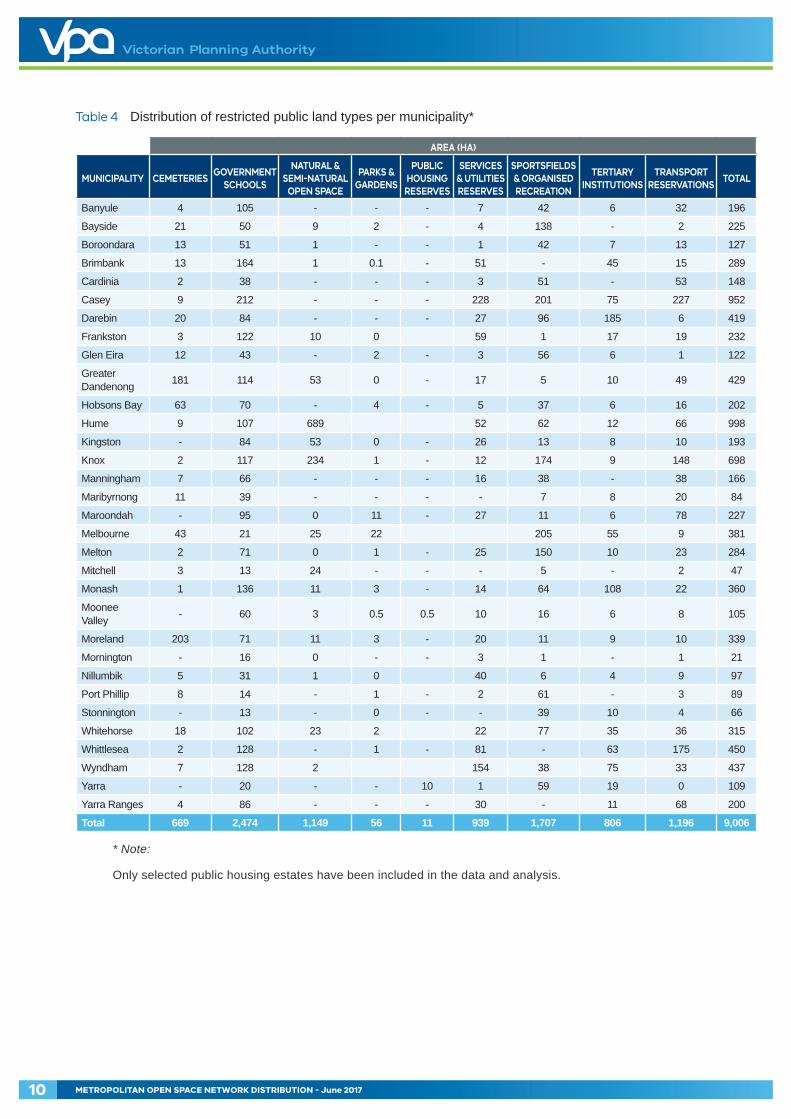
Table 4 Distribution of restricted public land types per municipality*
AREA (HA)
MUNICIPALITY CEMETERIESGOVERNMENT
SCHOOLS
NATURAL & SEMI-NATURAL
OPEN SPACE
PARKS & GARDENS
PUBLIC HOUSING
RESERVES
SERVICES & UTILITIES RESERVES
SPORTSFIELDS & ORGANISED RECREATION
TERTIARY INSTITUTIONS
TRANSPORT RESERVATIONS
TOTAL
Banyule 4 105 - - - 7 42 6 32 196
Bayside 21 50 9 2 - 4 138 - 2 225
Boroondara 13 51 1 - - 1 42 7 13 127
Brimbank 13 164 1 0.1 - 51 - 45 15 289
Cardinia 2 38 - - - 3 51 - 53 148
Casey 9 212 - - - 228 201 75 227 952
Darebin 20 84 - - - 27 96 185 6 419
Frankston 3 122 10 0 59 1 17 19 232
Glen Eira 12 43 - 2 - 3 56 6 1 122
Greater Dandenong 181 114 53 0 - 17 5 10 49 429
Hobsons Bay 63 70 - 4 - 5 37 6 16 202
Hume 9 107 689 52 62 12 66 998
Kingston - 84 53 0 - 26 13 8 10 193
Knox 2 117 234 1 - 12 174 9 148 698
Manningham 7 66 - - - 16 38 - 38 166
Maribyrnong 11 39 - - - - 7 8 20 84
Maroondah - 95 0 11 - 27 11 6 78 227
Melbourne 43 21 25 22 205 55 9 381
Melton 2 71 0 1 - 25 150 10 23 284
Mitchell 3 13 24 - - - 5 - 2 47
Monash 1 136 11 3 - 14 64 108 22 360
Moonee Valley - 60 3 0.5 0.5 10 16 6 8 105
Moreland 203 71 11 3 - 20 11 9 10 339
Mornington - 16 0 - - 3 1 - 1 21
Nillumbik 5 31 1 0 40 6 4 9 97
Port Phillip 8 14 - 1 - 2 61 - 3 89
Stonnington - 13 - 0 - - 39 10 4 66
Whitehorse 18 102 23 2 22 77 35 36 315
Whittlesea 2 128 - 1 - 81 - 63 175 450
Wyndham 7 128 2 154 38 75 33 437
Yarra - 20 - - 10 1 59 19 0 109
Yarra Ranges 4 86 - - - 30 - 11 68 200
Total 669 2,474 1,149 56 11 939 1,707 806 1,196 9,006
* Note:
Only selected public housing estates have been included in the data and analysis.
METROPOLITAN OPEN SPACE NETWORK DISTRIBUTION - June 2017 11
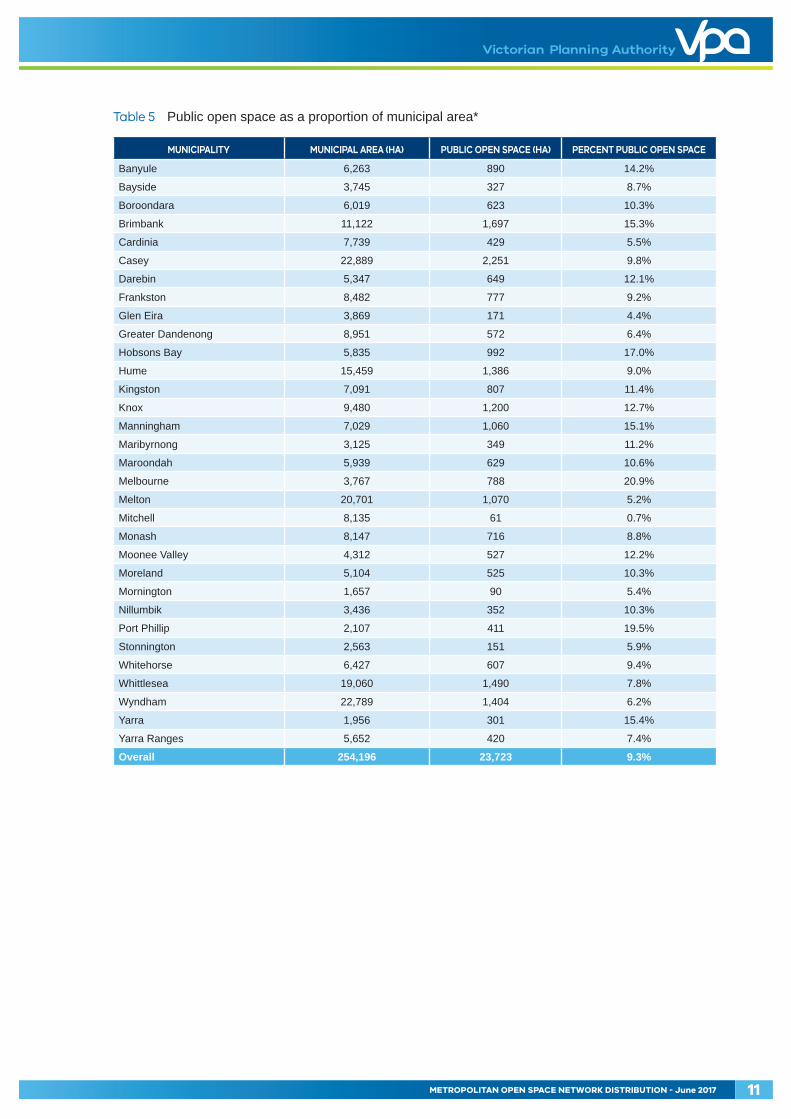
Table 5 Public open space as a proportion of municipal area*
MUNICIPALITY MUNICIPAL AREA (HA) PUBLIC OPEN SPACE (HA) PERCENT PUBLIC OPEN SPACE
Banyule 6,263 890 14.2%
Bayside 3,745 327 8.7%
Boroondara 6,019 623 10.3%
Brimbank 11,122 1,697 15.3%
Cardinia 7,739 429 5.5%
Casey 22,889 2,251 9.8%
Darebin 5,347 649 12.1%
Frankston 8,482 777 9.2%
Glen Eira 3,869 171 4.4%
Greater Dandenong 8,951 572 6.4%
Hobsons Bay 5,835 992 17.0%
Hume 15,459 1,386 9.0%
Kingston 7,091 807 11.4%
Knox 9,480 1,200 12.7%
Manningham 7,029 1,060 15.1%
Maribyrnong 3,125 349 11.2%
Maroondah 5,939 629 10.6%
Melbourne 3,767 788 20.9%
Melton 20,701 1,070 5.2%
Mitchell 8,135 61 0.7%
Monash 8,147 716 8.8%
Moonee Valley 4,312 527 12.2%
Moreland 5,104 525 10.3%
Mornington 1,657 90 5.4%
Nillumbik 3,436 352 10.3%
Port Phillip 2,107 411 19.5%
Stonnington 2,563 151 5.9%
Whitehorse 6,427 607 9.4%
Whittlesea 19,060 1,490 7.8%
Wyndham 22,789 1,404 6.2%
Yarra 1,956 301 15.4%
Yarra Ranges 5,652 420 7.4%
Overall 254,196 23,723 9.3%
METROPOLITAN OPEN SPACE NETWORK DISTRIBUTION - June 201712
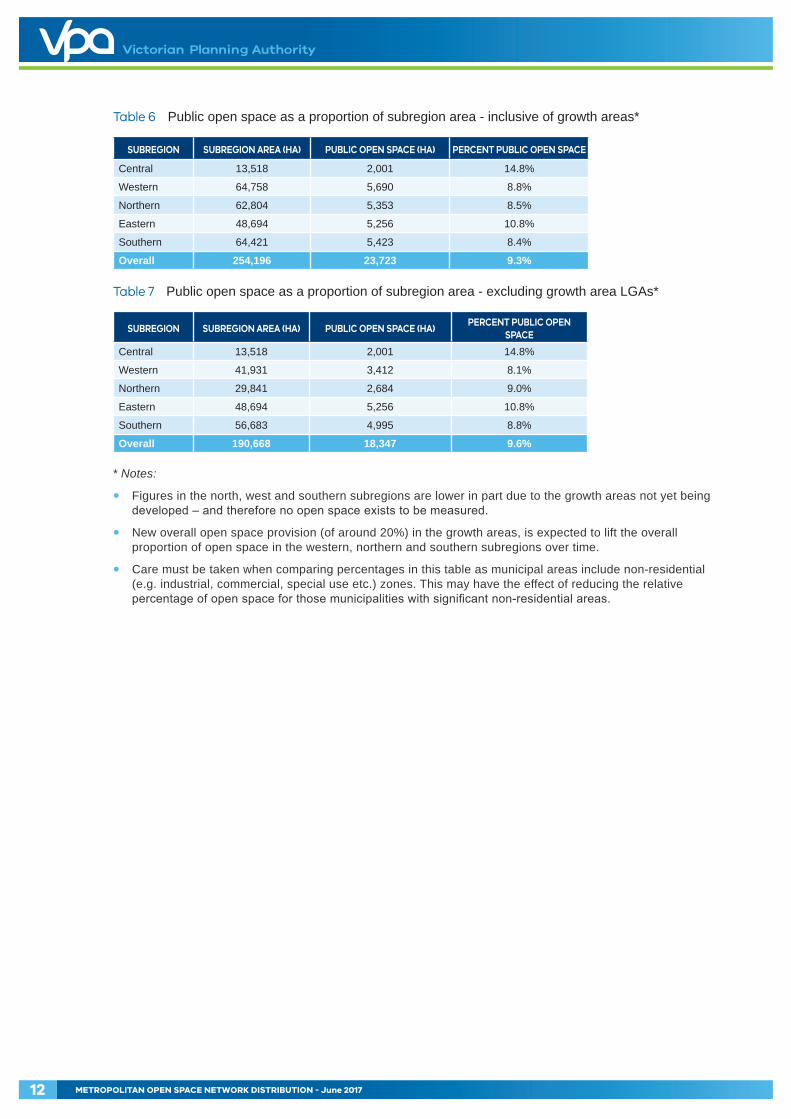
Table 6 Public open space as a proportion of subregion area - inclusive of growth areas*
SUBREGION SUBREGION AREA (HA) PUBLIC OPEN SPACE (HA) PERCENT PUBLIC OPEN SPACE
Central 13,518 2,001 14.8%
Western 64,758 5,690 8.8%
Northern 62,804 5,353 8.5%
Eastern 48,694 5,256 10.8%
Southern 64,421 5,423 8.4%
Overall 254,196 23,723 9.3%
Table 7 Public open space as a proportion of subregion area - excluding growth area LGAs*
SUBREGION SUBREGION AREA (HA) PUBLIC OPEN SPACE (HA)PERCENT PUBLIC OPEN
SPACE
Central 13,518 2,001 14.8%
Western 41,931 3,412 8.1%
Northern 29,841 2,684 9.0%
Eastern 48,694 5,256 10.8%
Southern 56,683 4,995 8.8%
Overall 190,668 18,347 9.6%
* Notes:
• Figures in the north, west and southern subregions are lower in part due to the growth areas not yet being developed – and therefore no open space exists to be measured.
• New overall open space provision (of around 20%) in the growth areas, is expected to lift the overall proportion of open space in the western, northern and southern subregions over time.
• Care must be taken when comparing percentages in this table as municipal areas include non-residential (e.g. industrial, commercial, special use etc.) zones. This may have the effect of reducing the relative percentage of open space for those municipalities with significant non-residential areas.
METROPOLITAN OPEN SPACE NETWORK DISTRIBUTION - June 2017 13
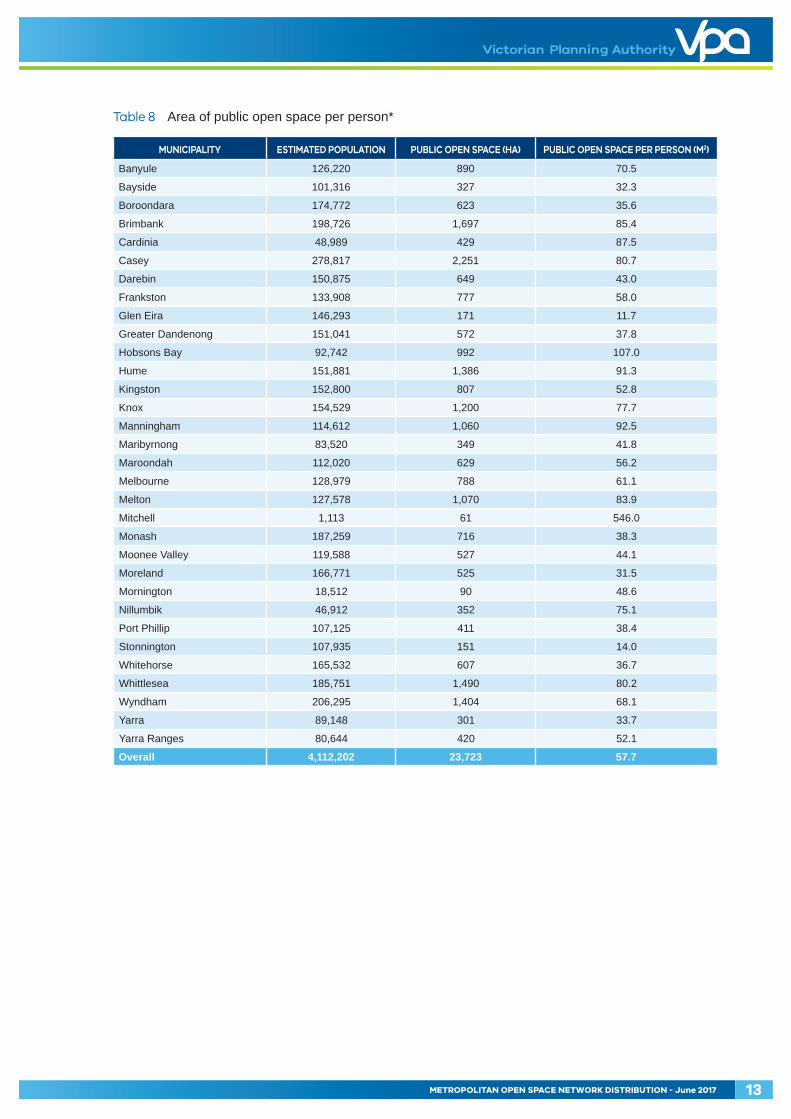
Table 8 Area of public open space per person*
MUNICIPALITY ESTIMATED POPULATION PUBLIC OPEN SPACE (HA) PUBLIC OPEN SPACE PER PERSON (M2)
Banyule 126,220 890 70.5
Bayside 101,316 327 32.3
Boroondara 174,772 623 35.6
Brimbank 198,726 1,697 85.4
Cardinia 48,989 429 87.5
Casey 278,817 2,251 80.7
Darebin 150,875 649 43.0
Frankston 133,908 777 58.0
Glen Eira 146,293 171 11.7
Greater Dandenong 151,041 572 37.8
Hobsons Bay 92,742 992 107.0
Hume 151,881 1,386 91.3
Kingston 152,800 807 52.8
Knox 154,529 1,200 77.7
Manningham 114,612 1,060 92.5
Maribyrnong 83,520 349 41.8
Maroondah 112,020 629 56.2
Melbourne 128,979 788 61.1
Melton 127,578 1,070 83.9
Mitchell 1,113 61 546.0
Monash 187,259 716 38.3
Moonee Valley 119,588 527 44.1
Moreland 166,771 525 31.5
Mornington 18,512 90 48.6
Nillumbik 46,912 352 75.1
Port Phillip 107,125 411 38.4
Stonnington 107,935 151 14.0
Whitehorse 165,532 607 36.7
Whittlesea 185,751 1,490 80.2
Wyndham 206,295 1,404 68.1
Yarra 89,148 301 33.7
Yarra Ranges 80,644 420 52.1
Overall 4,112,202 23,723 57.7

METROPOLITAN OPEN SPACE NETWORK DISTRIBUTION - June 201714
Table 9 Area of public open space per person - inclusive of growth areas*
SUBREGION ESTIMATED POPULATION PUBLIC OPEN SPACE (HA) PUBLIC OPEN SPACE PER PERSON (M2)
Central 516,708 2,001 38.7
Western 744,929 5,690 76.4
Northern 829,521 5,353 64.5
Eastern 989,368 5,256 53.1
Southern 1,031,676 5,423 52.6
Overall 4,112,202 23,723 57.7
Table 10 Area of public open space per person - excluding growth area LGAs*
SUBREGION ESTIMATED POPULATION PUBLIC OPEN SPACE (HA) PUBLIC OPEN SPACE PER PERSON (M2)
Central 516,708 2,001 38.7
Western 430,199 3,412 79.3
Northern 443,669 2,684 60.5
Eastern 989,368 5,256 53.1
Southern 982,687 4,995 50.8
Overall 3,362,630 18,347 54.6
* Note:
Population figures have been extrapolated from Regional Population Growth data for 2015 (ABS, 2015). Assumes mesh block population spread across each LGA is unchanged from 2011.

METROPOLITAN OPEN SPACE NETWORK DISTRIBUTION - June 2017 15
Table 11 Population within 400m walkable distance of public open space (POS) per municipality
MUNICIPALITY ESTIMATED POPULATIONESTIMATED POPULATION WITHIN 400M
OF POSPROPORTION OF POPULATION WITHIN 400M
OF POS
Banyule 126,220 102,899 81.5%
Bayside 101,316 69,299 68.4%
Boroondara 174,772 130,894 74.9%
Brimbank 198,726 167,203 84.1%
Cardinia 48,989 41,122 83.9%
Casey 278,817 236,677 84.9%
Darebin 150,875 115,905 76.8%
Frankston 133,908 110,812 82.8%
Glen Eira 146,293 85,666 58.6%
Greater Dandenong 151,041 116,537 77.2%
Hobsons Bay 92,742 77,138 83.2%
Hume 151,881 131,778 86.8%
Kingston 152,800 126,567 82.8%
Knox 154,529 125,616 81.3%
Manningham 114,612 96,459 84.2%
Maribyrnong 83,520 65,422 78.3%
Maroondah 112,020 88,438 78.9%
Melbourne 128,979 120,561 93.5%
Melton 127,578 111,958 87.8%
Mitchell 1,113 733 65.9%
Monash 187,259 146,280 78.1%
Moonee Valley 119,588 91,734 76.7%
Moreland 166,771 135,124 81.0%
Mornington 18,512 13,453 72.7%
Nillumbik 46,912 39,457 84.1%
Port Phillip 107,125 97,634 91.1%
Stonnington 107,935 78,224 72.5%
Whitehorse 165,532 136,300 82.3%
Whittlesea 185,751 153,571 82.7%
Wyndham 206,295 177,229 85.9%
Yarra 89,148 77,454 86.9%
Yarra Ranges 80,644 60,846 75.5%
Overall 4,112,202 3,328,989 81.0%
Notes:
• Results have been derived from assessment of those areas which fall within a 400 metre walkable catchment, or ‘ped-shed’, of public open space features, excluding areas classified as green buffers and local links, except where those areas adjoin other public open space. Walkable catchments have been created around accessible points along the boundaries of public open space, created by generating points at 30 metre intervals along those edges of open space which fall within 5 metres of the road casement. The catchments comprise areas falling within 400 metres (approximately five minutes’ walk) of public open space, travelling along the road network, using road centrelines as a proxy for pedestrian routes. The enhanced road network excludes freeways and includes many informal pedestrian links.
• Population within these areas has been extrapolated from Regional Population Growth data for 2015 (ABS, 2015). Assumes mesh block population spread across each LGA is unchanged from 2011.
• Care must be taken when comparing percentages in this table as municipal areas include non residential (e.g. industrial, commercial, special use etc.) zones. This may have the effect of reducing the relative percentage of open space for those municipalities with significant non residential areas.

METROPOLITAN OPEN SPACE NETWORK DISTRIBUTION - June 201716
Table 12 Summary of public open space ownership per municipality
MUNICIPALITY CROWN FEDERAL GOV LOCAL GOV PUBLIC AUTHORITY STATE GOV NO DATA TOTAL (HA)
Banyule 300.3 0.1 540.1 14.5 - 34.8 890
Bayside 184.4 - 140.8 1.6 - 0.1 327
Boroondara 204.1 - 385.5 18.6 2.6 11.8 623
Brimbank 677.8 - 823.0 121.1 9.1 65.5 1,697
Cardinia 54.3 - 326.0 45.0 0.4 2.9 429
Casey 486.2 - 1,141.7 606.0 1.6 15.8 2,251
Darebin 253.5 - 359.4 26.5 0.9 8.4 649
Frankston 310.5 - 396.9 56.6 5.8 7.3 777
Glen Eira 43.3 - 119.7 0.5 - 7.2 171
Greater Dandenong 95.0 - 322.6 134.0 - 20.0 572
Hobsons Bay 375.9 - 358.7 188.5 69.2 992
Hume 225.8 - 893.2 217.8 11.1 38.5 1,386
Kingston 183.8 - 300.1 297.4 2.0 23.6 807
Knox 464.9 - 563.2 138.2 - 34.2 1,200
Manningham 503.4 - 532.0 24.2 - 0.4 1,060
Maribyrnong 121.9 - 168.7 18.5 - 40.1 349
Maroondah 71.4 - 535.4 21.4 - 0.7 629
Melbourne 670.7 - 26.1 16.0 - 75.4 788
Melton 207.8 - 750.5 41.1 - 70.5 1,070
Mitchell 5.4 - 53.4 - - 1.9 61
Monash 257.9 - 416.5 41.4 0.2 0.5 716
Moonee Valley 156.9 1.6 310.6 21.1 7.6 29.3 527
Moreland 46.1 - 367.4 66.8 0.4 44.2 525
Mornington 18.9 - 62.1 3.7 - 5.3 90
Nillumbik 99.5 - 226.3 19.9 - 6.8 352
Port Phillip 373.6 - 8.5 13.6 10.6 5.1 411
Stonnington 18.7 - 111.2 6.2 0.3 15.0 151
Whitehorse 73.3 - 331.9 38.7 2.7 160.3 607
Whittlesea 453.8 - 859.6 169.6 - 7.3 1,490
Wyndham 242.4 - 916.4 105.4 10.5 129.6 1,404
Yarra 242.2 - 25.2 2.4 0.2 30.7 301
Yarra Ranges 49.0 - 346.0 17.5 - 7.8 420
Total 7,473 2 12,719 2,494 66 970 23,723
METROPOLITAN OPEN SPACE NETWORK DISTRIBUTION - June 2017 17
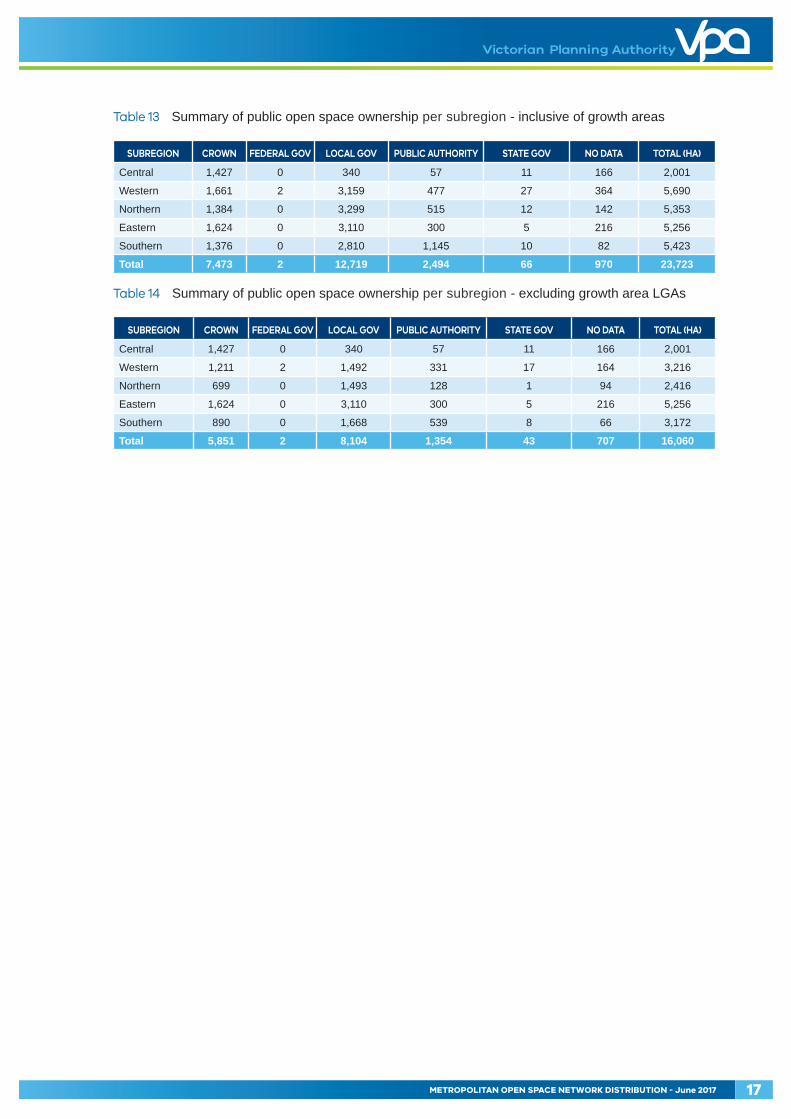
Table 13 Summary of public open space ownership per subregion - inclusive of growth areas
SUBREGION CROWN FEDERAL GOV LOCAL GOV PUBLIC AUTHORITY STATE GOV NO DATA TOTAL (HA)
Central 1,427 0 340 57 11 166 2,001
Western 1,661 2 3,159 477 27 364 5,690
Northern 1,384 0 3,299 515 12 142 5,353
Eastern 1,624 0 3,110 300 5 216 5,256
Southern 1,376 0 2,810 1,145 10 82 5,423
Total 7,473 2 12,719 2,494 66 970 23,723
Table 14 Summary of public open space ownership per subregion - excluding growth area LGAs
SUBREGION CROWN FEDERAL GOV LOCAL GOV PUBLIC AUTHORITY STATE GOV NO DATA TOTAL (HA)
Central 1,427 0 340 57 11 166 2,001
Western 1,211 2 1,492 331 17 164 3,216
Northern 699 0 1,493 128 1 94 2,416
Eastern 1,624 0 3,110 300 5 216 5,256
Southern 890 0 1,668 539 8 66 3,172
Total 5,851 2 8,104 1,354 43 707 16,060

METROPOLITAN OPEN SPACE NETWORK DISTRIBUTION - June 201718
Table 15 Summary of public open space ownership by percentage of ownership type per municipality
MUNICIPALITY CROWN FEDERAL GOV LOCAL GOV PUBLIC AUTHORITY STATE GOV NO DATA TOTAL (HA)
Banyule 33.75% 0.01% 60.70% 1.62% - 3.92% 100.00%
Bayside 56.41% - 43.06% 0.50% - 0.03% 100.00%
Boroondara 32.79% - 61.92% 2.99% 0.41% 1.89% 100.00%
Brimbank 39.95% - 48.51% 7.14% 0.54% 3.86% 100.00%
Cardinia 12.67% - 76.05% 10.51% 0.10% 0.67% 100.00%
Casey 21.59% - 50.72% 26.92% 0.07% 0.70% 100.00%
Darebin 39.08% - 55.40% 4.08% 0.13% 1.30% 100.00%
Frankston 39.95% - 51.07% 7.28% 0.75% 0.95% 100.00%
Glen Eira 25.39% - 70.10% 0.31% - 4.20% 100.00%
Greater Dandenong 16.61% - 56.45% 23.44% - 3.50% 100.00%
Hobsons Bay 37.88% - 36.15% 19.00% - 6.98% 100.00%
Hume 16.29% - 64.42% 15.71% 0.80% 2.78% 100.00%
Kingston 22.78% - 37.19% 36.85% 0.25% 2.93% 100.00%
Knox 38.73% - 46.91% 11.51% - 2.85% 100.00%
Manningham 47.50% - 50.19% 2.28% - 0.03% 100.00%
Maribyrnong 34.91% - 48.29% 5.31% - 11.49% 100.00%
Maroondah 11.35% - 85.12% 3.40% - 0.12% 100.00%
Melbourne 85.09% - 3.31% 2.03% - 9.57% 100.00%
Melton 19.43% - 70.14% 3.84% - 6.59% 100.00%
Mitchell 8.85% - 87.97% - - 3.18% 100.00%
Monash 35.99% - 58.13% 5.78% 0.03% 0.06% 100.00%
Moonee Valley 29.77% 0.30% 58.91% 4.01% 1.45% 5.56% 100.00%
Moreland 8.78% - 70.00% 12.73% 0.07% 8.42% 100.00%
Mornington 20.99% - 69.00% 4.15% - 5.86% 100.00%
Nillumbik 28.23% - 64.22% 5.63% - 1.92% 100.00%
Port Phillip 90.81% - 2.06% 3.30% 2.58% 1.25% 100.00%
Stonnington 12.34% - 73.45% 4.08% 0.23% 9.91% 100.00%
Whitehorse 12.07% - 54.69% 6.38% 0.44% 26.42% 100.00%
Whittlesea 30.45% - 57.68% 11.38% - 0.49% 100.00%
Wyndham 17.26% - 65.26% 7.50% 0.75% 9.23% 100.00%
Yarra 80.55% - 8.39% 0.79% 0.07% 10.20% 100.00%
Yarra Ranges 11.65% - 82.31% 4.17% - 1.87% 100.00%
Overall 31.50% 0.01% 53.61% 10.51% 0.28% 4.09% 100.00%

METROPOLITAN OPEN SPACE NETWORK DISTRIBUTION - June 2017 19
Table 16 Public open space ownership by percentage of ownership type per subregion - inclusive of growth areas
SUBREGION CROWN FEDERAL GOV LOCAL GOV PUBLIC AUTHORITY STATE GOV NO DATA TOTAL (HA)
Central 71.32% 0.00% 16.98% 2.83% 0.56% 8.32% 100.00%
Western 29.19% 0.03% 55.52% 8.39% 0.48% 6.40% 100.00%
Northern 25.86% 0.00% 61.63% 9.62% 0.23% 2.65% 100.00%
Eastern 30.90% 0.00% 59.18% 5.71% 0.10% 4.10% 100.00%
Southern 25.38% 0.00% 51.81% 21.11% 0.18% 1.51% 100.00%
Total 31.50% 0.01% 53.61% 10.51% 0.28% 4.09% 100.00%
Table 17 Public open space ownership by percentage of ownership type per subregion - excluding growth area LGAs
SUBREGION CROWN FEDERAL GOV LOCAL GOV PUBLIC AUTHORITY STATE GOV NO DATA TOTAL (HA)
Central 71.32% 0.00% 16.98% 2.83% 0.56% 8.32% 100.00%
Western 37.64% 0.05% 46.40% 10.28% 0.52% 5.10% 100.00%
Northern 28.95% 0.00% 61.81% 5.28% 0.05% 3.90% 100.00%
Eastern 30.90% 0.00% 59.18% 5.71% 0.10% 4.10% 100.00%
Southern 28.07% 0.00% 52.59% 16.99% 0.26% 2.09% 100.00%
Total 36.43% 0.01% 50.46% 8.43% 0.27% 4.40% 100.00%
METROPOLITAN OPEN SPACE NETWORK DISTRIBUTION - June 201720
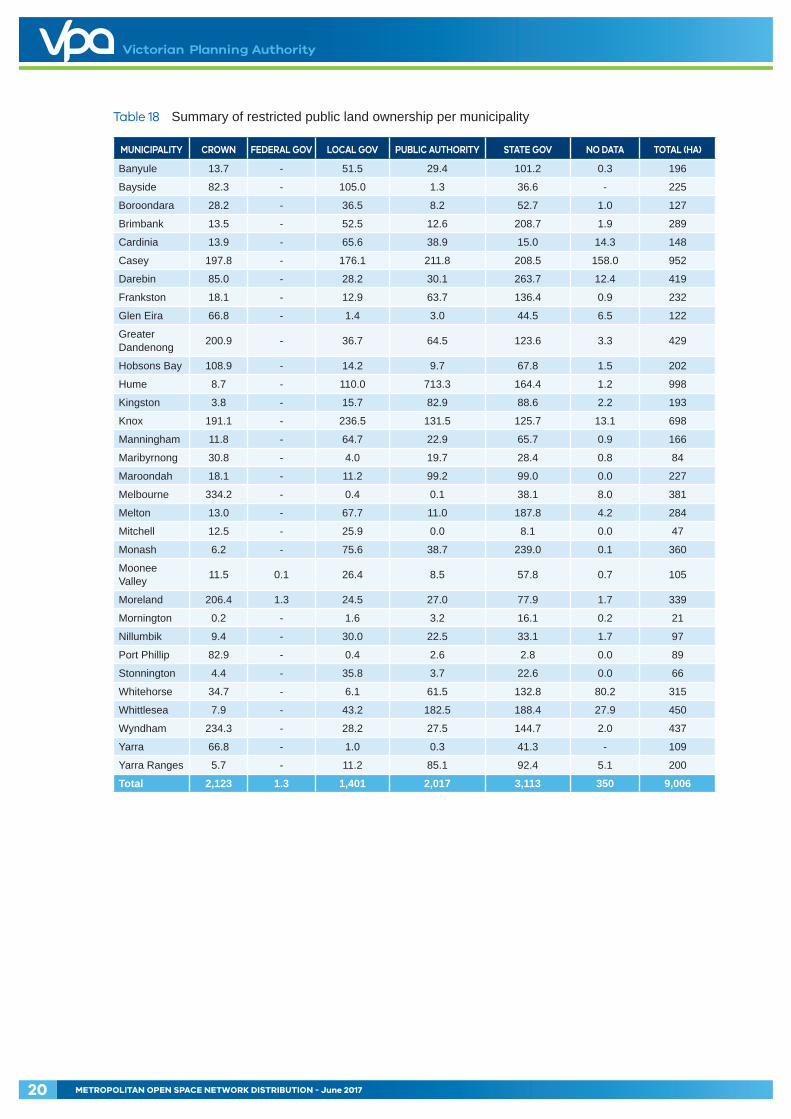
Table 18 Summary of restricted public land ownership per municipality
MUNICIPALITY CROWN FEDERAL GOV LOCAL GOV PUBLIC AUTHORITY STATE GOV NO DATA TOTAL (HA)
Banyule 13.7 - 51.5 29.4 101.2 0.3 196
Bayside 82.3 - 105.0 1.3 36.6 - 225
Boroondara 28.2 - 36.5 8.2 52.7 1.0 127
Brimbank 13.5 - 52.5 12.6 208.7 1.9 289
Cardinia 13.9 - 65.6 38.9 15.0 14.3 148
Casey 197.8 - 176.1 211.8 208.5 158.0 952
Darebin 85.0 - 28.2 30.1 263.7 12.4 419
Frankston 18.1 - 12.9 63.7 136.4 0.9 232
Glen Eira 66.8 - 1.4 3.0 44.5 6.5 122
Greater Dandenong 200.9 - 36.7 64.5 123.6 3.3 429
Hobsons Bay 108.9 - 14.2 9.7 67.8 1.5 202
Hume 8.7 - 110.0 713.3 164.4 1.2 998
Kingston 3.8 - 15.7 82.9 88.6 2.2 193
Knox 191.1 - 236.5 131.5 125.7 13.1 698
Manningham 11.8 - 64.7 22.9 65.7 0.9 166
Maribyrnong 30.8 - 4.0 19.7 28.4 0.8 84
Maroondah 18.1 - 11.2 99.2 99.0 0.0 227
Melbourne 334.2 - 0.4 0.1 38.1 8.0 381
Melton 13.0 - 67.7 11.0 187.8 4.2 284
Mitchell 12.5 - 25.9 0.0 8.1 0.0 47
Monash 6.2 - 75.6 38.7 239.0 0.1 360
Moonee Valley 11.5 0.1 26.4 8.5 57.8 0.7 105
Moreland 206.4 1.3 24.5 27.0 77.9 1.7 339
Mornington 0.2 - 1.6 3.2 16.1 0.2 21
Nillumbik 9.4 - 30.0 22.5 33.1 1.7 97
Port Phillip 82.9 - 0.4 2.6 2.8 0.0 89
Stonnington 4.4 - 35.8 3.7 22.6 0.0 66
Whitehorse 34.7 - 6.1 61.5 132.8 80.2 315
Whittlesea 7.9 - 43.2 182.5 188.4 27.9 450
Wyndham 234.3 - 28.2 27.5 144.7 2.0 437
Yarra 66.8 - 1.0 0.3 41.3 - 109
Yarra Ranges 5.7 - 11.2 85.1 92.4 5.1 200
Total 2,123 1.3 1,401 2,017 3,113 350 9,006
METROPOLITAN OPEN SPACE NETWORK DISTRIBUTION - June 2017 21
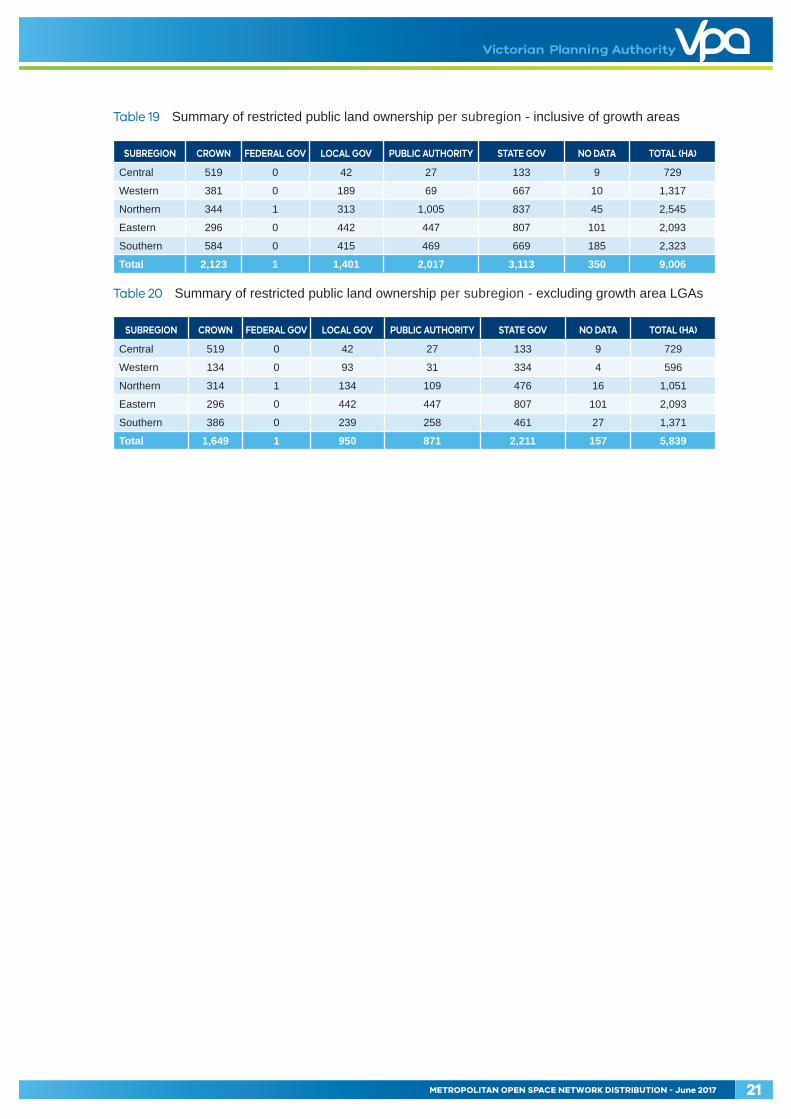
Table 19 Summary of restricted public land ownership per subregion - inclusive of growth areas
SUBREGION CROWN FEDERAL GOV LOCAL GOV PUBLIC AUTHORITY STATE GOV NO DATA TOTAL (HA)
Central 519 0 42 27 133 9 729
Western 381 0 189 69 667 10 1,317
Northern 344 1 313 1,005 837 45 2,545
Eastern 296 0 442 447 807 101 2,093
Southern 584 0 415 469 669 185 2,323
Total 2,123 1 1,401 2,017 3,113 350 9,006
Table 20 Summary of restricted public land ownership per subregion - excluding growth area LGAs
SUBREGION CROWN FEDERAL GOV LOCAL GOV PUBLIC AUTHORITY STATE GOV NO DATA TOTAL (HA)
Central 519 0 42 27 133 9 729
Western 134 0 93 31 334 4 596
Northern 314 1 134 109 476 16 1,051
Eastern 296 0 442 447 807 101 2,093
Southern 386 0 239 258 461 27 1,371
Total 1,649 1 950 871 2,211 157 5,839
METROPOLITAN OPEN SPACE NETWORK DISTRIBUTION - June 201722
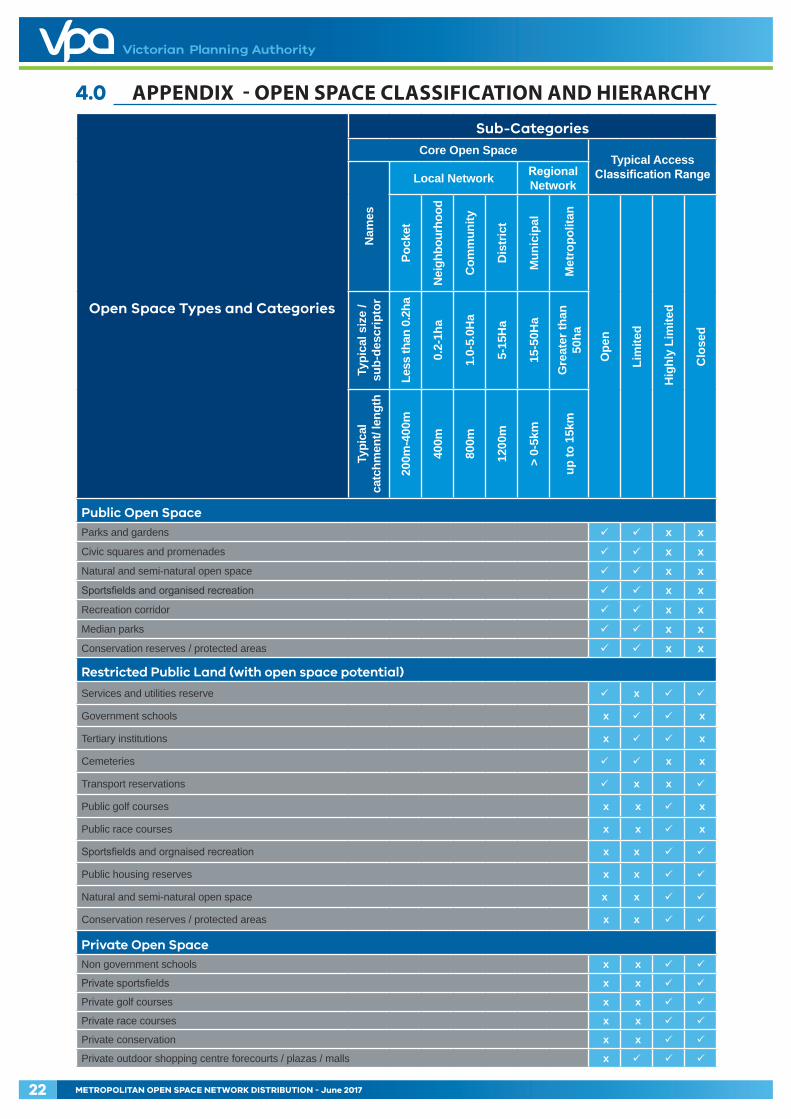
4.0 APPENDIX - OPEN SPACE CLASSIFICATION AND HIERARCHY
Open Space Types and Categories
Sub-CategoriesCore Open Space
Typical Access Classification Range
Nam
es
Local Network Regional Network
Pock
et
Nei
ghbo
urho
od
Com
mun
ity
Dis
tric
t
Mun
icip
al
Met
ropo
litan
Ope
n
Lim
ited
Hig
hly
Lim
ited
Clo
sed
Typi
cal s
ize
/ su
b-de
scrip
tor
Less
than
0.2
ha
0.2-
1ha
1.0-
5.0H
a
5-15
Ha
15-5
0Ha
Gre
ater
than
50
ha
Typi
cal
catc
hmen
t/ le
ngth
200m
-400
m
400m
800m
1200
m
> 0-
5km
up to
15k
m
Public Open SpaceParks and gardens x xCivic squares and promenades x xNatural and semi-natural open space x xSportsfields and organised recreation x xRecreation corridor x xMedian parks x xConservation reserves / protected areas x x
Restricted Public Land (with open space potential)
Services and utilities reserve x
Government schools x x
Tertiary institutions x x
Cemeteries x x
Transport reservations x x
Public golf courses x x x
Public race courses x x x
Sportsfields and orgnaised recreation x x
Public housing reserves x x
Natural and semi-natural open space x x
Conservation reserves / protected areas x x
Private Open SpaceNon government schools x x
Private sportsfields x x
Private golf courses x x
Private race courses x x
Private conservation x x
Private outdoor shopping centre forecourts / plazas / malls x
METROPOLITAN OPEN SPACE NETWORK DISTRIBUTION - June 2017 23
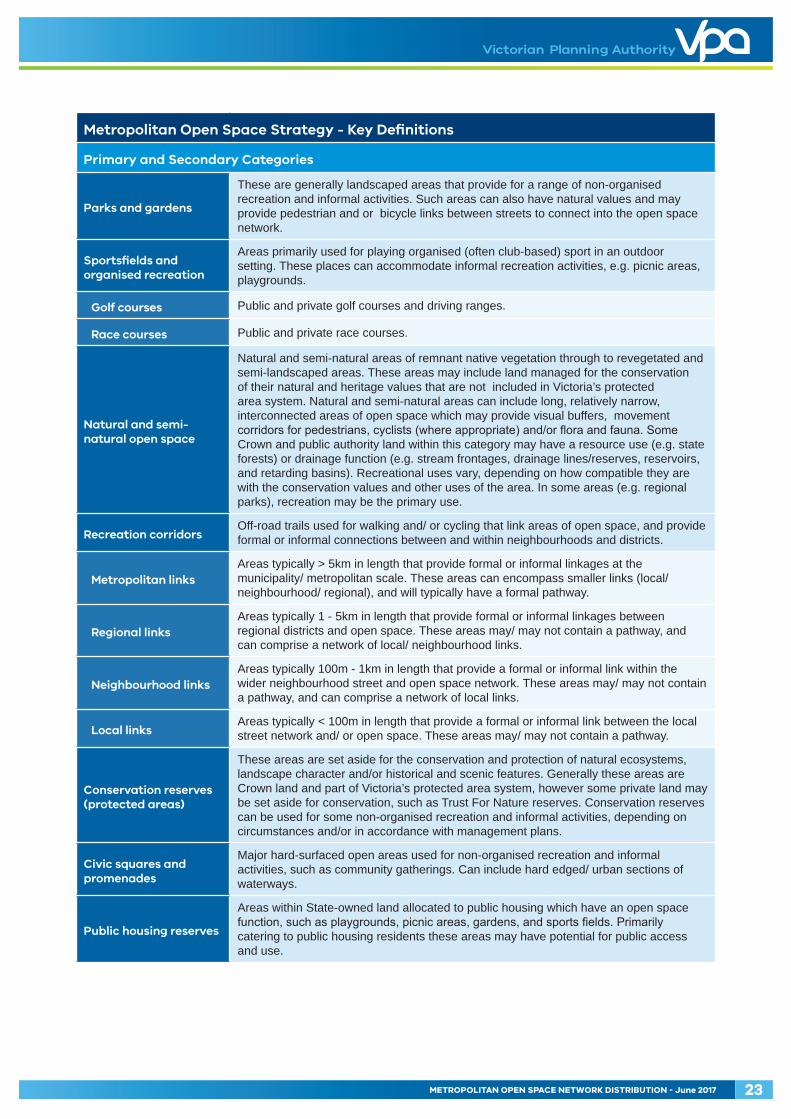
Metropolitan Open Space Strategy - Key Definitions
Primary and Secondary Categories
Parks and gardens
These are generally landscaped areas that provide for a range of non-organised recreation and informal activities. Such areas can also have natural values and may provide pedestrian and or bicycle links between streets to connect into the open space network.
Sportsfields and organised recreation
Areas primarily used for playing organised (often club-based) sport in an outdoor setting. These places can accommodate informal recreation activities, e.g. picnic areas, playgrounds.
Golf courses Public and private golf courses and driving ranges.
Race courses Public and private race courses.
Natural and semi-natural open space
Natural and semi-natural areas of remnant native vegetation through to revegetated and semi-landscaped areas. These areas may include land managed for the conservation of their natural and heritage values that are not included in Victoria’s protected area system. Natural and semi-natural areas can include long, relatively narrow, interconnected areas of open space which may provide visual buffers, movement corridors for pedestrians, cyclists (where appropriate) and/or flora and fauna. Some Crown and public authority land within this category may have a resource use (e.g. state forests) or drainage function (e.g. stream frontages, drainage lines/reserves, reservoirs, and retarding basins). Recreational uses vary, depending on how compatible they are with the conservation values and other uses of the area. In some areas (e.g. regional parks), recreation may be the primary use.
Recreation corridorsOff-road trails used for walking and/ or cycling that link areas of open space, and provide formal or informal connections between and within neighbourhoods and districts.
Metropolitan linksAreas typically > 5km in length that provide formal or informal linkages at the municipality/ metropolitan scale. These areas can encompass smaller links (local/ neighbourhood/ regional), and will typically have a formal pathway.
Regional linksAreas typically 1 - 5km in length that provide formal or informal linkages between regional districts and open space. These areas may/ may not contain a pathway, and can comprise a network of local/ neighbourhood links.
Neighbourhood linksAreas typically 100m - 1km in length that provide a formal or informal link within the wider neighbourhood street and open space network. These areas may/ may not contain a pathway, and can comprise a network of local links.
Local linksAreas typically < 100m in length that provide a formal or informal link between the local street network and/ or open space. These areas may/ may not contain a pathway.
Conservation reserves (protected areas)
These areas are set aside for the conservation and protection of natural ecosystems, landscape character and/or historical and scenic features. Generally these areas are Crown land and part of Victoria’s protected area system, however some private land may be set aside for conservation, such as Trust For Nature reserves. Conservation reserves can be used for some non-organised recreation and informal activities, depending on circumstances and/or in accordance with management plans.
Civic squares and promenades
Major hard-surfaced open areas used for non-organised recreation and informal activities, such as community gatherings. Can include hard edged/ urban sections of waterways.
Public housing reserves
Areas within State-owned land allocated to public housing which have an open space function, such as playgrounds, picnic areas, gardens, and sports fields. Primarily catering to public housing residents these areas may have potential for public access and use.

METROPOLITAN OPEN SPACE NETWORK DISTRIBUTION - June 201724
Metropolitan Open Space Strategy - Key Definitions
Primary and Secondary Categories
Transport reservations
Areas of informal open space within or adjacent to an existing or future transport reservation. Such spaces can be of a temporary nature and subject to transformation in response to evolving transport priorities. In some cases their use as open space may be complementary to the primary and long term transport purpose (e.g. a linear path or shared trail).
Green buffersAreas within or adjacent to the road reserve/ casement that provide (or potentially provide) a visual and/ or noise screen. This can also include nature strips, road reserves and tree reserves, and areas which may contain a formal or informal path.
Median parks
Linear open space on or between road reserves that has been identified as being functionally important to the open space network. These areas may or may not have a formal or informal pathway and are typically located in-between lower speed and lower volume road carriageways (e.g. areas such as Drummond Street, Carlton).
Services and utilities reserves
Areas used primarily for service delivery purposes, often containing a reticulated utility. They may also have a secondary recreational use or amenity values.
Tertiary institutionsUniversities and TAFE campuses. Access for public recreation will vary from campus to campus and is dependent on local access and management practices.
Government schoolsState-owned primary and secondary schools and colleges. Access for recreation varies from campus to campus and is often dependent on negotiations between the individual school and the local council.
Non-government schools
Privately owned primary and secondary schools and colleges. Access for recreation varies from campus to campus and is dependent on negotiations between the individual school and the local council.
Cemeteries
Land reserved primarily for burial and / or memorialisation. These sites are often fenced and or screened and have clearly defined opening hours. Generally cemeteries will have strict rules regarding acceptable activities and there are strong controls on their design and layout.
Access Levels
Open access Freely accessible by the public all of the time.
Limited accessAccess is free of charge but may be managed in some way, such as designated opening days / hours.
Highly limited access Access is more significantly restricted by fees and charges and/ or barrier fencing
Closed access Access is not possible by the public most of the time.

Metropolitan Open Space Network Distribution - June 2017