mettalurgical report - csb
TRANSCRIPT

Anamet, inc M a t e r i a l s E n g i n e e r i n g & L a b o r a t o r y T e s t i n g
26102 EDEN LANDING ROAD, SUITE 3 HAYWARD, CALIFORNIA 94545 (510) 887-8811 FAX (510) 887-8427
This report shall not be reproduced, except in full, without the written approval of Anamet.
FINAL REPORT
METALLURGICAL EVALUATION OF SAMPLES FROM THE CHEVRON U.S.A. INC., RICHMOND #4 CRUDE UNIT
8-INCH AND 12-INCH 4-SIDECUT PIPING INVOLVED IN THE AUGUST 6, 2012, HYDROCARBON RELEASE AND FIRE
Prepared for: The Chemical Safety and Hazard Investigation Board (CSB)
Report No. 5004.7920 B
February 11, 2013

This page intentionally left blank

Anamet, inc M a t e r i a l s E n g i n e e r i n g & L a b o r a t o r y T e s t i n g
26102 EDEN LANDING ROAD, SUITE 3 HAYWARD, CALIFORNIA 94545 (510) 887-8811 FAX (510) 887-8427
Report No. 5004.7920 B February 11, 2013
FINAL REPORT
METALLURGICAL EVALUATION OF SAMPLES FROM THE CHEVRON U.S.A. INC., RICHMOND #4 CRUDE UNIT
8-INCH AND 12-INCH 4-SIDECUT PIPING INVOLVED IN THE AUGUST 6, 2012, HYDROCARBON RELEASE AND FIRE
Customer Authorization: Contract CSB-12-C-002
Report To:
Chemical Safety and Hazard Investigation Board Attn: Roger Evans 2175 K Street, NW, Suite 400 Washington, DC 20037
1.0 INTRODUCTION On August 6, 2012, a hydrocarbon release and resulting fire occurred at the Chevron U.S.A. Inc. (CUSA) Richmond Refinery in Richmond, California. The incident was attributed to rupture of the #4 Crude Unit distillation column (C-1100) 8-inch diameter 4-sidecut. The fire burned for approximately 5 hours, and water was applied to the rupture site for 23 days. It was reported that the 8-inch 4-sidecut was made of Schedule 40 carbon steel installed in the 1970’s, the temperature at the outlet of C-1100 was 640°F and the pressure was 58-psig, measured at the downstream pump (P-1149). The rupture was located in a straight run of pipe between an upstream 90° elbow and a downstream 30° elbow at the general location of E-017 indicated on the isometric drawing shown in Appendix A. Post incident on-site visual examination by CUSA, Cal/OSHA, and the CSB revealed extensive thinning of the pipe wall at the location of the rupture. The total length of the 8-inch 4-sidecut was reported to be 215-feet. Eight samples of this line, including the ruptured section, were submitted by CUSA under the direction of Cal/OSHA and the Chemical Safety and Hazard Investigation Board (CSB) for metallurgical investigation. Five pipe samples were submitted from the 12-inch 4-sidecut that was in service during the incident, along with samples from sections of the 12-inch 4-sidecut that were replaced in 2011, referred to here as the 2011 12-inch samples. It was reported that the 12-inch 4-sidecut was Schedule 40 carbon steel and samples were cut from the locations indicated in Appendix B. Locations in the 12-inch 4-sidecut from which the 2011 12-inch samples were sectioned were not provided. In addition, a fragment of the ruptured pipe and two fire pike tools collected from the post incident scene were submitted by CUSA. Sample identification numbers for the 8-inch 4-sidecut, 12-inch 4-sidecut, pipe fragment, and fire pikes were assigned by Baker Engineering and Risk Consultants, Inc. (BakerRisk), retained by CUSA with the consent of investigating government agencies to document the evidence collection process and act as an independent evidence custodian. Identification of the 2011 12-inch samples follows letter designations that were written on the samples. Submitted samples are listed in Table 1.
A n a m e t , i n c HAYWARD, CALIFORNIA Report No. 5004.7920 B Page 2
The material of construction and service conditions of the 4-sidecut piping indicated sulfidation corrosion, also called sulfidic corrosion, was the most likely cause of the thinning that led to rupture. The objectives of this evaluation were to: determine if observed thinning of the ruptured 8-inch 4-sidecut was caused by sulfidation corrosion, or if the thinning was the result of erosion or other failure mechanisms, and compare the condition and metallurgy of the 8-inch 4-sidecut, 12-inch 4-sidecut, and 2011 12-inch samples to the ruptured section. The samples were evaluated by the following laboratory procedures:
1) Visual and macroscopic examination 2) Chemical analysis 3) Hardness and tensile testing 4) Metallography 5) Scanning electron microscopy and energy dispersive X-ray spectroscopy 6) X-ray diffraction
Based on the results of this evaluation, sulfidation corrosion caused wall thinning that led to rupture of the 8-inch 4-sidecut. Iron sulfide scale, the product of sulfidation corrosion of carbon steel, was identified on the inside surfaces of all the samples by metallography, energy dispersive X-ray spectroscopy (EDS), and X-ray diffraction (XRD). Chemical analysis indicated the ruptured segment of carbon steel pipe had a silicon concentration of 0.01-wt%. Wall thinning of the 8-inch 4-sidecut piping examined was generally more extensive in samples with silicon concentrations below 0.10-wt% compared to samples with silicon concentrations greater than 0.10-wt%. Tensile testing and hardness testing indicated specimens from the 8-inch and 12-inch 4-sidecut met the tensile and yield strength requirements of ASTM A 106 Grade B and A 53 Grade B. This report supersedes Anamet, Inc. Report No. 5004-7920 A. 2.0 EVALUATION1 2.1 Visual Examination 2.1.1 Ruptured Section The ruptured section of the 8-inch 4-sidecut is shown as-received in Figure 1. This sample, E-017, consisted of an upstream elbow and the ruptured pipe. The downstream end of the ruptured pipe was sectioned about 8-inches from a circumferential weld that joined the pipe to a 30° elbow. In service, the welded pipe guides were vertical and the ruptured pipe was inclined about 30° from horizontal. The sample is shown in Figure 2 after being rotated 90° to provide better access to the rupture. A combination of flaky, rust colored and dark adherent scale was present on the outside surface of the sample, consistent with exposure of carbon steel pipe to heat and water from the fire and fire suppression efforts. Dark gray to black scale was present on the inside surfaces. Within the elbow, the dark colored scale was generally thicker and more friable
1 The magnifications of the optical and scanning electron micrographs in this report are approximate and should not be used as a basis for dimensional analyses unless otherwise indicated.

A n a m e t , i n c HAYWARD, CALIFORNIA Report No. 5004.7920 B Page 3
than within the pipe. Near the edges of the rupture, the inside scale was thinner and absent in many places, likely a result of exposure to heat from the fire. Specimens of scale were scraped from the inside surface of the upstream elbow and from the inside surface opposite the rupture for chemical and crystal structure analysis. The rupture is shown from different perspectives in Figure 3 and Figure 4. A three dimensional model of the rupture was recorded by an outside contractor, 3D Scan Services, LLC, under agreement with the CSB, and a view of the model is shown in Appendix C. No evidence of localized thinning or rupture initiation related to the welded pipe guides was detected. In one case, the rupture intersected the toe of one of the guide welds, as shown in Figure 5. All other pipe guide welds ended 3 to 4-inches from the rupture edge. A small degree of pipe buckling near one side of the upstream welded guide was visible, as shown in Figure 6. Two flaps of pipe wall had been forced outward from the opening. Visual examination indicated the flaps were not of sufficient size to account for the entire rupture area. Therefore, some of the pipe wall had completely separated from the sample. The flaps were labeled E-017-1 and E-017-2 in the laboratory and sectioned from the larger sample along the dashed lines shown in Figure 4 using an abrasive wheel. Clean tap water was applied from a clean handheld spray bottle during cutting to prevent excessive heating. Flaps E-017-1 and E-017-2 are shown after sectioning in Figure 7 through Figure 10. Following examination in the as-sectioned condition, the bends and curvature of the flaps were straightened by hand so their shape and area could be recorded. Thickness measurements were taken within 0.100-inch of the edges of the specimens at the locations indicated in Figure 8 and Figure 10 using a pointed anvil micrometer. The maximum thickness measured was 0.070-inch and the minimum thickness measured was 0.012-inch. It was reported that the 4-sidecut piping had been made from Schedule 40 pipe, which means that the original thickness of the 8-inch (NPS 8) line had been 0.322-inches. The thickness measurements indicate that extensive wall loss had occurred. In Figure 8, small perforations inside of the specimen edges were visible, which suggest that through-wall leaks were likely present prior to rupture. Sample E-014 was recovered from the ground beneath the rupture after the incident. As shown in Figure 11, E-014 was folded over and covered with rust, but the general thickness was similar to that of the ruptured area, and the sample was attracted to a magnet, which indicated that it could be carbon steel. The sample was straightened out and thickness measurements were taken along the edges at the locations indicated in Figure 12 in the same manner as for E-017-1 and E-017-2, before cleaning. The maximum thickness measured was 0.056-inch and the minimum thickness measured was 0.023-inch. The shape of the sectioned flaps and the shape of the entire rupture were traced onto paper, taking care to contact the edges with the pencil as little as possible. The locations of the flaps E-017-1 and E-017-2 within the rupture area were determined by where they had been connected to the pipe. The flattened sample E-014 was compared to the rupture area and the flattened flaps, and a close fit was found between one edge of E-017-2 and portions of the rupture area not accounted for by the flaps. The geometric relationship between the total rupture area, E-017-1, E-017-2, and E-014 are shown in Figure 13. Based on the observed fit, and consistent with the thickness of the surrounding flaps, E-014 was part of the ruptured pipe wall.

A n a m e t , i n c HAYWARD, CALIFORNIA Report No. 5004.7920 B Page 4
The total rupture area was determined from the tracing to be between 94 and 106-square inches. The smaller number was obtained directly from the tracing and the larger number was determined from the tracing adjusted slightly so that E-017-1, E-017-2, and E-014 did not overlap the traced lines in the longitudinal direction. Some of the overlap can be accounted for by a slight buckle in the pipe, indicated in Figure 6. Two areas of the ruptured pipe wall that were not accounted for, one between E-017-1 and E-014, and one at the downstream end of E-017-2, measured 8.8 and 2.4-square inches, respectively, indicated in Figure 13b. Edges of E-017-1, E-017-2, and E-014 were examined using an optical stereomicroscope. The edges were covered with rust and dark colored scale, consistent with having been exposed to the fire and water from the fire suppression efforts. Two general edge morphologies were present. In the thinnest areas, the edges tapered to a rounded edge. In the thicker areas, the edges were relatively flat with steps and facets. Representative macrographs are shown in Figure 14 through Figure 16. As described in Section 2.5, corrosion of the rupture edges destroyed evidence of the fracture origin. However, rupture likely originated in the thinnest region and initially followed a longitudinal path driven by the hoop stress. Therefore, the location of the initial leak and rupture origin was likely within the circled area in Figure 13b. A region of ruptured edge deformation toward the inside surface of the pipe on specimen E-017-1 is shown in Figure 17. The deformation, located at the 6 o-clock position or bottom side of the pipe, was consistent with mechanical force applied to the outside surface of the pipe. The CSB requested that the morphology of the deformation be compared to the shape of two tools, referred to here as fire pikes, recovered from the post incident scene. Photographs of the fire pike samples E-099 and E-082-2 are shown in Figure 18 through Figure 21. Both pike tips had essentially the same geometry. The deformed region of specimen E-017-1 was compared to the tip of both fire pikes and a good physical fit between the pike tips and the inward deformation of the specimen was found, as shown in Figure 22. The orientation of the fire pike, with respect to the ruptured section, that would have been required to produce the observed fit between the tip and the inward deformation of the rupture edge is shown in Figure 23. 2.1.2 Pipe Samples Segments of the 8-inch 4-sidecut sampled from various locations in the line under the combined direction of Cal/OSHA, CUSA, and the CSB are shown in Figure 24 through Figure 27a. Sample E-023A consisted of an 8-inch section of the ruptured pipe, a 30° elbow, and a 15-inch section of pipe downstream from the elbow. Sample E-023C consisted of a 15-inch section of pipe, 90° elbow, and 3-inch section of downstream pipe. With the exception of sample E-017, described in Section 2.1.1, all other 8-inch pipe samples consisted of short lengths of pipe without welds. Various combinations of flaky rust and dark colored adherent scale were present on the outside surface of the 8-inch samples. Sample E-023B had the most flaky, rust colored scale, and sample E-034B had the most dark colored, adherent scale. Dark gray to black scale was present on the inside surfaces of all the samples. The inside scale was friable at the surface, and adherent under the surface, where it had a shiny metallic appearance when scraped with a metal spatula. All of these characteristics are consistent with sulfidation corrosion product.

A n a m e t , i n c HAYWARD, CALIFORNIA Report No. 5004.7920 B Page 5
A thick, black, easily disturbed deposit was present on top of the scale in sample E-034B. The appearance and consistency suggested the deposit was soot. X-ray diffraction, described in Section 2.6, identified amorphous carbon in the scale specimen taken from the inside surface of this sample. Rust was present on the inside surfaces of some of the samples, and some, including E-030B, had rusty liquid level lines consistent with collection of water within the line during the 23 days that water was applied to the scene. Segments of the 12-inch 4-sidecut sampled from various locations in the line under the combined direction of Cal/OSHA, CUSA, and the CSB are shown in Figure 27b through Figure 29. All five of the 12-inch 4-sidecut samples consisted of short sections of pipe without welds. It was reported that samples E-059B and E-061B were cut from sections of pipe installed in 2011. Most of the scale present on the outside surfaces of the12-inch samples was dark colored and adherent, but there was some friable rust. Dark gray to black scale was present on the inside surfaces of all the 12-inch samples. The inside scale was friable at the surface, and adherent under the surface, where it had a shiny metallic appearance when scraped with a metal spatula. All of these characteristics are consistent with sulfidation corrosion product. Thickness measurements were made on the pipe samples at 0°, 90°, 180° and 270° using dial calipers after cleaning with a wire brush to remove loose scale from the inside and outside surfaces at the location of the measurements. For horizontal runs, 0° was located on the top of the pipe, and for vertical runs, 0° was located on either the North or South side, depending on which orientation was marked on the sample. Results of the measurements are listed in Table 2 and Table 3. The nominal wall thickness of 8-inch Schedule 40 pipe is 0.322-inch, and the nominal wall thickness of 12-inch Schedule 40 pipe is 0.406-inch. It was reported that the 12-inch 4-sidecut samples E-059B and E-061B were cut from pipe installed in 2011. No evidence of corrosion pits was detected, although uneven, or wavy, wall loss was present in some of the samples. Uneven or wavy wall loss was investigated by cleaning specimens from the 8-inch 4-sidecut and 12-inch 4-sidecut by immersion in a 25% solution of Oakite® 33 and water. Alternating cycles of immersion in the solution and wire brushing the inside and outside surface scale removed the majority of the scales present. A control specimen was subjected to the same exposure and lost 0.002-inch of thickness. Photographs of the inside surfaces after cleaning are shown in Figure 30 through Figure 33. Uneven or wavy wall loss was present on specimens sectioned from the pipe samples E-022B, E-023B, E-063AB, E-069B, and E-072B. Thickness measurements were performed using a pointed anvil micrometer at locations selected to demonstrate the range of thickness associated with uneven wall loss on the cleaned specimens. Measured wall thickness values are annotated on the figures. In some cases, a thin, adherent layer of scale remained on the inside surface of the specimens after cleaning. The remaining scale thickness was estimated from measurements made along the edges of specimens E-030B, E-059B, and E-061B where the scale had spalled from the inside surface and closely spaced measurements could be compared. The remaining adherent inside surface scale was about 0.015-inch thick. Macrographs of the cleaned inside surfaces of specimens from samples E-022B and E-023B are shown in Figure 34. The cleaned specimen from sample E-023B was the only one that had an inside surface morphology with features that could be called pits. However, the pits were present only in the thicker areas of the specimen. In the thinner areas, the surface had a wavy morphology with a thin layer of adherent scale.

A n a m e t , i n c HAYWARD, CALIFORNIA Report No. 5004.7920 B Page 6
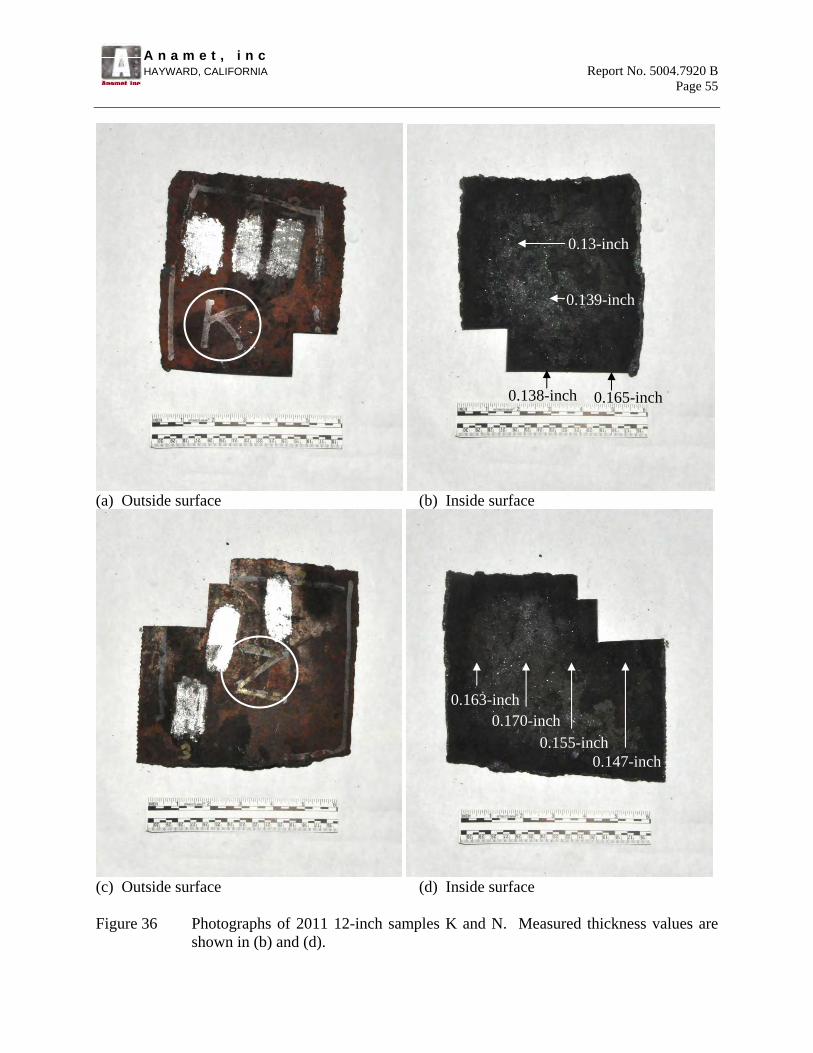
2.1.3 2011 12-inch Samples Photographs of four 2011 12-inch samples selected for evaluation are shown in Figure 35 and Figure 36. Samples I and J were joined by a circumferential weld. No welds were present on samples K and N. Outside and inside surface scales were equivalent in appearance to those observed on the 12-inch 4-sidecut samples. Wall thickness measurements from these samples are shown in Figure 35 and Figure 36. 2.2 Chemical Analysis Quantitative chemical analysis by optical emission spectroscopy (OES) and LECO combustion was performed on specimens sectioned from the 8-inch 4-sidecut, 12-inch 4-sidecut, and 2011 12-inch samples. Analysis by OES was performed on the outside surface of the specimens after grinding down to bright metal. The results are listed in Table 4 through Table 7. In Table 4, E-017-11 refers to a specimen sectioned from the ruptured pipe, while E-017-9 and E-017-10 refer to specimens sectioned from the upstream elbow, as indicated in Figure 2. Results for two specimens of the upstream elbow are listed because a question arose, in the laboratory, regarding whether OES was performed near the outside or inside surface of the pipe. The chemical composition requirements for ASTM A 106 Grade B and A 53 seamless Grade B carbon steel pipe are listed in Table 8 for reference. The important difference between the requirements of A 106 and A 53 is that A 53 does not specify a silicon concentration, whereas A 106 specifies a 0.10-wt% minimum for silicon. Consequently, all the samples met the chemical composition requirements of ASTM A 53, but not all the samples, including the ruptured section, met the chemical composition requirements for ASTM A 106. Silicon concentration in carbon steels can have an important effect on sulfidation corrosion rate2. Sulfidation rates are generally greater for carbon steels with silicon concentration below 0.1-wt% than for steels containing more than 0.1-wt% silicon. A plot of wall loss and silicon concentration for samples of the 8-inch 4-sidecut is shown in Figure 37. Wall loss was calculated for each sample from the difference between the average of four thickness values listed in Table 2 and the 0.322-inch nominal thickness of 8-inch Schedule 40 pipe. The data points present an overall trend of decreasing wall loss caused by sulfidation with increasing silicon concentration, except for the data point from sample E-034B. Sample E-034B was cut out of a vertical run from the 8-inch line to a spare pump. Consequently, the flow conditions in this section were likely to have been different compared to what the other samples were exposed to. 2.3 Hardness and Tensile Testing Rockwell hardness testing was performed on specimens from the 8-inch 4-sidecut, 12-inch 4-sidecut, and 2011 12-inch samples. Indentations were made near the outside surface of each specimen after machining parallel flats, and grinding the outside flats through 240 grit silicon
2 API RP 939-C Guidelines for Avoiding Sulfidation (Sulfidic) Corrosion Failures in Oil Refineries, API Subcommittee on Corrosion & Materials.

A n a m e t , i n c HAYWARD, CALIFORNIA Report No. 5004.7920 B Page 7
carbide paper. The results are listed in Table 9 along with approximate tensile strength taken from ASTM A 370 Table 3, and were consistent with ASTM A 106 Grade B and A 53 Grade B carbon steels. Tensile testing was performed on longitudinal specimens machined from the 8-in 4-sidecut and 12-in 4-sidecut pipe samples in accordance with ASTM A 3703. However, the pipe wall of the ruptured section was too thin and the 2011 12-inch samples were too small to allow machining of tensile specimens. Specimen gage length and width were 2.00-inches and 0.50-inches, respectively. Specimen gage thickness was determined by the steel remaining after machining the outside surface flat and removal of all visible evidence of gray scale from the inside surface. The results are listed in Table 10. Minimum tensile and yield strength requirements for ASTM A 106 Grade B and A 53 Grade B are listed in Table 11 for comparison. All of the specimens tested met the tensile and yield strength requirements for A 106 Grade B, and A 53 Grade B. Engineering stress-strain curves recorded for each test are shown in Figure 38 and Figure 39. 2.4 Metallography 2.4.1 Ruptured Section Specimens were prepared for metallography from the sections through the rupture edges indicated in Figure 8 (section E-017-1F), Figure 10 (section E-017-2A), and Figure 12 (section E-014-C). Representative micrographs of the specimens are shown in Figure 40 through Figure 42. All of the specimens sectioned from the rupture edges had been recrystallized by the heat of the fire. Under the conditions of the fire, wall loss to high temperature oxidation is expected. Additional wall loss to corrosion accelerated by water applied to the rupture area for 23 days is also expected. Consequently, microstructural details of the fracture mechanism that formed the ruptured edges were lost. In addition, most evidence of sulfide scale in the immediate vicinity of the rupture edges was lost. Specimens were prepared for metallography from sections through the circumferential weld that joined the ruptured straight section of pipe to the upstream elbow at the locations indicated in Figure 43 (sections E-017-7 and E-017-8). Photographs of the polished and etched specimens are shown in Figure 44. The wall thickness of the straight section was significantly more reduced than that of the elbow, both of which were reported to have been in service for the same length of time. Micrographs representative of the interface between the pipe wall and inside surface scale are shown in Figure 45. The morphology of the scale was consistent with sulfidation scale that forms from the reaction between carbon steel and sulfur bearing hydrocarbon streams. Sections through the welds that joined the pipe guides to the ruptured straight section of pipe, indicated in Figure 46 (E-017-3, E-017-4, E-017-5, E-017-6), were prepared for metallography. Photographs of the polished and etched specimens are shown in Figure 47 (E-017-3, E-017-4) and Figure 48 (E-017-5, E-017-6). There was no evidence of localized attack associated with the guide welds. There was evidence of slightly thicker pipe wall in the vicinity of the guides, which
3 ASTM A 370, Standard Test Methods and Definitions for Mechanical Testing of Steel Products

A n a m e t , i n c HAYWARD, CALIFORNIA Report No. 5004.7920 B Page 8
may have been a result of the guides acting as heat sinks that lowered the local wall temperature and, consequently, lowered the local sulfidation corrosion rate. 2.4.2 Pipe Sections Specimens were prepared for metallography from longitudinal sections through the 8-inch 4-sidecut, 12-inch 4-sidecut, and selected 2011 12-inch samples. Evidence of iron sulfide scale was found at the inside surface of all the specimens. Representative micrographs are shown in Figure 50 (E-023B, E-061B) and Figure 51 (I, K). The majority of inside surface scale on sample E-034B spalled off specimens during sectioning. Microstructural evidence of recrystallization and carburization of the inside surface was present in specimens prepared from sample E-034B, as shown in Figure 52 and Figure 53. Sulfide inclusions atypical for carbon steel pipe in size, shape, and distribution were present near the inside surface of these specimens, likely caused by internal sulfidation. All of these observations are consistent with high temperature exposure during the fire. 2.5 Scanning Electron Microscopy and Energy Dispersive X-ray Spectroscopy Samples were examined using a scanning electron microscope (SEM) and analyzed by energy dispersive X-ray spectroscopy4 (EDS). Specimens of scale scraped from the inside surface of the 8-inch 4-sidecut, 12-inch 4-sidecut, and selected 2011 12-inch pipe samples were pressed into 0.3-inch diameter pellets and analyzed by EDS using a 30 kV electron beam. Iron (Fe) and sulfur (S) were detected along with other elements including oxygen (O) and manganese (Mn). Semi-quantitative analysis of the spectra indicated atomic ratios of iron and sulfur consistent with iron-sulfide. Representative EDS spectra and semi-quantitative analysis results are shown in Figure 54 (E-017-A, E-030B) and Figure 55 (E-069B, I). The inside surface of specimen E-017-1 near the rupture edge was analyzed by EDS before cleaning. Representative EDS spectra are shown in Figure 56 (E-017-1). Iron, oxygen, sulfur, manganese, silicon (Si), sodium (Na), calcium (Ca), chlorine (Cl), phosphorous (P), potassium (K) and zinc (Zn) were detected. Specimen E-023B that had been prepared for metallography was analyzed with EDS at the interface between the inside surface scale and the steel. Dot maps of the analysis are shown in Figure 57. Colored pixels in the maps correspond to the locations in the backscatter electron image from which characteristic X-ray peaks were recorded for the indicated element. Also shown is the total EDS spectrum collected during the mapping. The maps demonstrate that the
4 The EDS analysis method used here detects the presence of elements from boron (B) to uranium (U), atomic numbers from 5 to 92 in the periodic table. EDS data alone are, however, insufficient to differentiate chemical compounds such as oxides, hydroxides, or carbonates or to characterize organic materials that consist of carbon (C), hydrogen (H), and nitrogen (N) only.

A n a m e t , i n c HAYWARD, CALIFORNIA Report No. 5004.7920 B Page 9
inside surface scale was comprised mostly of iron and sulfur, consistent with sulfidation corrosion product. Representative SEM micrographs of the sample E-017-1 rupture edge after cleaning in dilute Micro90™ with ultrasonic agitation are shown in Figure 58. The rupture edge was covered with corrosion product. Additional cleaning in dilute Branson OR™ with ultrasonic agitation removed much of the corrosion product. However, the corroded steel surface was devoid of microscopic evidence of the fracture mechanism, as shown in Figure 59. 2.6 X-Ray Diffraction Scale specimens were scraped from the inside surface of 8-inch 4-sidecut, 12-inch 4-sidecut, and 2011 12-inch pipe samples using a stainless steel spatula. The outer layers of the scale were generally friable and easily removed. The scale closest to the steel surface was adherent, and scraping revealed a dark gray metallic luster. Small quantities of rust were visible within the scale of most samples. Specimens were washed with toluene to remove residual hydrocarbons and allowed to dry. Phase analysis by X-ray diffraction (XRD) was subcontracted to Evans Analytical Group (EAG) in Sunnyvale, CA. Results of the XRD analysis are shown in Appendix D and Appendix E, and summarized in Table 12 through Table 14. In Appendix E, the sample labeled E-017A was taken from the elbow upstream of the rupture, and the sample labeled E-017B was taken from the ruptured section of pipe. Various chemical forms of iron sulfide made up the majority of each specimen, which demonstrates that sulfidation corrosion was active within the 8-inch and 12-inch 4-sidecut piping. A broad peak was detected from the 8-inch 4-sidecut sample E-034B, but not in any of the others. The report states that the peak may have been from graphite, but was likely a semi-amorphous phase similar to pyrolytic carbon. This is consistent with the presence of a thick layer of black, low density, friable deposit that looked like soot on top of the inside scale of sample E-034B. 3.0 DISCUSSION Sulfidation corrosion, also called sulfidic corrosion, is caused by the chemical reaction between iron and sulfur to form iron sulfide, generally at temperatures above 450°F. In crude oil distillation, naturally occurring sulfur and sulfur compounds are available to react with steel components, particularly plain carbon steels. Variables that affect sulfidation corrosion rates in crude oil distillation are the total sulfur content of the oil, the sulfur species present in the oil, temperature of the system, flow conditions, and the composition of the steel. Industry experience has shown that silicon in carbon steel is known to inhibit sulfidation when the concentration of the silicon is above 0.10-wt%. Below this level, the corrosion rate can be significantly faster. Although sulfidation corrosion rates of carbon steel can be low, over decades of service a difference in corrosion rate caused by variations in silicon concentration can lead to failure in low silicon components while higher silicon bearing components retain useful life.

A n a m e t , i n c HAYWARD, CALIFORNIA Report No. 5004.7920 B Page 10
A general trend of increased wall loss with a decrease in silicon concentration was observed for the 8-inch 4-sidecut samples. Although the wall loss of sample E-034B appeared to not follow this trend, direct comparison of the effects of sulfidation corrosion between different samples assumes that the time in service and service conditions were the same for each sample. It was reported that all of the 8-inch 4-sidecut samples had likely been in service since the original construction. However, sample E-034B was removed from a vertical run off the primary line of the 8-inch 4-sidecut to a spare pump. Consequently, the service conditions, flow in particular, were likely different for E-034B than for the rest of the 8-inch pipe samples. The evidence indicates that contact between one of the two submitted fire pikes and the ruptured section of 8-inch 4-sidecut may have caused puncture of the pipe and associated inward deformation of the rupture edge. However, it is possible that a similar shaped object could have caused the observed deformation. The reported service conditions of the #4 Crude Unit 4-sidecut piping, the composition of the carbon steel, presence of thick sulfide scale on the inside surfaces of the pipe, and generally uniform wall thinning indicate that sulfidation corrosion was the cause of the 8-inch 4-sidecut rupture.

A n a m e t , i n c HAYWARD, CALIFORNIA Report No. 5004.7920 B Page 11
4.0 CONCLUSIONS5 The following conclusions are based upon the submitted samples and the evidence gathered: 1. Rupture of the 8-inch 4-sidecut resulted from wall thinning caused by sulfidation corrosion. 2. Post rupture corrosion destroyed fracture morphology that could have indicated the rupture
initiation site. However, rupture likely originated in the thinnest region and initially followed a longitudinal path driven by the hoop stress. Consequently, an area of likely rupture initiation was identified.
3. The wall thickness of the ruptured section was less than all the other sections of the 8-inch 4-
sidecut that were evaluated. 4. Chemical analysis showed the silicon concentration of the ruptured section was 0.01-wt%. 5. Six of twelve specimens (50%) from unique sections of the 8-inch 4-sidecut, 12-inch 4-
sidecut, and 2011 12-inch samples were found by chemical analysis to have a silicon concentration of less than 0.1-wt%.
6. Deformation of a small region of the 8-inch 4-sidecut rupture edge was consistent with
mechanical force applied from the outside surface of the pipe, possibly from a fire pike, such as samples E-099 and E-082-2, or other pointed object. This deformed region was located within the area of likely rupture initiation.
Prepared by: Reviewed by:
Sam McFadden, Ph.D. Associate Director of Laboratories
Ken Pytlewski, PE Director, Engineering and Laboratories
5 The conclusions in this report are based upon the available information and evidence provided by the client and gathered by Anamet, within the scope of work authorized by the client, and they are hereby presented by Anamet to a reasonable degree of engineering and scientific certainty. Anamet reserves the right to amend or supplement its conclusions or opinions presented in this report should additional data or information become available, or further work be approved by the client.

A n a m e t , i n c HAYWARD, CALIFORNIA Report No. 5004.7920 B Page 12
Table 1
List of Samples
Location Collected
Identification
Description
Ground E-014 Pipe fragment
8-inch 4-sidecut
E-017 Upstream elbow, ruptured section of pipe, and welded guides E-022B Section of pipe, no welds E-023A Cut from downstream end of E-017 pipe, includes 30° elbow
and one section of downstream pipe E-023B Section of pipe, no welds E-023C Section of pipe, no welds E-028B Section of pipe, no welds E-030B Section of pipe, no welds E-034B Section of pipe, no welds
12-inch 4-sidecut
E-059B Section of pipe, no welds, cut from pipe installed in 2011 E-061B Section of pipe, no welds, cut from pipe installed in 2011 E-063AB Section of pipe, no welds E-069B Section of pipe, no welds E-072B Section of pipe, no welds
2011 12-inch
I Flame cut coupon, welded to sample J J Flame cut coupon, welded to sample I K Flame cut coupon N Flame cut coupon
Ground E-099 Fire pike with remnants of glass fiber reinforced polymer pole Ground E-082-2 Fire pike tip, no pole

A n a m e t , i n c HAYWARD, CALIFORNIA Report No. 5004.7920 B Page 13
Table 2
8-inch 4-Sidecut Samples Measured Wall Thickness A
Sample
0° (in)
90° (in)
180° (in)
270° (in)
E-017B -.- 0.178 0.255 0.285 E-017C 0.110 0.090 0.105 0.092 E-022B 0.236 0.184 0.245 0.229 E-023AD 0.082 0.088 0.113 0.068 E-023AE 0.242 0.245 0.255 0.245 E-023B 0.240 0.258 0.225 0.240 E-028B 0.192 0.205 0.196 0.208 E-030B 0.218 0.172 0.278 0.236 E-034B 0.306 0.319 0.279 0.320
A Measurements taken with calipers after cleaning inside and outside surfaces with a wire brush. B Measurements taken on the upstream elbow, middle of bend C Measurements taken on the downstream end of the ruptured section D Measurements taken on the end of the ruptured section joined to the 30° elbow, see Figure 24b E Measurements taken on the downstream end, see Figure 24b
Table 3 12-Inch 4-Sidecut Wall Thickness A
Sample
0°
(in) 90° (in)
180° (in)
270° (in)
E-059BB 0.429 0.433 0.428 0.421 E-061BB 0.432 0.435 0.445 0.440 E-063AB 0.262 0.261 0.268 0.244 E-069B 0.426 0.411 0.413 0.413 E-072B 0.240 0.220 0.244 0.228
A Measurements taken with calipers after cleaning inside and outside surfaces with a wire brush B Samples cut from pipe installed in 2011

A n a m e t , i n c HAYWARD, CALIFORNIA Report No. 5004.7920 B Page 14
Table 4
Quantitative Chemical Analysis Results for Specimens from the 8-Inch 4-Sidecut Ruptured Pipe Sample E-017-11, the Recovered Fragment Sample E-014,
and the Upstream Elbow Samples E-017-9 and E-017-10
Element E-017-11
(wt%) E-014 (wt%)
E-017-9 (wt%)
E-017-10 (wt%)
CarbonA (C) 0.22 0.21 0.20 0.20 Chromium (Cr) 0.01 0.01 0.02 0.02 Copper (Cu) 0.01 0.01 0.01 0.01 Iron (Fe) Primary Constituent Manganese (Mn) 0.58 0.58 0.84 0.83 Molybdenum (Mo) 0.01 0.01 0.01 0.01 Nickel (Ni) 0.01 0.01 0.01 0.01 Phosphorus (P) 0.009 0.009 0.008 0.007 Silicon (Si) 0.01 0.01 0.16 0.16 Sulfur (S) 0.015 0.016 0.016 0.017 Vanadium (V) <0.005 <0.005 <0.005 <0.005
A Determined by LECO combustion, all others determined by OES
Table 5 Quantitative Chemical Analysis Results for
the 8-Inch 4-Sidecut Pipe Samples
Element E-022B (wt%)
E-023B (wt%)
E-028B (wt%)
E-030B (wt%)
E-034B (wt%)
CarbonA (C) 0.25 0.25 0.25 0.25 0.19 Chromium (Cr) 0.01 0.04 0.06 0.06 0.05 Copper (Cu) 0.01 0.13 0.04 0.04 0.01 Iron (Fe) Primary Constituent Manganese (Mn) 0.63 0.92 0.98 0.97 0.68 Molybdenum (Mo) .005 0.01 0.02 0.02 0.01 Nickel (Ni) 0.01 0.08 0.04 0.04 0.02 Phosphorus (P) 0.010 0.019 0.009 0.009 0.010 Silicon (Si) 0.16 0.16 0.06 0.06 0.01 Sulfur (S) 0.017 0.28 0.026 0.027 0.019 Vanadium (V) <0.005 <0.005 <0.005 <0.005 <0.005
A Determined by LECO combustion, all others determined by OES

A n a m e t , i n c HAYWARD, CALIFORNIA Report No. 5004.7920 B Page 15
Table 6
Quantitative Chemical Analysis Results for the 12-Inch 4-Sidecut Pipe Samples
Element E-059B (wt%)
E-061B (wt%)
E-063AB (wt%)
E-069B (wt%)
E-072B (wt%)
CarbonA (C) 0.19 0.19 0.25 0.19 0.24 Chromium (Cr) 0.07 0.07 0.02 0.04 0.01 Copper (Cu) 0.01 0.01 0.01 0.01 0.02 Iron (Fe) Primary Constituent Manganese (Mn) 1.13 1.12 0.66 0.88 0.82 Molybdenum (Mo) 0.02 0.02 0.01 0.01 0.01 Nickel (Ni) 0.03 0.03 0.01 0.02 0.01 Phosphorus (P) 0.009 0.009 0.008 0.013 0.009 Silicon (Si) 0.20 0.20 0.01 0.12 0.01 Sulfur (S) <0.005 <0.005 0.015 0.031 0.016 Vanadium (V) <0.005 <0.005 <0.005 <0.005 <0.005
A Determined by LECO combustion, all others determined by OES
Table 7 Quantitative Chemical Analysis Results for
the 2011 12-Inch Pipe Samples
Element I
(wt%) J
(wt%) K
(wt%) N
(wt%) CarbonA (C) 0.25 0.26 0.24 0.24 Chromium (Cr) 0.02 0.01 0.02 0.02 Copper (Cu) 0.01 <0.005 0.01 0.01 Iron (Fe) Primary Constituent Manganese (Mn) 0.84 0.70 0.84 0.84 Molybdenum (Mo) <0.005 <0.005 <0.005 <0.005 Nickel (Ni) 0.01 0.01 0.01 0.01 Phosphorus (P) 0.012 0.008 0.012 0.012 Silicon (Si) 0.01 0.16 0.01 0.01 Sulfur (S) 0.020 0.016 0.021 0.020 Vanadium (V) <0.005 <0.005 <0.005 <0.005
A Determined by LECO combustion, all others determined by OES

A n a m e t , i n c HAYWARD, CALIFORNIA Report No. 5004.7920 B Page 16
Table 8
Chemical Composition Requirements for ASTM A 106 and A 53 Grade B Carbon Steel Pipe
Element
Requirements for A 106
Grade B Carbon Steel
(wt%)
Requirements for A 53
Type S Grade B Carbon Steel
(wt%) min max min max
Carbon (C) -.- 0.30 -.- 0.30 ChromiumA (Cr) -.- 0.40 -.- 0.40 CopperA (Cu) -.- 0.40 -.- 0.40 Iron (Fe) Primary Constituent Primary Constituent Manganese (Mn) 0.29 1.06 -.- 1.20 MolybdenumA (Mo) -.- 0.15 -.- 0.15 NickelA (Ni) -.- 0.40 -.- 0.40 Phosphorus (P) -.- 0.035 -.- 0.05 Silicon (Si) 0.10 -.- Not Controlled Sulfur (S) -.- 0.035 -.- 0.045 VanadiumA (V) -.- 0.08 -.- 0.08
A For A 53 Type S Grade B, the total composition for these five elements shall not exceed 1.00 wt%

A n a m e t , i n c HAYWARD, CALIFORNIA Report No. 5004.7920 B Page 17
Table 9
Rockwell Hardness Test Results
Sample
Rockwell B Hardness (HRBW)A
Tensile Strength Estimated from
HardnessB (ksi)
8-inch 4-sidecut
E-017C 68 59 E-022B 71 62 E-023B 77 68 E-028B 81 73 E-030B 78 69 E-034B 65 56
12-inch 4-sidecut
E-059B 76 67 E-061B 78 69 E-063AB 69 60 E-069B 73 64 E-072B 73 64
2011 12-inch
I 76 67 J 71 62 K 75 66 N 79 70
A Average of three readings B From ASTM A 370 Table 3 C Specimen prepared from E-017-5 at the location indicated in Figure 46.
Table 10 Tensile Test Results
Sample
Specimen Gage Thickness
(in)
Tensile Strength
(ksi)
Yield Point (ksi)
Elongation in 2.0-inch Gage
Length (%)
8-inch 4-sidecut
E-022B 0.137 63.8 41.0 26.5 E-023B 0.138 77.4 49.6 25.5 E-028B 0.095 75.3 50.7 20 E-030B 0.125 74.0 50.9 20.5 E-034B 0.199 64.2 48.9 37.5
12-inch 4-sidecut
E-059B 0.334 69.7 48.9 37.5 E-061B 0.342 73.3 48.5 36 E-063AB 0.187 66.9 38.4 34.5 E-069B 0.279 64.4 38.1 34.5 E-072B 0.122 68.0 40.0 27

A n a m e t , i n c HAYWARD, CALIFORNIA Report No. 5004.7920 B Page 18
Table 11
Minimum Tensile and Yield Strength Requirements
Tensile Strength
(ksi) Yield Strength
(ksi) A 106 Grade B 60.00 35.00 A 53 Grade B 60.00 35.00
Table 12 X-Ray Diffraction Phase Analysis Results for
Inside Surface Scale Specimens from the 8-Inch 4-Sidecut Samples
Phases Identified
Sample ID
E-017-A Upstream
Elbow
E-017-B RupturedSection
E-022B E-023B E-028B E-030B E-034B
FeS – Iron Sulfide Y Y
Fe11S12 – Iron Sulfide
X Y Y
Fe1-xS – Iron Sulfide Y X Y X X
FeS2 – Iron Sulfide
Fe2O3 – Iron Oxide X
Fe3O4 – Iron Oxide X X X
Fe+3O(OH) – Iron Oxide
X X
Fe3C – Iron Carbide X
C – Carbon X
Fe – Iron X
Amorphous materials
X
(Y= primary phase; X= minor phase(s))

A n a m e t , i n c HAYWARD, CALIFORNIA Report No. 5004.7920 B Page 19
Table 13
X-Ray Diffraction Phase Analysis Results for Inside Scale Specimens from the 12-Inch 4-Sidecut Samples
Phases Identified Sample ID
E-059B E-061B E-063AB E-069B E-072B
FeS – Iron Sulfide X
Fe11S12 – Iron Sulfide Y Y X X Y
Fe1-xS – Iron Sulfide X X Y Y
FeS2 – Iron Sulfide X
Fe3O4 – Iron Oxide/Magnetite X
Fe+3O(OH) – Iron Oxide
Fe3C – Iron Carbide
C – Carbon
Fe – Iron
Amorphous materials
(Y= primary phase; X= minor phase(s))
Table 14 X-Ray Diffraction Phase Analysis Results for
Inside Scale Specimens from the 2011 12-Inch Samples
Phases Identified Sample ID
I J K N
FeS – Iron Sulfide
Fe11S12 – Iron Sulfide
Fe1-xS – Iron Sulfide Y Y Y Y
FeS2 – Iron Sulfide
Fe2O3 – Iron Oxide X X X
Fe3O4 – Iron Oxide X
Fe+3O(OH) – Iron Oxide
Fe3C – Iron Carbide
C – Carbon
Fe – Iron
Amorphous materials
(Y= primary phase; X= minor phase(s))

A n a m e t , i n c HAYWARD, CALIFORNIA Report No. 5004.7920 B Page 20
Figure 1 Photograph of the ruptured section of the 8-inch 4-sidecut sample E-017. The
rupture location is circled. The flap projecting from the bottom is pipe wall forced outward at the location of the rupture. In service, the welded guides were vertical.
Welded guides
Flap
Upstream elbow

A n a m e t , i n c HAYWARD, CALIFORNIA Report No. 5004.7920 B Page 21
Figure 2 The ruptured sample E-017 and scaffold were rotated 90° to provide better access
to the rupture area.
Rupture area
Specimen E-017-11
for chemical analysis and
cleaning
Specimen E-017-10
for chemical analysis
Specimen E-017-9
for chemical analysis
E-017

A n a m e t , i n c HAYWARD, CALIFORNIA Report No. 5004.7920 B Page 22
Figure 3 Photograph of the rupture. Talcum powder had been applied around the rupture
to aid laser scanning used to construct a three dimensional record of the rupture geometry. The dashed lines indicate where the rupture flaps, assigned the identification numbers E-017-1 and E-017-2, were sectioned.
E-017-1
E-017-2
E-017

A n a m e t , i n c HAYWARD, CALIFORNIA Report No. 5004.7920 B Page 23
Figure 4 Photograph of the rupture from a different perspective than that shown in Figure
3. Talcum powder had been applied around the rupture to aid laser scanning to construct a three dimensional record of the rupture geometry. The dashed lines indicate where the rupture flaps, assigned the identification numbers E-017-1 and E-017-B, were sectioned.
E-017-2 E-017-1
E-017

A n a m e t , i n c HAYWARD, CALIFORNIA Report No. 5004.7920 B Page 24
Figure 5 Photograph of the closest approach between the rupture and welded pipe guides of
sample E-017. All other guide welds ended 4 to 6-inches from the rupture edge.
E-017

A n a m e t , i n c HAYWARD, CALIFORNIA Report No. 5004.7920 B Page 25
Figure 6 Photograph of the ruptured section of sample E-017. A small degree of buckling
was present near the upstream welded pipe guide.
E-017

A n a m e t , i n c HAYWARD, CALIFORNIA Report No. 5004.7920 B Page 26
(a) Outside surface
(b) Inside surface
Figure 7 Rupture area flap sectioned from the pipe and assigned the number E-017-1.
Thick, dark colored scale
Rust
Thin dark colored scale

A n a m e t , i n c HAYWARD, CALIFORNIA Report No. 5004.7920 B Page 27
Figure 8 Section E-017-1 after flattening. Thickness measurements were made with a
pointed anvil micrometer within 0.100-inch of the edge at the locations indicated before cleaning.
0.016
0.033
0.014
0.022
0.013
0.016
0.028
0.016
0.012
0.016
0.024 0.025 0.036
0.037
0.039
0.035
0.034
0.037
0.037
0.024
See Figure 14a
See Figure 14b
Section E-017-1F for metallography
See Figure 17

A n a m e t , i n c HAYWARD, CALIFORNIA Report No. 5004.7920 B Page 28
(a)
(b)
Figure 9 Rupture area flap sectioned from the pipe and assigned the number E-017-2.
Outside surface
Inside surface
Outside surface
Inside surface

A n a m e t , i n c HAYWARD, CALIFORNIA Report No. 5004.7920 B Page 29
Figure 10 Section E-017-2 after flattening. Thickness measurements were made with a pointed anvil micrometer within 0.100-inch of the edge at the locations indicated before cleaning.
0.053
0.054
0.064
0.070
0.026
0.026
0.035
0.040
0.033
0.016
0.017
0.019
0.035
0.043
0.014
0.026
0.049
0.024
0.044
0.047
0.046
0.044
0.034
0.062
0.069 0.051
See Figure 15a
See Figure 15b
Section E-017-2A for metallography

A n a m e t , i n c HAYWARD, CALIFORNIA Report No. 5004.7920 B Page 30
(a)
(b)
Figure 11 Fragment E-014 recovered from the ground beneath the rupture.

A n a m e t , i n c HAYWARD, CALIFORNIA Report No. 5004.7920 B Page 31
Figure 12 Fragment E-014 after unfolding and flattening. Thickness measurements were
made with a pointed anvil micrometer within 0.100-inch of the edge at the locations indicated before cleaning.
0.026
0.040
0.055
0.056
0.042
0.027
0.048
0.030
0.040
0.023
0.027
0.040
0.027
0.023
0.030
0.048
0.027
0.042
0.056
0.055
0.040
0.018 0.026
0.050 0.031
See Figure 16b
See Figure 16a
Section E-014-C for metallography
Specimen for chemical analysis

A n a m e t , i n c HAYWARD, CALIFORNIA Report No. 5004.7920 B Page 32
(a)
(b)
Figure 13 Geometric relationship between the rupture area, flaps E-017-1, E-017-2, and sample E-014. In (a) the total rupture area is shown in black and the shapes of E-017-1, E-017-2, and E-014 are shown in red, blue, and green, respectively. In (b) flaps E-017-1, E-017-2, and sample E-014 are shown on top of the tracing.
Cut line Cut line
Rupture area E-017-1 E-017-2 E-014
Rupture area E-017-1 E-017-2 E-014
8.8 in2
4.3 in2 Unaccounted for areas

A n a m e t , i n c HAYWARD, CALIFORNIA Report No. 5004.7920 B Page 33
(a)
(b)
Figure 14 Representative optical macrographs of tapered edges on the rupture edge of
specimen E-017-1. The locations from which these macrographs were recorded are indicated in Figure 8.

A n a m e t , i n c HAYWARD, CALIFORNIA Report No. 5004.7920 B Page 34
(a)
(b)
Figure 15 Representative macrographs of flat edges along thicker regions of specimen E-
017-2. The locations from which these macrographs were recorded are indicated in Figure 10.

A n a m e t , i n c HAYWARD, CALIFORNIA Report No. 5004.7920 B Page 35
(a)
(b)
Figure 16 Representative macrographs of tapered and flat edges on specimen E-014. The
locations from which these macrographs were recorded are indicated in Figure 12.

A n a m e t , i n c HAYWARD, CALIFORNIA Report No. 5004.7920 B Page 36
Figure 17 Macrograph of the inside surface of specimen E-017-1 taken from the region indicated in Figure 8 before cleaning. Deformation of the specimen edge, indicated by arrows, was consistent with mechanical force applied from the outside.
Inside surface of specimen E-017-1
before cleaning

A n a m e t , i n c HAYWARD, CALIFORNIA Report No. 5004.7920 B Page 37
(a) Sample E-099
(b) Boxed area in (a) Figure 18 Photographs of pike pole sample E-099 recovered from the site of the ruptured 4-
sidecut. The pole was made from glass fiber reinforced polymer, and much of the polymer was burned away in the fire. A tangle of exposed glass fibers remained.

A n a m e t , i n c HAYWARD, CALIFORNIA Report No. 5004.7920 B Page 38
(a)
(b)
Figure 19 Photographs of the tip of the pike pole E-099 shown in Figure 18.

A n a m e t , i n c HAYWARD, CALIFORNIA Report No. 5004.7920 B Page 39
Figure 20 Photograph of pike pole head, sample E-082-2, recovered from the site of the
ruptured 4-sidecut. The glass fiber reinforced polymer pole was absent except for the indicated remnants.
Pole remnants

A n a m e t , i n c HAYWARD, CALIFORNIA Report No. 5004.7920 B Page 40
(a)
(b)
Figure 21 Photographs of the tip of the pike pole head E-082-2 shown in Figure 20.

A n a m e t , i n c HAYWARD, CALIFORNIA Report No. 5004.7920 B Page 41
Figure 22 Photograph of the fire pike pole tip and the inside surface of specimen E-017-1. The boxed area is shown without the pike pole in Figure 17. The pike tip fit the region of inward deformation.
E-099 pike tip
Inside surface of specimen E-017-1
after cleaning
Flow direction

A n a m e t , i n c HAYWARD, CALIFORNIA Report No. 5004.7920 B Page 42
(a) View parallel to pipe longitudinal axis, tangent to pipe surface
(b) View orthogonal that shown in (a), tangent to pipe surface
Figure 23 Two orthogonal views of the fire pike E-099 fit to the location on specimen E-
017-1 shown in Figure 22. The magnet served to hold specimen E-017-1 in place.
Specimen E-017-1
Specimen E-017-1
80°
Flow direction
80°
Flow direction
Magnet
Pike E-099
Magnet
Pike E-099
Tangent plane
Tangent plane

A n a m e t , i n c HAYWARD, CALIFORNIA Report No. 5004.7920 B Page 43
(a) E-022B
(b) E-023A Figure 24 Photographs of 8-inch 4-sidecut samples E-022B and E-023A as-received.
Cut connects to ruptured section E-017
Flow 30° elbow
Downstream end

A n a m e t , i n c HAYWARD, CALIFORNIA Report No. 5004.7920 B Page 44
(a) E-023B
(b) E-023C Figure 25 Photographs of 8-inch 4-sidecut samples E-023B and E-023C as-received.

A n a m e t , i n c HAYWARD, CALIFORNIA Report No. 5004.7920 B Page 45
(a) E-028B
(b) E-030B Figure 26 Photographs of 8-inch 4-sidecut samples E-028B and E-030B as-received.

A n a m e t , i n c HAYWARD, CALIFORNIA Report No. 5004.7920 B Page 46
(a) E-034B
(b) E-059B Figure 27 Photographs of 8-inch 4-sidecut sample E-034B and 12-inch 4-sidecut sample E-
059B as-received.

A n a m e t , i n c HAYWARD, CALIFORNIA Report No. 5004.7920 B Page 47
(a) E-061B
(b) E-063AB Figure 28 Photographs of 12-inch 4-sidecut samples E-061B and E-063AB as-received.

A n a m e t , i n c HAYWARD, CALIFORNIA Report No. 5004.7920 B Page 48
(a) E-069B
(b) E-072B Figure 29 Photographs of 12-inch 4-sidecut samples E-069B and E-072B as-received.

A n a m e t , i n c HAYWARD, CALIFORNIA Report No. 5004.7920 B Page 49
(a)
(b)
(c)
Figure 30 Photographs of the inside surface of cleaned specimens sectioned from the 8-inch 4-sidecut samples. The location from which specimen E-017-11 was sectioned is indicated in Figure 2. The boxed areas in (b) and (c) are shown in Figure 34.
0.202-inch 0.195-inch 0.190-inch
0.240-inch
0.219-inch
0.260-inch 0.248-inch 0.206-inch
Bare metal Thin adherent
scale
Bare metal
Thin adherent scale
0.068-inch 0.056-inch
0.088-inch
0.063-inch

A n a m e t , i n c HAYWARD, CALIFORNIA Report No. 5004.7920 B Page 50
(a)
(b)
(c)
Figure 31 Photographs of the inside surface of cleaned specimens sectioned from the 8-inch
4-sidecut samples.
0.195-inch 0.246-inch 0.185-inch
0.216-inch 0.209-inch
0.284-inch 0.299-inch 0.278-inch
0.286-inch
Thin adherent scale
Bare metal
0.213-inch 0.178-inch 0.193-inch
0.205-inch
Thin adherent scale

A n a m e t , i n c HAYWARD, CALIFORNIA Report No. 5004.7920 B Page 51
(a)
(b)
(c)
Figure 32 Photographs of the inside surface of cleaned specimens sectioned from the 12-inch 4-sidecut samples.
0.410-inch 0.395-inch 0.410-inch
0.417-inch 0.403-inch 0.402-inch 0.418-inch
0.402-inch
0.248-inch
0.271-inch 0.286-inch
0.245-inch
Thin adherent scale
Bare metal
Thin adherent scale
Bare metal
Bare metal
Thin adherent scale

A n a m e t , i n c HAYWARD, CALIFORNIA Report No. 5004.7920 B Page 52
(a)
(b)
Figure 33 Photographs of the inside surface of cleaned specimens sectioned from the 12-
inch 4-sidecut samples.
0.432-inch 0.406-inch 0.403-inch
0.380-inch
0.233-inch 0.202-inch 0.188-inch
0.234-inch
0.407-inch 0.390-inch Thin adherent
scale Bare metal
Bare metal
Thin adherent scale

A n a m e t , i n c HAYWARD, CALIFORNIA Report No. 5004.7920 B Page 53
(a) E-022B, boxed area in in Figure 30a
(b) E-023B, boxed area in in Figure 30b
Figure 34 Macrographs of the inside surface of cleaned specimens from samples E-022B and E-023B from the boxed areas shown in Figure 30a and Figure 30b, respectively.
Bare metal
Adherent scale
Bare metal
0.260-inch thick
0.219-inch thick
0.190-inch thick
0.240-inch thick

A n a m e t , i n c HAYWARD, CALIFORNIA Report No. 5004.7920 B Page 54
(a) Outside surface (b) Inside surface Figure 35 Photographs of 2011 12-inch samples I and J, joined by a circumferential weld.
Measured thickness values are indicated in (b).
Weld Weld
0.147-inch
0.158-inch
0.175-inch
0.195-inch
0.400-inch
0.400-inch
0.420-inch
0.395-inch
A n a m e t , i n c HAYWARD, CALIFORNIA Report No. 5004.7920 B Page 55
(a) Outside surface (b) Inside surface
(c) Outside surface (d) Inside surface Figure 36 Photographs of 2011 12-inch samples K and N. Measured thickness values are
shown in (b) and (d).
0.13-inch
0.139-inch
0.165-inch
0.163-inch 0.170-inch
0.155-inch 0.147-inch
0.138-inch

A n a m e t , i n c HAYWARD, CALIFORNIA Report No. 5004.7920 B Page 56
Figure 37 Plot of wall loss and silicon concentration for samples of the 8-inch 4-sidecut.
Wall loss was calculated from the average of thickness measurements listed in Table 2 subtracted from the 0.322-inch nominal wall thickness for 8-inch Schedule 40 pipe. Sample E-034B was removed from a vertical run off the main 8-inch 4-sidecut, that led to a spare pump. Consequently, the service conditions were likely different, particularly in terms of flow, compared to the rest of the 8-inch samples.

A n a m e t , i n c HAYWARD, CALIFORNIA Report No. 5004.7920 B Page 57
Figure 38 Stress-strain curves from tests performed on specimens machined from 8-inch
pipe sections. Tabulated values of tensile strength, yield point, and total elongation are listed in Table 10.

A n a m e t , i n c HAYWARD, CALIFORNIA Report No. 5004.7920 B Page 58
Figure 39 Stress-strain curves from tests performed on specimens machined from 12-inch
pipe sections. Tabulated values of tensile strength, yield point, and total elongation are listed in Table 10.

A n a m e t , i n c HAYWARD, CALIFORNIA Report No. 5004.7920 B Page 59
(a) 50X
(b) Boxed area in (a) 100X
Figure 40 Optical micrographs of specimen E-017-2A prepared from the section indicated in Figure 10 before cleaning. The entire specimen had been recrystallized by the heat of the fire.
Fracture edge

A n a m e t , i n c HAYWARD, CALIFORNIA Report No. 5004.7920 B Page 60
(a) 100X
(b) Boxed area in (a) 500X
Figure 41 Optical micrographs of specimen E-014-C prepared from the section indicated in Figure 12 before cleaning. The entire specimen had been recrystallized by the heat of the fire.

A n a m e t , i n c HAYWARD, CALIFORNIA Report No. 5004.7920 B Page 61
(a) 100X
(b) Boxed area in (a) 500X
Figure 42 Optical micrographs of specimen E-017-1F, prepared from the section indicated
in Figure 8 after cleaning. The entire specimen had been recrystallized by the heat of the fire.
Flap edge

A n a m e t , i n c HAYWARD, CALIFORNIA Report No. 5004.7920 B Page 62
(a)
(b)
Figure 43 Photographs of the locations from which specimens of the ruptured pipe and
upstream elbow were sectioned from sample E-017 for metallography.
Upstream elbow
Ruptured Section
Upstream elbow
Ruptured Section

A n a m e t , i n c HAYWARD, CALIFORNIA Report No. 5004.7920 B Page 63
(a) E-017-7
(b) E-017-8 Figure 44 Polished and etched sections through the ruptured pipe and upstream elbow taken
from the locations indicated in Figure 43. The areas labeled and are shown in Figure 45.
Ruptured pipe Upstream elbow Circumferential
weld
0.026-inch
0.251-inch
0.50-inch
Ruptured pipe Upstream elbow
Circumferential weld
0.042-inch
0.204-inch 0.50-inch

A n a m e t , i n c HAYWARD, CALIFORNIA Report No. 5004.7920 B Page 64
(a) Ruptured pipe, location labeled Figure 44b 100X
(b) Upstream elbow, location labeled in Figure 44b 100X
Figure 45 Optical micrographs of specimen E-017-8.
Inside surface scale
Inside surface scale

A n a m e t , i n c HAYWARD, CALIFORNIA Report No. 5004.7920 B Page 65
Figure 46 Photograph of sample E-017. Locations from which specimens were sectioned through the pipe guide welds are indicated.
E-017-3
E-017-4
E-017-5
E-017-6
Hardness test specimen

A n a m e t , i n c HAYWARD, CALIFORNIA Report No. 5004.7920 B Page 66
(a) E-017-3
(b) E-017-4 Figure 47 Specimens prepared from sections through the pipe guide welds indicated in
Figure 46.
Ruptured pipe
Pipe guide
Ruptured pipe
Pipe guide
0.50-inch
0.50-inch
0.114-inch 0.133-inch 0.108-inch
0.114-inch 0.114-inch 0.102-inch

A n a m e t , i n c HAYWARD, CALIFORNIA Report No. 5004.7920 B Page 67
(a) E-017-5
(b) E-017-6 Figure 48 Specimens prepared from sections through the pipe guide welds indicated in
Figure 46.
Ruptured pipe
Ruptured pipe
Pipe guide
Pipe guide
0.50-inch
0.50-inch
0.105-inch 0.131-inch 0.094-inch
0.111-inch 0.132-inch
0.102-inch

A n a m e t , i n c HAYWARD, CALIFORNIA Report No. 5004.7920 B Page 68
(a) E-017-3 location in Figure 47a 100X
(b) E-017-5 location in Figure 48a 100X
Figure 49 Optical micrographs of specimens prepared from sections of guide welds E-017-3 and E-017-5.
Inside surface scale
Inside surface scale

A n a m e t , i n c HAYWARD, CALIFORNIA Report No. 5004.7920 B Page 69
(a) E-023B 100X
(b) E-061B 100X
Figure 50 Optical micrographs of longitudinal sections through 8-inch 4-sidecut sample E-023B and 12-inch 4-sidecut sample E-061B.
Inside surface scale
Inside surface scale

A n a m e t , i n c HAYWARD, CALIFORNIA Report No. 5004.7920 B Page 70
(a) I 100X
(b) K 100X
Figure 51 Optical micrographs of longitudinal sections through 2011 12-inch samples I and
K.
Inside surface scale
Inside surface scale

A n a m e t , i n c HAYWARD, CALIFORNIA Report No. 5004.7920 B Page 71
50X
Figure 52 Optical micrograph montage of a transverse specimen prepared from sample E-
034.
Inside surface

A n a m e t , i n c HAYWARD, CALIFORNIA Report No. 5004.7920 B Page 72
200X Figure 53 Optical micrograph montage of a transverse specimen prepared from sample E-
034B. Arrows point to examples of sulfide inclusions likely formed by internal sulfidation.
Inside surface

A n a m e t , i n c HAYWARD, CALIFORNIA Report No. 5004.7920 B Page 73
(a) Spectrum from specimen E-017-A
Element Wt% Wt% Sigma Atomic %O 8.46 0.37 20.05Al 0.30 0.07 0.42S 34.87 0.22 41.24Mn 0.33 0.06 0.23Fe 56.04 0.29 38.06
(b) Semi-quantitative analysis results for spectrum from specimen E-017B-A
(c) Spectrum from sample E-030B
Element Weight%
Weight%
Atomic%
Sigma O 4.68 0.36 12.04 S 32.23 0.22 41.41 Mn 0.63 0.08 0.47 Fe 62.47 0.30 46.08
(d) Semi-quantitative analysis results for spectrum from specimen E-030B Figure 54 EDS spectra and semi-quantitative analysis results for specimens E-017B-A
scraped from the inside surface of the ruptured section and E-030B scraped from the inside surface of the 8-inch 4-sidecut sample E-030B.

A n a m e t , i n c HAYWARD, CALIFORNIA Report No. 5004.7920 B Page 74
(a) Spectrum from specimen E-069B
Element Weight% Weight% Atomic% Sigma O 3.02 0.58 7.95 S 33.63 0.38 44.21 Mn 0.43 0.14 0.33 Fe 62.92 0.50 47.50 Totals 100.00
(b) Semi-quantitative analysis results for spectrum from specimen E-069B
(c) Spectrum from specimen I
Element Wt% Wt% Sigma
Atomic %
O 17.94 0.39 37.13S 32.27 0.21 33.33Mn 0.47 0.06 0.28Fe 49.32 0.28 29.25
(d) Semi-quantitative analysis results for spectrum from specimen I Figure 55 EDS spectra and semi-quantitative EDS results for specimens E-069B scraped
from the inside surface of 12-inch 4-sidecut sample E-069B and 2011 12-inch sample I.

A n a m e t , i n c HAYWARD, CALIFORNIA Report No. 5004.7920 B Page 75
(a)
(b)
(c) Figure 56 Representative EDS spectra from the inside surface of specimen E-017-1 near the
rupture edge.

A n a m e t , i n c HAYWARD, CALIFORNIA Report No. 5004.7920 B Page 76
(a) Backscatter electron image (b) Iron dot map
(c) Sulfur dot map (d) Oxygen dot map
(e) Figure 57 EDS dot maps and total map spectrum from polished specimen E-023B.
Epoxy mount
Inside surface scale
Steel

A n a m e t , i n c HAYWARD, CALIFORNIA Report No. 5004.7920 B Page 77
(a)
(b)
Figure 58 SEM micrographs of the rupture edge of sample E-017-1 after cleaning in
Micro90™ with ultrasonic agitation.

A n a m e t , i n c HAYWARD, CALIFORNIA Report No. 5004.7920 B Page 78
(a)
(b) Boxed area in (a)
Figure 59 SEM micrographs of the ruptured edge of sample E-017-1 after cleaning in dilute
Branson OR™ with ultrasonic agitation.

A n a m e t , i n c HAYWARD, CALIFORNIA Report No. 5004.7920 B Page 79
Appendix A
8-inch 4-sidecut isometric drawing Courtesy of BakerRisk and the CSB
Boxed area shown on next page

A n a m e t , i n c HAYWARD, CALIFORNIA Report No. 5004.7920 B Page 80
Appendix A, continued
(Boxed area in on previous page and Table 2 reproduced for reference)
8-inch Pipe Measured Wall Thickness A (Nominal wall thickness of 8-inch Schedule 40 is 0.322-inch.)
Sample
0° (in)
90° (in)
180° (in)
270° (in)
E-022B 0.236 0.184 0.245 0.229 E-023AB 0.082 0.088 0.113 0.068 E-023B 0.240 0.258 0.225 0.240 E-028B 0.192 0.205 0.196 0.208 E-030B 0.218 0.172 0.278 0.236 E-034B 0.306 0.319 0.279 0.320
A Measurements taken with calipers after cleaning inside and outside surfaces with a wire brush. B Measurements taken on the end of the ruptured section joined to the 30° elbow (Figure 24b).

A n a m e t , i n c HAYWARD, CALIFORNIA Report No. 5004.7920 B Page 81
Appendix B
12-inch 4-sidecut isometric drawing Courtesy of BakerRisk and the CSB
Boxed area shown on next page

A n a m e t , i n c HAYWARD, CALIFORNIA Report No. 5004.7920 B Page 82
Appendix B, continued
(Boxed area on previous page)
12-inch Pipe Measured Wall Thickness A (Nominal wall thickness of 12-inch Schedule 40 is 0.406-inch.)
Sample
0° (in)
90° (in)
180° (in)
270° (in)
E-059B 0.429 0.433 0.428 0.421 E-061B 0.432 0.435 0.445 0.440 E-063AB 0.262 0.261 0.268 0.244 E-069B 0.426 0.411 0.413 0.413 E-072B 0.240 0.220 0.244 0.228
A Measurements taken with calipers after cleaning inside and outside surfaces with a wire brush.

A n a m e t , i n c HAYWARD, CALIFORNIA Report No. 5004.7920 B Page 83
Appendix C
View of rupture model created by 3D Scan Services, LLC Courtesy of the CSB

A n a m e t , i n c HAYWARD, CALIFORNIA Report No. 5004.7920 B Page 84
Appendix D
XRD results 8-inch and 12-inch side –cut samples

A n a m e t , i n c HAYWARD, CALIFORNIA Report No. 5004.7920 B Page 85
Appendix D
XRD results 8-inch and 12-inch side –cut samples

A n a m e t , i n c HAYWARD, CALIFORNIA Report No. 5004.7920 B Page 86
Appendix D
XRD results 8-inch and 12-inch side –cut samples

A n a m e t , i n c HAYWARD, CALIFORNIA Report No. 5004.7920 B Page 87
Appendix D
XRD results 8-inch and 12-inch side –cut samples

A n a m e t , i n c HAYWARD, CALIFORNIA Report No. 5004.7920 B Page 88
Appendix D
XRD results 8-inch and 12-inch side –cut samples

A n a m e t , i n c HAYWARD, CALIFORNIA Report No. 5004.7920 B Page 89
Appendix D
XRD results 8-inch and 12-inch side –cut samples

A n a m e t , i n c HAYWARD, CALIFORNIA Report No. 5004.7920 B Page 90
Appendix D
XRD results 8-inch and 12-inch side –cut samples

A n a m e t , i n c HAYWARD, CALIFORNIA Report No. 5004.7920 B Page 91
Appendix D
XRD results 8-inch and 12-inch side –cut samples

A n a m e t , i n c HAYWARD, CALIFORNIA Report No. 5004.7920 B Page 92
Appendix D
XRD results 8-inch and 12-inch side –cut samples

A n a m e t , i n c HAYWARD, CALIFORNIA Report No. 5004.7920 B Page 93
Appendix D
XRD results 8-inch and 12-inch side –cut samples

A n a m e t , i n c HAYWARD, CALIFORNIA Report No. 5004.7920 B Page 94
Appendix D
XRD results 8-inch and 12-inch side –cut samples

A n a m e t , i n c HAYWARD, CALIFORNIA Report No. 5004.7920 B Page 95
Appendix D
XRD results 8-inch and 12-inch side –cut samples

A n a m e t , i n c HAYWARD, CALIFORNIA Report No. 5004.7920 B Page 96
Appendix D
XRD results 8-inch and 12-inch side –cut samples

A n a m e t , i n c HAYWARD, CALIFORNIA Report No. 5004.7920 B Page 97
Appendix D
XRD results 8-inch and 12-inch side –cut samples

A n a m e t , i n c HAYWARD, CALIFORNIA Report No. 5004.7920 B Page 98
Appendix E
XRD results E-017 and 2011 12-inch samples.

A n a m e t , i n c HAYWARD, CALIFORNIA Report No. 5004.7920 B Page 99
Appendix E
XRD results E-017 and 2011 12-inch samples.
*Upstream elbow of sample E-017
*Ruptured section of sample E-017
*Notes added by Anamet for clarification of specimen origin

A n a m e t , i n c HAYWARD, CALIFORNIA Report No. 5004.7920 B Page 100
Appendix E
XRD results E-017 and 2011 12-inch samples.

A n a m e t , i n c HAYWARD, CALIFORNIA Report No. 5004.7920 B Page 101
Appendix E
XRD results E-017 and 2011 12-inch samples.

A n a m e t , i n c HAYWARD, CALIFORNIA Report No. 5004.7920 B Page 102
Appendix E
XRD results E-017 and 2011 12-inch samples.

A n a m e t , i n c HAYWARD, CALIFORNIA Report No. 5004.7920 B Page 103
Appendix E
XRD results E-017 and 2011 12-inch samples.

A n a m e t , i n c HAYWARD, CALIFORNIA Report No. 5004.7920 B Page 104
Appendix E
XRD results E-017 and 2011 12-inch samples.

A n a m e t , i n c HAYWARD, CALIFORNIA Report No. 5004.7920 B Page 105
Appendix E
XRD results E-017 and 2011 12-inch samples.

A n a m e t , i n c HAYWARD, CALIFORNIA Report No. 5004.7920 B Page 106
Appendix E
XRD results E-017 and 2011 12-inch samples.

A n a m e t , i n c HAYWARD, CALIFORNIA Report No. 5004.7920 B Page 107
Appendix E
XRD results E-017 and 2011 12-inch samples.