metu chem. eng. dept. ch.e. 410 chem. eng. lab ii ...users.metu.edu.tr/cates/files/manuals/che 410...
TRANSCRIPT
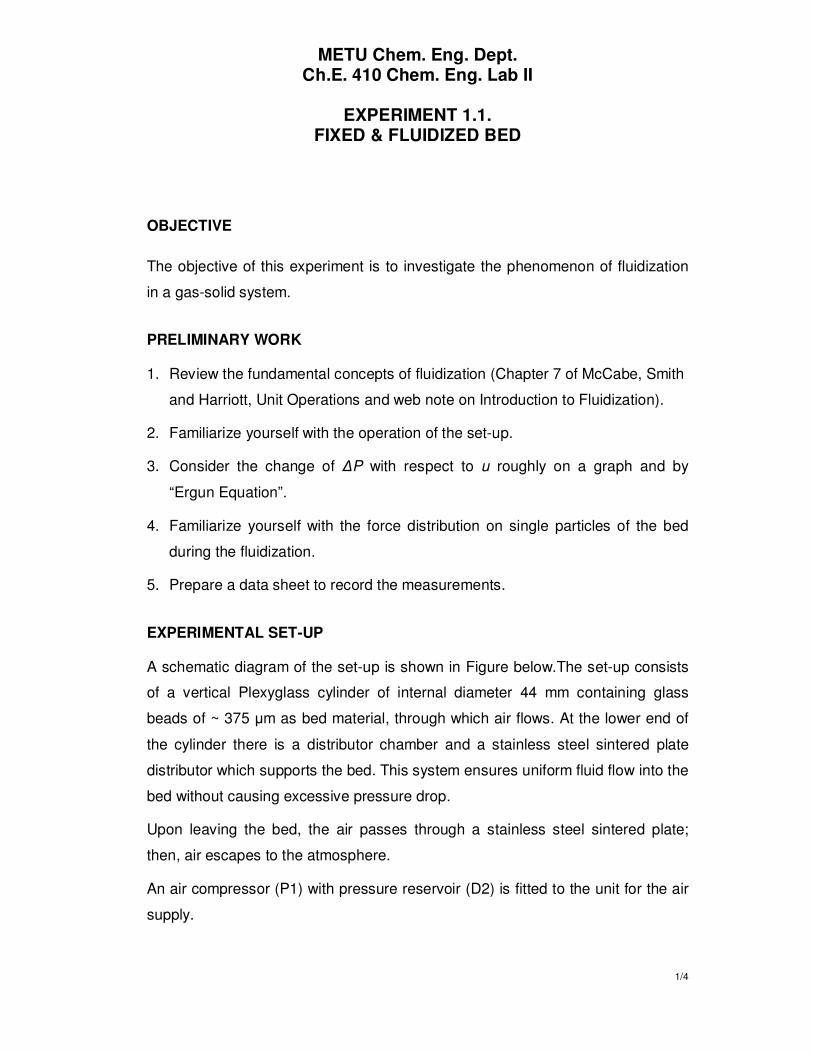
METU Chem. Eng. Dept. Ch.E. 410 Chem. Eng. Lab II
EXPERIMENT 1.1.
FIXED & FLUIDIZED BED
1/4
OBJECTIVE
The objective of this experiment is to investigate the phenomenon of fluidization
in a gas-solid system.
PRELIMINARY WORK
1. Review the fundamental concepts of fluidization (Chapter 7 of McCabe, Smith
and Harriott, Unit Operations and web note on Introduction to Fluidization).
2. Familiarize yourself with the operation of the set-up.
3. Consider the change of ∆P with respect to u roughly on a graph and by
“Ergun Equation”.
4. Familiarize yourself with the force distribution on single particles of the bed
during the fluidization.
5. Prepare a data sheet to record the measurements.
EXPERIMENTAL SET-UP
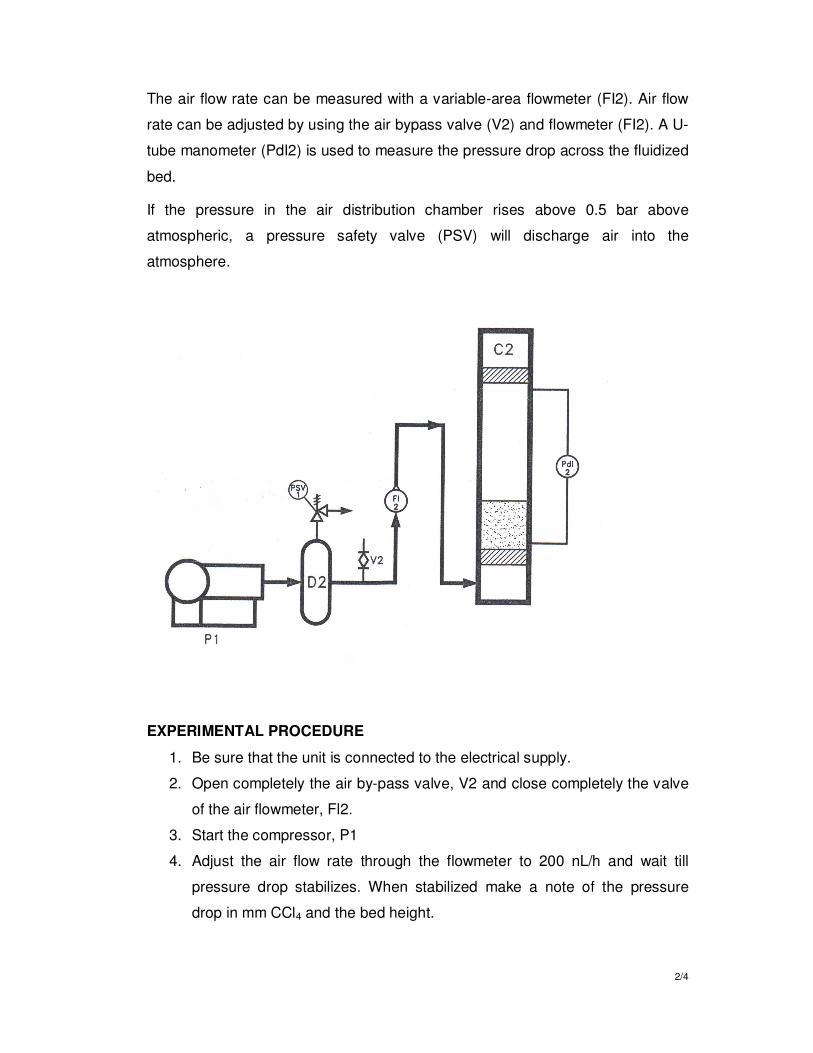
A schematic diagram of the set-up is shown in Figure below.The set-up consists
of a vertical Plexyglass cylinder of internal diameter 44 mm containing glass
beads of ~ 375 µm as bed material, through which air flows. At the lower end of
the cylinder there is a distributor chamber and a stainless steel sintered plate
distributor which supports the bed. This system ensures uniform fluid flow into the
bed without causing excessive pressure drop.
Upon leaving the bed, the air passes through a stainless steel sintered plate;
then, air escapes to the atmosphere.
An air compressor (P1) with pressure reservoir (D2) is fitted to the unit for the air
supply.
2/4
The air flow rate can be measured with a variable-area flowmeter (FI2). Air flow
rate can be adjusted by using the air bypass valve (V2) and flowmeter (FI2). A U-
tube manometer (PdI2) is used to measure the pressure drop across the fluidized
bed.
If the pressure in the air distribution chamber rises above 0.5 bar above
atmospheric, a pressure safety valve (PSV) will discharge air into the
atmosphere.
EXPERIMENTAL PROCEDURE
1. Be sure that the unit is connected to the electrical supply.
2. Open completely the air by-pass valve, V2 and close completely the valve
of the air flowmeter, Fl2.
3. Start the compressor, P1
4. Adjust the air flow rate through the flowmeter to 200 nL/h and wait till
pressure drop stabilizes. When stabilized make a note of the pressure
drop in mm CCl4 and the bed height.
3/4
5. Increase the air flow rate with increments of 100 nL/h up to 500 nL/h and
following the stabilization period record pressure drop and bed height for
each flow rate.
6. From 500 nL/h onwards increase the flow rate through the flowmeter with
increments of 20 nL/h up to 900 nL/h by decreasing the flow through the
by-pass valve and repeat the recording in step 5.
7. From 900 nL/h to 1600 nL/h increase the air flow rate with increments of
100 nL/h and repeat the recordings in step 5.
8. During the steps given above observe the first movement of particles, first
formation of bubbles and growing bubbles.
9. Decrease the air flow rate to 200 nL/h with the same increments
suggested above and keep on recording the two parameters.
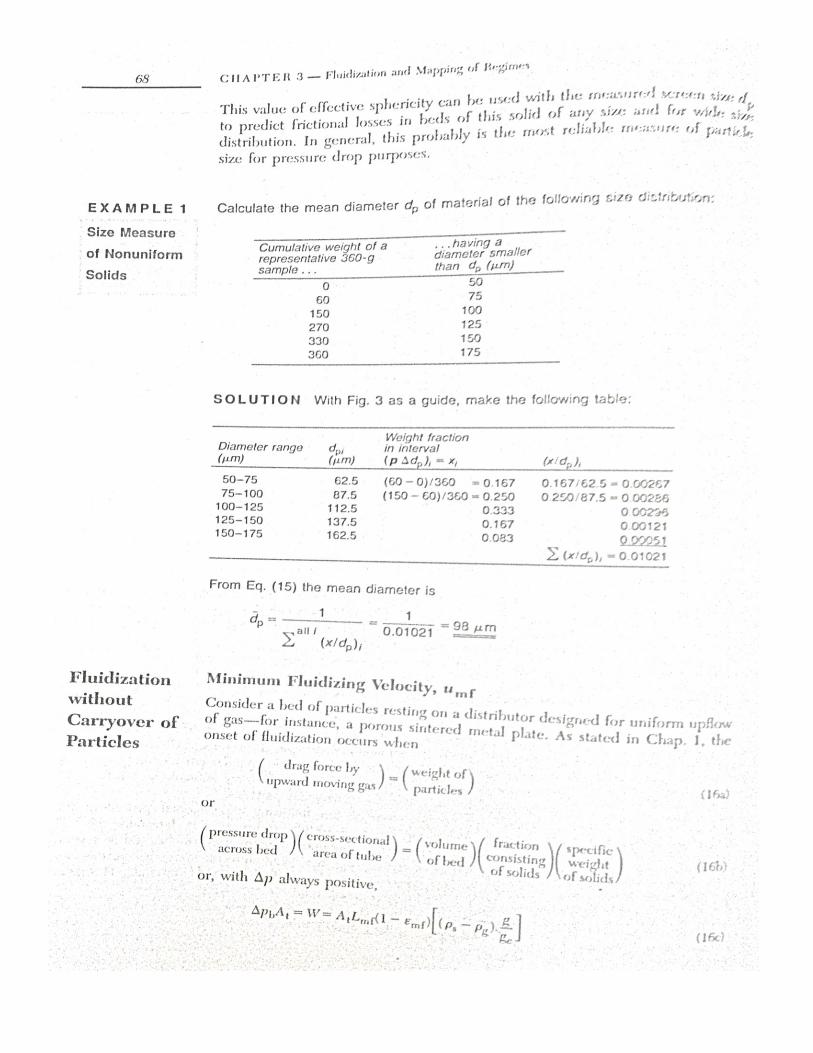
CALCULATIONS
1. Tabulate fluidization velocity, pressure drop and bed height measured at
each air flow rate.
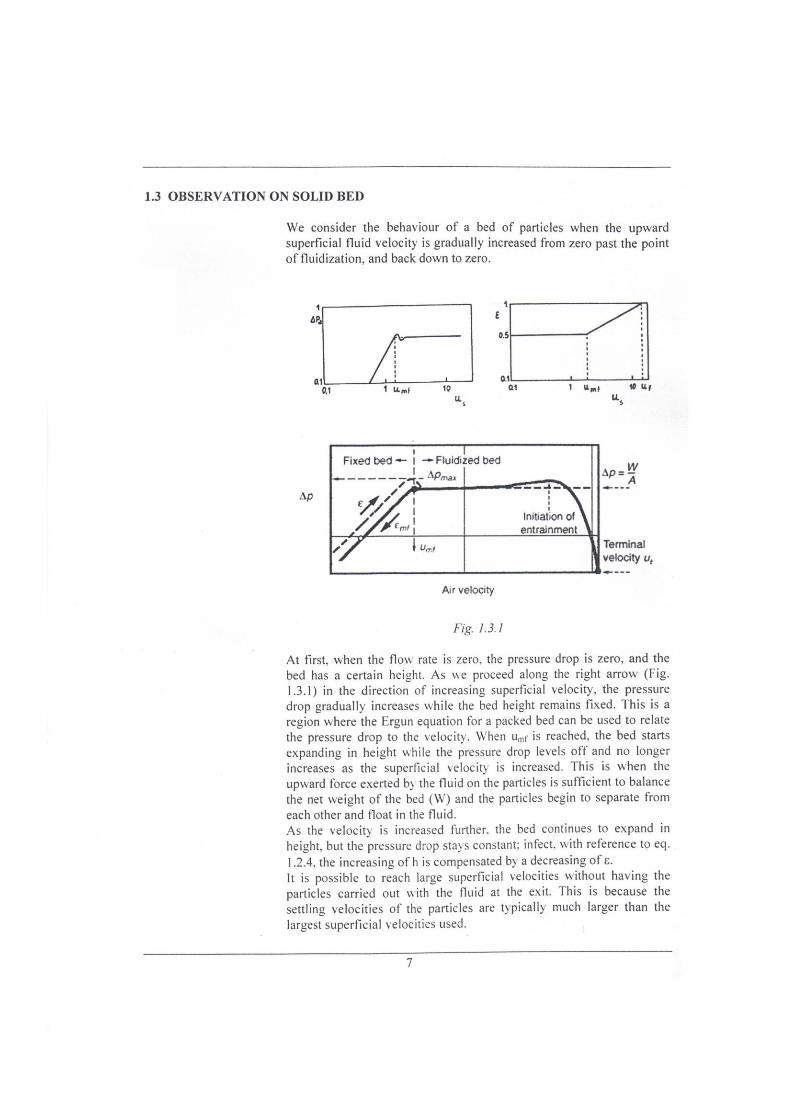
2. Draw the pressure drop (mm H2O) versus fluidization velocity (cm/s) curve
for both increasing and decreasing air flow rates by using the recorded
data and the bed bulk density, 1.5 g/cm3.
3. Plot the variation of bed height against the fluidization velocity and
comment on the variation.
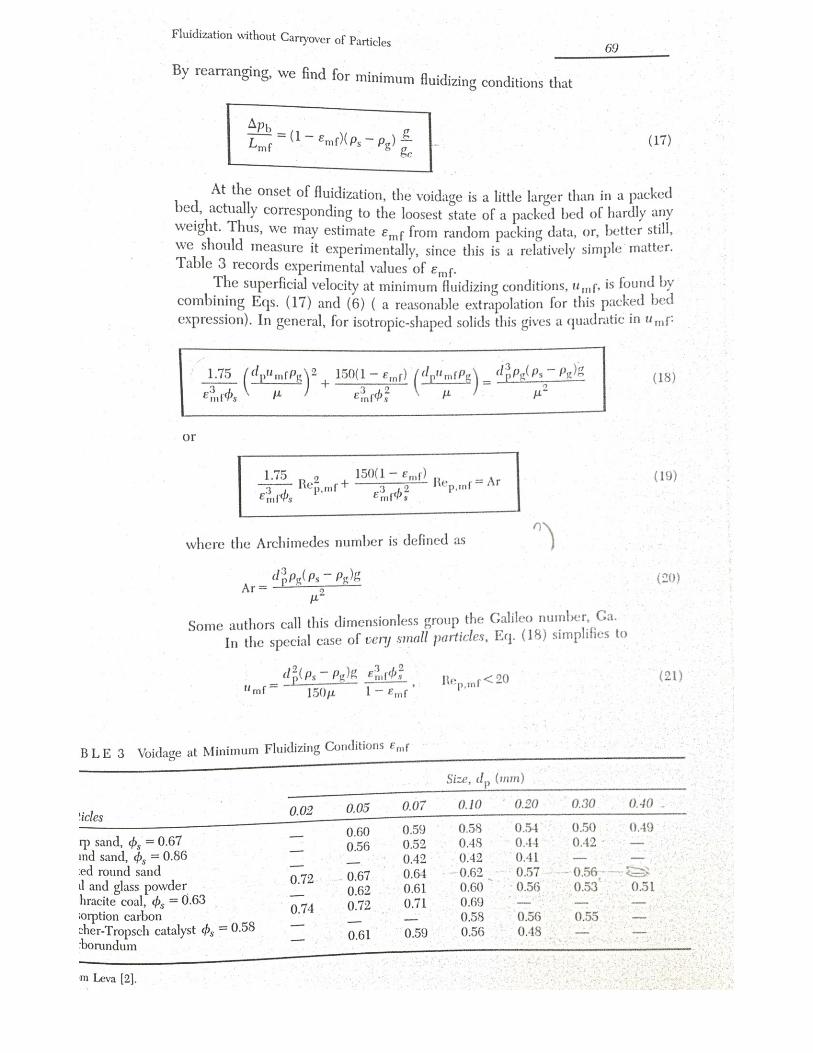
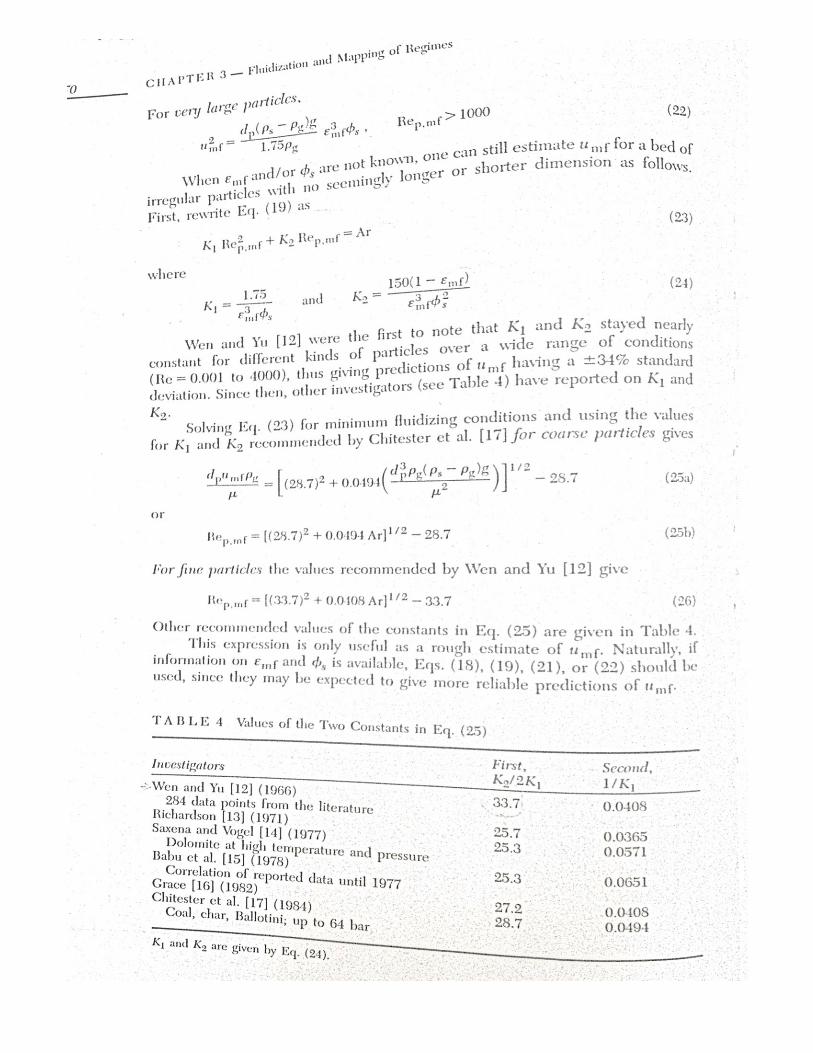
4. Determine the minimum fluidization velocity by using the experimental
data.
5. Calculate the theoretical minimum fluidization velocity and compare it with
the experimental one. Discuss your findings.
SUGGESTED READING
1. McCabe, W.L.,.Smith, J.C and Harriott P., "Unit Operations of Chemical
Engineering", 7th ed., McGraw Hill, N.Y., 2005, Ch.7.
2. Kunii, D. and Levenspiel, O.,”Fluidization Engineering”, 2nd ed.,
Butterworth-Heinemann, 1991, Ch.3.
3. Web Note on Introduction to Fluidization.