mexico - iuj.ac.jp · country profile 2000 mexico this country profile is a reference tool, which...
TRANSCRIPT
COUNTRY PROFILE 2000
MexicoThis Country Profile is a reference tool, which providesanalysis of historical political, infrastructural and economictrends. It is revised and updated annually. The EIU’squarterly Country Reports analyse current trends andprovide a two-year forecast
The full publishing schedule for Country Profiles is nowavailable on our website at http://www.eiu.com/schedule
The Economist Intelligence Unit15 Regent St, London SW1Y 4LRUnited Kingdom

The Economist Intelligence UnitThe Economist Intelligence Unit is a specialist publisher serving companies establishing and managingoperations across national borders. For over 50 years it has been a source of information on businessdevelopments, economic and political trends, government regulations and corporate practice worldwide.
The EIU delivers its information in four ways: through subscription products ranging from newsletters toannual reference works; through specific research reports, whether for general release or for particularclients; through electronic publishing; and by organising conferences and roundtables. The firm is amember of The Economist Group.
LondonThe Economist Intelligence Unit15 Regent StLondonSW1Y 4LRUnited KingdomTel: (44.20) 7830 1000Fax: (44.20) 7499 9767E-mail: [email protected]
New YorkThe Economist Intelligence UnitThe Economist Building111 West 57th StreetNew YorkNY 10019, USTel: (1.212) 554 0600Fax: (1.212) 586 1181/2E-mail: [email protected]
Hong KongThe Economist Intelligence Unit25/F, Dah Sing Financial Centre108 Gloucester RoadWanchaiHong KongTel: (852) 2802 7288Fax: (852) 2802 7638E-mail: [email protected]
Website: http://www.eiu.com
Electronic deliveryThis publication can now be viewed by subscribing online at http://store.eiu.com/brdes.html
Reports are also available in various other electronic formats, such as CD-ROM, Lotus Notes, on-linedatabases and as direct feeds to corporate intranets. For further information, please contact your nearestEconomist Intelligence Unit office
London: Jan Frost Tel: (44.20) 7830 1183 Fax: (44.20) 7830 1023New York: Alexander Bateman Tel: (1.212) 554 0600 Fax: (1.212) 586 1181Hong Kong: Amy Ha Tel: (852) 2802 7288/2585 3888 Fax: (852) 2802 7720/7638
Copyright© 2000 The Economist Intelligence Unit Limited. All rights reserved. Neither this publication norany part of it may be reproduced, stored in a retrieval system, or transmitted in any form or by anymeans, electronic, mechanical, photocopying, recording or otherwise, without the prior permissionof The Economist Intelligence Unit Limited.
All information in this report is verified to the best of the author's and the publisher's ability. However,the EIU does not accept responsibility for any loss arising from reliance on it.
ISSN 0269-5596
Symbols for tables“n/a” means not available; “–” means not applicable
Printed and distributed by Redhouse Press Ltd, Unit 151, Dartford Trade Park, Dartford, Kent DA1 1QB, UK
EIU Country Profile 2000 © The Economist Intelligence Unit Limited 2000
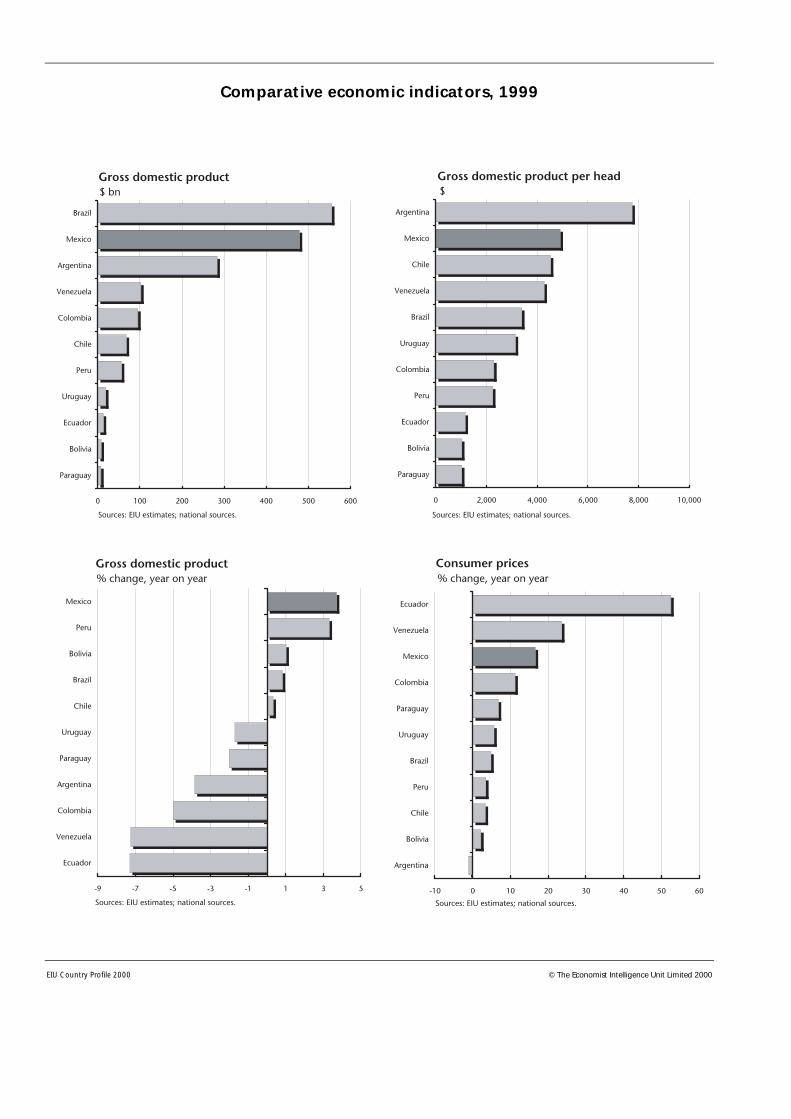
Comparative economic indicators, 1999
1
© The Economist Intelligence Unit Limited 2000 EIU Country Profile 2000
Contents
3 Basic data
4 Political background4 Historical background9 Constitution and institutions9 Political forces
11 International relations and defence
12 Resources and infrastructure12 Population13 Education14 Health14 Natural resources and the environment15 Transport and communications17 Energy provision
19 The economy19 Economic structure20 Economic policy24 Economic performance26 Regional trends
26 Economic sectors26 Agriculture, forestry and fishing28 Manufacturing30 Mining and semi-processing31 Construction31 Financial services34 Other services
35 The external sector35 Trade in goods38 Invisibles and the current account39 Capital flows and foreign debt42 Foreign reserves and the exchange rate
43 Appendices43 Sources of information45 Reference tables45 Population45 Labour force45 Unemployment rates in urban areas46 Crude oil and gas production46 Public-sector finances46 Federal government budget revenue and expenditure47 Money supply and credit47 Interest rates47 Gross domestic product48 Gross domestic product by sector48 Gross domestic product by expenditure48 Prices and earnings
April 25th 2000
2
EIU Country Profile 2000 © The Economist Intelligence Unit Limited 2000
49 Production of principal crops49 Livestock production49 Manufacturing production50 Minerals production50 Stockmarket indicators50 Merchandise sales50 Tourism51 Main exports and imports51 Main trading partners52 Direction and composition of trade, 199853 Balance of payments, national estimates53 Balance of payments, IMF estimates54 Total foreign investment54 External debt, World Bank estimates55 Gross external debt, national estimates55 Amortisation schedule of global external debt55 Foreign reserves56 Exchange rates
Mexico 3
© The Economist Intelligence Unit Limited 2000 EIU Country Profile 2000
Mexico
Basic data
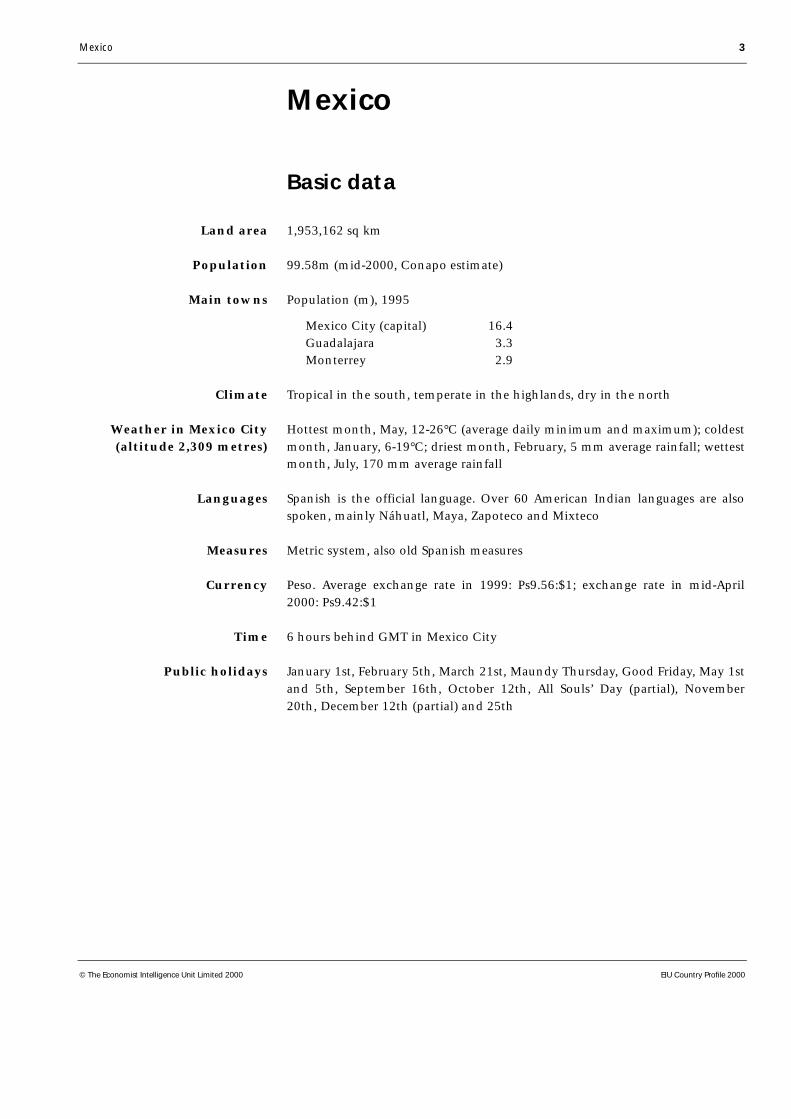
1,953,162 sq km
99.58m (mid-2000, Conapo estimate)
Population (m), 1995
Mexico City (capital) 16.4Guadalajara 3.3Monterrey 2.9
Tropical in the south, temperate in the highlands, dry in the north
Hottest month, May, 12-26°C (average daily minimum and maximum); coldestmonth, January, 6-19°C; driest month, February, 5 mm average rainfall; wettestmonth, July, 170 mm average rainfall
Spanish is the official language. Over 60 American Indian languages are alsospoken, mainly Náhuatl, Maya, Zapoteco and Mixteco
Metric system, also old Spanish measures
Peso. Average exchange rate in 1999: Ps9.56:$1; exchange rate in mid-April2000: Ps9.42:$1
6 hours behind GMT in Mexico City
January 1st, February 5th, March 21st, Maundy Thursday, Good Friday, May 1stand 5th, September 16th, October 12th, All Souls’ Day (partial), November20th, December 12th (partial) and 25th
Land area
Population
Main towns
Climate
Weather in Mexico City(altitude 2,309 metres)
Languages
Measures
Currency
Time
Public holidays
4 Mexico
EIU Country Profile 2000 © The Economist Intelligence Unit Limited 2000
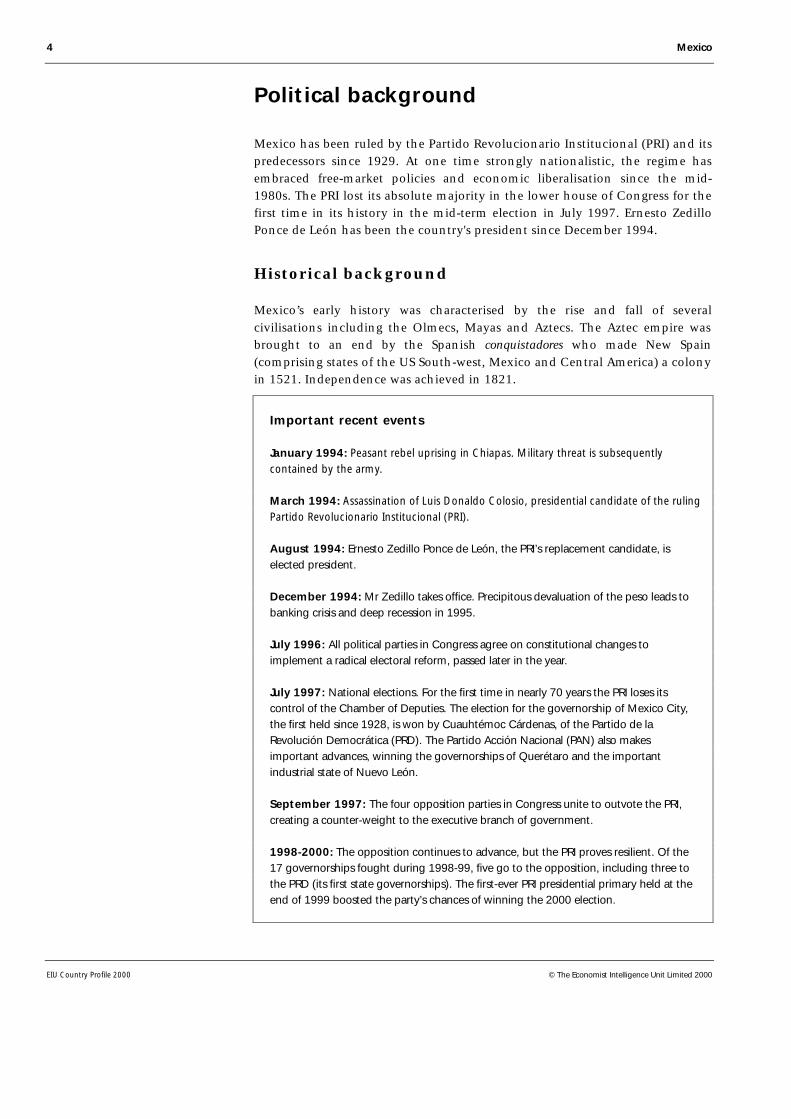
Political background
Mexico has been ruled by the Partido Revolucionario Institucional (PRI) and itspredecessors since 1929. At one time strongly nationalistic, the regime hasembraced free-market policies and economic liberalisation since the mid-1980s. The PRI lost its absolute majority in the lower house of Congress for thefirst time in its history in the mid-term election in July 1997. Ernesto ZedilloPonce de León has been the country's president since December 1994.
Historical background
Mexico’s early history was characterised by the rise and fall of severalcivilisations including the Olmecs, Mayas and Aztecs. The Aztec empire wasbrought to an end by the Spanish conquistadores who made New Spain(comprising states of the US South-west, Mexico and Central America) a colonyin 1521. Independence was achieved in 1821.
Important recent events
January 1994: Peasant rebel uprising in Chiapas. Military threat is subsequentlycontained by the army.
March 1994: Assassination of Luis Donaldo Colosio, presidential candidate of the rulingPartido Revolucionario Institucional (PRI).
August 1994: Ernesto Zedillo Ponce de León, the PRI’s replacement candidate, iselected president.
December 1994: Mr Zedillo takes office. Precipitous devaluation of the peso leads tobanking crisis and deep recession in 1995.
July 1996: All political parties in Congress agree on constitutional changes toimplement a radical electoral reform, passed later in the year.
July 1997: National elections. For the first time in nearly 70 years the PRI loses itscontrol of the Chamber of Deputies. The election for the governorship of Mexico City,the first held since 1928, is won by Cuauhtémoc Cárdenas, of the Partido de laRevolución Democrática (PRD). The Partido Acción Nacional (PAN) also makesimportant advances, winning the governorships of Querétaro and the importantindustrial state of Nuevo León.
September 1997: The four opposition parties in Congress unite to outvote the PRI,creating a counter-weight to the executive branch of government.
1998-2000: The opposition continues to advance, but the PRI proves resilient. Of the17 governorships fought during 1998-99, five go to the opposition, including three tothe PRD (its first state governorships). The first-ever PRI presidential primary held at theend of 1999 boosted the party’s chances of winning the 2000 election.
Mexico 5
© The Economist Intelligence Unit Limited 2000 EIU Country Profile 2000
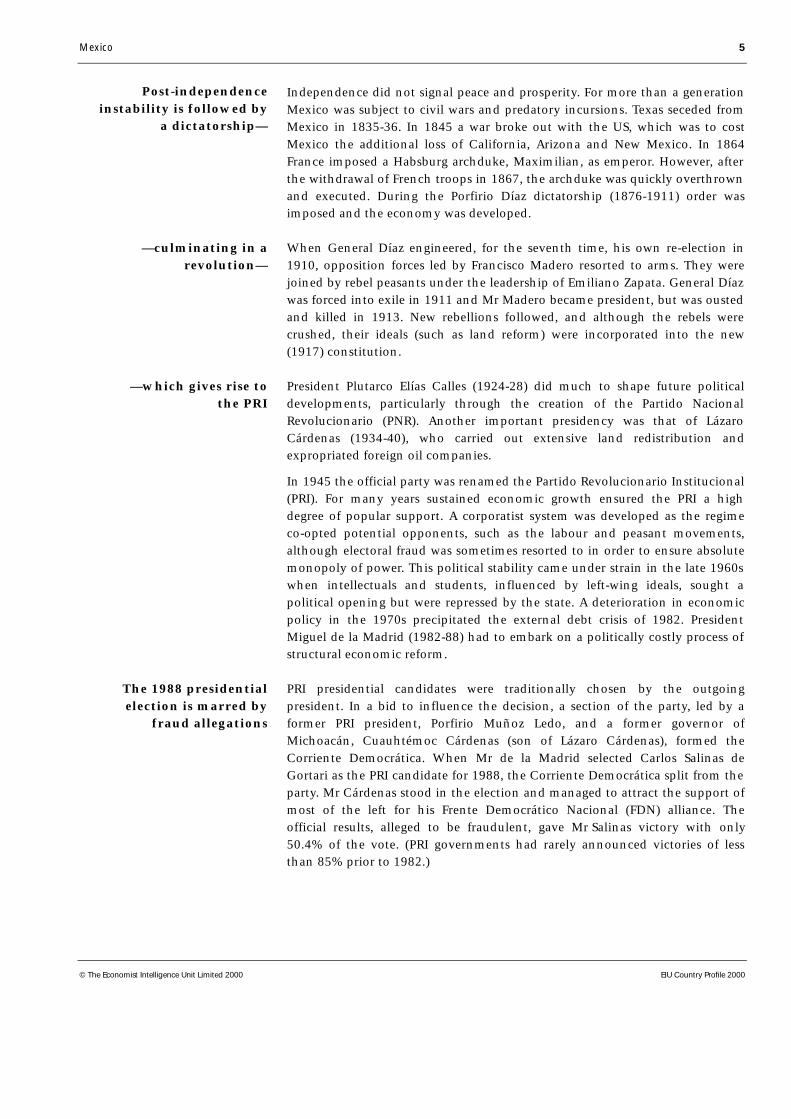
Independence did not signal peace and prosperity. For more than a generationMexico was subject to civil wars and predatory incursions. Texas seceded fromMexico in 1835-36. In 1845 a war broke out with the US, which was to costMexico the additional loss of California, Arizona and New Mexico. In 1864France imposed a Habsburg archduke, Maximilian, as emperor. However, afterthe withdrawal of French troops in 1867, the archduke was quickly overthrownand executed. During the Porfirio Díaz dictatorship (1876-1911) order wasimposed and the economy was developed.
When General Díaz engineered, for the seventh time, his own re-election in1910, opposition forces led by Francisco Madero resorted to arms. They werejoined by rebel peasants under the leadership of Emiliano Zapata. General Díazwas forced into exile in 1911 and Mr Madero became president, but was oustedand killed in 1913. New rebellions followed, and although the rebels werecrushed, their ideals (such as land reform) were incorporated into the new(1917) constitution.
President Plutarco Elías Calles (1924-28) did much to shape future politicaldevelopments, particularly through the creation of the Partido NacionalRevolucionario (PNR). Another important presidency was that of LázaroCárdenas (1934-40), who carried out extensive land redistribution andexpropriated foreign oil companies.
In 1945 the official party was renamed the Partido Revolucionario Institucional(PRI). For many years sustained economic growth ensured the PRI a highdegree of popular support. A corporatist system was developed as the regimeco-opted potential opponents, such as the labour and peasant movements,although electoral fraud was sometimes resorted to in order to ensure absolutemonopoly of power. This political stability came under strain in the late 1960swhen intellectuals and students, influenced by left-wing ideals, sought apolitical opening but were repressed by the state. A deterioration in economicpolicy in the 1970s precipitated the external debt crisis of 1982. PresidentMiguel de la Madrid (1982-88) had to embark on a politically costly process ofstructural economic reform.
PRI presidential candidates were traditionally chosen by the outgoingpresident. In a bid to influence the decision, a section of the party, led by aformer PRI president, Porfirio Muñoz Ledo, and a former governor ofMichoacán, Cuauhtémoc Cárdenas (son of Lázaro Cárdenas), formed theCorriente Democrática. When Mr de la Madrid selected Carlos Salinas deGortari as the PRI candidate for 1988, the Corriente Democrática split from theparty. Mr Cárdenas stood in the election and managed to attract the support ofmost of the left for his Frente Democrático Nacional (FDN) alliance. Theofficial results, alleged to be fraudulent, gave Mr Salinas victory with only50.4% of the vote. (PRI governments had rarely announced victories of lessthan 85% prior to 1982.)
The 1988 presidentialelection is marred by
fraud allegations
Post-independenceinstability is followed by
a dictatorship—
—culminating in arevolution—
—which gives rise tothe PRI
6 Mexico
EIU Country Profile 2000 © The Economist Intelligence Unit Limited 2000
President Salinas (1988-94) restructured the economy and recognised someelectoral gains by the opposition, such as governorships (monopolised untilthen by the PRI). The uprising in Chiapas of the Ejército Zapatista deLiberación Nacional (EZLN, the Zapatista National Liberation Army) in January1994 highlighted the fact that, despite economic progress, social tensions weremounting. Consequently, as well as negotiating with the EZLN, thegovernment enacted a comprehensive electoral reform, which included thegranting of autonomy to the Instituto Federal Electoral (the electoral authority)and other measures to diminish the possibility of electoral fraud.
The elections of August 1994 were the most transparent to date. Ernesto ZedilloPonce de León of the PRI won the presidential contest with 50.2% of all validvotes cast. Diego Fernández de Cevallos of the right-wing Partido AcciónNacional (PAN) polled 26.7%. Mr Cárdenas, who stood for the left-wing Partidode la Revolución Democrática (PRD), took 17.1% of the vote. In Congress thePRI held on to its majority, but it lost seats to both the PAN and the PRD.
Mr Zedillo (1994-2000) continued the process of political change. Progress onelectoral reform was slow, but a breakthrough was finally achieved in July 1996when representatives of all the parties in Congress—the PRI, the PAN, the PRDand the left-wing Partido del Trabajo (PT)—agreed to new election rules andapproved the necessary constitutional changes. However, the specificlegislation was approved by the PRI alone, because of disagreements over thelevel of public funding that political parties are allowed and restrictions placedon forming political coalitions. The government rejected the opposition’sattempts to modify the electoral law in time for the 2000 contest, making itimpossible for a last-minute coalition to be forged to stand against the PRI.
The new rules were tried for the first time in the 1997 mid-term congressionalelection. The governorships of six states and Mexico City were also disputed.For the first time in almost 70 years the PRI lost its majority in the Chamber ofDeputies. The most important gains were made by the PRD, which became thesecond most important force in the new Congress and won the governorshipof Mexico City. The PAN also won congressional seats and the governorships ofNuevo León and Querétaro (thus controlling six of the 31 states).
The four opposition parties that gained seats in the Chamber of Deputies inJuly 1997 united to control the Chamber but the alliance has proved fragile.The PAN and the PRD are too far apart ideologically for a formal coalition,although on some issues they provide a counter-weight to the powerfulpresident. Some opposition deputies defected to the PRI at the end of 1999 andin the first quarter of 2000.
Now that the economic crisis has passed, the PRI remains a popular choice,although the PAN and the PRD have made important gains. Of the 17governorships contested during 1998-99, 12 were won by the PRI, one by thePAN, three by the PRD (each of them in former PRI strongholds and withestranged PRI members as candidates) and one by a rainbow coalition headedby PAN and PRD. Thus, by the beginning of 2000 the opposition held the
Reforms acceleratein response to unrest
in 1994—
—when further importantelections are held
Patchy progress onpolitical reform in 1995
and 1996—
—brought important gainsfor the opposition in 1997
A multiparty democracy isemerging
Mexico 7
© The Economist Intelligence Unit Limited 2000 EIU Country Profile 2000
governorship of 10 states. Confidence in clean elections has increased, andcandidates and regional issues have become more important.
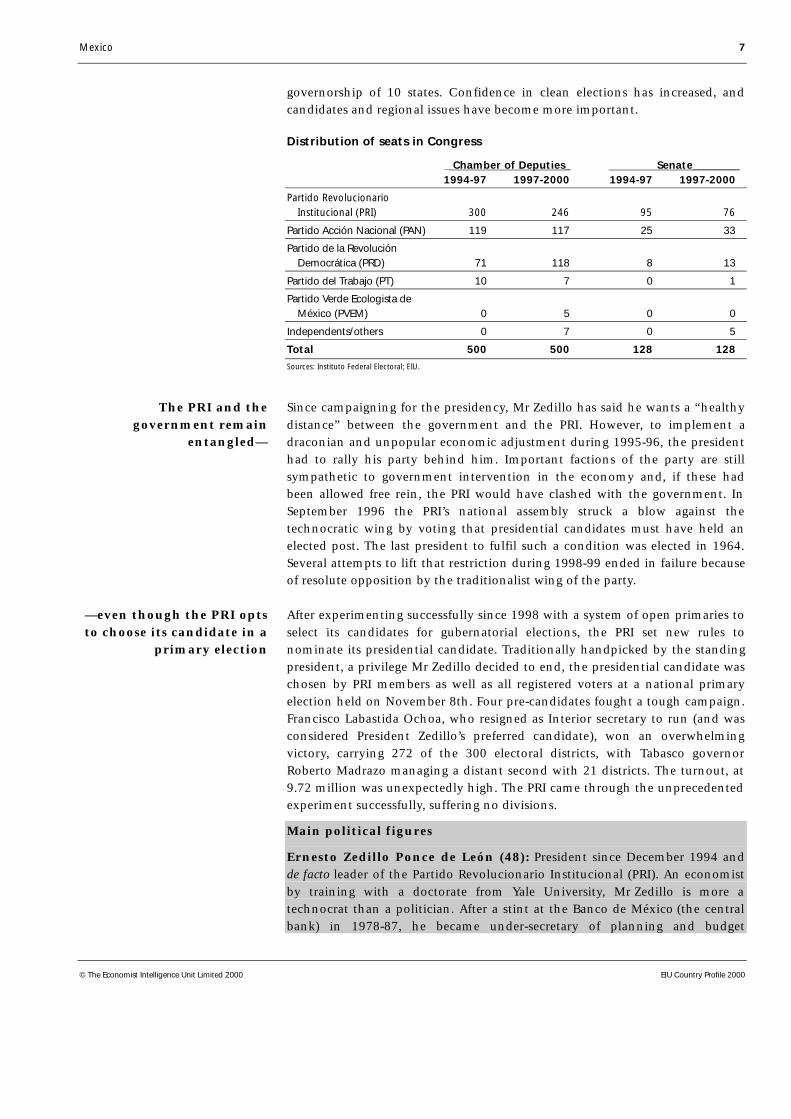
Distribution of seats in Congress
_ Chamber of Deputies_ Senate_________1994-97 1997-2000 1994-97 1997-2000
Partido Revolucionario Institucional (PRI) 300 246 95 76
Partido Acción Nacional (PAN) 119 117 25 33
Partido de la Revolución Democrática (PRD) 71 118 8 13
Partido del Trabajo (PT) 10 7 0 1
Partido Verde Ecologista de México (PVEM) 0 5 0 0
Independents/others 0 7 0 5
Total 500 500 128 128
Sources: Instituto Federal Electoral; EIU.
Since campaigning for the presidency, Mr Zedillo has said he wants a “healthydistance” between the government and the PRI. However, to implement adraconian and unpopular economic adjustment during 1995-96, the presidenthad to rally his party behind him. Important factions of the party are stillsympathetic to government intervention in the economy and, if these hadbeen allowed free rein, the PRI would have clashed with the government. InSeptember 1996 the PRI’s national assembly struck a blow against thetechnocratic wing by voting that presidential candidates must have held anelected post. The last president to fulfil such a condition was elected in 1964.Several attempts to lift that restriction during 1998-99 ended in failure becauseof resolute opposition by the traditionalist wing of the party.
After experimenting successfully since 1998 with a system of open primaries toselect its candidates for gubernatorial elections, the PRI set new rules tonominate its presidential candidate. Traditionally handpicked by the standingpresident, a privilege Mr Zedillo decided to end, the presidential candidate waschosen by PRI members as well as all registered voters at a national primaryelection held on November 8th. Four pre-candidates fought a tough campaign.Francisco Labastida Ochoa, who resigned as Interior secretary to run (and wasconsidered President Zedillo’s preferred candidate), won an overwhelmingvictory, carrying 272 of the 300 electoral districts, with Tabasco governorRoberto Madrazo managing a distant second with 21 districts. The turnout, at9.72 million was unexpectedly high. The PRI came through the unprecedentedexperiment successfully, suffering no divisions.
Main political figures
Ernesto Zedillo Ponce de León (48): President since December 1994 andde facto leader of the Partido Revolucionario Institucional (PRI). An economistby training with a doctorate from Yale University, Mr Zedillo is more atechnocrat than a politician. After a stint at the Banco de México (the centralbank) in 1978-87, he became under-secretary of planning and budget
The PRI and thegovernment remain
entangled—
—even though the PRI optsto choose its candidate in a
primary election
8 Mexico
EIU Country Profile 2000 © The Economist Intelligence Unit Limited 2000
(1987-88). In the Salinas administration he was secretary of planning andbudget (1988-92) and education (1992-93). Manager of the presidentialcampaign of Luis Donaldo Colosio, Mr Zedillo was nominated in his placewhen he was assassinated. After a mismanaged devaluation in the first weeks ofhis administration, he demonstrated considerable political nerve and couragein dealing with subsequent financial and political crises. He was able to couplea draconian economic adjustment with a radical electoral reform, and hasmanaged to govern effectively while dealing with an opposition-dominatedCongress.
Francisco Labastida Ochoa (57): Became the PRI presidential nomineeafter wining convincingly in the November 1999 open primary. An economist,he has a long experience in the high echelons of government at federal andstate levels. In the cabinet he has held the interior (1998-99), agriculture(1995-98) and energy (1982-86) portfolios. He was governor of Sinaloa (1986-92) and ambassador to Portugal (1993-94). Despite being short of charisma,and his lack of resounding success during his tenure as interior secretary(including an inability effectively to counter the Zapatista movement), he isseen as a safe pair of hands who would govern effectively.
Esteban Moctezuma Barragán (46): Secretary-general of the PRI. Aneconomist who pursued graduate studies in the United Kingdom and Japan, hehas a long career in public service. Mr Moctezuma has forged close workingand personal relationships with both Mr Labastida (in the local government ofSinaloa) and Mr Zedillo (at the planning and budget and the educationministries). During the first months of the Zedillo administration he wasinterior secretary. He resigned after a short spell apparently owing to pressurefrom PRI hardliners. He was elected Senator in 1997, and in 1998 wasappointed social development secretary. He resigned from the cabinet to runthe Labastida campaign in 1999, and would occupy a leading political oreconomic position in the government if the PRI won the presidential election.
Cuauhtémoc Cárdenas Solórzano (66): Alliance for Mexico presidentialcandidate. Elected governor of Mexico City for 1997-2000, Mr Cárdenasresigned from that post to run for the third time for the presidency. He is theundisputed moral leader of the Partido de la Revolución Democrática (PRD). Asa PRI member he was senator (1976), under-secretary of agriculture (1976-80)and governor of Michoacán (1980-86). His main political asset appeared to bethat his father was Lázaro Cárdenas, a revered former president. When he leftthe PRI to run for president in 1988, he successfully united what had been afragmented left-wing opposition. After he lost an election marred by fraud, hisstature diminished during the Salinas administration and he achieved onlythird place in a relatively clean election in 1994. Making an impressivecomeback, he won the Mexico City election by a landslide. However, hislacklustre performance as governor and an inability to appeal to centrist votershave eliminated any chances he had of winning the presidency, despite beingsupported by a five-party coalition headed by the PRD. It is unclear howleft-wing political parties will evolve after his defeat, as for more than a decadeMr Cárdenas has dominated the left-of-centre political scene.

Mexico 9
© The Economist Intelligence Unit Limited 2000 EIU Country Profile 2000
Vicente Fox Quesada (57): PAN and PVEM presidential candidate. Electedgovernor of Guanajuato in 1995, he has been campaigning for president foralmost three years (he officially resigned as governor in 1999). His declared aimof wresting the presidency from the PRI has made him a national figure. Abusinessman with a successful career at the Mexican subsidiary of Coca-Cola(he has a degree in business administration), Mr Fox joined the Partido AcciónNacional (PAN) relatively late in life, becoming congressman for Guanajuatoonly in 1988. His charismatic campaigning has been undermined by simplisticremarks and messianic postures, but his solid record as governor shows that hecan be an efficient executive. He is considered the only realistic option by anti-PRI voters. He is not popular among the leaders of his own party, but was ableto circumvent this by building a powerful parallel political movement. He wasalso nominated presidential candidate by the green Partido Verde Ecologista deMéxico (PVEM).
Constitution and institutions
The constitution of 1917, which is still in force, was a far more “social”document than that written in 1857. Apart from subordinating the rights ofprivate property to the public interest and making specific provision for landreform, it stressed the rights of labour. It also “nationalised” the church, greatlycurtailing the power and influence of the clergy.
The constitution established the framework for a federal system ofgovernment, which covers 31 states and the Federal District, and provided forthe separation of executive, legislative and judicial powers. In practice,government has been centralised and the president has had far greater powersthan Congress and considerable influence over the judiciary.
Congress consists of the Senate and the Chamber of Deputies. Senators servefor six years and deputies for three years. In the Chamber of Deputies 300 seatsare allocated on the first-past-the-post system and 200 by proportional repre-sentation. Reforms approved by Congress in 1996 made it easier for a singleparty to gain a working majority in Congress but harder to have the two-thirdmajority necessary to change the Constitution.
The most important political post in the cabinet is that of interior minister.The ministry is charged with preserving the country’s political stability. Thetop economics portfolio is that of the finance and public credit ministry,although the trade and industry ministry is also important.
Political forces
The two main opposition parties are the Partido Acción Nacional (PAN) andthe Partido de la Revolución Democrática (PRD). The PAN was founded in 1939and has built up a support base mainly in northern and central states andamong the urban middle classes, although it has diversified that base since theearly 1990s. It has always been associated with the Roman Catholic church.
A resilient constitution
The compositionof Congress
The ranking of ministries
Opposition partiesand groups
10 Mexico
EIU Country Profile 2000 © The Economist Intelligence Unit Limited 2000
Although inclined to free-market policies, it has also shown some populisttendencies. The leadership of Luis Felipe Bravo Mena, elected in March 1999,has been undermined by the authority of party chiefs in Congress and by thepresidential candidacy of Vicente Fox. The government has managed to reachagreements with PAN, but only after lengthy negotiations.
The PRD was formed in 1989 from the groups that supported Mr Cárdenas’spresidential bid in 1988. After his defeat in the 1994 election, the party lostground. Under the leadership of Andrés Manuel López Obrador (1996-99), theparty’s electoral fortunes improved, thanks partly to the protest vote against thegovernment over the economic crisis. In 1997 Mr Cárdenas easily won thegovernorship of Mexico City, and the PRD became the second most importantforce in Congress. The party has diversified its base by embracing disaffected PRImembers, wresting from the PRI control of states that were consideredimpregnable. Espousing a vague leftist rhetoric, it has made important gains byopposing virtually anything that the government proposes. The March 1999internal election to choose its new president was marred by fraud and had to beannulled. After another controversial election, Senator Amalia García waselected as the party leader in August 1999. Despite the efforts of leading partymembers, the presidential campaign of Mr Cárdenas has not won over voters.
A three-party system evolved during 1997-2000, with the small Partido delTrabajo (PT) and the green Partido Verde Ecologista de México (PVEM) on thefringes, occasionally forming alliances with the PAN or PRD on anti-PRI ticketsat elections. The support of the PT and PVEM deputies is crucial if the PAN andPRD are to secure a majority in the lower house of Congress, enabling bothparties to enjoy a certain amount of influence in government. Six additionalpolitical parties were granted official registry by the electoral authorities at theend of 1999: Partido de la Sociedad Nacionalista (PSN), Covergencia por laDemocracia (CD), Partido Alianza Social (PAS), Partido del Centro Democrático(PCD), Partido Auténtico de la Revolución Mexicana (PARM), and PartidoDemocracia Social (PDS). Both PCD and CD are small PRI splinters. PSN, CDand PAS joined the PRD and the PT to form the Alianza por México andsupport the presidential candidacy of Mr Cárdenas. PCD, PARM and PDS havenominated their own presidential candidates, bringing the total to six. It isunclear how Congress would function if no party attains a working majority,and all the 11 parties gain seats in the 2000-03 legislature.
Civic organisations have developed a degree of strength in recent years. Amongthem is the Barzón (Yoke) movement, which has been at the forefront of adebtors’ revolt. In addition, Mexico has two rebel groups: the Ejército Zapatistade Liberación Nacional (EZLN) based in Chiapas state and the Ejército PopularRevolucionario (EPR) based in Guerrero (which during 1998-99 divided intosplinter groups). No formal peace negotiations have taken place since 1996, asboth the government and the EZLN are unwilling to cede on certain questions.The Zapatistas are militarily cornered and have a small political base but aformidable propaganda machine. In September 1997 a political front—theFrente Zapatista de Liberación Nacional (FZLN)—was formally established, notto fight elections, but to mobilise national support for the principles espousedby the Zapatistas.
Forces outside parliament

Mexico 11
© The Economist Intelligence Unit Limited 2000 EIU Country Profile 2000
Neither the church nor the military is a major participant in politics. In 1992the constitution was modified to give official recognition to the church. Sincethen several church leaders have made intermittent attempts to influencepublic policy, particularly on education, but have been rebuffed. Meanwhile,the military has become more prominent in civilian affairs.
International relations and defence
Mexico’s foreign policy is defined by its historical relationship with the US, towhich it lost almost half its original territory in the mid-19th century. Anti-USsentiment has remained strong since then. Nevertheless, the Salinas governmenttook Mexico into the North American Free-Trade Agreement (NAFTA), whichcame into force on January 1st 1994. The Clinton administration was quick tooffer help when Mexico ran into serious financial difficulties at the end of 1994,making $20bn available from the US Treasury. Relations between the twocountries have remained strong, despite the ever-present thorny issues of illegalmigration, drug-trafficking, money-laundering and Cuba.
The Salinas government also strengthened ties with other countries andeconomic blocs. The country was admitted as a full member of the Asia-Pacific Economic Co-operation forum (APEC) in 1993 and to the OECD in1994 (having joined GATT—now the World Trade Organisation (WTO)—in1986). Mexico has also pursued greater regional integration, entering intofree-trade agreements with Costa Rica, Bolivia, Venezuela, Colombia (1995),Nicaragua (1998), Chile (1992, 1998), the European Union and Israel (2000).
Negotiations to reach free-trade agreements (FTAs) are continuing with thegroup formed by Guatemala, Honduras and El Salvador, and in a bilateralmode with Belize, Panama, Ecuador, Trinidad and Tobago and Peru.Negotiations may start during 2000 aiming to reach FTAs with Japan andSingapore.
Armed forces, 1999
Active: 178,770
Reserves: 300,000
Army: 130,000 (60,000 conscripts—12 military regions; 41 zonal garrisons, onearmoured brigade; one presidential guard brigade, one motorised infantry brigade, twoinfantry brigades, anti-aircraft, engineering and support units.
Navy: 37,000—including 10,000 marines and 1,100 naval air personnel; 17 navalregions—six in the Gulf of Mexico and 11 in the Pacific; three destroyers and six frigates.
Air force: 11,770—including one squadron with ten fighters and 95 armed helicopters.
Relations with the US arebecoming stronger—
—as are those withother countries

12 Mexico
EIU Country Profile 2000 © The Economist Intelligence Unit Limited 2000
Although the armed forces are ill equipped to defend Mexico from externalaggression, their role in domestic affairs has increased over the last few years.In addition to waging a perennial war against drug-traffickers, they have beencalled on to contain the EZLN and EPR guerrillas and even to take on policingduties. Scandals related to corruption and human rights abuses, however, havetarnished the relatively unblemished image of the army. In 2000 authoriseddefence spending amounted to 0.4% of GDP.
Resources and infrastructure
Population
Mexico’s estimated population for mid-2000 is 99.58m. There has been aslowdown in the rate of population growth from more than 3% per year in theearly 1970s to 1.6% in the late 1990s. (For historical data on the population seeReference table 1.) This deceleration reflects declining fertility rates andimproved healthcare, which have lowered infant mortality rates. Annualpopulation growth is expected to be 1.5% in 2000.
At end-1997 an estimated 34.7% of the population was aged 14 years or under.Inevitably this results in pressure on the education system and labour market. (Forhistorical data on employment see Reference tables 2 and 3.) In 1997, 146,865Mexicans migrated legally to the US (163,572 in 1996), and in 1988-96 anestimated average of 150,000 per year did so illegally. In 1990 the number ofpeople of Mexican extraction living in the US was put at 13.5m, 4m-5m of whomwere born in Mexico. By the end of 1996 an estimated 2.7m illegal Mexicanimmigrants were living in the US. During 1998, 1m Mexicans were expelled by theUS authorities because of their illegal status (that number may be inflated bydouble counting, as many return to the US as soon as they are expelled).
States where at least 30% of the population is migrant(% of migrants in population of state)
Quintana Roo 53.4
Baja California 49.5
Estado de México 38.5
Morelos 35.4
Colima 34.7
Baja California Sur 33.7
Campeche 30.3
Federal District 30.1
Source: Instituto Nacional de Estadística, Geografía e Informática (INEGI), Conteo de Población y Vivienda.
Within Mexico, the search for better living standards has led to migration fromthe country to the cities, especially Mexico City, Monterrey and Guadalajara,but also in more recent times to northern maquiladora (in-bond assembly forre-export) towns such as Tijuana and Ciudad Juárez (that also function as
The armed forces’ priorities
Emigration to the US hasbeen substantial
Internal migration
Mexico 13
© The Economist Intelligence Unit Limited 2000 EIU Country Profile 2000
springboards to migrate illegally to the US), and tourist centres such asCancún. In 1990 some 71% of the population lived in urban areas.
Roughly 10% of the population are pure Indian. There are over 60 recognisedethnic and language groups (around 1% of the total population does not speakany Spanish). The most numerous are the Náhuatls (with 1.3m speakers),Mayas (800,000), Zapotecs and Mixtecs. The Indians’ customs and languagesdiffer greatly from one group to another, but their lot has generally been one ofexploitation, marginalisation and poverty.
Education
In 1998, 9.8% of the population aged 15 or over were illiterate. Althoughprimary education (for children aged between five and 11) is both free andcompulsory, recent records show that only six out of ten children have actuallybeen completing the course. Attendance at secondary school has been limitedand only a very small proportion of students have gone on to highereducation. In the 1999/2000 academic cycle Mexico had only 1,739 studentsper 100,000 population in higher education, compared with 5,404 in the US(1998 data). Education spending is around 5% of GDP, compared with 7% inthe US and Canada.
The Salinas government increased budget allocations for education andinitiated a programme to bring basic education up to date by revising thesyllabus and improving teachers’ training and pay. At the same time, secondaryschooling for children aged between 11 and 14 was made compulsory andtechnical training facilities were expanded. There are more than 4,800 centreswhere students can be trained for jobs in industry. As education minister in1992-94, Mr Zedillo carried out several of these policies. In August 1997, duringhis government, the Progresa programme (Programa de Educación, Salud yAlimentación) was introduced, providing additional subsidies to some of thepoorest families.
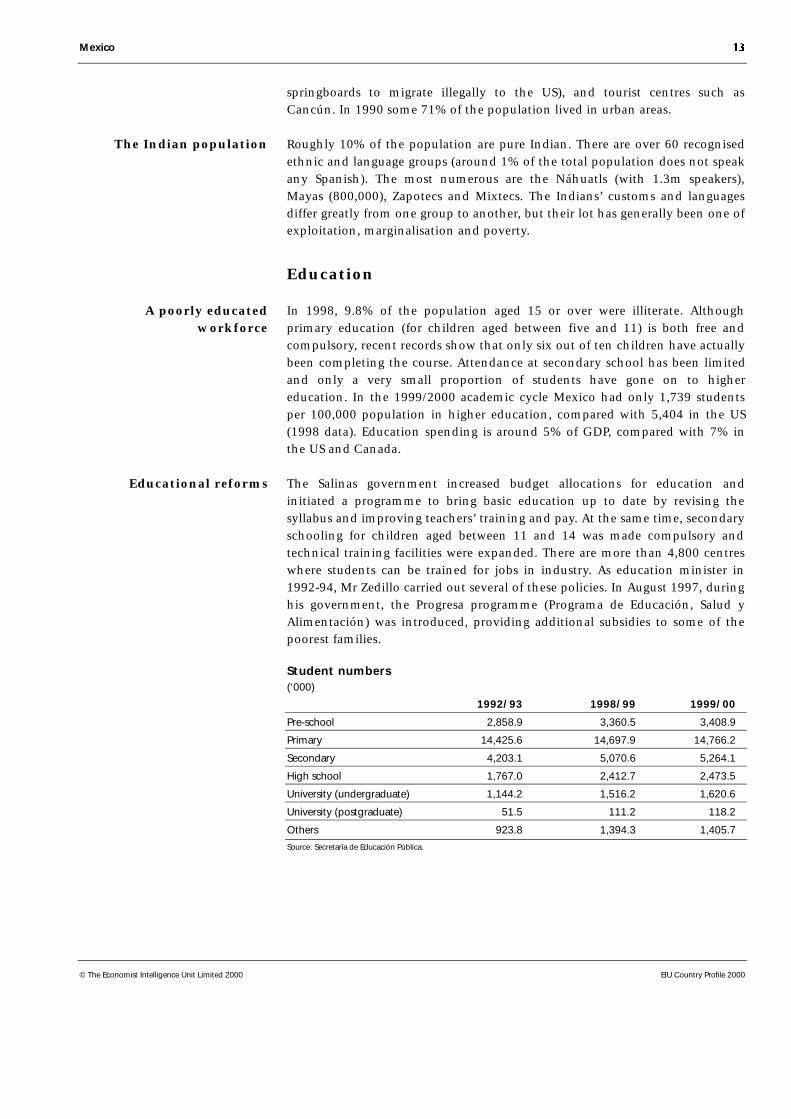
Student numbers(‘000)
1992/93 1998/99 1999/00
Pre-school 2,858.9 3,360.5 3,408.9
Primary 14,425.6 14,697.9 14,766.2
Secondary 4,203.1 5,070.6 5,264.1
High school 1,767.0 2,412.7 2,473.5
University (undergraduate) 1,144.2 1,516.2 1,620.6
University (postgraduate) 51.5 111.2 118.2
Others 923.8 1,394.3 1,405.7
Source: Secretaría de Educación Pública.
The Indian population
A poorly educatedworkforce
Educational reforms
14 Mexico
EIU Country Profile 2000 © The Economist Intelligence Unit Limited 2000
Health
Between 1970 and 2000 life expectancy at birth increased from 61 years to anestimated 75.3 years, while the infant mortality rate fell from 69 per 1,000 livebirths to 25 per 1,000. Universal vaccination programmes have helped toreduce cases of whooping cough and tuberculosis, and poliomyelitis has beenvirtually eliminated. Efforts continue to be made to curb outbreaks of choleraand the spread of AIDS. The government tries to counter malnutrition byproviding subsidised milk to 4.2m children and free school breakfasts for about4.6m children and by giving 1.16m families 1 kg/day of free tortillas (end-1999figures). Nevertheless, malnutrition remains a serious problem, particularly inremote rural areas.
The Instituto Mexicano del Seguro Social (IMSS) and the Instituto de Seguridady Servicios Sociales de los Trabajadores del Estado (ISSSTE) are the two mainproviders of healthcare. In 1999 officially 44.89m people were covered by theIMSS (with 14.56m affiliates paying contributions by the end of 1999). TheISSSTE, with 2.31m state workers affiliated to it, offered services to a further10.09m. The two organisations are funded by employers’ and employees’contributions, returns on investments and, in the case of the ISSSTE, transfersfrom federal government.
In addition to the IMSS and ISSSTE, some healthcare services are provided bythe defence and navy ministries, by the state oil company, Pemex, by stateorganisations such as the Institute for Indigenous People (INI) and the nationalsystem for Integrated Family Development (DIF), and by private institutions.About 4% of the population have private medical cover. Those not in the socialsecurity or private schemes, and without access to other providers, can obtainfree healthcare from the Secretaría de Salud (SSA, Ministry of Health) or theIMSS-Solidaridad anti-poverty programme.
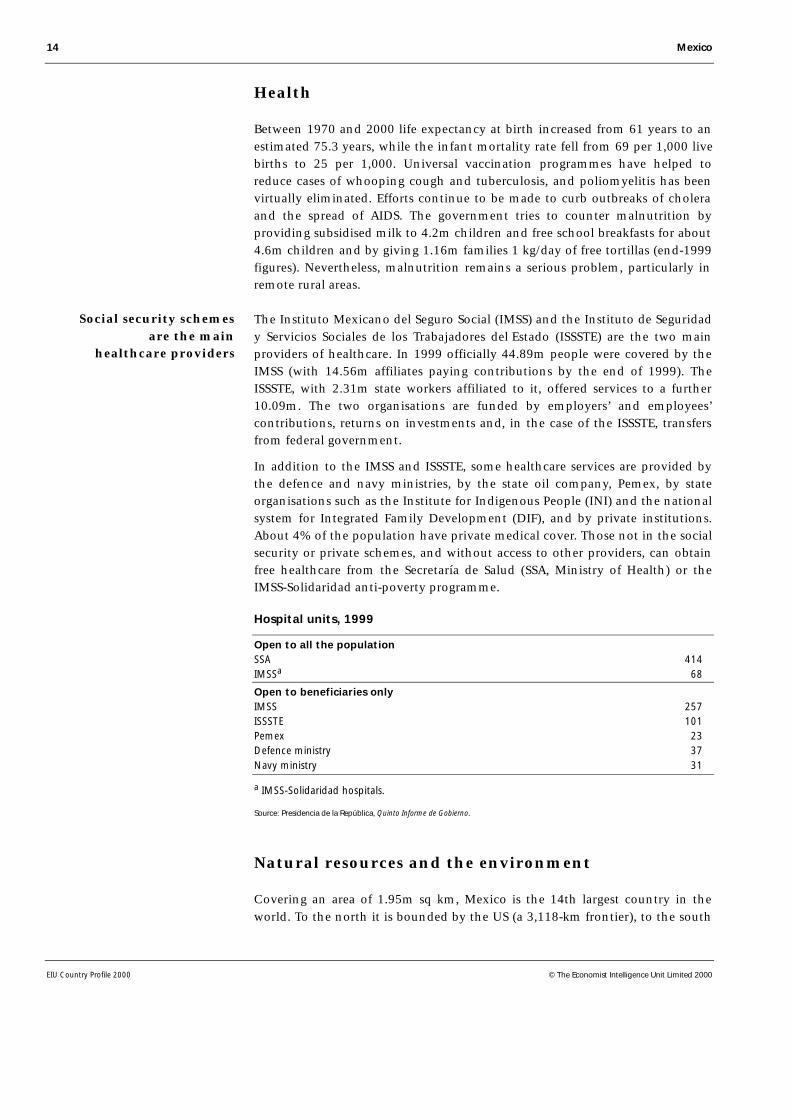
Hospital units, 1999
Open to all the populationSSA 414IMSSa 68
Open to beneficiaries onlyIMSS 257ISSSTE 101Pemex 23Defence ministry 37Navy ministry 31
a IMSS-Solidaridad hospitals.
Source: Presidencia de la República, Quinto Informe de Gobierno.
Natural resources and the environment
Covering an area of 1.95m sq km, Mexico is the 14th largest country in theworld. To the north it is bounded by the US (a 3,118-km frontier), to the south
Social security schemesare the main
healthcare providers
Mexico 15
© The Economist Intelligence Unit Limited 2000 EIU Country Profile 2000
by Guatemala (943 km) and Belize (249 km). The country’s western limit is thePacific coast (7,360 km), and its eastern limit comprises the Gulf of Mexico andCaribbean coasts (2,780 km).
The country’s topography is complex, ranging from coastal plains to volcanoesover 5,000 metres above sea level. More than one-half of the land area is over1,000 metres above sea level.
Because of its topography, climatic conditions in Mexico vary considerably. Butmuch of the country is dry, there are few large rivers and water resources areunevenly distributed.
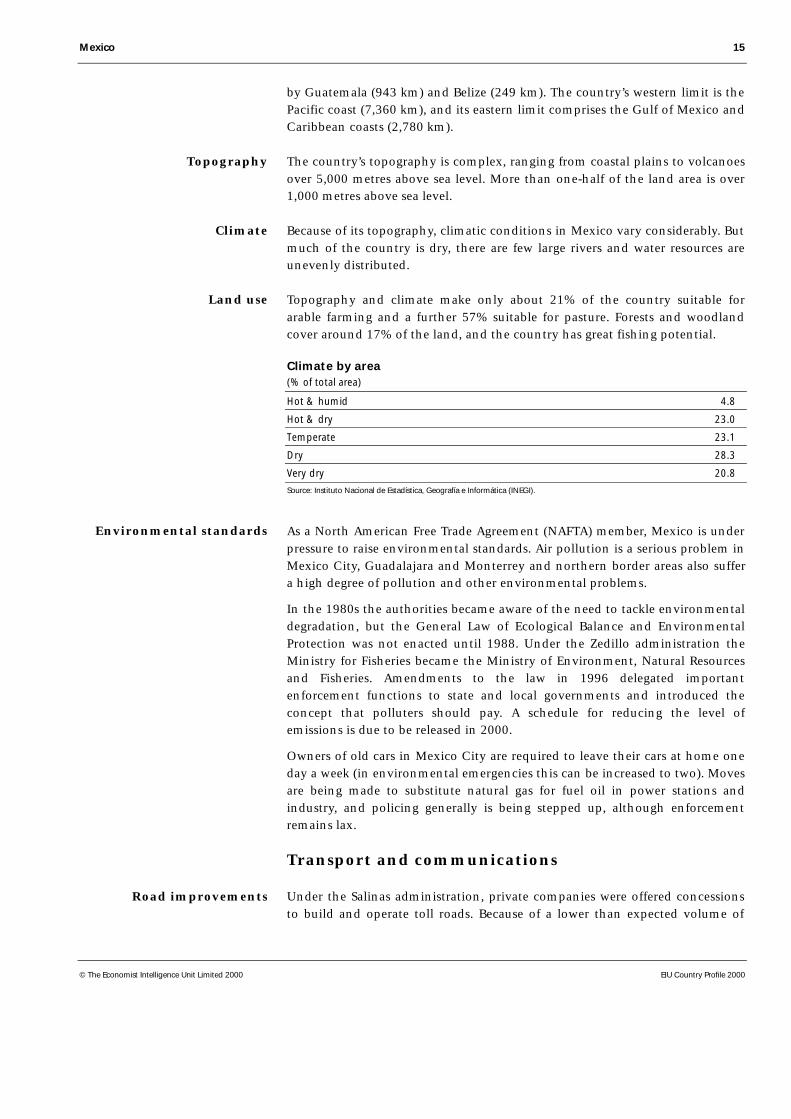
Topography and climate make only about 21% of the country suitable forarable farming and a further 57% suitable for pasture. Forests and woodlandcover around 17% of the land, and the country has great fishing potential.
Climate by area(% of total area)
Hot & humid 4.8
Hot & dry 23.0
Temperate 23.1
Dry 28.3
Very dry 20.8
Source: Instituto Nacional de Estadística, Geografía e Informática (INEGI).
As a North American Free Trade Agreement (NAFTA) member, Mexico is underpressure to raise environmental standards. Air pollution is a serious problem inMexico City, Guadalajara and Monterrey and northern border areas also suffera high degree of pollution and other environmental problems.
In the 1980s the authorities became aware of the need to tackle environmentaldegradation, but the General Law of Ecological Balance and EnvironmentalProtection was not enacted until 1988. Under the Zedillo administration theMinistry for Fisheries became the Ministry of Environment, Natural Resourcesand Fisheries. Amendments to the law in 1996 delegated importantenforcement functions to state and local governments and introduced theconcept that polluters should pay. A schedule for reducing the level ofemissions is due to be released in 2000.
Owners of old cars in Mexico City are required to leave their cars at home oneday a week (in environmental emergencies this can be increased to two). Movesare being made to substitute natural gas for fuel oil in power stations andindustry, and policing generally is being stepped up, although enforcementremains lax.
Transport and communications
Under the Salinas administration, private companies were offered concessionsto build and operate toll roads. Because of a lower than expected volume of
Topography
Climate
Land use
Environmental standards
Road improvements
16 Mexico
EIU Country Profile 2000 © The Economist Intelligence Unit Limited 2000
traffic and the crisis that began in December 1994, the government had torevoke several of the concessions and at the same time offer financial assistanceto the companies.
Integral port administrations (APIs) were created in 1993. The administrationof each seaport was awarded by concession to an API, which can operate theport terminals and facilities and provide all related port services. The APIsbegan to be privatised in 1995, a process that has continued throughout theZedillo administration. Foreign investors may hold up to 49% equity in APIsand up to 100% equity in the provision of some port services.
The Salinas government managed to cut the losses of the state-owned railwaycompany, Ferrocarriles Nacionales (Ferronales); the Zedillo administration splitit up into regional companies and transferred the management of most ofthem to the private sector during 1997-98, under 50-year concessions.Excluded from the sale were small loss-making segments, and the railwaywhich runs through the Tehuantepec isthmus, because of its politicalsensitivity. The whole of the railway system was either in private hands orunder private management by the end of 1999. Ferronales officially closed itsdoors in August 1999.
The Airports Act became law in December 1995. The process of privatising 35airports, which deal with 97% of total passenger movements, started in 1998.The airports were divided into three groups for auction according to theirgeographical location (plus a special group for Mexico City). A minority (15%)but controlling share will be offered to strategic investors (which must includea foreign investor with experience in airport management), the rest of theshares being offered to the public on the stock exchange. The Airports Actallows for up to 49% foreign investment, although authorisation for highershares may be obtained.
Aeropuertos del Sureste (nine airports in six states, of which Cancún is thejewel in the crown) were the first to be auctioned. Managerial control was wonby a consortium with Mexican, Danish, French and Spanish capital inDecember 1998. A consortium of Mexican and Spanish capital won thebidding to manage Aeropuertos del Pacífico (12 airports including Guadalajaraand Tijuana) in August 1999. Aeropuertos del Centro-Norte (13 airports,including those serving Acapulco and Monterrey) will be handed over toprivate management in mid-2000. The privatisation of Mexico City airport hasbeen delayed because the government has still to decide on the location of anew airport to serve: in Texcoco (near the existing one) or in the Valley ofTizayuca, in Hidalgo. The sale will probably have to wait until the incominggovernment takes office. The placement of 85% of the shares in the privatisedairports’ groups on the stock exchange has been delayed several times, but issupposed to occur during 2000.
Port facilities
Airports
Railways

Mexico 17
© The Economist Intelligence Unit Limited 2000 EIU Country Profile 2000
Transport and communications indicators, 1999
Roads (km) 365,119
Paved roads (km) 108,803
Vehicles (m registered) 14.49a
Railway track (km) 26,595
Rail passengers (m) 0.7
Rail freight (‘000 tonnes) 80,420
International airports (no.) 55
Domestic airports (no.) 29
Air passengers (m) 32.95
Air freight (‘000 tonnes) 431.0
Ports (no.) 108
Port facilities (docks in km) 176.5
Maritime passengers (m) 7.80
Shipping (‘000 tonnes handled) 240,419
Telephones (‘000 lines in service) 10,927
Cellular telephones (‘000 subscribers) 6,944a
Internet users (‘000 subscribers) 2,453b
a November 1999. b August 1999.
Sources: Banco de México; Instituto Nacional de Estadística, Geografía e Informática (INEGI); Secretaría de Comunicaciones yTransportes; Aeropuertos y Servicios Auxiliares; Caminos y Puentes Federales de Ingreso; Comisión Federal de Telecomunicaciones;Presidencia de la República, Quinto Informe de Gobierno.
In 1990 the government privatised Teléfonos de México (Telmex), which hassince greatly expanded the telephone network; the number of telephone linesincreased by 104% between 1990 and 1999. With privatisation cameconcessions for cellular telephone operations and in August 1996 the long-distance market was opened up to competition. Fifteen companies have wonconcessions to compete against Telmex in the local telephone service market.In October 1997 the government privatised Satélites Mexicanos (Satmex).
Energy provision
Mexico was the world’s fifth largest oil producer in 1999: output averaged3.34m barrels/day of crude oil and their liquid gas equivalent. Three types ofoil are sold: heavy Maya (22.3° API), Isthmus (34.6° API) and Olmeca (39.1°API). Official hydrocarbons reserves at the start of 2000 were 58.2bn barrels, ofwhich 46.2bn were crude oil and condensates and 12bn were the gasequivalent. Reserves have declined steadily over the past 15 years, reflecting acontraction in exploratory activity. About 56% of reserves are in the Gulf ofMexico, 24% in the Chicontepec region and 15% in Chiapas and Tabasco.
Oil exports did well in 1996 and 1997, as a result of higher volumes and prices,exceeding the $10bn mark for the first time since 1985. However, oil pricesstarted to plunge in December 1997 and remained extremely low (the lowest inreal terms since Mexico became an important oil exporter) until February 1999.This caused a negative shock, as crude oil is the second most important exportand the state oil company, Petróleos Mexicanos (Pemex), accounts for almost
Oil production
Communications
18 Mexico
EIU Country Profile 2000 © The Economist Intelligence Unit Limited 2000
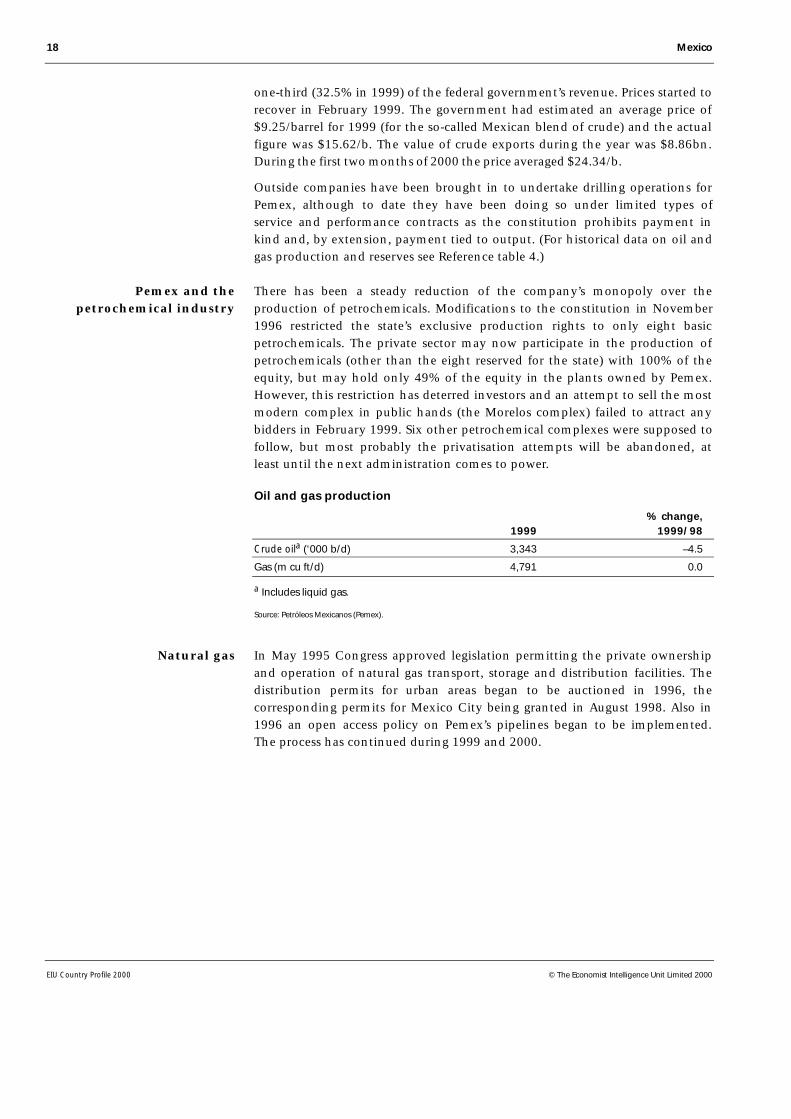
one-third (32.5% in 1999) of the federal government’s revenue. Prices started torecover in February 1999. The government had estimated an average price of$9.25/barrel for 1999 (for the so-called Mexican blend of crude) and the actualfigure was $15.62/b. The value of crude exports during the year was $8.86bn.During the first two months of 2000 the price averaged $24.34/b.
Outside companies have been brought in to undertake drilling operations forPemex, although to date they have been doing so under limited types ofservice and performance contracts as the constitution prohibits payment inkind and, by extension, payment tied to output. (For historical data on oil andgas production and reserves see Reference table 4.)
There has been a steady reduction of the company’s monopoly over theproduction of petrochemicals. Modifications to the constitution in November1996 restricted the state’s exclusive production rights to only eight basicpetrochemicals. The private sector may now participate in the production ofpetrochemicals (other than the eight reserved for the state) with 100% of theequity, but may hold only 49% of the equity in the plants owned by Pemex.However, this restriction has deterred investors and an attempt to sell the mostmodern complex in public hands (the Morelos complex) failed to attract anybidders in February 1999. Six other petrochemical complexes were supposed tofollow, but most probably the privatisation attempts will be abandoned, atleast until the next administration comes to power.
Oil and gas production
% change,1999 1999/98
Crude oila (‘000 b/d) 3,343 –4.5
Gas (m cu ft/d) 4,791 0.0
a Includes liquid gas.
Source: Petróleos Mexicanos (Pemex).
In May 1995 Congress approved legislation permitting the private ownershipand operation of natural gas transport, storage and distribution facilities. Thedistribution permits for urban areas began to be auctioned in 1996, thecorresponding permits for Mexico City being granted in August 1998. Also in1996 an open access policy on Pemex’s pipelines began to be implemented.The process has continued during 1999 and 2000.
Pemex and thepetrochemical industry
Natural gas
Mexico 19
© The Economist Intelligence Unit Limited 2000 EIU Country Profile 2000
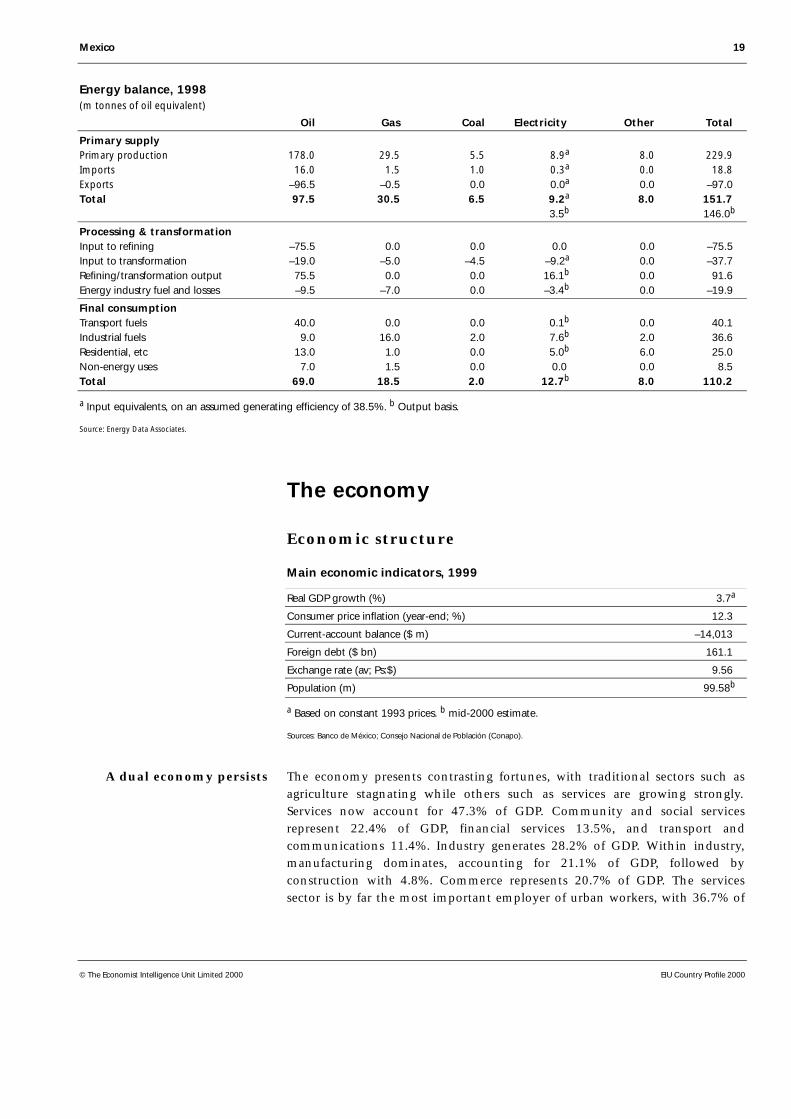
Energy balance, 1998(m tonnes of oil equivalent)
Oil Gas Coal Electricity Other Total
Primary supplyPrimary production 178.0 29.5 5.5 8.9a 8.0 229.9 Imports 16.0 1.5 1.0 0.3a 0.0 18.8 Exports –96.5 –0.5 0.0 0.0a 0.0 –97.0 Total 97.5 30.5 6.5 9.2a 8.0 151.7
3.5b 146.0b
Processing & transformationInput to refining –75.5 0.0 0.0 0.0 0.0 –75.5 Input to transformation –19.0 –5.0 –4.5 –9.2a 0.0 –37.7 Refining/transformation output 75.5 0.0 0.0 16.1b 0.0 91.6 Energy industry fuel and losses –9.5 –7.0 0.0 –3.4b 0.0 –19.9
Final consumptionTransport fuels 40.0 0.0 0.0 0.1b 0.0 40.1 Industrial fuels 9.0 16.0 2.0 7.6b 2.0 36.6 Residential, etc 13.0 1.0 0.0 5.0b 6.0 25.0 Non-energy uses 7.0 1.5 0.0 0.0 0.0 8.5 Total 69.0 18.5 2.0 12.7b 8.0 110.2
a Input equivalents, on an assumed generating efficiency of 38.5%. b Output basis.
Source: Energy Data Associates.
The economy
Economic structure
Main economic indicators, 1999
Real GDP growth (%) 3.7a
Consumer price inflation (year-end; %) 12.3
Current-account balance ($ m) –14,013
Foreign debt ($ bn) 161.1
Exchange rate (av; Ps:$) 9.56
Population (m) 99.58b
a Based on constant 1993 prices. b mid-2000 estimate.
Sources: Banco de México; Consejo Nacional de Población (Conapo).
The economy presents contrasting fortunes, with traditional sectors such asagriculture stagnating while others such as services are growing strongly.Services now account for 47.3% of GDP. Community and social servicesrepresent 22.4% of GDP, financial services 13.5%, and transport andcommunications 11.4%. Industry generates 28.2% of GDP. Within industry,manufacturing dominates, accounting for 21.1% of GDP, followed byconstruction with 4.8%. Commerce represents 20.7% of GDP. The servicessector is by far the most important employer of urban workers, with 36.7% of
A dual economy persists
20 Mexico
EIU Country Profile 2000 © The Economist Intelligence Unit Limited 2000
the 1999 total, followed by manufacturing (22.7%) and commerce (20.6%).Construction employs 5.4% of the urban workforce, and the government 5.9%.
Agriculture accounted for 5% of GDP in 1999, but employed about 23% of thetotal workforce. Mining was equivalent to just 1.2% of GDP during 1999.However, that figure heavily understates the importance of oil production,particularly in terms of government revenue. Its price having recoveredstrongly during 1999, oil represented 7.3% of the total exports that year (6.1%in 1998; 10.3% in 1997) and 32.5% of total fiscal revenue (32.6% in 1998;36.4% in 1997).
Manufacturing is not only the most important productive sector, but also themain source of exports: 89.4% of the total during 1999 (although over half ofthe total, 52.2%, is produced in maquiladoras—in-bond assembly plants).
The informal sector is huge. Although estimates of its size and importance varywidely, it is telling that an estimated 15-25% (the precise number depends onthe month) of the urban workforce during 1999 worked, if at all, fewer than 35hours per week.
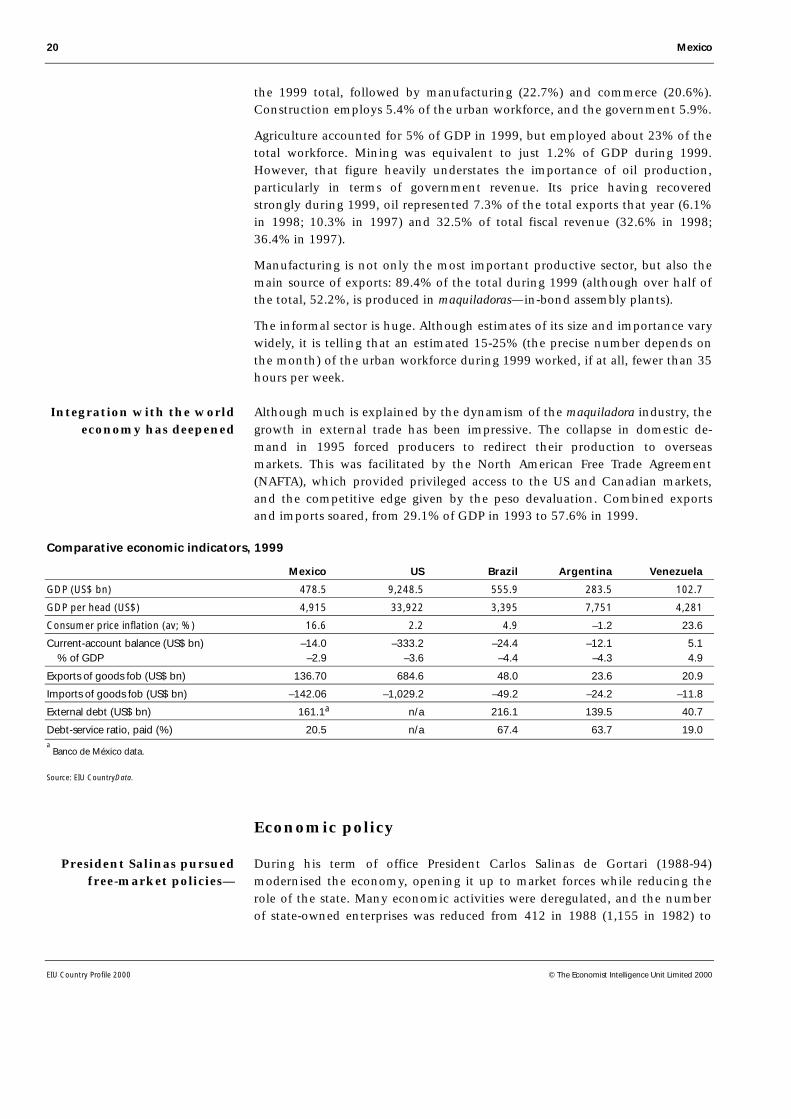
Although much is explained by the dynamism of the maquiladora industry, thegrowth in external trade has been impressive. The collapse in domestic de-mand in 1995 forced producers to redirect their production to overseasmarkets. This was facilitated by the North American Free Trade Agreement(NAFTA), which provided privileged access to the US and Canadian markets,and the competitive edge given by the peso devaluation. Combined exportsand imports soared, from 29.1% of GDP in 1993 to 57.6% in 1999.
Comparative economic indicators, 1999
Mexico US Brazil Argentina Venezuela
GDP (US$ bn) 478.5 9,248.5 555.9 283.5 102.7
GDP per head (US$) 4,915 33,922 3,395 7,751 4,281
Consumer price inflation (av; %) 16.6 2.2 4.9 –1.2 23.6
Current-account balance (US$ bn) –14.0 –333.2 –24.4 –12.1 5.1 % of GDP –2.9 –3.6 –4.4 –4.3 4.9
Exports of goods fob (US$ bn) 136.70 684.6 48.0 23.6 20.9
Imports of goods fob (US$ bn) –142.06 –1,029.2 –49.2 –24.2 –11.8
External debt (US$ bn) 161.1a n/a 216.1 139.5 40.7
Debt-service ratio, paid (%) 20.5 n/a 67.4 63.7 19.0a Banco de México data.
Source: EIU CountryData.
Economic policy
During his term of office President Carlos Salinas de Gortari (1988-94)modernised the economy, opening it up to market forces while reducing therole of the state. Many economic activities were deregulated, and the numberof state-owned enterprises was reduced from 412 in 1988 (1,155 in 1982) to
Integration with the worldeconomy has deepened
President Salinas pursuedfree-market policies—

Mexico 21
© The Economist Intelligence Unit Limited 2000 EIU Country Profile 2000
215 in 1994. The trade liberalisation begun by Mr Salinas’s predecessor, Miguelde la Madrid, was consolidated and enhanced by free-trade pacts, notablyNAFTA, and foreign investment rules were made more attractive.
Mr Salinas’s government was successful in reducing the rate of inflation from52% in 1988 to 7% in 1994, by exploiting the corporatist structure of thePartido Revolucionario Institucional (PRI) to extract concessions from the mainlabour and peasant unions and business organisations on fiscal cuts and wagerestraint. This took the form of an incomes policy known as the pacto. Apublic-sector borrowing requirement (PSBR) of 12.5% of GDP in 1988 had beenturned into a surplus of 0.5% of GDP by 1992 (3.2% including privatisationrevenue), although there was some fiscal relaxation in the next two years.Lower inflation led to lower interest rates, which in turn helped the fiscalaccounts by lowering the cost of domestic debt service. (For details of public-sector finances see Reference tables 5 and 6.)
A reduction in interest rates was also assisted by the liberalisation of thefinancial markets, specifically, the lifting of interest-rate controls and thegradual phasing out of cash reserve requirements. In 1991-92 the governmentprivatised its 18 commercial banks, and in 1993 it allowed the establishment ofnew domestic banks. In 1994 access was granted to foreign banks (albeit onlythose operating in the US and Canada), the object being to improve theavailability of credit and drive intermediation margins down throughcompetition. In April 1994 the Banco de México (the central bank) becameindependent. However, the finance ministry retained control over exchange-rate policy, creating a possible source of conflict. A proposal put to Congress(which may be approved during 2000) would give the central bank full controlover exchange-rate policy. (For historical data on money, credit and interestrates see Reference tables 7 and 8.)
The exchange rate was unified in November 1991 and exchange controls wereabolished. The existing policy of a daily depreciation was retained, although itapplied to the ceiling of a band in which the peso was allowed to float. (Forhistorical data on the exchange rate see Reference table 30.)
The Salinas government stuck resolutely to its exchange-rate policy eventhough trade liberalisation and economic growth produced ever-larger tradeand current-account deficits. It was argued that the size of the current-accountdeficit was not important, as public finances were in balance; therefore a deficitreflected the dynamism of the private sector, and if capital ceased to flow intothe economy, the current account would adjust accordingly. In 1994 thegovernment rolled over domestic debt by issuing $29.2bn of dollar-linkedbonds, known as tesobonos, to try to halt a loss of reserves. Investors becameincreasingly skittish as the euphoria that had built up over Mexico’s economicprospects dissipated when political shocks struck in an election year.Eventually the exchange-rate policy ceased to be tenable.
Only three weeks into its term in office, on December 20th 1994, the Zedillogovernment devalued in effect by lifting the exchange-band ceiling by 15%.
—and greater fiscaldiscipline
Financial markets wereliberalised—
—but exchange-rate policyeventually proved to
be flawed—
—forcing the Zedillogovernment to devalue
22 Mexico
EIU Country Profile 2000 © The Economist Intelligence Unit Limited 2000
Billions of dollars left the country in a few hours. With reserves depleted, thepeso was floated, and a financial meltdown seemed imminent. The peso ended1994 at Ps5.325:$1.
The peso continued to plunge in the first few weeks of 1995, as economicagents feared (correctly) that the government lacked enough resources to paythe $29bn of tesobonos falling due in 1995. The solvency of the banking systembecame another cause for concern. Banks now faced a huge increase in externaldebt-servicing costs (as a result of the devaluation) and an escalation in baddebts as the government forced interest rates up to try to keep foreign anddomestic capital in the country.
In January 1995, after several days of further uncertainty, the governmentagreed with labour and business on an emergency economic plan, whichconsisted of a tighter fiscal and monetary stance and wage restraint. On thestrength of this plan the US contributed $20bn, the Bank for InternationalSettlements (BIS) $10bn and the IMF offered in total $17.8bn. However, inMarch the government was forced to redouble its adjustment efforts. Value-added tax (VAT) was raised from 10% to 15% and public (government-set)prices were increased, public spending was cut and a tight lid was kept on wagerises. Despite a contraction in GDP of 6.2%, a non-financial public-sectorsurplus of 0.7% of GDP was achieved, an improvement on the previous year’sPSBR of 3.4% of GDP. However, this included only a fraction of the cost of thebank bail-out. At the end of 1999, that cost, which will be eventually absorbedas internal public debt or written down over a 30-year period, was equivalentto 18.3% of GDP.
The government stuck to a policy of fiscal and monetary prudence in 1996.Inflation was nearly halved, from 52% at the end of 1995 to 27.7% a year later.Public finances were almost in balance, the non-financial public sector posting adeficit of 0.1% of GDP. This required reining in spending to compensate for therising cost of supporting the banking system and for defaults on tax payments.The central bank kept within its restrictive target for monetary growth.
Although the government seemed to consider the free-floating peso as atransitional phase, over time confidence and reserves were restored, andexchange-rate volatility gave way to extended periods in which the pesoremained relatively stable. The inflation target for 1997 of 15% was almostachieved. During the year public finances registered a deficit (including costsrelating to reform of the social security system incurred during the second halfof the year) slightly above the 0.5% of GDP goal.
Although initially costly, that reform is at the heart of the growth strategypresented in the Programa Nacional de Financiamiento del Desarrollo(Pronafide), which in essence involves increasing savings and investment. Themain feature of the new capitalisation pension system is that a worker’spension benefits will depend on the contributions made by workers to theirindividual pension accounts. The accounts will be managed by retirement fundadministrators (afores) of the contributor’s choosing. Seventeen afores, most ofthem allied with foreign companies, started operation during 1997.
There was little scope forrelaxation in 1996
The adjustment continuedin 1997—
Mexico 23
© The Economist Intelligence Unit Limited 2000 EIU Country Profile 2000
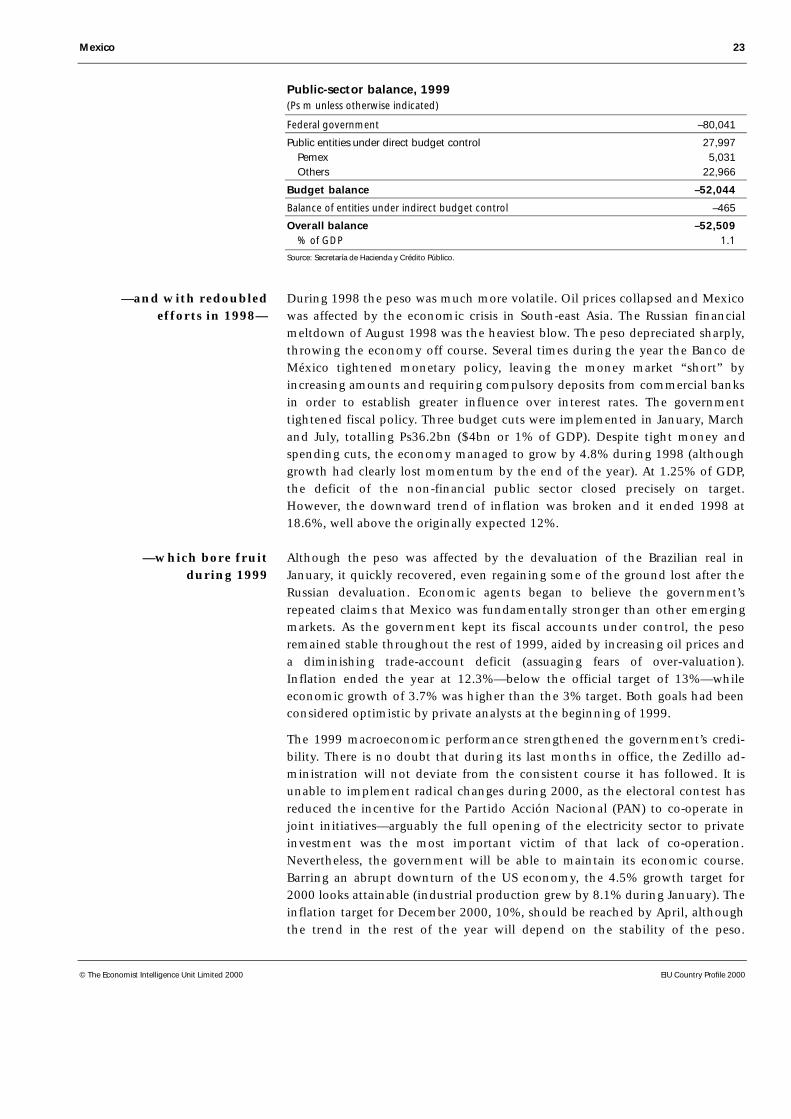
Public-sector balance, 1999(Ps m unless otherwise indicated)
Federal government –80,041
Public entities under direct budget control 27,997 Pemex 5,031 Others 22,966
Budget balance –52,044
Balance of entities under indirect budget control –465
Overall balance –52,509 % of GDP 1.1
Source: Secretaría de Hacienda y Crédito Público.
During 1998 the peso was much more volatile. Oil prices collapsed and Mexicowas affected by the economic crisis in South-east Asia. The Russian financialmeltdown of August 1998 was the heaviest blow. The peso depreciated sharply,throwing the economy off course. Several times during the year the Banco deMéxico tightened monetary policy, leaving the money market “short” byincreasing amounts and requiring compulsory deposits from commercial banksin order to establish greater influence over interest rates. The governmenttightened fiscal policy. Three budget cuts were implemented in January, Marchand July, totalling Ps36.2bn ($4bn or 1% of GDP). Despite tight money andspending cuts, the economy managed to grow by 4.8% during 1998 (althoughgrowth had clearly lost momentum by the end of the year). At 1.25% of GDP,the deficit of the non-financial public sector closed precisely on target.However, the downward trend of inflation was broken and it ended 1998 at18.6%, well above the originally expected 12%.
Although the peso was affected by the devaluation of the Brazilian real inJanuary, it quickly recovered, even regaining some of the ground lost after theRussian devaluation. Economic agents began to believe the government’srepeated claims that Mexico was fundamentally stronger than other emergingmarkets. As the government kept its fiscal accounts under control, the pesoremained stable throughout the rest of 1999, aided by increasing oil prices anda diminishing trade-account deficit (assuaging fears of over-valuation).Inflation ended the year at 12.3%—below the official target of 13%—whileeconomic growth of 3.7% was higher than the 3% target. Both goals had beenconsidered optimistic by private analysts at the beginning of 1999.
The 1999 macroeconomic performance strengthened the government’s credi-bility. There is no doubt that during its last months in office, the Zedillo ad-ministration will not deviate from the consistent course it has followed. It isunable to implement radical changes during 2000, as the electoral contest hasreduced the incentive for the Partido Acción Nacional (PAN) to co-operate injoint initiatives—arguably the full opening of the electricity sector to privateinvestment was the most important victim of that lack of co-operation.Nevertheless, the government will be able to maintain its economic course.Barring an abrupt downturn of the US economy, the 4.5% growth target for2000 looks attainable (industrial production grew by 8.1% during January). Theinflation target for December 2000, 10%, should be reached by April, althoughthe trend in the rest of the year will depend on the stability of the peso.
—which bore fruitduring 1999
—and with redoubledefforts in 1998—
24 Mexico
EIU Country Profile 2000 © The Economist Intelligence Unit Limited 2000
Whatever the macroeconomic outturn for 2000, Mexico should have ended thecycle of economic crises coinciding with changes of government.
Orthodox economic policies were discredited by the 1994-95 crisis but haveregained public support during the recovery and no major party is proposing acredible alternative. The incoming president will not change the general thrustof economic policy. A potentially unruly and opposition-dominated Congress,however, will pose problems for the new government.
Economic performance
In 1992 the delayed effects of the US recession, together with theovervaluation of the peso, held real growth of exports of goods and services at5%, while imports of goods and services increased by 19.6% in real terms.The deterioration in the net foreign balance was mainly responsible for aslowdown in GDP growth to 3.6%. In 1993 the arrival of the Clintonadministration in the US brought uncertainty with respect to approval of theNorth American Free Trade Agreement (NAFTA). This had a directimpact on investment decisions. It also exerted upward pressure on domesticinterest rates and exacerbated the problem of growing bad debts. Banksresponded by restricting lending. Following a recovery in the US and slackdemand at home, exports grew by 8.1% in real terms and imports by 1.9%.GDP growth was 1.9%. (For historical data on GDP see Reference tables 9-11.)
In 1994, an election year, public consumption grew by 2.9% and publicinvestment by a similar amount. NAFTA helped to revive private investment,despite political upheavals, and to boost exports, which grew by 9.8% and17.8% respectively in real terms. The recovery in domestic demand sentimports up again, limiting GDP growth to 4.5%.
The financial crisis at the end of 1994 had a profound effect on the economyin 1995. High real interest rates, tight monetary policy and the loss of businessconfidence choked private investment. Swingeing fiscal cuts meant sharp fallsin public investment and spending. In August the official (very narrow)measure of open urban unemployment reached 7.6% before falling to 5.2% inDecember, well above the 3.2% recorded at the end of 1994. Inflation—fuelledby the weakness of the peso—eroded wages, and private consumptioncollapsed. GDP contracted by 6.2%, the worst recession experienced by thecountry since the Great Depression. The only positive developments werein the external sector, where a surge in exports was accompanied by a fallin imports.
Uneven growth in1992-94—
—followed by recessionin 1995

Mexico 25
© The Economist Intelligence Unit Limited 2000 EIU Country Profile 2000
Gross domestic product(% real change; constant 1993 prices)
Annual average1990-95 1996 1997 1998 1999a
Private consumption 2.1 2.2 6.5 5.4 4.3
Government consumption 2.5 –0.7 2.9 2.2 1.0
Gross fixed investment 2.0 16.4 21.0 10.3 5.8
Exports of goods & services 8.2 18.2 10.7 12.1 13.9
Imports of goods & services 11.9 22.8 22.7 16.5 12.8
GDP at market prices 2.2 5.2 6.8 4.8 3.7
a Preliminary.
Sources: Instituto Nacional de Estadística, Geografía e Informática (INEGI); Banco de México.
The increase in exports helped to lift the economy out of recession in 1996.Private consumption was held back by declining real wages andunemployment, which remained stubbornly high. At the same time a hugedebt overhang depressed both private consumption and investment. There wasa credit crunch as domestic banks struggled to deal with non-performing loansand to build up capital and reserves. But inflation fell from 52% in December1995 to 27.7% at the end of 1996.
The economic recovery broadened and strengthened in 1997, with GDPgrowth of 6.8%, the highest rate since 1981, and inflation falling at year-end to15.7%. Mexico attracted record levels of foreign direct investment. Privateconsumption finally recovered, thanks to job creation and a rebound in realearnings. New investment and strong demand in the US ensured that exportscontinued to contribute to output growth.
Inflation(% change, year on year)
1995-991999 Annual average
Consumer prices 16.6 24.5
Source: Banco de México.
Although GDP growth lost momentum at the end of the year, it continued tobe strong during 1998. Fuelled by the private sector (consumption, investmentand exports), GDP grew by 4.8%. In response to the plunge in oil prices thegovernment restricted spending; public consumption rose by only 2.2% andgross fixed investment by 10.3%. The year-end inflation rate edged up to18.6%. The government’s tight fiscal stance continued during 1999, withpublic consumption increasing by just 1%. Again the private sector was theengine of growth: private consumption rose by 4.3% and exports by 13.9%,with GDP growing 3.7%, as inflation fell to 12.3% by the end of the year (Forhistorical data on inflation see Reference table 12.)
The partial recoveryin 1996—
—strengthened in 1997and 1998
26 Mexico
EIU Country Profile 2000 © The Economist Intelligence Unit Limited 2000
Regional trends
Regional development has been uneven, industrialisation and the decline ofagriculture sharpening the divisions that exist between different areas as aresult of their varied natural resource endowments and location.
The Federal District, which includes the capital, Mexico City, accounted for noless than 23% of GDP and 21% of manufacturing value added in 1997 (morerecent data are not available). The central region, which includes the FederalDistrict and the state of Mexico bordering it, accounts for nearly one-third ofGDP despite the fact that it covers only 1.2% of the land area. The next mostimportant economic zones are the north-east and the centre-north and west.Monterrey (Nuevo León) and Guadalajara (Jalisco) are the leading industrialcities after the capital. On the Gulf coast, Veracruz has developed on the backof agricultural and, more importantly, oil resources.
The thriving maquiladora industry (in-bond assembly for re-export) has boostedemployment in the northern border area, but some states such as Chiapas,Hidalgo, Guerrero and Oaxaca are still suffering extreme poverty. Tijuana, inBaja California, and Ciudad Juárez, in Chihuahua, have evolved into importantmaquiladora cities.
The inadequate transport and communications infrastructure has impededmore balanced regional growth. However, the present government is continu-ing the infrastructure improvements begun by its predecessor. The 1998 budgetincluded the creation of a new item, Ramo 33, through which the resources forexpenditure in basic education, health services and municipal infrastructureare transferred to states and local governments. That has brought an enormousincrease in the number of transfers from the central to state and localgovernments. Moreover, those transfers are evenly spread throughout the year(previously a large proportion was allocated during the last quarter of the year).State and local governments account for only about 1% of national tax andsocial security collections, compared with 32% in the US and 25% in Japan.However, a proposal in the 1999 and 2000 budgets to allow states to top up theVAT rate by up to 2% was rejected by the opposition and scrapped. From April2000 the restrictions that state governments faced on issuing debt will beeased. That debt will be graded by rating agencies, aiming to make the processmarket-oriented.
Economic sectors
Agriculture, forestry and fishing
Although northern parts of Mexico are very dry, suffering drought for five orsix years out of ten, they have become the most productive areas for agri-culture, not only because these areas benefited most from the public irrigationschemes of the 1950s and 1960s, but because the larger farms established here
The importance of theFederal District
Regional inequalitiesremain severe—
—despite infrastructureimprovements and
federal transfers
Reforms are introduced inland ownership—

Mexico 27
© The Economist Intelligence Unit Limited 2000 EIU Country Profile 2000
have increasingly geared production for the US market. Farms in the centreand south have lagged behind, partly as a result of the legacy of agrarianreform there: large landholdings were divided up into ejidos and allocated asunits to individuals or communes by the government, could not be sold,rented or mortgaged, only inherited, and were liable to expropriation if notworked upon. The system caused increasing fragmentation of farming units,insecurity and inefficiency. The Salinas government amended the constitutionin 1992, paving the way for ejidatarios (owners of ejidos) to be given fullproperty rights to over 9m plots on the 30,000 ejidos that account for half thecountry’s area. Under the Programa de Certificación de Derechos Ejidales yTitulación de Solares (Procede) the agrarian reform ministry and the agrariantribunals had, by the beginning of 2000, provided ownership titles to 6mejidatarios (2.6m families), covering 49m ha.
The Salinas government also privatised sugar mills, the tobacco company andparts of the national basic foods supply company, Conasupo (which disap-peared in 1999). In 1993 a new scheme, Procampo, was introduced to replacethe former system of price support for basic grains, providing yearly cashpayments for 15 years to producers of cotton, rice, safflower, barley, beans,maize, sorghum, soybeans and wheat.
Inadequate investment and low productivity continue to affect agriculture,exacerbating the extreme poverty in rural areas. Its growth has consistentlyunderperformed that of the rest of the economy (growing by 0.2% in 1997, 0.8%in 1998 and 3.5% in 1999), and as a proportion of total GDP it fell from 5.8% to4.5% between 1993 and 1999. At the same time, Mexico has tended to rundeficits in its foreign trade in agricultural products. Between 1992 and 1998 asurplus was registered (in 1995 only because of recession and the effect of thedevaluation). During 1999 the deficit was $364m ($845m during 1998). In 1995President Zedillo initiated the Alianza para el Campo (Alliance for theCountryside) programme, reinforcing the Procampo system of direct cashsubsidies by providing that these should be maintained in real terms for 15 years.
To support its agricultural programme, the government has raised the level offinancing per hectare and is improving the flow of credit from state agencies.In 1996 it also had to step in with a rescheduling plan for debtors in thefarming and fishing industries as well as providing emergency funding to helpthe sector confront the third consecutive year of drought. The Punto Finalprogramme instituted at the end of 1998 and ended a year later reinforced thisobjective (see Economic sectors: Financial services).
Despite the problems in agriculture, Mexican crop production is among thehighest in the world. Overall it accounts for more than 50% of agriculturaloutput. Maize, beans, wheat and sorghum are important for the domesticmarket and coffee, sugar, fruit and vegetables are the leading agriculturalexports. Production of some traditional crops has declined. In 1999 the maizeharvest yielded 15.7m tonnes, (16.9m in 1998 and 18.1m in 1997). Wheatproduction was 3m tonnes (down from 3.2m in 1998, 3.6m in 1997). Sugarcane production reached 46.8m tonnes in 1999, below the 49.3m of 1998 (buthigher than the 44.8m of 1997). At 1m tonnes in 1999, beans were at the same
—and in the role ofthe state
Crop production is themost important activity
28 Mexico
EIU Country Profile 2000 © The Economist Intelligence Unit Limited 2000
level as 1997, but below the 1.2m tonnes of 1998. Livestock contributes about30% of agricultural output. In 1999 meat production, the most important,increased by 4.1% to a record 4.2m tonnes; milk production increased by 6.1%to 9bn litres, also a record. (Historical data on agricultural and livestockproduction are in Reference tables 13 and 14.)
Forestry accounts for about 21% of sectoral output. Over-exploitation and lackof investment and planning have hindered the industry’s growth in recenttimes (widespread fires during 1998 were an added problem), but the reform ofthe land tenure system should improve its fortunes.
The potential of fishing is a long way from being realised. Output has declined:during 1999 the catch was 1.27m tonnes, just above the 1.23m of 1998, butwell below the 1.57m of 1997. Among the main types of fish caught are tuna,prawn, sardine and squid. Domestic consumption is not high (10.2 kg per headin 1999, down from 10.7 kg in 1998 and 13 kg in 1997). The trade balance hasshown consistently a surplus for several years ($516m during 1999). Exports(prawns are by far the most important) brought in $672m in 1999 ($676m in1998 and $784m in 1997). The fishing fleet, which totalled 102,807 vessels in1998, and the country’s 62 fishing ports are in need of modernisation.
Manufacturing
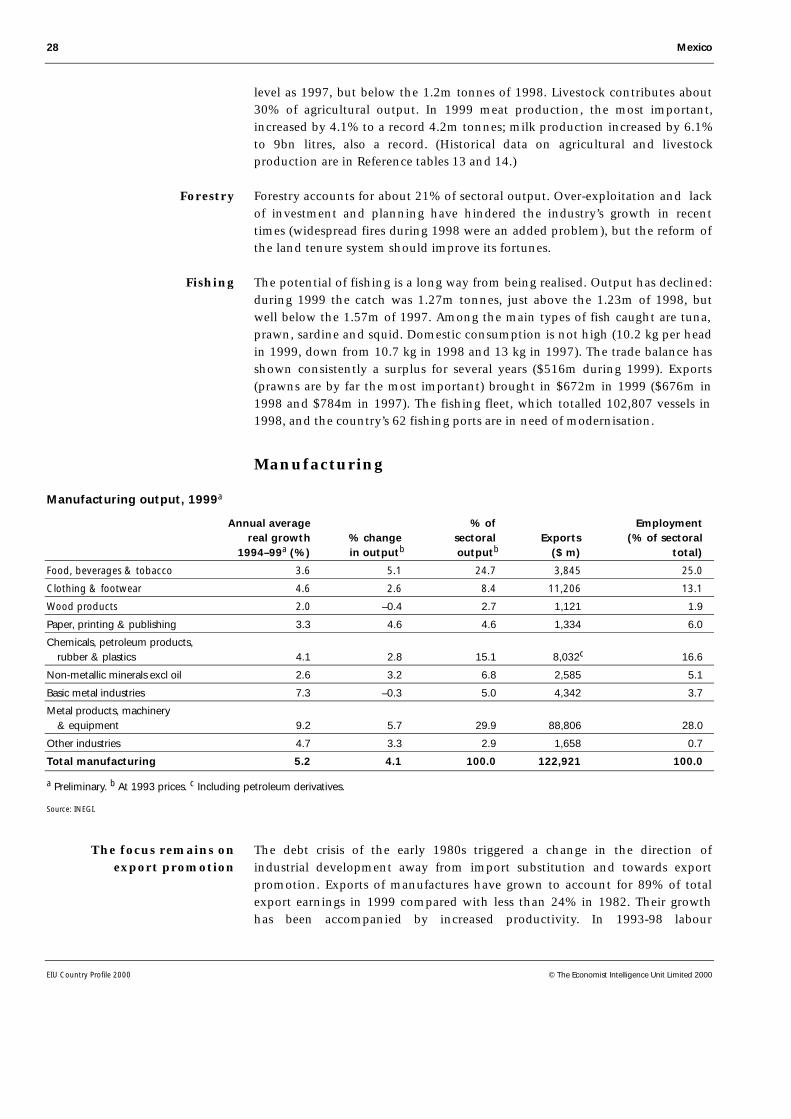
Manufacturing output, 1999a
Annual average % of Employmentreal growth % change sectoral Exports (% of sectoral
1994–99a (%) in outputb outputb ($ m) total)
Food, beverages & tobacco 3.6 5.1 24.7 3,845 25.0
Clothing & footwear 4.6 2.6 8.4 11,206 13.1
Wood products 2.0 –0.4 2.7 1,121 1.9
Paper, printing & publishing 3.3 4.6 4.6 1,334 6.0
Chemicals, petroleum products, rubber & plastics 4.1 2.8 15.1 8,032c 16.6
Non-metallic minerals excl oil 2.6 3.2 6.8 2,585 5.1
Basic metal industries 7.3 –0.3 5.0 4,342 3.7
Metal products, machinery & equipment 9.2 5.7 29.9 88,806 28.0
Other industries 4.7 3.3 2.9 1,658 0.7
Total manufacturing 5.2 4.1 100.0 122,921 100.0
a Preliminary. b At 1993 prices. c Including petroleum derivatives.
Source: INEGI.
The debt crisis of the early 1980s triggered a change in the direction ofindustrial development away from import substitution and towards exportpromotion. Exports of manufactures have grown to account for 89% of totalexport earnings in 1999 compared with less than 24% in 1982. Their growthhas been accompanied by increased productivity. In 1993-98 labour
Forestry
Fishing
The focus remains onexport promotion

Mexico 29
© The Economist Intelligence Unit Limited 2000 EIU Country Profile 2000
productivity in manufacturing rose by an annual average of 6.3% (comparedwith 4.4% in the United States and 8.7% in Germany). However, the exportbase has remained rather narrow. At the same time, Mexico’s dependence onimported intermediate goods has meant that export growth has inflated theimport bill.
Meanwhile, trade liberalisation has created serious difficulties for a largenumber of businesses that have had to face competition from imported goods.With the appreciation of the peso during the years of the Salinasadministration, salaries (when converted into dollars) increased more thanproductivity. At the same time, interest rates in dollar terms were much higherthan those paid by external competitors. This led to deindustrialisation insome sectors.
The real exchange rate has experienced significant swings during the last fewyears. A big depreciation in 1995 was followed by appreciation in 1996-97,depreciation in 1998 and appreciation once again during 1999. The floatingexchange-rate regime has reduced the risk of a build-up of large macro-economic imbalances. However, real interest rates remained high until the endof 1999, when they started to fall markedly (a trend that continued during thefirst quarter of 2000), and the financial crisis and undercapitalisation in thebanking system have led to a shortage of loans. (Reference table 15 shows howthe various manufacturing sectors have fared in recent years. The mostdynamic have been those that have been able to raise exports.)
One sector where exports have been important is metal products, machineryand equipment. This sector grew by an annual average of 9.2% in 1994-99, andin 1999 registered 5.7% growth, the highest among manufacturing industries.Automotive industry exports account for the strong performance. In 1999vehicle production totalled 1,491,968 units, 4.5% more than in 1998, thanksto strong growth during the second half of the year. During the first twomonths of 2000, production totalled 266,482 units, 15.6% more than recordedduring the same period of 1999.
A high proportion of manufacturing activity is in the maquiladora sector (in-bond assembly for re-export), from vehicle to electrical goods assembly, alongwith textiles and furniture production. At the end of 1999 there were 3,436maquiladora plants in Mexico, mostly on the US border, with nearly 1.2memployees. While manufacturing activities oriented to the domestic market (asopposed to the maquiladora sector) have been badly hit by foreign imports, themaquiladoras have flourished. A good example is in textiles.
Metal products, machineryand equipment
The maquiladora industry
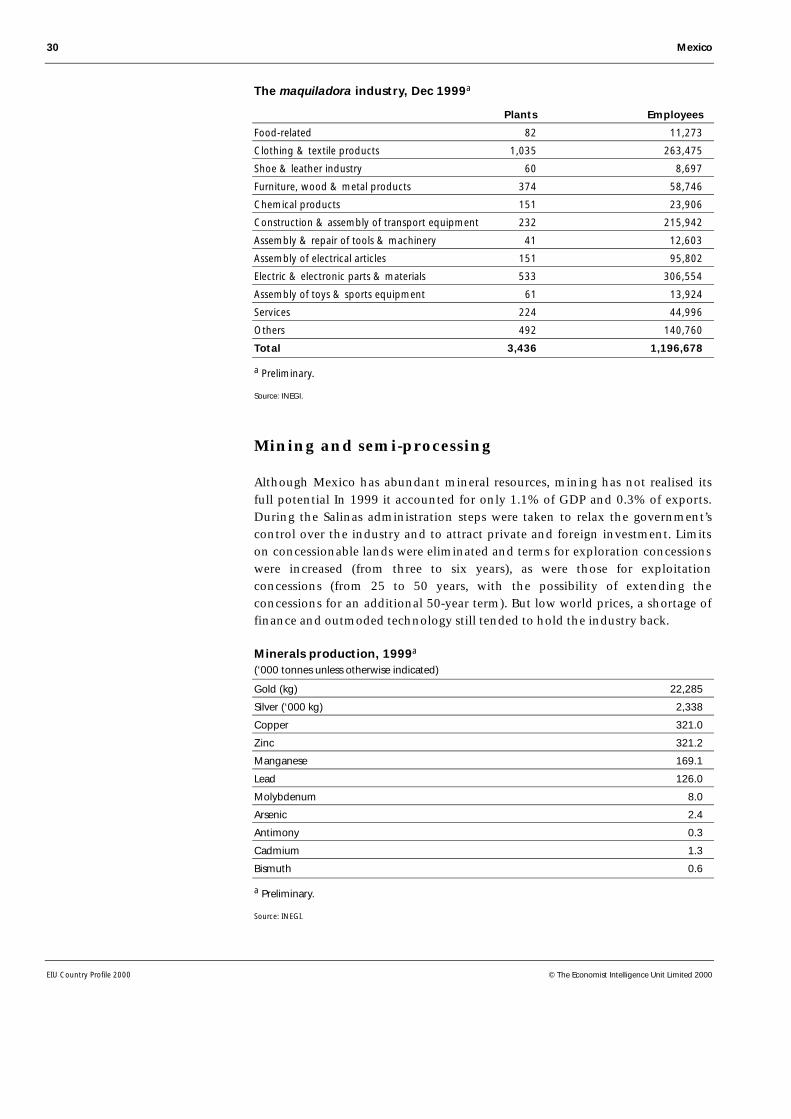
30 Mexico
EIU Country Profile 2000 © The Economist Intelligence Unit Limited 2000
The maquiladora industry, Dec 1999a
Plants Employees
Food-related 82 11,273
Clothing & textile products 1,035 263,475
Shoe & leather industry 60 8,697
Furniture, wood & metal products 374 58,746
Chemical products 151 23,906
Construction & assembly of transport equipment 232 215,942
Assembly & repair of tools & machinery 41 12,603
Assembly of electrical articles 151 95,802
Electric & electronic parts & materials 533 306,554
Assembly of toys & sports equipment 61 13,924
Services 224 44,996
Others 492 140,760
Total 3,436 1,196,678
a Preliminary.
Source: INEGI.
Mining and semi-processing
Although Mexico has abundant mineral resources, mining has not realised itsfull potential In 1999 it accounted for only 1.1% of GDP and 0.3% of exports.During the Salinas administration steps were taken to relax the government’scontrol over the industry and to attract private and foreign investment. Limitson concessionable lands were eliminated and terms for exploration concessionswere increased (from three to six years), as were those for exploitationconcessions (from 25 to 50 years, with the possibility of extending theconcessions for an additional 50-year term). But low world prices, a shortage offinance and outmoded technology still tended to hold the industry back.
Minerals production, 1999a
(‘000 tonnes unless otherwise indicated)
Gold (kg) 22,285
Silver (‘000 kg) 2,338
Copper 321.0
Zinc 321.2
Manganese 169.1
Lead 126.0
Molybdenum 8.0
Arsenic 2.4
Antimony 0.3
Cadmium 1.3
Bismuth 0.6
a Preliminary.
Source: INEGI.
Mexico 31
© The Economist Intelligence Unit Limited 2000 EIU Country Profile 2000
Mining was the only sector to experience a drop in output in 1999, contractingby 3.2%, after growth of 2.7% in 1998. Mexico is the world’s largest producerof silver, which is mined mainly in Chihuahua and Zacatecas. It also leads thefield in fluorite, celestite and sodium sulphate and is high in the producerranking for bismuth, graphite, antimony, arsenic, barite, sulphur and copper.The two biggest mines in the country Cananea (copper) and Real del Monte(silver) were privatised by the Salinas government. Lead, zinc and iron areother important products. Lead, silver, gold and zinc, and manganeseproduction declined by 27%, 18%, 14% and 10% respectively in 1999.(Reference table 16 gives historical production data for a range of minerals.)
Construction
The construction sector grew by an annual average of about 4.5% in 1988-94,largely on the strength of infrastructure developments and housing work.However, the slump in demand in 1995 had a devastating effect on theindustry, causing the value of output to contract by 23.5%, and not until May1996 did the first signs of a tentative recovery emerge. The accumulatedgrowth from 1996 to 1999 has barely returned the sector to pre-crisis levels: in1999 the value of output was 0.04% below that of 1994. In November 1999 thesector employed 291,404 people, far below the 448,573 registered in the samemonth of 1994. Several of the largest construction groups that dominate thesector have been badly hit by unsuccessful ventures in building and operatingtoll highways.
Financial services
The past few years have brought fundamental changes to the financial sector.In addition to the liberalisation of interest rates and credit terms, new financialinstruments and institutions have been created. In December 1999 there were37 commercial banks in operation. In 1991-92 the 18 banks in which thegovernment had a majority shareholding, following their nationalisation in1982, were returned to private ownership. The government then acted to allowthe establishment of new domestic banks and in 1994 it granted licences tosubsidiaries of banks operating in the US and Canada.
The newly privatised commercial banks have had problems almost from theoutset. The principal cause has been poor credit-risk management, which hasmanifested itself in an increasingly serious burden of non-performing loans.This was already evident in 1994 when the economy was growing, but thesituation worsened when a deep recession took hold. By September 1995 theratio of bad debts to the banking system’s total loan portfolio had risen to17.2% from 8.3% at the end of 1994. It went on to reach 19.2% in February1996 before slowly beginning to subside.
Faced with the prospect of a systemic banking collapse, the governmentproposed measures to deal with the problem of bad debts. In 1995-98 a total ofseven different programmes were launched to provide help to debtors. In April
The financial sector isliberalised
Bad debts—
—force the governmentto act to support debtors—
32 Mexico
EIU Country Profile 2000 © The Economist Intelligence Unit Limited 2000
1995 loans started to be converted into unidades de inversión (UDIs), unitslinked to the consumer price index. The aim was to support debtors who wereholding intrinsically viable loans and who faced temporary difficultiesservicing their debts owing to the high nominal interest rates that prevailedthroughout 1995. Special programmes were established to help debtors withmortgage, consumer, small business, and agricultural loans. A programmeintroduced in 1997 aimed to support state and local governments. The lastprogramme, announced at the end of 1998 and appropriately called PuntoFinal, gave additional subsidies to debtors with mortgage, small business andagricultural loans.
Apart from providing relief for debtors, the government has set up aprogramme to enable banks to meet capital and loan loss provisions, thePrograma de Capitalización Temporal (Procapte), as well as a fund to take overbanks’ bad debts in exchange for new capital injections by shareholders, theFondo Bancario de Protección de Ahorro (Fobaproa), now superseded by theInstituto de Protección al Ahorro Bancario (IPAB, see below). Nevertheless, ithas had to step in and take control of a number of institutions.
Five commercial banks received support through Procapte in 1995. By mid-1997 all banks had been able to liquidate their debts, and the programmewas closed.
Under Fobaproa, banks made the commitment of delivering to a trust fund, ofwhich Fobaproa is the primary beneficiary, income flows from duly qualifyingloans with adequate provisions, for an amount equivalent to twice the freshcapital contributed by the stockholders. In return for these loans, banksreceived pagarés (IOUs) guaranteed by the government.
While needing to shore up the banking sector in order to revive the economy,the government has also been aware that the financial institutions must applyUS general accounting principles from the beginning of 1997. These count thefull amount of a loan as non-performing, whereas it had been the practice inMexico to report only the overdue portion of the loan as non-performing.
At the end of 1999 the liabilities absorbed by Fobaproa totalled Ps844.2bn($89bn, equivalent to 18.3% of 1999 GDP). By 1998 it had become apparentthat only a small percentage (estimated initially at around 30% and thenlowered to 20% in 1999) of the face value of the loans absorbed by Fobaproawould be recovered, in part because of bankruptcy legislation that favoursdebtors.
An agency established in 1996 to appraise and sell the assets acquired by Fobaproafrom the banks held only one auction and was wound up. A new agency,the Instituto de Protección al Ahorro Bancario (IPAB), was approved at the end of1998 by Congress. The Punto Final programme was a condition imposed onthe government by the Partido Acción Nacional (PAN) in exchange for the votesof its legislators to approve the IPAB and with it the conversion of the pagarésissued to support the banks (originally registered as contingent debts, thentransformed into permanent liabilities). Political bargaining delayed the formalinstallation of the IPAB until the beginning of May 1999.
—and banks—
—at a substantial cost

Mexico 33
© The Economist Intelligence Unit Limited 2000 EIU Country Profile 2000
The government has sold most of the failing banks to other domestic andforeign banks. By the beginning of 2000 only one of the 18 banks privatised in1991-92 remained in the hands of its original owners, and eight banks werestill under the supervision of the National Banking and Securities Commission.
Fobaproa-IPAB and the financial sector
When the government proposed several changes to financial legislation at the end ofMarch 1998, it unleashed a political storm that was to have grave consequences. Therequest that the opposition-dominated Congress approve the conversion of theFobaproa liabilities (officially registered as “temporary” debt) into public (ie permanent)debt provoked hostility. The PRD mounted a successful campaign, portraying Fobaproaas a mechanism which had rescued large depositors and allowed fraudulent bankers tosiphon millions of dollars through operations including financing PRI politicalcampaigns, while the tax-payer had been left to pick up the bill. The PAN, fearful of thepolitical costs, quickly sided with the PRD—even demanding the resignation of thepublic officials who had headed the Fobaproa operations, notably the Banco de Méxicogovernor (finance secretary during the first half of the Zedillo administration) and thehead of the Comisión Nacional Bancaria y de Valores (CNBV, the Banking and SecurtiesNational Commission).
The government had to allow the Fobaproa accounts to be inspected by a Congress-appointed auditor. The exercise did not expose any of the expected cover-ups, butnegotiations took a considerable time. It was not until the end of 1998 that the PANagreed to approve the establishment of a successor to the Fobaproa, and it took fivemore months to agree on the appointment of its executive board. The delay virtuallyfroze the much-needed reform of the financial sector for 15 months, as the governmentrefused to sideline the Fobaproa conversion.
As soon as it was formally established, IPAB continued to shore up several banks thatwere technically bankrupt, notably Banca Serfín (the third-largest bank in the country)and Bancrecer (which needed a capital injection of nearly $11bn). IPAB also took severalsteps during the second half of 1999 and the beginning of 2000 to ensure that thetransformation and consolidation of the banking sector will continue:
• In May 1999 IPAB enacted new insurance quotas for commercial banks to cover theirdeposits and announced a seven-step programme to reduce deposit insurance, whichwill be limited to savings worth 400,000 UDIs (unidades de inversión, units indexed tothe CPI) (about $105,000, covering 95% of all bank accounts) starting from 2005.
• From the last quarter of 1999 IPAB has carried out several auctions, selling the rightsto manage and recover segments of past-due loans accumulated by Fobaproa.
• From February 2000, it has started issuing three-year bonds, that will be swapped forthe Fobaproa promissory notes. This will boost banks’ liquidity, as—unlike the Fobaproaobligations—these bonds will be traded in a secondary market.
• IPAB has started the process of selling the banks that it owns. Banca Serfín will be soldby mid-2000.
34 Mexico
EIU Country Profile 2000 © The Economist Intelligence Unit Limited 2000
There are five state development banks, including Nacional Financiera (Nafin,mainly for small and medium-sized businesses), Banco Nacional de ComercioExterior (Bancomext, foreign trade), Banco Nacional de Obras y ServiciosPúblicos (public works and services), Financiera Nacional Azucarera (sugarindustry) and Banco Nacional de Crédito Rural (rural development bank).Nafin and Bancomext are by far the most important. In 1997 the governmenttook the unusual step of starting the liquidation of the Banco Nacional deComercio Interior (BNCI).
The Mexican stockmarket (Bolsa) opened to foreigners just a decade ago,allowing them to purchase stocks in 1989 and public internal debt in 1990.After several years of strong growth in real terms, particularly 1993 and most of1994, the crisis that started in December of that year weakened the market.
After three years of consecutive falls in real terms, the stock-exchange indexincreased by 34.4% in real terms in 1997, primarily as a result of economicrecovery, foreign investment and decreasing interest rates. These gains werecompletely wiped out during 1998. In real terms, the index lost 45% duringthe year (38% in dollar terms). From mid-January 1999 the Bolsa recoveredstrongly. During the year it accumulated a nominal gain of 80% which,coupled with an appreciation of the peso, meant a gain in dollar terms of 88%.During the first quarter of 2000 the Bolsa was volatile. An early rally led bytelecommunications, media and technology stocks was halted by a sharpdecline in the US Nasdaq from late March. (For historical data on thestockmarket’s performance see Reference table 17.)
Other services
The retail sector underwent major changes in the 1990s. Large overseascompanies entered the market, setting up price clubs, discount stores andhypermarket chains, sometimes merging with or even buying up majorMexican retailers. Competition from foreign firms has pushed the leadingMexican companies to modernise and tighten up on cost control, and, as themain urban centres are becoming increasingly well served, they have widenedtheir area of operations to smaller provincial cities.
Along with the arrival of foreign firms, a feature of the retail sector in recentyears has been the development of large commercial centres. At present, onlyabout 40-45% of retail sales in Mexico are made in large modern outlets, theremainder being made by small, family-run businesses offering a limited rangeof goods.
After collapsing by 19% in 1995, retail sales started to recover only in 1997, thelarger establishments, such as department stores, being the main beneficiaries.During 1999 wholesale merchandise sales increased by 2% in real terms, andretail sales by 4.3%. However, both increases were still below the levels reachedin 1994. (For historical data on retail sales see Reference table 18.)
The tourism industry is important both as a source of foreign exchange and asan employer. In 1999 proper tourism (that is, excluding visitors from US border
The state developmentbanks
The stockmarket
Retail trade
Tourism
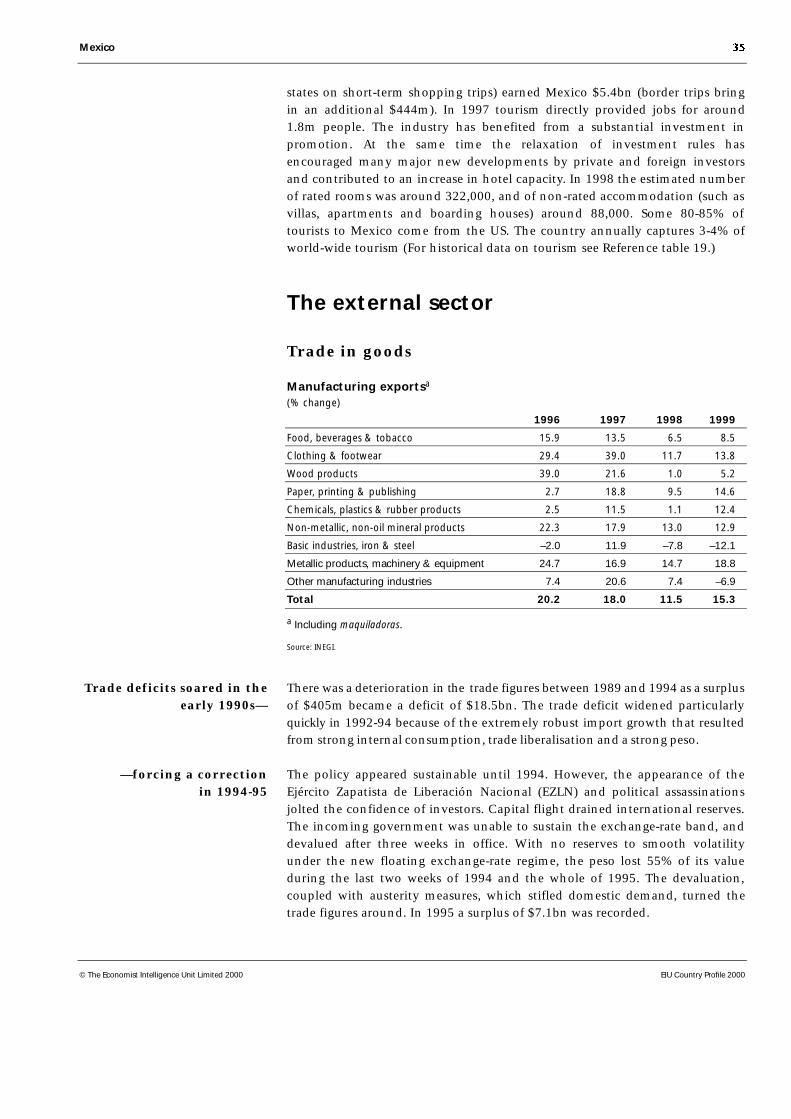
Mexico 35
© The Economist Intelligence Unit Limited 2000 EIU Country Profile 2000
states on short-term shopping trips) earned Mexico $5.4bn (border trips bringin an additional $444m). In 1997 tourism directly provided jobs for around1.8m people. The industry has benefited from a substantial investment inpromotion. At the same time the relaxation of investment rules hasencouraged many major new developments by private and foreign investorsand contributed to an increase in hotel capacity. In 1998 the estimated numberof rated rooms was around 322,000, and of non-rated accommodation (such asvillas, apartments and boarding houses) around 88,000. Some 80-85% oftourists to Mexico come from the US. The country annually captures 3-4% ofworld-wide tourism (For historical data on tourism see Reference table 19.)
The external sector
Trade in goods
Manufacturing exportsa
(% change)
1996 1997 1998 1999
Food, beverages & tobacco 15.9 13.5 6.5 8.5
Clothing & footwear 29.4 39.0 11.7 13.8
Wood products 39.0 21.6 1.0 5.2
Paper, printing & publishing 2.7 18.8 9.5 14.6
Chemicals, plastics & rubber products 2.5 11.5 1.1 12.4
Non-metallic, non-oil mineral products 22.3 17.9 13.0 12.9
Basic industries, iron & steel –2.0 11.9 –7.8 –12.1
Metallic products, machinery & equipment 24.7 16.9 14.7 18.8
Other manufacturing industries 7.4 20.6 7.4 –6.9
Total 20.2 18.0 11.5 15.3
a Including maquiladoras.
Source: INEGI.
There was a deterioration in the trade figures between 1989 and 1994 as a surplusof $405m became a deficit of $18.5bn. The trade deficit widened particularlyquickly in 1992-94 because of the extremely robust import growth that resultedfrom strong internal consumption, trade liberalisation and a strong peso.
The policy appeared sustainable until 1994. However, the appearance of theEjército Zapatista de Liberación Nacional (EZLN) and political assassinationsjolted the confidence of investors. Capital flight drained international reserves.The incoming government was unable to sustain the exchange-rate band, anddevalued after three weeks in office. With no reserves to smooth volatilityunder the new floating exchange-rate regime, the peso lost 55% of its valueduring the last two weeks of 1994 and the whole of 1995. The devaluation,coupled with austerity measures, which stifled domestic demand, turned thetrade figures around. In 1995 a surplus of $7.1bn was recorded.
Trade deficits soared in theearly 1990s—
—forcing a correctionin 1994-95
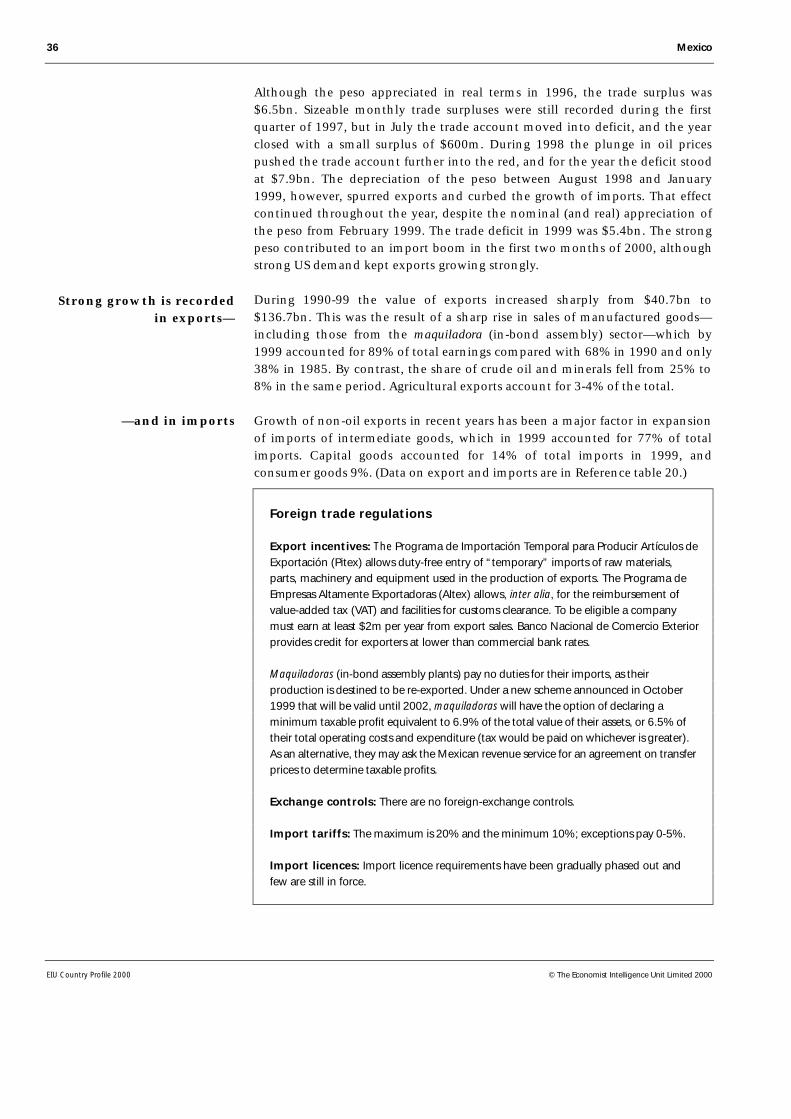
36 Mexico
EIU Country Profile 2000 © The Economist Intelligence Unit Limited 2000
Although the peso appreciated in real terms in 1996, the trade surplus was$6.5bn. Sizeable monthly trade surpluses were still recorded during the firstquarter of 1997, but in July the trade account moved into deficit, and the yearclosed with a small surplus of $600m. During 1998 the plunge in oil pricespushed the trade account further into the red, and for the year the deficit stoodat $7.9bn. The depreciation of the peso between August 1998 and January1999, however, spurred exports and curbed the growth of imports. That effectcontinued throughout the year, despite the nominal (and real) appreciation ofthe peso from February 1999. The trade deficit in 1999 was $5.4bn. The strongpeso contributed to an import boom in the first two months of 2000, althoughstrong US demand kept exports growing strongly.
During 1990-99 the value of exports increased sharply from $40.7bn to$136.7bn. This was the result of a sharp rise in sales of manufactured goods—including those from the maquiladora (in-bond assembly) sector—which by1999 accounted for 89% of total earnings compared with 68% in 1990 and only38% in 1985. By contrast, the share of crude oil and minerals fell from 25% to8% in the same period. Agricultural exports account for 3-4% of the total.
Growth of non-oil exports in recent years has been a major factor in expansionof imports of intermediate goods, which in 1999 accounted for 77% of totalimports. Capital goods accounted for 14% of total imports in 1999, andconsumer goods 9%. (Data on export and imports are in Reference table 20.)
Foreign trade regulations
Export incentives: The Programa de Importación Temporal para Producir Artículos deExportación (Pitex) allows duty-free entry of “temporary” imports of raw materials,parts, machinery and equipment used in the production of exports. The Programa deEmpresas Altamente Exportadoras (Altex) allows, inter alia, for the reimbursement ofvalue-added tax (VAT) and facilities for customs clearance. To be eligible a companymust earn at least $2m per year from export sales. Banco Nacional de Comercio Exteriorprovides credit for exporters at lower than commercial bank rates.
Maquiladoras (in-bond assembly plants) pay no duties for their imports, as theirproduction is destined to be re-exported. Under a new scheme announced in October1999 that will be valid until 2002, maquiladoras will have the option of declaring aminimum taxable profit equivalent to 6.9% of the total value of their assets, or 6.5% oftheir total operating costs and expenditure (tax would be paid on whichever is greater).As an alternative, they may ask the Mexican revenue service for an agreement on transferprices to determine taxable profits.
Exchange controls: There are no foreign-exchange controls.
Import tariffs: The maximum is 20% and the minimum 10%; exceptions pay 0-5%.
Import licences: Import licence requirements have been gradually phased out andfew are still in force.
Strong growth is recordedin exports—
—and in imports
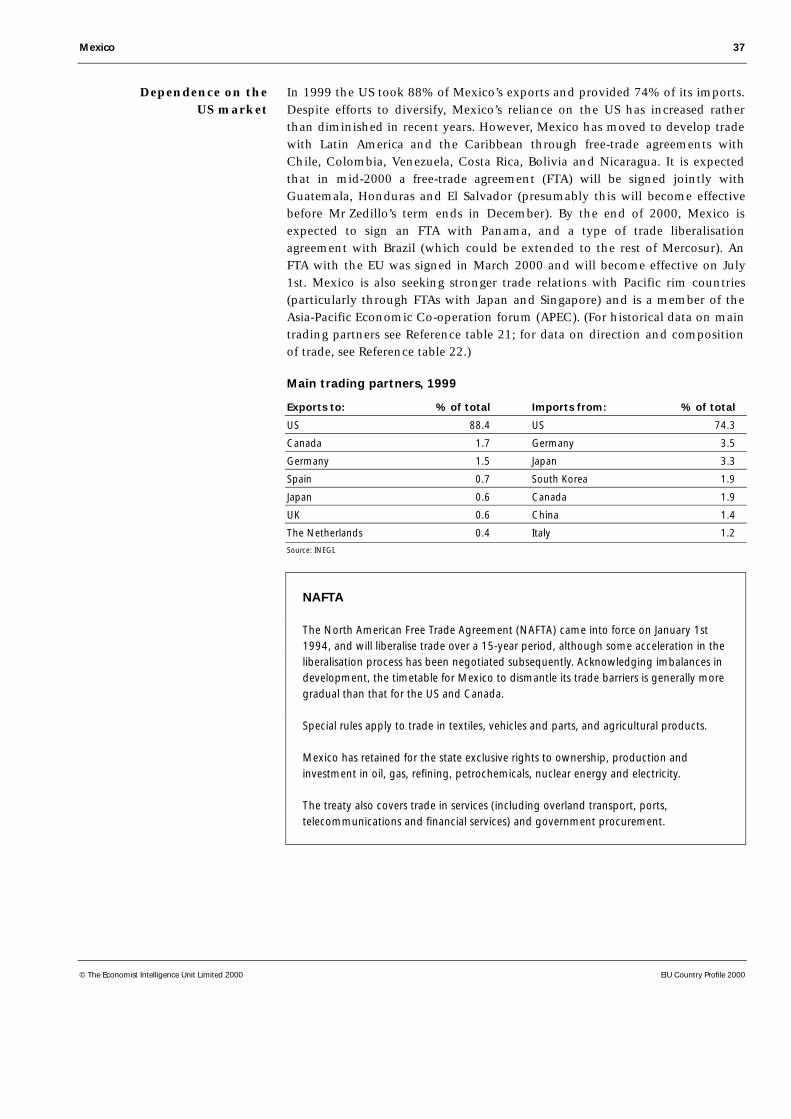
Mexico 37
© The Economist Intelligence Unit Limited 2000 EIU Country Profile 2000
In 1999 the US took 88% of Mexico’s exports and provided 74% of its imports.Despite efforts to diversify, Mexico’s reliance on the US has increased ratherthan diminished in recent years. However, Mexico has moved to develop tradewith Latin America and the Caribbean through free-trade agreements withChile, Colombia, Venezuela, Costa Rica, Bolivia and Nicaragua. It is expectedthat in mid-2000 a free-trade agreement (FTA) will be signed jointly withGuatemala, Honduras and El Salvador (presumably this will become effectivebefore Mr Zedillo’s term ends in December). By the end of 2000, Mexico isexpected to sign an FTA with Panama, and a type of trade liberalisationagreement with Brazil (which could be extended to the rest of Mercosur). AnFTA with the EU was signed in March 2000 and will become effective on July1st. Mexico is also seeking stronger trade relations with Pacific rim countries(particularly through FTAs with Japan and Singapore) and is a member of theAsia-Pacific Economic Co-operation forum (APEC). (For historical data on maintrading partners see Reference table 21; for data on direction and compositionof trade, see Reference table 22.)
Main trading partners, 1999
Exports to: % of total Imports from: % of total
US 88.4 US 74.3
Canada 1.7 Germany 3.5
Germany 1.5 Japan 3.3
Spain 0.7 South Korea 1.9
Japan 0.6 Canada 1.9
UK 0.6 China 1.4
The Netherlands 0.4 Italy 1.2
Source: INEGI.
NAFTA
The North American Free Trade Agreement (NAFTA) came into force on January 1st1994, and will liberalise trade over a 15-year period, although some acceleration in theliberalisation process has been negotiated subsequently. Acknowledging imbalances indevelopment, the timetable for Mexico to dismantle its trade barriers is generally moregradual than that for the US and Canada.
Special rules apply to trade in textiles, vehicles and parts, and agricultural products.
Mexico has retained for the state exclusive rights to ownership, production andinvestment in oil, gas, refining, petrochemicals, nuclear energy and electricity.
The treaty also covers trade in services (including overland transport, ports,telecommunications and financial services) and government procurement.
Dependence on theUS market

38 Mexico
EIU Country Profile 2000 © The Economist Intelligence Unit Limited 2000
Mexico-EU FTA
The free-trade agreement between Mexico and the European Union was signed, after itsapproval by the Mexican Senate and the European Parliament, on March 23rd 2000. Itwill enter into force on July 1st.
Complete elimination of tariffs will take 10-years (much less time than under the NAFTAprovisions). The imbalances between both parties will be addressed in the tariff-reductiontimetable: when the agreement begins, 58.2% (in value terms) of Mexican exports to theEU will enter the trade bloc freely, while 27.6% of EU exports to Mexico will enter freely.
Sensitive agricultural products, for both Mexico and the EU, were excluded— several crops,meat, sugar and milk products. Rules of origin are in the 40-60% range, with those for theautomobile sector starting at 45% and increasing to a permanent level of 60% by 2005.
Invisibles and the current account
The growth in the trade deficit between 1990 and 1994 was accompanied by awidening of the gap on the invisibles account. From $6.6bn in 1990 this rose to$11.2bn in 1994, contributing to a marked widening of the current account,which was in deficit by $29.7bn in 1994. The deficit on the current account wasslashed to just $1.6bn in 1995, not only because of the turnaround on the tradeaccount but also because the shortfall on the combined income, services andcurrent transfers accounts had shrunk to $8.7bn. The widening of the current-account deficit from 1996 to 1998 is explained largely by the increase in thetrade balance for goods, as the balances on services and non-factor serviceswere fairly stable. In 1999 the current-account deficit, at $14bn, was lower thanthe $15.7bn of 1998. This was mostly explained by the shrinking of the tradedeficit, offset by a widening of the deficit of non-factor services.
Tourism is an important item on both the credit and debit sides. In 1999tourists, including those engaged in “border travel” (mainly crossbordershopping trips) and cruise-ship visitors, brought in $7.6bn. Tourism outgoings,which vary with the strength of the peso, amounted to $4.5bn in 1999. Thepublished balance-of-payments figures understate Mexico’s recent current-account income because they include debits on freight and insurance but notcredits, which are included in the “net errors and omissions” column. In 1994debits on freight, insurance and other costs amounted to $2.6bn, comparedwith $1.5bn in 1990. With the decline in imports in 1995 these debitsdecreased to $2bn, but they increased again to $2.5bn in 1996, $3.3bn in 1997,$3.7bn in 1998, and $4.1bn in 1999.
The largest element under the heading of factor services is interest payments,which totalled $13bn during 1999, above the $12.5bn paid in 1998 and the$12.4bn of 1997, but below the $13.4bn paid in 1996. On the credit side,interest income in 1999 was $4.1bn. This is earned partly on deposits of foreignreserves abroad and partly on Mexican companies’ overseas investments.
Non-factor services
Factor services
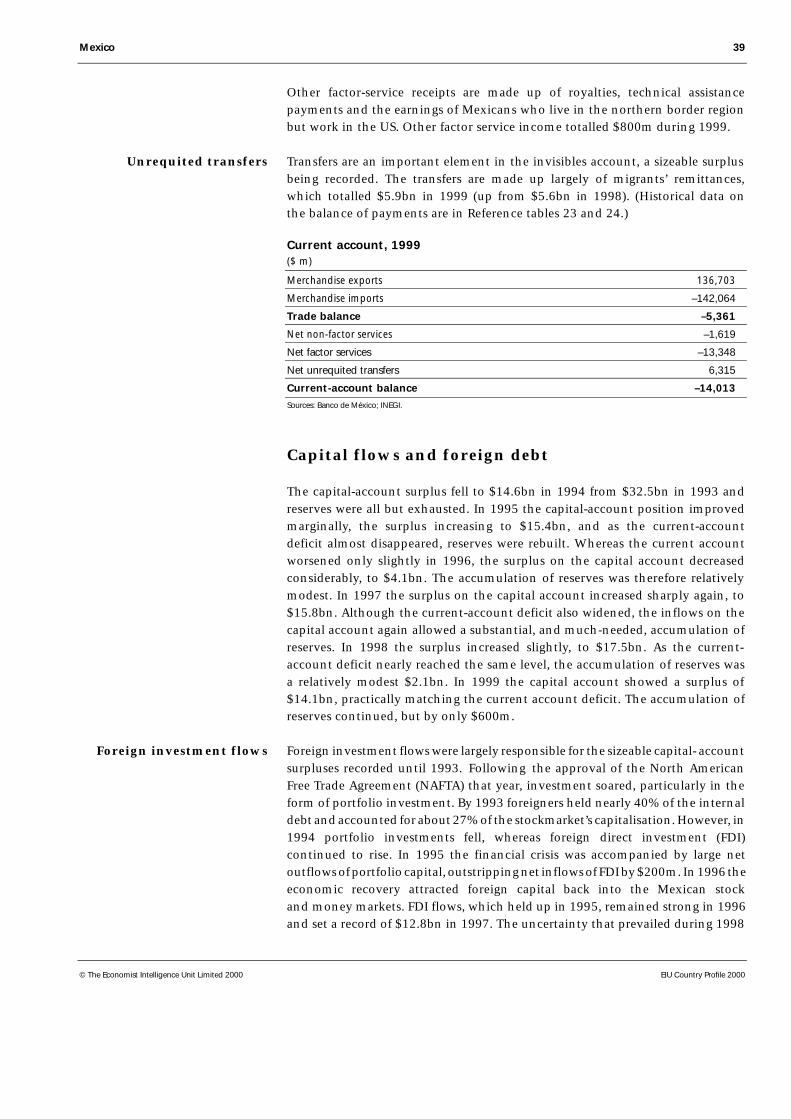
Mexico 39
© The Economist Intelligence Unit Limited 2000 EIU Country Profile 2000
Other factor-service receipts are made up of royalties, technical assistancepayments and the earnings of Mexicans who live in the northern border regionbut work in the US. Other factor service income totalled $800m during 1999.
Transfers are an important element in the invisibles account, a sizeable surplusbeing recorded. The transfers are made up largely of migrants’ remittances,which totalled $5.9bn in 1999 (up from $5.6bn in 1998). (Historical data onthe balance of payments are in Reference tables 23 and 24.)
Current account, 1999($ m)
Merchandise exports 136,703
Merchandise imports –142,064
Trade balance –5,361
Net non-factor services –1,619
Net factor services –13,348
Net unrequited transfers 6,315
Current-account balance –14,013
Sources: Banco de México; INEGI.
Capital flows and foreign debt
The capital-account surplus fell to $14.6bn in 1994 from $32.5bn in 1993 andreserves were all but exhausted. In 1995 the capital-account position improvedmarginally, the surplus increasing to $15.4bn, and as the current-accountdeficit almost disappeared, reserves were rebuilt. Whereas the current accountworsened only slightly in 1996, the surplus on the capital account decreasedconsiderably, to $4.1bn. The accumulation of reserves was therefore relativelymodest. In 1997 the surplus on the capital account increased sharply again, to$15.8bn. Although the current-account deficit also widened, the inflows on thecapital account again allowed a substantial, and much-needed, accumulation ofreserves. In 1998 the surplus increased slightly, to $17.5bn. As the current-account deficit nearly reached the same level, the accumulation of reserves wasa relatively modest $2.1bn. In 1999 the capital account showed a surplus of$14.1bn, practically matching the current account deficit. The accumulation ofreserves continued, but by only $600m.
Foreign investment flows were largely responsible for the sizeable capital- accountsurpluses recorded until 1993. Following the approval of the North AmericanFree Trade Agreement (NAFTA) that year, investment soared, particularly in theform of portfolio investment. By 1993 foreigners held nearly 40% of the internaldebt and accounted for about 27% of the stockmarket’s capitalisation. However, in1994 portfolio investments fell, whereas foreign direct investment (FDI)continued to rise. In 1995 the financial crisis was accompanied by large netoutflows of portfolio capital, outstripping net inflows of FDI by $200m. In 1996 theeconomic recovery attracted foreign capital back into the Mexican stockand money markets. FDI flows, which held up in 1995, remained strong in 1996and set a record of $12.8bn in 1997. The uncertainty that prevailed during 1998
Unrequited transfers
Foreign investment flows
40 Mexico
EIU Country Profile 2000 © The Economist Intelligence Unit Limited 2000
caused portfolio investments to fall by $452m (a net outflow of $666m in thestockmarket and a net inflow of $214m in the money market). However, FDI flowsheld up, reaching $11.3bn. In 1999 FDI inflows remained strong, at $11.6bn,with portfolio investments increasing sharply in the stockmarket (by $3.8bn)and modestly in the money market ($131m), bringing the total to $3.9bn.(Historical data on foreign investment are in Reference table 25.)
Foreign investment regulations
The Foreign Investments Law, effective from December 1993, allows for 100% foreigninvestment participation in the equity of a Mexican company except in of specific areas.
The exceptions include those activities reserved exclusively for the state, namely:
• oil, hydrocarbons, basic petrochemicals, electricity power distribution, nuclear powerand radioactive minerals;
• telegraphs, radiotelegraphs and post;
• issuance of monetary bills and minting of coins; and
• other areas provided for by other legislation.
The following areas are reserved for Mexican nationals:
• domestic cargo and passenger (including tourism) land transport;
• retailing of petrol and distribution of liquefied gas;
• radio and television broadcasting (other than cable television); and
• credit unions, development banks and technical and professional services providedfor in other legislation.
Foreigners can participate in other areas but only through “neutral” investments (that isthrough non-voting equity).
There are specific limits to foreign investors’ interests in the following areas:
• 10% for production co-operatives;
• 25% for domestic air transport, air taxis and specialised air transport;
• 30% for financial groups’ holding companies, brokerage houses and stock-exchangespecialists; and
• 49% for certain activities in finance, communications, transport and agriculture.
Here again foreign investment can exceed the 49% limit but only in the form of non-voting equity.
Mexico 41
© The Economist Intelligence Unit Limited 2000 EIU Country Profile 2000
External debt was increased nearly fivefold by the Echeverría administration(particularly during 1973-76) and almost tripled under President López Portillo(mainly in 1981-82). For several years afterwards public-sector debt was fairlystatic, following a series of debt-renegotiation exercises between 1982 and1990. The last such operation was a Brady Plan deal, which included debt-stockand debt-service reductions. Although the stock of public debt was not greatlyaltered, the psychological impact was huge and the operation restored Mexico’saccess to the international capital markets. After remaining fairly constantbetween 1990, at $77.8bn, and 1993, at $78.7bn, public external debtincreased to $85.4bn in 1994 (mainly through bond issues) and to $100.9bn in1995, because of massive borrowing from the IMF and the US government topay the dollar-denominated tesobonos (see Economic policy). The governmentwas able to return to the international capital markets in May 1995.
The original support committed by the US government amounted to $20bnbut, at its peak in July 1995, the amount outstanding reached $12.5bn. Thegovernment began to repay the debt in October 1995, and by January 1997 theoutstanding balance was cleared. Between August 1996 and end-April 1997Mexico made payments totalling SDR2.5bn ($3.52bn) to the IMF, of whichSDR1.92bn were advance payments. In order to postpone payments owed tothe IMF during 1999-2000, the government negotiated a 17-month standbyprogramme with the Fund in June 1999. It totals SDR3.1bn ($4.2bn) and willbe repaid in 2003-05.
The IMF agreement (ratified by its Executive in March 2000 as Mexico hadcomplied with the programme) was part of a much wider strategy, thePrograma de Fortalecimiento Financero 1999-2000, also announced in June1999. The programme outlined lending programmes and credit lines availablefor a total of $23.7bn. In addition to the IMF monies, the World Bank agreed tolend $5.2bn, the Inter-American Development Bank $3.5bn, and $4bn wouldbe available in credit lines from the US Eximbank. A further $6.8bn in currencyswaps would be available from the US Federal Reserve and the Bank of Canada.The programme ensured that the government will have no difficulty inrefinancing the debt payments owed during 2000. Public foreign debt at theend of 1999 stood at $92.3bn, the same level as in 1998. (Reference table 26gives historical World Bank data on external debt, Reference table 27 givesnational external debt estimates and Reference table 28 gives the amortisationschedule for global external debt until 2006.)
In recent years private-sector foreign borrowing has increased because thenon-banking sector, in particular, has found it cheaper to borrow from foreignbanks and to raise money through foreign bond issues and the placementof commercial paper than to borrow from domestic banks. During 1999private non-bank sector debt increased by $3.6bn to $47.3bn.
Foreign public-sector debt
Foreign private-sector debt

42 Mexico
EIU Country Profile 2000 © The Economist Intelligence Unit Limited 2000
Foreign debt($ bn; end-period)
1995 1996 1997 1998 1999
Public sector 100.9 98.3 88.3 92.3 92.3
Private non-bank sector 30.7 33.5 38.8 43.7 47.3
Commercial banks 20.9 19.2 17.4 17.0 15.5
Banco de México 17.3 13.3 9.1 8.4 6.0
Total 169.9 164.3 153.6 161.3 161.1
Sources: Secretaría de Hacienda y Crédito Público; Banco de México.
Foreign reserves and the exchange rate
With capital-account surpluses amply covering current-account deficits, foreignreserves increased every year from 1989 to 1993, reaching a peak of $29.2bn inmid-February 1994. However, they plummeted in the months that followed asinvestors’ confidence was sapped, first by political upheavals and then bygrowing concern about the current-account deficit. The government’s handlingof the devaluation in December 1994 exacerbated the situation; capital fled thecountry and reserves dropped to only $6.3bn. Panic ensued in the followingdays, particularly when it was discovered that $29bn of tesobonos matured inthe following 12 months.
Reserves fell further in early 1995 to a low point of $3.4bn at end-January, butbegan to recover following the rescue operation by the US government and theIMF and a draconian economic adjustment. By the end of 1995 reserves hadrecovered to $16.8bn. Between January and July 1996 the Banco de México didnot intervene in the foreign-exchange market. In August 1996 it launched asuccessful programme of auctioning peso call options to the commercial bankswith the aim of increasing international reserves. The original objective was toincrease net international reserves by at least $2.5bn during 1997, but insteadreserves went up by $13.5bn. In 1998 the accumulation of reserves was $2.1bn,and during 1999 an even more modest $594m.
The increase in reserves has allowed the central bank officially to pursue apolicy to moderate exchange-rate volatility, by intervening in the markets,with $200m, when the peso depreciates by more than 2% against the exchangerate of the preceding day. During the last two years that rule has been brokenonly once, when Banco de México sold $278m in the exchange markets in theaftermath of the Russian devaluation. (For historical data on foreign reservessee Reference table 29; for data on the exchange rate see Reference table 30.)
Mexico 43
© The Economist Intelligence Unit Limited 2000 EIU Country Profile 2000
Appendices
Sources of information
Banco de México, Indicadores del Sector Externo (monthly)
Banco de México, Indicadores Económicos (monthly)
Banco de México, Informe Anual (annual)
Banco de México, The Mexican Economy (annual)
Banco Nacional de Comercio Exterior, Comercio Exterior (monthly)
Instituto Nacional de Estadística, Geografía e Informática (INEGI), Bulletin ofStatistical Information (quarterly)
INEGI, Sistema de Cuentas Nacionales (annual)
INEGI also produces surveys of urban employment, national income andexpenditure, industrial performance (quarterly and annually) and maquiladoras
Nacional Financiera, El Mercado de Valores (monthly)
Presidencia de la República, Informe de Ejecución del Plan Nacional de Desarrollo(annual)
Presidencia de la República, Informe de Gobierno (annual)
Secretaría de Hacienda y Crédito Público, Cuenta de la Hacienda Pública Federal(annual)
Secretaría de Hacienda y Crédito Público, Informe sobre la Situación Económica,las Finanzas Públicas y la Deuda Pública (quarterly)
Secretaría de Hacienda y Crédito Público, Mexico: Economic and FinancialStatistics Data Book (half-yearly)
Office of the President: http://www.presidencia.gob.mx
Ministry of Agriculture, Livestock and Rural Development:http://www.sagar.gob.mx
Ministry of Commerce and Industrial Fostering: http://www.secofi.gob.mx
Ministry of Communications and Transport: http://www.sct.gob.mx
Ministry of Energy: http://www.energia.gob.mx
Ministry of Environment, Natural Resources and Fisheries:http://www.semarnap.gob.mx
Ministry of Finance: http://www.shcp.gob.mx
Ministry of Foreign Relations: http://www.sre.gob.mx
Ministry of Health: http://www.ssa.gob.mx
Ministry of Interior: http://www.gobernacion.gob.mx
National statistical sources
Internet addresses
44 Mexico
EIU Country Profile 2000 © The Economist Intelligence Unit Limited 2000
Ministry of Labour and Social Welfare: http://www.stps.gob.mx
Ministry of Tourism: http://mexico-travel.com
Banco de México: http://www.banxico.org.mx
Businesses Information System: http://www.secofi-siem.gob.mx
Chamber of Deputies: http://www.camaradediputados.gob.mx
Congress: http://www.cddhcu.gob.mx
Federal Electoral Institute: http://www.ife.org.mx
INEGI: http://www.inegi.gob.mx
Mexican Investment Board: http://www.mib.org.mx
Mexican Legislation: http://www.juridicas.unam.mx/infojus/fij.htm
National Bank for Foreign Trade: http://www.bancomext.gob.mx
Petróleos Mexicanos: http://www.pemex.com
Senate: http://www.senado.gob.mx
Stock Exchange: http://www.bmv.com.mx
Supreme Court: http://www.scjn.gob.mx
Energy Data Associates, Bishops Walk House, 19-23 High Street,Pinner, HA5 5PJ
IMF, International Financial Statistics (monthly)
Inter-American Development Bank, Economic and Social Progress in LatinAmerica (annual)
OECD, Economic Survey of Mexico, 1999
UN, Monthly Bulletin of Statistics
UN Economic Commission for Latin America and the Caribbean,EconomicSurvey of Latin America and the Caribbean (annual)
UN Food and Agriculture Organisation, Production Yearbook
World Bank, Global Development Finance (annual)
World Bank, World Development Report (annual)
Enrique Cárdenas, La Política Económica en México 1950-1994, FCE, 1996
Jorge G. Castañeda, La Herencia, Alfaguara, 1999
Enrique Krauze, La Presidencia Imperial, Tusquets Editores, 1997
Alan Riding, Mexico: Inside the Volcano, I B Tauris, London, 1987
Luis Spota, Casi el Paraíso, FCE, 1963
Luis Spota, Paraíso 25, FCE, 1983
Select bibliography
International statisticalsources
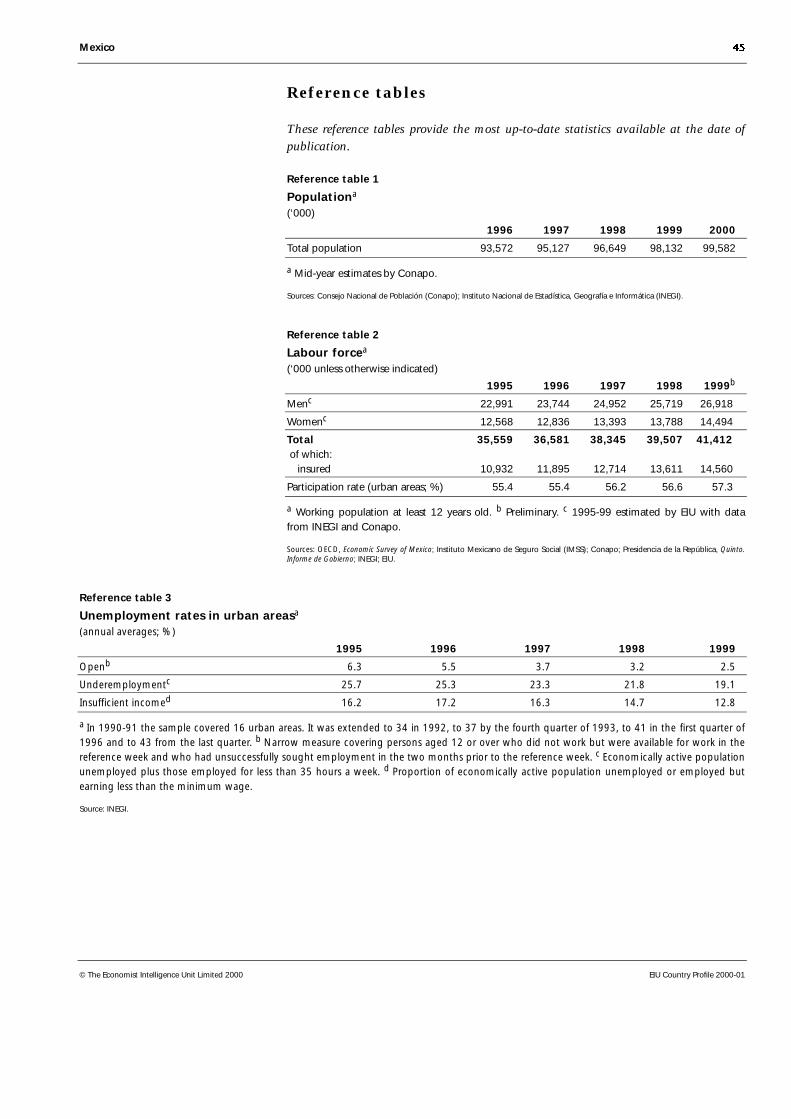
Mexico 45
© The Economist Intelligence Unit Limited 2000 EIU Country Profile 2000-01
Reference tables
These reference tables provide the most up-to-date statistics available at the date ofpublication.
Reference table 1
Populationa
(‘000)
1996 1997 1998 1999 2000
Total population 93,572 95,127 96,649 98,132 99,582
a Mid-year estimates by Conapo.
Sources: Consejo Nacional de Población (Conapo); Instituto Nacional de Estadística, Geografía e Informática (INEGI).
Reference table 2
Labour forcea
(‘000 unless otherwise indicated)
1995 1996 1997 1998 1999b
Menc 22,991 23,744 24,952 25,719 26,918
Womenc 12,568 12,836 13,393 13,788 14,494
Total 35,559 36,581 38,345 39,507 41,412 of which: insured 10,932 11,895 12,714 13,611 14,560
Participation rate (urban areas; %) 55.4 55.4 56.2 56.6 57.3
a Working population at least 12 years old. b Preliminary. c 1995-99 estimated by EIU with datafrom INEGI and Conapo.
Sources: OECD, Economic Survey of Mexico; Instituto Mexicano de Seguro Social (IMSS); Conapo; Presidencia de la República, Quinto.Informe de Gobierno; INEGI; EIU.
Reference table 3
Unemployment rates in urban areasa
(annual averages; %)
1995 1996 1997 1998 1999
Openb 6.3 5.5 3.7 3.2 2.5
Underemploymentc 25.7 25.3 23.3 21.8 19.1
Insufficient incomed 16.2 17.2 16.3 14.7 12.8
a In 1990-91 the sample covered 16 urban areas. It was extended to 34 in 1992, to 37 by the fourth quarter of 1993, to 41 in the first quarter of1996 and to 43 from the last quarter. b Narrow measure covering persons aged 12 or over who did not work but were available for work in thereference week and who had unsuccessfully sought employment in the two months prior to the reference week. c Economically active populationunemployed plus those employed for less than 35 hours a week. d Proportion of economically active population unemployed or employed butearning less than the minimum wage.
Source: INEGI.
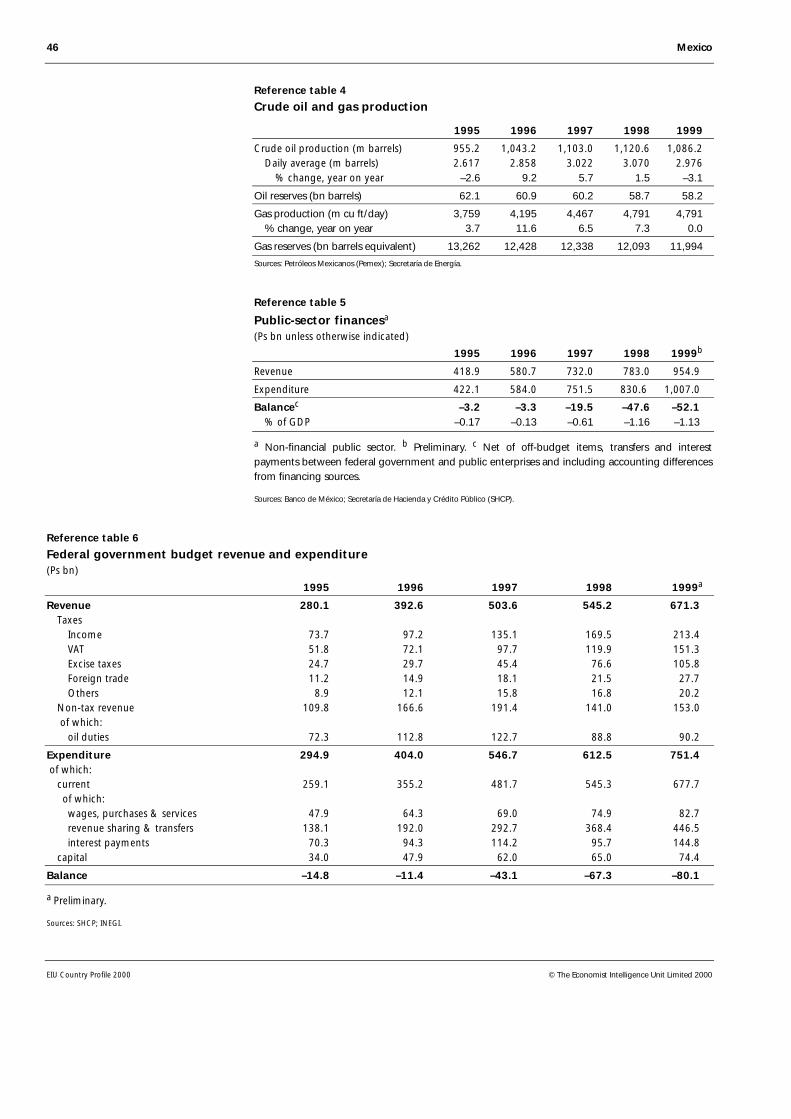
46 Mexico
EIU Country Profile 2000 © The Economist Intelligence Unit Limited 2000
Reference table 4
Crude oil and gas production
1995 1996 1997 1998 1999
Crude oil production (m barrels) 955.2 1,043.2 1,103.0 1,120.6 1,086.2 Daily average (m barrels) 2.617 2.858 3.022 3.070 2.976 % change, year on year –2.6 9.2 5.7 1.5 –3.1
Oil reserves (bn barrels) 62.1 60.9 60.2 58.7 58.2
Gas production (m cu ft/day) 3,759 4,195 4,467 4,791 4,791 % change, year on year 3.7 11.6 6.5 7.3 0.0
Gas reserves (bn barrels equivalent) 13,262 12,428 12,338 12,093 11,994
Sources: Petróleos Mexicanos (Pemex); Secretaría de Energía.
Reference table 5
Public-sector financesa
(Ps bn unless otherwise indicated)
1995 1996 1997 1998 1999b
Revenue 418.9 580.7 732.0 783.0 954.9
Expenditure 422.1 584.0 751.5 830.6 1,007.0
Balancec –3.2 –3.3 –19.5 –47.6 –52.1 % of GDP –0.17 –0.13 –0.61 –1.16 –1.13
a Non-financial public sector. b Preliminary. c Net of off-budget items, transfers and interestpayments between federal government and public enterprises and including accounting differencesfrom financing sources.
Sources: Banco de México; Secretaría de Hacienda y Crédito Público (SHCP).
Reference table 6
Federal government budget revenue and expenditure(Ps bn)
1995 1996 1997 1998 1999a
Revenue 280.1 392.6 503.6 545.2 671.3 Taxes Income 73.7 97.2 135.1 169.5 213.4 VAT 51.8 72.1 97.7 119.9 151.3 Excise taxes 24.7 29.7 45.4 76.6 105.8 Foreign trade 11.2 14.9 18.1 21.5 27.7 Others 8.9 12.1 15.8 16.8 20.2 Non-tax revenue 109.8 166.6 191.4 141.0 153.0 of which: oil duties 72.3 112.8 122.7 88.8 90.2
Expenditure 294.9 404.0 546.7 612.5 751.4 of which: current 259.1 355.2 481.7 545.3 677.7 of which: wages, purchases & services 47.9 64.3 69.0 74.9 82.7 revenue sharing & transfers 138.1 192.0 292.7 368.4 446.5 interest payments 70.3 94.3 114.2 95.7 144.8 capital 34.0 47.9 62.0 65.0 74.4
Balance –14.8 –11.4 –43.1 –67.3 –80.1
a Preliminary.
Sources: SHCP; INEGI.
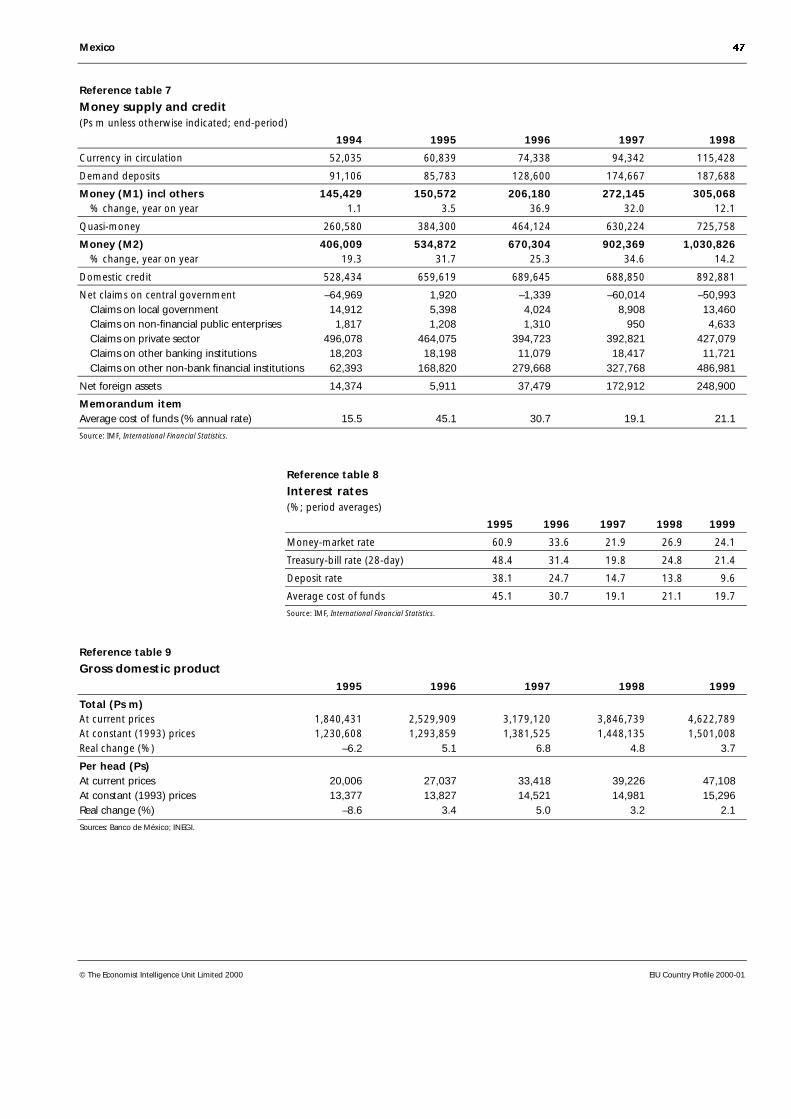
Mexico 47
© The Economist Intelligence Unit Limited 2000 EIU Country Profile 2000-01
Reference table 7
Money supply and credit(Ps m unless otherwise indicated; end-period)
1994 1995 1996 1997 1998
Currency in circulation 52,035 60,839 74,338 94,342 115,428
Demand deposits 91,106 85,783 128,600 174,667 187,688
Money (M1) incl others 145,429 150,572 206,180 272,145 305,068 % change, year on year 1.1 3.5 36.9 32.0 12.1
Quasi-money 260,580 384,300 464,124 630,224 725,758
Money (M2) 406,009 534,872 670,304 902,369 1,030,826 % change, year on year 19.3 31.7 25.3 34.6 14.2
Domestic credit 528,434 659,619 689,645 688,850 892,881
Net claims on central government –64,969 1,920 –1,339 –60,014 –50,993 Claims on local government 14,912 5,398 4,024 8,908 13,460 Claims on non-financial public enterprises 1,817 1,208 1,310 950 4,633 Claims on private sector 496,078 464,075 394,723 392,821 427,079 Claims on other banking institutions 18,203 18,198 11,079 18,417 11,721 Claims on other non-bank financial institutions 62,393 168,820 279,668 327,768 486,981
Net foreign assets 14,374 5,911 37,479 172,912 248,900
Memorandum itemAverage cost of funds (% annual rate) 15.5 45.1 30.7 19.1 21.1
Source: IMF, International Financial Statistics.
Reference table 8
Interest rates(%; period averages)
1995 1996 1997 1998 1999
Money-market rate 60.9 33.6 21.9 26.9 24.1
Treasury-bill rate (28-day) 48.4 31.4 19.8 24.8 21.4
Deposit rate 38.1 24.7 14.7 13.8 9.6
Average cost of funds 45.1 30.7 19.1 21.1 19.7
Source: IMF, International Financial Statistics.
Reference table 9
Gross domestic product1995 1996 1997 1998 1999
Total (Ps m)At current prices 1,840,431 2,529,909 3,179,120 3,846,739 4,622,789At constant (1993) prices 1,230,608 1,293,859 1,381,525 1,448,135 1,501,008Real change (%) –6.2 5.1 6.8 4.8 3.7
Per head (Ps)At current prices 20,006 27,037 33,418 39,226 47,108At constant (1993) prices 13,377 13,827 14,521 14,981 15,296Real change (%) –8.6 3.4 5.0 3.2 2.1
Sources: Banco de México; INEGI.
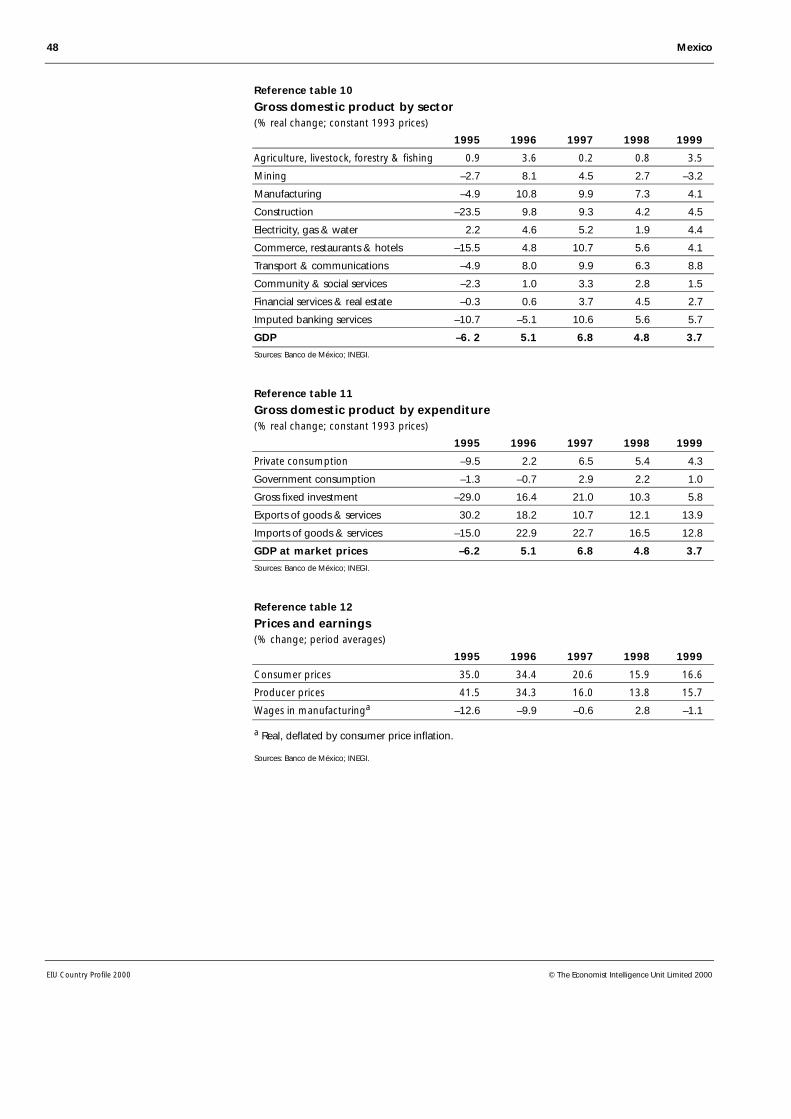
48 Mexico
EIU Country Profile 2000 © The Economist Intelligence Unit Limited 2000
Reference table 10
Gross domestic product by sector(% real change; constant 1993 prices)
1995 1996 1997 1998 1999
Agriculture, livestock, forestry & fishing 0.9 3.6 0.2 0.8 3.5
Mining –2.7 8.1 4.5 2.7 –3.2
Manufacturing –4.9 10.8 9.9 7.3 4.1
Construction –23.5 9.8 9.3 4.2 4.5
Electricity, gas & water 2.2 4.6 5.2 1.9 4.4
Commerce, restaurants & hotels –15.5 4.8 10.7 5.6 4.1
Transport & communications –4.9 8.0 9.9 6.3 8.8
Community & social services –2.3 1.0 3.3 2.8 1.5
Financial services & real estate –0.3 0.6 3.7 4.5 2.7
Imputed banking services –10.7 –5.1 10.6 5.6 5.7
GDP –6. 2 5.1 6.8 4.8 3.7
Sources: Banco de México; INEGI.
Reference table 11
Gross domestic product by expenditure(% real change; constant 1993 prices)
1995 1996 1997 1998 1999
Private consumption –9.5 2.2 6.5 5.4 4.3
Government consumption –1.3 –0.7 2.9 2.2 1.0
Gross fixed investment –29.0 16.4 21.0 10.3 5.8
Exports of goods & services 30.2 18.2 10.7 12.1 13.9
Imports of goods & services –15.0 22.9 22.7 16.5 12.8
GDP at market prices –6.2 5.1 6.8 4.8 3.7
Sources: Banco de México; INEGI.
Reference table 12
Prices and earnings(% change; period averages)
1995 1996 1997 1998 1999
Consumer prices 35.0 34.4 20.6 15.9 16.6
Producer prices 41.5 34.3 16.0 13.8 15.7
Wages in manufacturinga –12.6 –9.9 –0.6 2.8 –1.1
a Real, deflated by consumer price inflation.
Sources: Banco de México; INEGI.

Mexico 49
© The Economist Intelligence Unit Limited 2000 EIU Country Profile 2000-01
Reference table 13
Production of principal crops(‘000 tonnes)
1995 1996 1997 1998 1999a
Sugar cane 44,324 44,295 44,833 49,320 46,811
Maize 18,353 18,026 18,085 16,897 15,729
Sorghum 4,170 6,809 5,793 6,377 5,589
Wheat 3,468 3,375 3,639 3,221 2,999
Beans 1,270 1,349 952 1,205 1,044
Barley 487 586 531 379 440
Rice 367 394 465 449 356
Soybeans 190 56 176 150 133
a Preliminary.
Source: Secretaria de Agricultura, Ganaderia y Desarrollo Rural (Sagar).
Reference table 14
Livestock production(‘000 tonnes unless otherwise indicated)
1995 1996 1997 1998 1999a
Beef 1,412 1,330 1,340 1,380 1,390
Pork 922 910 939 961 990
Sheep meat 30 29 30 30 32
Goat meat 38 36 35 38 38
Poultry 1,284 1,264 1,442 1,599 1,724
Milk (m litres) 7,538 7,709 7,969 8,443 8,960
Eggs 1,242 1,236 1,329 1,461 1,634
Honey 49 49 54 55 52
a Preliminary.
Source: Sagar.
Reference table 15
Manufacturing production(% change; 1993 prices)
1995 1996 1997 1998 1999a
Food, beverages & tobacco 0.0 3.3. 3.2 6.6 5.1
Clothing & footwear –6.3 15.7 10.5 3.7 2.6
Wood products –7.8 6.9 6.7 4.4 –0.4
Printing, paper & publishing –7.6 1.3 12.7 5.9 4.6
Chemicals, petroleum products, rubber & plastics –0.9 6.6 6.8 6.0 2.8
Non-metallic minerals excl oil –11.7 8.1 5.9 5.2 3.2
Basic metal industries 4.1 18.8 11.1 4.0 –0.3
Metal products, machinery & equipment –10.3 22.3 19.1 11.5 5.7
Other industries –10.2 14.4 10.5 7.7 3.3
Total manufacturing –4.9 10.8 9.9 7.3 4.1
a Preliminary.
Sources: INEGI; Banco de México.
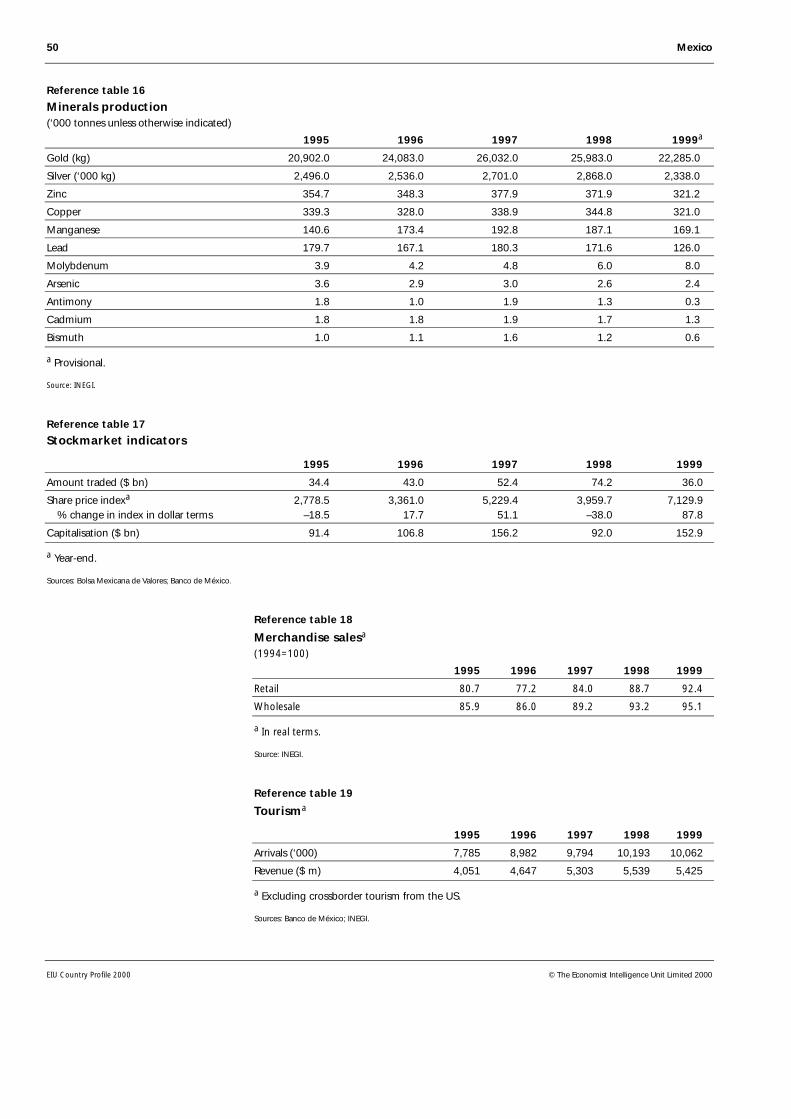
50 Mexico
EIU Country Profile 2000 © The Economist Intelligence Unit Limited 2000
Reference table 16
Minerals production(‘000 tonnes unless otherwise indicated)
1995 1996 1997 1998 1999a
Gold (kg) 20,902.0 24,083.0 26,032.0 25,983.0 22,285.0
Silver (‘000 kg) 2,496.0 2,536.0 2,701.0 2,868.0 2,338.0
Zinc 354.7 348.3 377.9 371.9 321.2
Copper 339.3 328.0 338.9 344.8 321.0
Manganese 140.6 173.4 192.8 187.1 169.1
Lead 179.7 167.1 180.3 171.6 126.0
Molybdenum 3.9 4.2 4.8 6.0 8.0
Arsenic 3.6 2.9 3.0 2.6 2.4
Antimony 1.8 1.0 1.9 1.3 0.3
Cadmium 1.8 1.8 1.9 1.7 1.3
Bismuth 1.0 1.1 1.6 1.2 0.6
a Provisional.
Source: INEGI.
Reference table 17
Stockmarket indicators
1995 1996 1997 1998 1999
Amount traded ($ bn) 34.4 43.0 52.4 74.2 36.0
Share price indexa 2,778.5 3,361.0 5,229.4 3,959.7 7,129.9 % change in index in dollar terms –18.5 17.7 51.1 –38.0 87.8
Capitalisation ($ bn) 91.4 106.8 156.2 92.0 152.9
a Year-end.
Sources: Bolsa Mexicana de Valores; Banco de México.
Reference table 18
Merchandise salesa
(1994=100)
1995 1996 1997 1998 1999
Retail 80.7 77.2 84.0 88.7 92.4
Wholesale 85.9 86.0 89.2 93.2 95.1
a In real terms.
Source: INEGI.
Reference table 19
Tourisma
1995 1996 1997 1998 1999
Arrivals (‘000) 7,785 8,982 9,794 10,193 10,062
Revenue ($ m) 4,051 4,647 5,303 5,539 5,425
a Excluding crossborder tourism from the US.
Sources: Banco de México; INEGI.
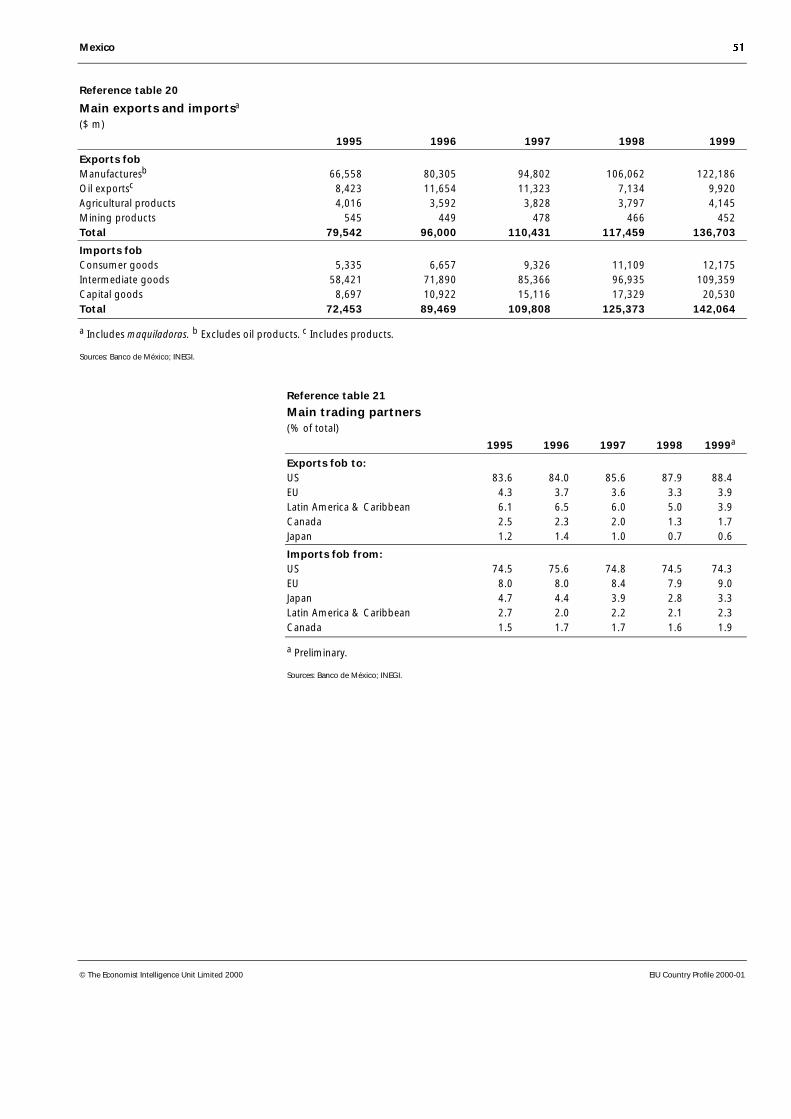
Mexico 51
© The Economist Intelligence Unit Limited 2000 EIU Country Profile 2000-01
Reference table 20
Main exports and importsa
($ m)
1995 1996 1997 1998 1999
Exports fobManufacturesb 66,558 80,305 94,802 106,062 122,186Oil exportsc 8,423 11,654 11,323 7,134 9,920Agricultural products 4,016 3,592 3,828 3,797 4,145Mining products 545 449 478 466 452Total 79,542 96,000 110,431 117,459 136,703
Imports fobConsumer goods 5,335 6,657 9,326 11,109 12,175Intermediate goods 58,421 71,890 85,366 96,935 109,359Capital goods 8,697 10,922 15,116 17,329 20,530Total 72,453 89,469 109,808 125,373 142,064
a Includes maquiladoras. b Excludes oil products. c Includes products.
Sources: Banco de México; INEGI.
Reference table 21
Main trading partners(% of total)
1995 1996 1997 1998 1999a
Exports fob to:US 83.6 84.0 85.6 87.9 88.4 EU 4.3 3.7 3.6 3.3 3.9 Latin America & Caribbean 6.1 6.5 6.0 5.0 3.9 Canada 2.5 2.3 2.0 1.3 1.7 Japan 1.2 1.4 1.0 0.7 0.6
Imports fob from:US 74.5 75.6 74.8 74.5 74.3 EU 8.0 8.0 8.4 7.9 9.0 Japan 4.7 4.4 3.9 2.8 3.3 Latin America & Caribbean 2.7 2.0 2.2 2.1 2.3 Canada 1.5 1.7 1.7 1.6 1.9
a Preliminary.
Sources: Banco de México; INEGI.

52 Mexico
EIU Country Profile 2000 © The Economist Intelligence Unit Limited 2000
Reference table 22
Direction and composition of trade, 1998(US$ m)
Exports fob US Canada Germany Total
Animals for food 212 0 0 212Meat & fish & preparations 707 0 0 858Fruit, vegetables & preparations 2,863 30 3 3,211Coffee, cocoa, tea, spices & manufactures 682 24 2 840Crude petroleum 5,036 113 0 6,399Chemicalsa 3,277 211 51 5,598Textile fibres, yarn, cloth & manufactures 1,775 75 9 2,381Non-metallic mineral manufacturesb 2,048 59 22 2,503Metals & manufacturesc 5,153 93 64 6,462 of which: iron & steel & manufacturesc 3,008 82 48 4,014Machinery 12,703 434 267 15,334Electrical & electronic equipment 30,585 295 89 31,830Road vehicles 17,611 369 392 19,486Other transport 1,288 4 0 1,313Furniture, lighting, prefab buildings 2,221 11 21 2,361Clothing & footwear 6,623 37 8 6,897Scientific instruments etc 3,340 31 65 3,718Total incl others 101,927 1,716 1,112 117,325
Imports fob US Germany Japan Total
Food 4,172 54 3 5,279 of which: meat & fish & preparations 1,052 0 1 1,180 cereals & preparations 1,555 24 0 1,820Oilseeds 977 14 1 1,362Mineral fuels & lubricants 2,062 10 8 2,678Chemicalsa 11,676 529 1,164 15,457Paper etc & manufactures 2,492 26 11 2,771Textile fibres, yarn, cloth & manufactures 3,368 67 27 4,203Metals & manufacturesc 7,272 449 410 11,810 of which: iron & steel & manufacturesc 4,591 300 339 6,867 non-ferrous metals & manufacturesc 2,681 49 24 3,370Machinery 12,417 1,480 1,127 19,002Electrical & electronic equipment 24,068 516 1,190 29,914Road vehicles 7,929 836 441 10,067Other transport 898 4 2 1,006Clothing 3,333 7 2 3,649Scientific instruments etc 2,727 190 284 3,958Total incl others 93,237 4,558 4,553 125,193
a Including crude fertilisers and manufactures of plastics. b Including precious metals and jewellery. c Including scrap.
Source: UN, External Trade Statistics, series D.
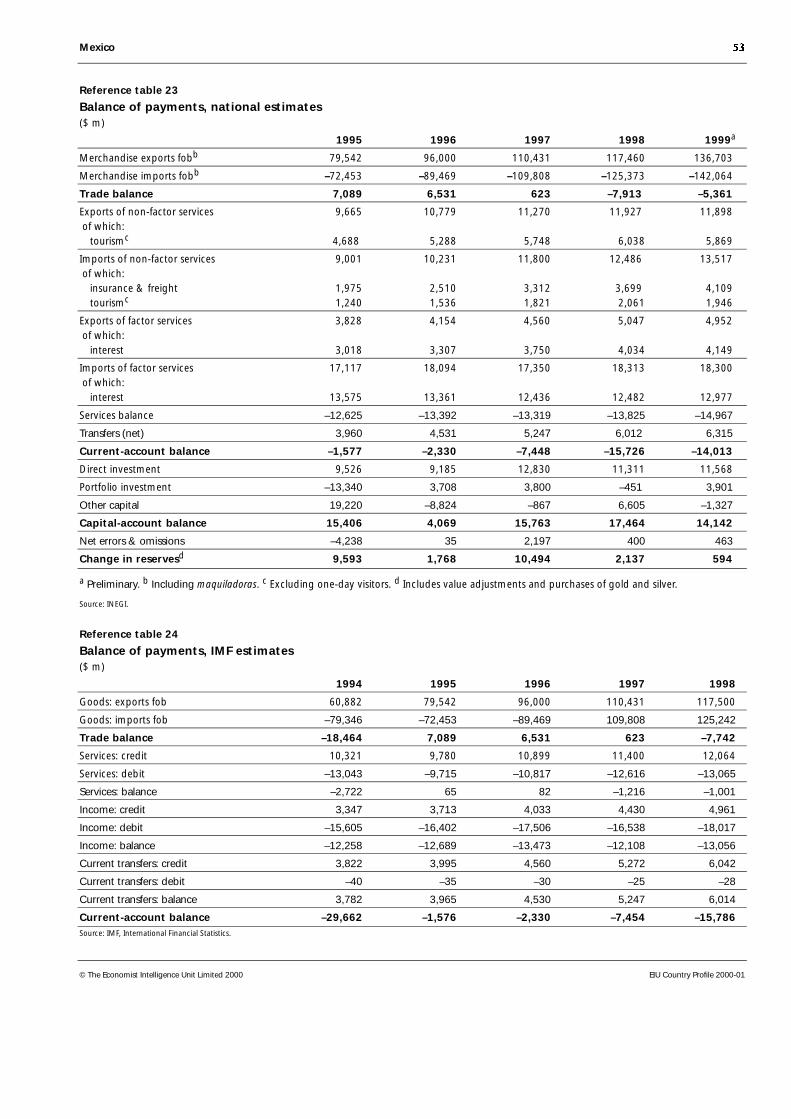
Mexico 53
© The Economist Intelligence Unit Limited 2000 EIU Country Profile 2000-01
Reference table 23
Balance of payments, national estimates($ m)
1995 1996 1997 1998 1999a
Merchandise exports fobb 79,542 96,000 110,431 117,460 136,703
Merchandise imports fobb –72,453 –89,469 –109,808 –125,373 –142,064
Trade balance 7,089 6,531 623 –7,913 –5,361
Exports of non-factor services 9,665 10,779 11,270 11,927 11,898 of which: tourismc 4,688 5,288 5,748 6,038 5,869
Imports of non-factor services 9,001 10,231 11,800 12,486 13,517 of which: insurance & freight 1,975 2,510 3,312 3,699 4,109 tourismc 1,240 1,536 1,821 2,061 1,946
Exports of factor services 3,828 4,154 4,560 5,047 4,952 of which: interest 3,018 3,307 3,750 4,034 4,149
Imports of factor services 17,117 18,094 17,350 18,313 18,300 of which: interest 13,575 13,361 12,436 12,482 12,977
Services balance –12,625 –13,392 –13,319 –13,825 –14,967
Transfers (net) 3,960 4,531 5,247 6,012 6,315
Current-account balance –1,577 –2,330 –7,448 –15,726 –14,013
Direct investment 9,526 9,185 12,830 11,311 11,568
Portfolio investment –13,340 3,708 3,800 –451 3,901
Other capital 19,220 –8,824 –867 6,605 –1,327
Capital-account balance 15,406 4,069 15,763 17,464 14,142
Net errors & omissions –4,238 35 2,197 400 463
Change in reservesd 9,593 1,768 10,494 2,137 594
a Preliminary. b Including maquiladoras. c Excluding one-day visitors. d Includes value adjustments and purchases of gold and silver.
Source: INEGI.
Reference table 24
Balance of payments, IMF estimates($ m)
1994 1995 1996 1997 1998
Goods: exports fob 60,882 79,542 96,000 110,431 117,500
Goods: imports fob –79,346 –72,453 –89,469 109,808 125,242
Trade balance –18,464 7,089 6,531 623 –7,742
Services: credit 10,321 9,780 10,899 11,400 12,064
Services: debit –13,043 –9,715 –10,817 –12,616 –13,065
Services: balance –2,722 65 82 –1,216 –1,001
Income: credit 3,347 3,713 4,033 4,430 4,961
Income: debit –15,605 –16,402 –17,506 –16,538 –18,017
Income: balance –12,258 –12,689 –13,473 –12,108 –13,056
Current transfers: credit 3,822 3,995 4,560 5,272 6,042
Current transfers: debit –40 –35 –30 –25 –28
Current transfers: balance 3,782 3,965 4,530 5,247 6,014
Current-account balance –29,662 –1,576 –2,330 –7,454 –15,786Source: IMF, International Financial Statistics.
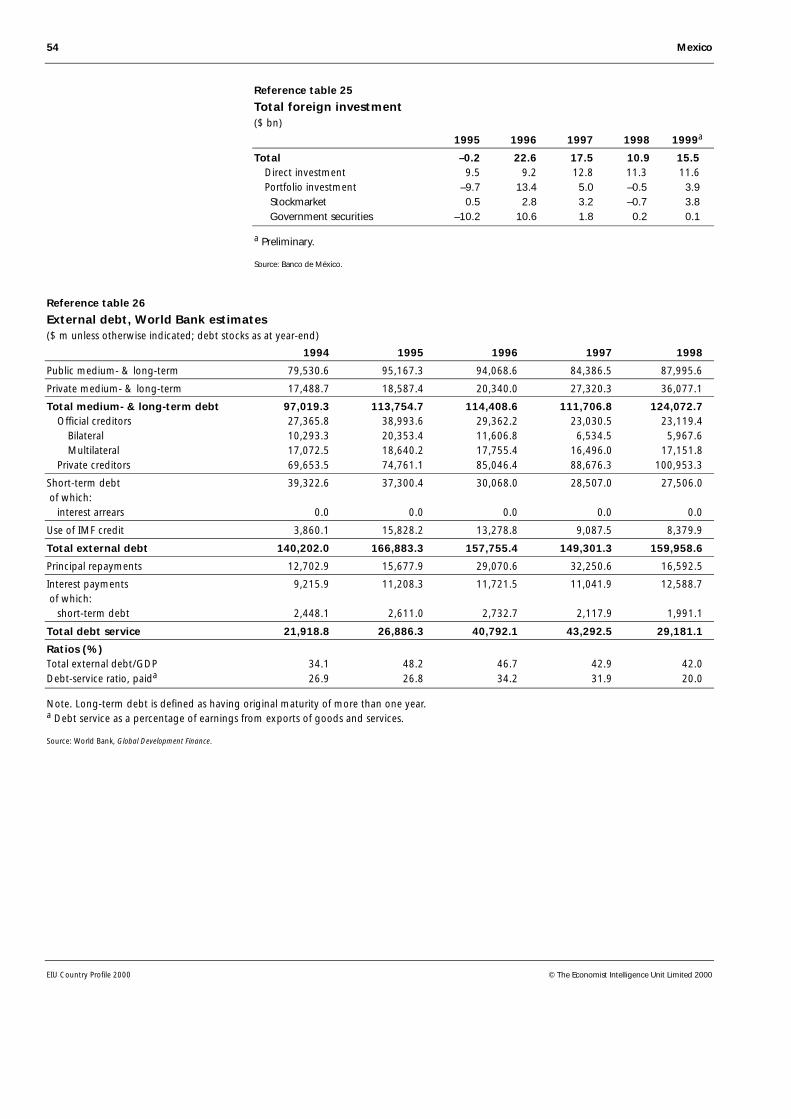
54 Mexico
EIU Country Profile 2000 © The Economist Intelligence Unit Limited 2000
Reference table 25
Total foreign investment($ bn)
1995 1996 1997 1998 1999a
Total –0.2 22.6 17.5 10.9 15.5 Direct investment 9.5 9.2 12.8 11.3 11.6 Portfolio investment –9.7 13.4 5.0 –0.5 3.9 Stockmarket 0.5 2.8 3.2 –0.7 3.8 Government securities –10.2 10.6 1.8 0.2 0.1
a Preliminary.
Source: Banco de México.
Reference table 26
External debt, World Bank estimates($ m unless otherwise indicated; debt stocks as at year-end)
1994 1995 1996 1997 1998
Public medium- & long-term 79,530.6 95,167.3 94,068.6 84,386.5 87,995.6
Private medium- & long-term 17,488.7 18,587.4 20,340.0 27,320.3 36,077.1
Total medium- & long-term debt 97,019.3 113,754.7 114,408.6 111,706.8 124,072.7 Official creditors 27,365.8 38,993.6 29,362.2 23,030.5 23,119.4 Bilateral 10,293.3 20,353.4 11,606.8 6,534.5 5,967.6 Multilateral 17,072.5 18,640.2 17,755.4 16,496.0 17,151.8 Private creditors 69,653.5 74,761.1 85,046.4 88,676.3 100,953.3
Short-term debt 39,322.6 37,300.4 30,068.0 28,507.0 27,506.0 of which: interest arrears 0.0 0.0 0.0 0.0 0.0
Use of IMF credit 3,860.1 15,828.2 13,278.8 9,087.5 8,379.9
Total external debt 140,202.0 166,883.3 157,755.4 149,301.3 159,958.6
Principal repayments 12,702.9 15,677.9 29,070.6 32,250.6 16,592.5
Interest payments 9,215.9 11,208.3 11,721.5 11,041.9 12,588.7 of which: short-term debt 2,448.1 2,611.0 2,732.7 2,117.9 1,991.1
Total debt service 21,918.8 26,886.3 40,792.1 43,292.5 29,181.1
Ratios (%)Total external debt/GDP 34.1 48.2 46.7 42.9 42.0Debt-service ratio, paida 26.9 26.8 34.2 31.9 20.0
Note. Long-term debt is defined as having original maturity of more than one year.a Debt service as a percentage of earnings from exports of goods and services.
Source: World Bank, Global Development Finance.

Mexico 55
© The Economist Intelligence Unit Limited 2000 EIU Country Profile 2000-01
Reference table 27
Gross external debt, national estimates($ bn; debt stocks as at year-end)
1995 1996 1997 1998 1999a
Total 169.9 164.3 153.6 161.3 161.1 Public sector 100.9 98.3 88.3 92.3 92.3 Federal government 77.8 75.6 67.4 70.1 70.3 Public enterprises 11.7 12.9 12.3 13.0 13.8 Development banks 11.4 9.8 8.6 9.2 8.1 Commercial banks 20.9 19.2 17.4 17.0 15.5 Banco de México 17.3 13.3 9.1 8.4 6.0 Non-bank private sector 30.7 33.5 38.8 43.7 47.3
a Preliminary.
Sources: Banco de México; Secretaría de Hacienda y Crédito Público (SHCP).
Reference table 28
Amortisation schedule of global external debta
($ m)
2000 2001 2002 2003 2004 2005 2006
Public sector 7,769 6,020 8,558 5,541 6,684 5,087 3,025 Commercial banks 1,787 804 257 324 186 136 136 Bonds 1,900 1,644 4,602 2,486 3,910 2,872 957 World Bank & IDB 1,654 1,588 1,529 1,448 1,420 1,407 1,377 External trade 889 685 1,224 507 416 222 157 Restructured debt 1,539 1,300 946 776 753 449 397
Private sector 7,449 7,514 5,286 3,737 11,014 316 413 commercial banks 4,052 5,427 3,163 1,970 5,410 22 9 Bonds & commercial paper 925 1,281 1,225 895 4,152 289 400 External trade 2,471 806 898 872 1,452 5 5
IMFb 2,894 52 26 0 0 0 0
Total 18,113 13,585 13,870 9,277 17,698 5,403 3,348
a As of June 30th 1999. b Debt officially owed by Banco de México.
Source: SHCP.
Reference table 29
Foreign reserves($ m unless otherwise indicated; end-period)
1995 1996 1997 1998 1999
Foreign exchange 15,250 19,176 28,136 31,461 30,992
SDRs 1,597 257 661 337 790
Total reserves excl gold 16,847 19,433 28,797 31,799 31,782
Memorandum itemGold (m fine troy oz) 0.514 0.255 0.190 0.223 0.159
Source: IMF, International Financial Statistics.
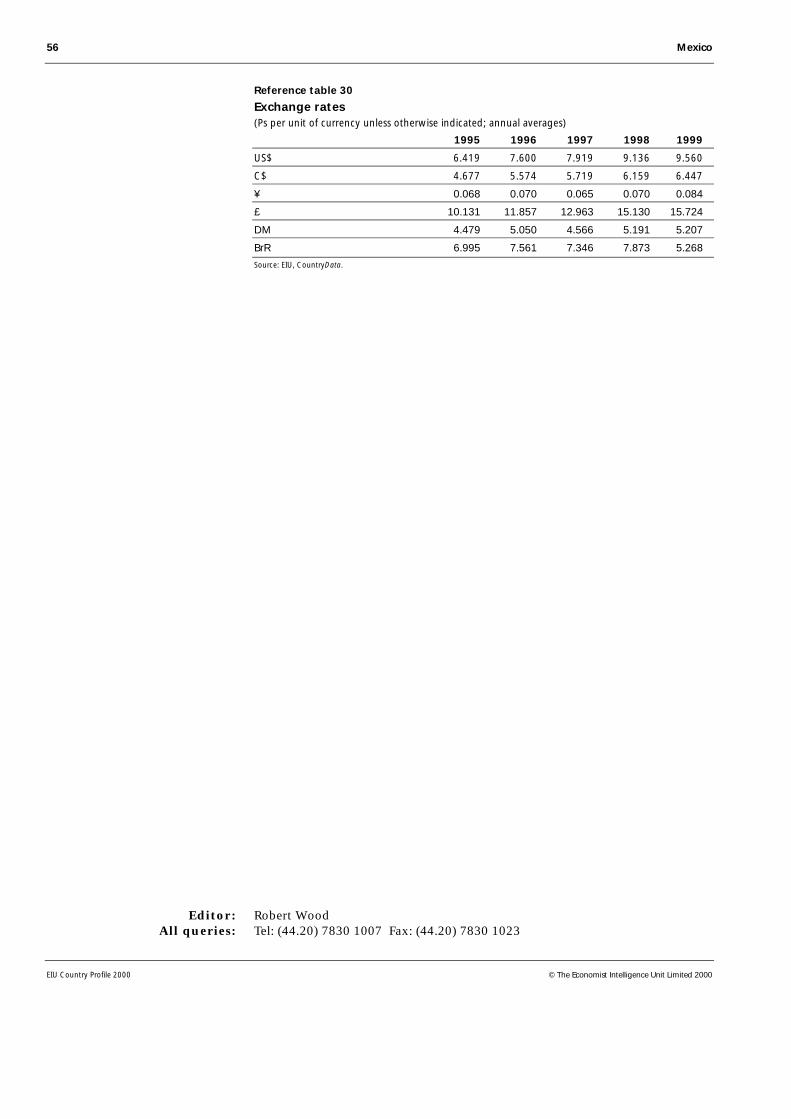
56 Mexico
EIU Country Profile 2000 © The Economist Intelligence Unit Limited 2000
Reference table 30
Exchange rates(Ps per unit of currency unless otherwise indicated; annual averages)
1995 1996 1997 1998 1999
US$ 6.419 7.600 7.919 9.136 9.560
C$ 4.677 5.574 5.719 6.159 6.447
¥ 0.068 0.070 0.065 0.070 0.084
£ 10.131 11.857 12.963 15.130 15.724
DM 4.479 5.050 4.566 5.191 5.207
BrR 6.995 7.561 7.346 7.873 5.268
Source: EIU, CountryData.
Editor: Robert WoodAll queries: Tel: (44.20) 7830 1007 Fax: (44.20) 7830 1023