mexico - united nations office on drugs and crime · national autonomous university of mexico,...
TRANSCRIPT
MEXICO
June 2016
Monitoring of Opium Poppy Cultivation 2014-2015

United Nations Office on Drugs and Crime Liaison and Partnership Office in Mexico
Obrero Mundial 358, piso 2,Col. Viaducto Piedad, Col. Narvarte,Del. Benito Juárez, C.P. 03000, Mexico City.Tel.: +52 (55) 5588-4426, ext. 106Fax: +52 (55) 5588-4429Email: [email protected]: https://www.unodc.org/mexicoandcentralamerica/es/romex/oficina_LPO.html
Copyright © United Nations, 2016. All rights reserved worldwide.
This publication may be reproduced in whole part or in any form for educational or non-profit purposes without special permission from the copyright holder, provided acknowledgment of the source is made. The United Nations Office on Drugs and Crime (UNODC) would appreciate receiving a copy of any publication that uses this publi-cation as a source.
Suggested citation: UNODC, Mexico, Monitoring of Opium Poppy Cultivation 2014-2015.
No use of this publication may be made for resale or any commercial purpose whatsoever without prior permission in writing from UNODC. Applications for such permission, with a statement of purpose and intent of the reproduction, should be addressed to the Research and Trend Analysis Branch of UNODC.
ISBN: 978-92-1-058232-2
Photograph: Project MEXK54/UNODC-LPO Mexico
First edition: June 2016
Printed at:National Institute of Penal Sciences (Inacipe) Magisterio Nacional 113, Col. Tlalpan Centro,C.P. 14000, Mexico City.

Corrigendum May 2017
CORRIGENDUM
The opium poppy cultivation estimate figures published in June 2016 in the present report were revised for statistical inconsistency1 and UNODC made the adjustment. As a result, the estimated area sown with opium poppy cultivation figures below is correct, and is included below in this corrigendum.
EXECUTIVE SUMMARY The sixth paragraph should read:
High estimate: 30,400 hectares.
Best estimate: 26,100 hectares (more precise).
Low estimate: 21,800 hectares.
CHAPTER 6.1. ESTIMATE RESULTS OF THE AREA UNDER OPIUM POPPY CULTIVATION The second paragraph should read: The estimate area under opium poppy cultivation in 12 months for the monitoring period July 2014-June 2015 is 26,100 hectares (average), with a 95% confident interval and statistical range from 21,800 to 30,400 hectares (table 2). This result is the addition of the three estimates in this period considering that opium poppy crops can grow at different times on the year. Map 4 shows the total hectares found in each monitoring segment. Table 2. should read:
Result period Area (ha)
(lower estimate) Area (ha)
(best estimate) Area (ha)
(high estimate)
July 2014 - June 2015 21 800 26 100 30 400
CHAPTER 7.14. FORMULA APPLIED TO THE STATISTICAL ESTIMATE OF EVERY SAMPLING FRAME Table 11 should read:
Analyzed periods Area (ha)
(lower estimate) Area (ha)
(best estimate) Area (ha)
(high estimate)
July-October 2014 6 470 7 570 8 670
November 2014-February 2015 6 190 9 370 12 540
March-June 2015 3 470 6 490 9 510
Totals 18 910 23 430 27 950
Table 13 should read:
1 The calculation had an incorrect assignment in the weighting factors for the different strata of the sample, which led to an
underestimation of the opium poppy cultivation area for the period 2014-2015.
Analyzed period Area (ha)
(lower estimate) Area (ha)
(best estimate) Area (ha)
(high estimate)
Julio 2014-Junio 2015 21 800 26 100 30 400

The implementation of the Illicit Crop Monitoring Programme in Mexico has been made possible thanks to the financial contributions of the Mexican Federal Government through its involved institutions (SEDENA, SEMAR, PGR-AIC/CE-NAPI).
We thank the Mexican Federal Government institutions, the universities, the UNODC experts and technical analysts and the monitoring group who belong to the project “MEXK54” for their great effort, commitment and support in implementing the Opium Poppy Crop Monitoring System in Mexico and their valuable comments for the preparation of this national report for the period 2014 – 2015. To the Federal Government of Mexico:Ministry of Foreign Affairs (SRE) Ministry of National Defense (SEDENA)Ministry of Navy (SEMAR)Attorney General Office (PGR), through the Criminal Investigation Agency and the National Center of Planning, Analysis and Information to Counter Crime (PGR-AIC/CENAPI).
To the Project Monitoring Group:Alfredo Enríquez Delgado, SEMAR Abel Trejo Castelán, SEMARIsaac Morales Tenorio, SRE José Romero Líbano, SEDENAVidal Diazleal Ochoa, PGR-AIC Oscar Santiago Quintos, PGR-AIC
To UNODC:Antonio Mazzitelli, Representative (UNODC LPO-Mexico)Angela Me, Chief, Research and Trend Analysis Branch (UNODC-Vienna)Coen Bussink, Expert in Remote Sensing and GIS, Research and Trend Analysis Branch (UNODC-Vienna)Irmgard Zeiler, Expert in Research, Research and Trend Analysis Branch (UNODC-Vienna)Lorenzo Vita, Expert in Remote Sensing and GIS (UNODC-Viena) Matteo Mattuizzi, Expert in Remote Sensing (UNODC Consultant)
To Project Analyst and Technicians: Jerónimo Solís Guillen, Project CoordinatorIván A. Trujillo Roura, Technical Assistant of Analysis and Monitoring David Richard Ravaux, Programme AssistantAntonio Domínguez González, Analyst Braulio González Linares, AnalystErnesto Guillén Avilés, AnalystGabriel Vázquez López, Analyst Julio C. Uscanga González, Analyst Juan J. Navarrete López, AnalystMiguel Silva Bahena, Analyst Manuel Sánchez Ávila, Analyst Marco A. Vela Tapia, AnalystLuis Santamaría Campos, Analyst
To the Universities:National Autonomous University of Mexico, Mexico (UNAM), through the Geography Institute University of Natural Resources and Life Sciences, Vienna, Austria (BOKU)
ACKNOWLEDGEMENT

AFI Investigation Federal Agency
AIC Criminal Investigation Agency
BOKU University of Natural Resources and Life Sciences, Vienna.
CEM Mexican Continuum of Elevations
CENAPI National Center for Planning, Analysis and Information to Counter Crime
CONAPO National Council of Population
INEGI National Institute of Statistics and Geography
UN United Nations
PGR General Attorney Office
ICMP Illicit Crop Monitoring Programme
PPS Probability Proportional to Size
GIS Geographic Information System
SRE Ministry of Foreign Affairs
SEDENA Ministry of the National Defense
SEMAR Ministry of the Navy
UNAM National Autonomous University of Mexico
UNODC United Nations Office on Drugs and Crime
ABBREVIATIONS

TERMS DEFINITION
Electromagnetic Spectrum Set of all the possible wavelengths (or frequencies) where the electromagnetic ra-diation occurs.
Pansharpening Technique used to combine two images (panchromatic and multispectral). This en-ables to increase the spatial and spectral resolution of the observed features or objects.
Infrared radiation (IRc) Part of the electromagnetic spectrum corresponding to the near infrared.
Multi-spectral image Satellite image that contains different parts of the electromagnetic spectrum.
Spectral mode Used to define the spectral properties of a satellite image (panchromatic or multi-spectral.
Orthophotograph Aerial photograph obtained with a metric camera which has been geometrically corrected and used to obtain a product which enables to measure the objects (dis-tances, areas, etc.).
Orthorectification Digital process used to correct the satellite images or aerial photographs geometri-cal distortions caused by the sensor movement or inclination over the ground relief.
Panchromatic Satellite images in black-and-white tones in accordance with the sensor character-istics.
Remote perception or Technique used to obtain an earth surface image through remote sensors without ground teledetection being in contact with it, i.e., located in satellites or planes.
Raster Matrix file of cells (pixels) organized in rows and columns with a specific value per cell. This file can be obtained by using any type of available remote sensors.
GIS Geographic Information System.
Remote sensors Instruments used to remotely obtain ground surface images such as artificial satel-lites and/or digital cameras used to take aerial photographs.
VHR Satellite images or aerial photographs’ very high spatial resolution
Visible spectrum (VIS) Visible spectrum captured by the human eye where the spectrum is formed by red, green and blue colors.
GLOSSARY

VIII
TABLE OF CONTENTS
1. EXECUTIVE SUMMARY . . . . . . . . . . . . . . . . . . . . . . . . . . . . . . . . . . . . . . . . . . . 12. INTRODUCTION . . . . . . . . . . . . . . . . . . . . . . . . . . . . . . . . . . . . . . . . . . . . . . . . . 33. BACKGROUND . . . . . . . . . . . . . . . . . . . . . . . . . . . . . . . . . . . . . . . . . . . . . . . . . . 54. INSTITUTIONS AND PROJECT PERSONNEL. . . . . . . . . . . . . . . . . . . . . . . . . . 94.1. Organization of the involved institutions . . . . . . . . . . . . . . . . . . . . . . . . . . . . . . . . . . . . . . . . . . . 9
4.2. External institutions (academic). . . . . . . . . . . . . . . . . . . . . . . . . . . . . . . . . . . . . . . . . . . . . . . . . . 9
4.3. Organization of the project’s personnel . . . . . . . . . . . . . . . . . . . . . . . . . . . . . . . . . . . . . . . . . . . . 10
5. BRIEF DESCRIPTION OF THE MONITORING METHODOLOGY. . . . . . . . . . . 115.1. Determining the study areas: two sampling frames. . . . . . . . . . . . . . . . . . . . . . . . . . . . . . . . . . . 11
5.2. Sampling-based methodology. . . . . . . . . . . . . . . . . . . . . . . . . . . . . . . . . . . . . . . . . . . . . . . . . . . 13
5.3. Samples collected three times over the year to identify opium poppy crops. . . . . . . . . . . . . . . . 16
5.4. Sensors used to collect satellite images and aerial photographs . . . . . . . . . . . . . . . . . . . . . . . . 16
5.5. Determining the optimal dates to collect satellite images . . . . . . . . . . . . . . . . . . . . . . . . . . . . . . 17
5.6. Interpretation of the satellite images . . . . . . . . . . . . . . . . . . . . . . . . . . . . . . . . . . . . . . . . . . . . . . 18
5.7. Statistical calculation to estimate the area under poppy cultivation . . . . . . . . . . . . . . . . . . . . . . 19
6. ESTIMATE RESULTS OF THE AREA UNDER OPIUM POPPY CULTIVATION. 206.1. Estimated area under opium poppy cultivation . . . . . . . . . . . . . . . . . . . . . . . . . . . . . . . . . . . . . . 20
6.2. Coverage area of the collected images used to estimate opium poppy cultivation. . . . . . . . . . . 22
7. INPUTS OF THE DETAILED METHODOLOGY . . . . . . . . . . . . . . . . . . . . . . . . . 257.1. National grid of 10 x 10 kilometers . . . . . . . . . . . . . . . . . . . . . . . . . . . . . . . . . . . . . . . . . . . . . . . 26
7.2. Monitoring zones . . . . . . . . . . . . . . . . . . . . . . . . . . . . . . . . . . . . . . . . . . . . . . . . . . . . . . . . . . . . . 28
7.3. Sampling frame of the historical eradication data . . . . . . . . . . . . . . . . . . . . . . . . . . . . . . . . . . . . 29
7.4. Sampling frame of the statistical analysis of illicit crops probabilities by determining factors . . . 31
7.5. Samples selection for monitoring . . . . . . . . . . . . . . . . . . . . . . . . . . . . . . . . . . . . . . . . . . . . . . . . 33
7.6. Dates analysis to determine crop calendars with time series of satellite
images . . . . . . . . . . . . . . . . . . . . . . . . . . . . . . . . . . . . . . . . . . . . . . . . . . . . . . . . . . . . . . . . . . . . . . . . 357.6.1. Test area for the three regions with Landsat images . . . . . . . . . . . . . . . . . . . . . . . . . . . . . . . . . . . . . . . . . . 357.6.2. Data analysis . . . . . . . . . . . . . . . . . . . . . . . . . . . . . . . . . . . . . . . . . . . . . . . . . . . . . . . . . . . . . . . . . . . . . . . . 377.6.3. Crop calendar during the year (harvest cycles) . . . . . . . . . . . . . . . . . . . . . . . . . . . . . . . . . . . . . . . . . . . . . . 377.6.4. First results of the crop calendar analysis . . . . . . . . . . . . . . . . . . . . . . . . . . . . . . . . . . . . . . . . . . . . . . . . . . 41
7.7. Stages and workflow for the interpretation of illicit crops in satellite images . . . . . . . . . . . . . . . . 42
7.8. Images used for the monitoring. . . . . . . . . . . . . . . . . . . . . . . . . . . . . . . . . . . . . . . . . . . . . . . . . . 44
7.9. Correction and improvement processes of the satellite images . . . . . . . . . . . . . . . . . . . . . . . . . 457.9.1. Software for image processing. . . . . . . . . . . . . . . . . . . . . . . . . . . . . . . . . . . . . . . . . . . . . . . . . . . . . . . . . . . 467.9.2. Mexican Continuum of Elevations (CEM). . . . . . . . . . . . . . . . . . . . . . . . . . . . . . . . . . . . . . . . . . . . . . . . . . . 467.9.3. Orthorectification . . . . . . . . . . . . . . . . . . . . . . . . . . . . . . . . . . . . . . . . . . . . . . . . . . . . . . . . . . . . . . . . . . . . . 497.9.4. Pansharpening . . . . . . . . . . . . . . . . . . . . . . . . . . . . . . . . . . . . . . . . . . . . . . . . . . . . . . . . . . . . . . . . . . . . . . . 507.9.5. Image clipping . . . . . . . . . . . . . . . . . . . . . . . . . . . . . . . . . . . . . . . . . . . . . . . . . . . . . . . . . . . . . . . . . . . . . . . 517.9.6. Histograms enhancement. . . . . . . . . . . . . . . . . . . . . . . . . . . . . . . . . . . . . . . . . . . . . . . . . . . . . . . . . . . . . . . 52

IX
Mexico-Poppy Cultivation Monitoring Report 2014-2015
7.10. Illicit crops photointerpretation and measurement with satellite images . . . . . . . . . . . . . . . . . . 537.10.1. Robust workflow to photo-interpret poppy crops in satellite images. . . . . . . . . . . . . . . . . . . . . . . . . . . . . . 567.10.2. Spectral analysis through band combination in the satellite images . . . . . . . . . . . . . . . . . . . . . . . . . . . . . 577.10.3. Decision tree for opium poppy crops . . . . . . . . . . . . . . . . . . . . . . . . . . . . . . . . . . . . . . . . . . . . . . . . . . . . . 587.10.4. Interpretation keys and their use to detect opium poppy crops . . . . . . . . . . . . . . . . . . . . . . . . . . . . . . . . . 597.10.5. Multitemporal analysis with remote sensors. . . . . . . . . . . . . . . . . . . . . . . . . . . . . . . . . . . . . . . . . . . . . . . . 60
7.11 Validation flights with aerial photos (fieldwork) . . . . . . . . . . . . . . . . . . . . . . . . . . . . . . . . . . . . . . 617.11.1. Small-format digital cameras with visible infrared sensor used during the flights of aerial photograph . . . 627.11.2. Sensor calibration of the digital camera . . . . . . . . . . . . . . . . . . . . . . . . . . . . . . . . . . . . . . . . . . . . . . . . . . . 647.11.3. Intervalometer functionality. . . . . . . . . . . . . . . . . . . . . . . . . . . . . . . . . . . . . . . . . . . . . . . . . . . . . . . . . . . . . 657.11.4. Digital aerial photograph geoposition . . . . . . . . . . . . . . . . . . . . . . . . . . . . . . . . . . . . . . . . . . . . . . . . . . . . . 667.11.5. Use of metallic platforms with aerial specifications. . . . . . . . . . . . . . . . . . . . . . . . . . . . . . . . . . . . . . . . . . . 687.11.6. Design, characteristics and installation of the metallic platforms and integration of an airborne
system to acquire digital aerial photographs for the project . . . . . . . . . . . . . . . . . . . . . . . . . . . . . . . . . . 70
7.12. Flight planning to capture aerial photograph . . . . . . . . . . . . . . . . . . . . . . . . . . . . . . . . . . . . . . . 73
7.13. Photomosaic creation process . . . . . . . . . . . . . . . . . . . . . . . . . . . . . . . . . . . . . . . . . . . . . . . . . 76
7.14. Formula applied to the statistic estimate of every sampling frame . . . . . . . . . . . . . . . . . . . . . . 77
7.15. Adjustment factor to estimate the area by type of spatial resolution . . . . . . . . . . . . . . . . . . . . . 79
ANNEX. . . . . . . . . . . . . . . . . . . . . . . . . . . . . . . . . . . . . . . . . . . . . . . . . . . . . . . . . . . 81ANNEX I. National map of illicit crops probabilities by determining factors / risk . . . . . . . . . . . . . . . 81
ANNEX II. Characteristics of the available satellite images used in the project . . . . . . . . . . . . . . . . . 98
ANNEX III. Description of the passive sensor and/or optical satellites. . . . . . . . . . . . . . . . . . . . . . . . 100
BIBLIOGRAPHIC REFERENCES . . . . . . . . . . . . . . . . . . . . . . . . . . . . . . . . . . . . . . 103

X
TABLE INDEX
Table 1. Three collection periods for satellite images / aerial photograph.. . . . . . . . . . . . . . . . . . . . . 16
Table 2. Estimated area under opium poppy cultivation (ha) for 12 months of monitoring
in 2014 -2015 . . . . . . . . . . . . . . . . . . . . . . . . . . . . . . . . . . . . . . . . . . . . . . . . . . . . . . . . . . . . . . . . . . . 20
Table 3. General summary of the sample collected and analyzed for the three periods . . . . . . . . . . 22
Table 4. Number of segments by coverage percentage with satellite images and aerial photos . . . 22
Table 5. Calendar with the highest NDVI values (average) by region . . . . . . . . . . . . . . . . . . . . . . . . 41
Table 6. Number of images used by type of sensor in the sample of 368 segments . . . . . . . . . . . . 44
Table 7. Calendar for the collection of satellite images . . . . . . . . . . . . . . . . . . . . . . . . . . . . . . . . . . . 45
Table 8. Characteristics of the CEM used to correct the satellite images . . . . . . . . . . . . . . . . . . . . . 47
Table 9. Characteristics of the reflex digital camera . . . . . . . . . . . . . . . . . . . . . . . . . . . . . . . . . . . . . 63
Table 10. Ratio of number of spins and number of shots per second . . . . . . . . . . . . . . . . . . . . . . . . 66
Table 11. Estimation of the area under opium poppy cultivation for the sampling frame (I)
based on historical record of eradication . . . . . . . . . . . . . . . . . . . . . . . . . . . . . . . . . . . . . . . . . . . . . . 78
Table 12. Estimation of the area under opium poppy cultivation for the sampling frame (II)
based on the analysis of determining factors / risk . . . . . . . . . . . . . . . . . . . . . . . . . . . . . . . . . . . . . . 78
Table 13. Estimated total area under opium poppy cultivation (ha) for the period 2014 -2015 . . . . . 79
TABLES IN ANNEX
Table 14. Total of the variables used in the survey. . . . . . . . . . . . . . . . . . . . . . . . . . . . . . . . . . . . . . . 83
Table 15.Independent variables selected for the binomial logistic model. . . . . . . . . . . . . . . . . . . . . . 84
Table 16. Binomial logistic model: probability of illicit crops. . . . . . . . . . . . . . . . . . . . . . . . . . . . . . . . 86
Table 17. Characteristics of the passive sensors used for the monitoring.. . . . . . . . . . . . . . . . . . . . . 98
CHARTS INDEX
Chart 1. Examples of phenological cycles identified with time series of satellite images . . . . . . . . . 17
Chart 2. Phenological curves of opium poppy in the North region. . . . . . . . . . . . . . . . . . . . . . . . . . . 38
Chart 3. Phenological curves of opium poppy in the Centre region. . . . . . . . . . . . . . . . . . . . . . . . . . 39
Chart 4. Phenological curves of opium poppy in the South region. . . . . . . . . . . . . . . . . . . . . . . . . . . 40
Chart 5. Linear calculation of hectares in the images and aerial photographs. . . . . . . . . . . . . . . . . . 79

XI
FIGURES INDEX
Figure 1. Stages of the project’s methodology. . . . . . . . . . . . . . . . . . . . . . . . . . . . . . . . . . . . . . . . . . 25
Figure 2. Example of an alphanumeric grid . . . . . . . . . . . . . . . . . . . . . . . . . . . . . . . . . . . . . . . . . . . . 26
Figure 3. Left: WorldView-2 satellite image and opium poppy cultivation polygons. Center: series
of NDVI layers. Right: Phenological curve obtained from the series of NDVI layers for the central
pixel location. . . . . . . . . . . . . . . . . . . . . . . . . . . . . . . . . . . . . . . . . . . . . . . . . . . . . . . . . . . . . . . . . . . . 37
Figure 4. Location of reference data (segments) in the North region. . . . . . . . . . . . . . . . . . . . . . . . . 38
Figure 5. Location of reference data (segments) in the Centre region. . . . . . . . . . . . . . . . . . . . . . . . 39
Figure 6. Location of reference data (segments) in the South region . . . . . . . . . . . . . . . . . . . . . . . . 40
Figure 7. Flow chart of the Illicit Crop Monitoring Project in Mexico. . . . . . . . . . . . . . . . . . . . . . . . . . 43
Figure 8. Interface of software ERDAS Imagine for the orthorectification. . . . . . . . . . . . . . . . . . . . . . 49
Figure 9. Interface of software ERDAS Imagine to execute the orthorectification. . . . . . . . . . . . . . . 49
Figure 10. Interface of software Socet GXP for the orthorectification. . . . . . . . . . . . . . . . . . . . . . . . . 50
Figure 11. Interface of software ERDAS Imagine used to merge images. . . . . . . . . . . . . . . . . . . . . . 50
Figure 12. Interface of software Socet GXP used to merge images. . . . . . . . . . . . . . . . . . . . . . . . . . 51
Figure 13. Interface of software ERDAS and adjusted area in the image for each segment. . . . . . . 51
Figure 14. Interface of software Socet GXP used to merge and cut the image at the same time . . . 52
Figure 15. Interface of software ERDAS and the manual histogram enhancement. . . . . . . . . . . . . . 52
Figure 16. Socet interface and the automatic histogram enhancement. . . . . . . . . . . . . . . . . . . . . . . 53
Figure 17. Robust workflow to photo-interpret satellite images.. . . . . . . . . . . . . . . . . . . . . . . . . . . . . 56
Figure 18. Decision tree flow chart to determine opium poppy crops. . . . . . . . . . . . . . . . . . . . . . . . . 58
Figure 19. Example of an interpretation key for opium poppy cultivation. . . . . . . . . . . . . . . . . . . . . . 59
Figure 20. Time scheme used between the analysis periods. . . . . . . . . . . . . . . . . . . . . . . . . . . . . . . 60
Figure 21. Example of the distribution of the equipment used in helicopter for fieldwork . . . . . . . . . 62
Figure 22. Example of aerial GPS navigation. . . . . . . . . . . . . . . . . . . . . . . . . . . . . . . . . . . . . . . . . . . 67
Figure 23. Elements of the camera external orientation; it is defined by the angle of the three
rotation axis and by their x, y and z position in a cartographic projection and a reference datum . . 68
Figure 24. Digital modelling of the platform on the porthole to determine their dimensions and the
position of the aluminum cross bars, traverses and other components to be installed on rotatory
and mobile wing aircrafts . . . . . . . . . . . . . . . . . . . . . . . . . . . . . . . . . . . . . . . . . . . . . . . . . . . . . . . . . . 71
Figure 25. Flight lines with the recommended overlap. . . . . . . . . . . . . . . . . . . . . . . . . . . . . . . . . . . . 73
Figure 26. Calculation spreadsheet and parameters of the flight lines. . . . . . . . . . . . . . . . . . . . . . . . 74
Figure 27. Software interface used to create flight lines. . . . . . . . . . . . . . . . . . . . . . . . . . . . . . . . . . . 75

Mexico-Monitoring of Opium Poppy Cultivation 2014-2015
XII
Figure 28. Software interface of Pix4D mapper . . . . . . . . . . . . . . . . . . . . . . . . . . . . . . . . . . . . . . . . . 76
Figure 29. Good quality report generated by Pix4D mapper software . . . . . . . . . . . . . . . . . . . . . . . . 76
FIGURES IN ANNEX
Figure 30. Diagram of relations. . . . . . . . . . . . . . . . . . . . . . . . . . . . . . . . . . . . . . . . . . . . . . . . . . . . . . 82
Figure 31. Wavelengths of the (visible) spectrum . . . . . . . . . . . . . . . . . . . . . . . . . . . . . . . . . . . . . . . 100
Figure 32. Number of bands by type of spectrum in Geo Eye-1 images . . . . . . . . . . . . . . . . . . . . . . 101
Figure 33. Example of orbits (left) and satellite scope (right). . . . . . . . . . . . . . . . . . . . . . . . . . . . . . . 102
XIII
PICTURES INDEX
Picture 1. Poppy crops in very high resolution satellite images (VHR). . . . . . . . . . . . . . . . . . . . . . . . 13
Picture 2. Poppy crops in high resolution satellite image and in aerial photograph. . . . . . . . . . . . . . 16
Picture 3. Satellite image with clouds cover and aerial photograph of the same area. . . . . . . . . . . . 17
Picture 4. Group of analysts interpreting the satellite images on screen. . . . . . . . . . . . . . . . . . . . . . 18
Picture 5. Digitalization of polygons and area (ha) in Geo Eye - satellite image 1 (VHR) . . . . . . . . . 19
Picture 6. Poppy eradication efforts by the participating institutions of the monitoring
programmme . . . . . . . . . . . . . . . . . . . . . . . . . . . . . . . . . . . . . . . . . . . . . . . . . . . . . . . . . . . . . . . . . . . 21
Picture 7. Example of opium poppy fields identified though WorldView-2 satellite image . . . . . . . . . 35
Picture 8. Types of resolution of the images used for the monitoring. . . . . . . . . . . . . . . . . . . . . . . . . 44
Picture 9. Photointerpretation analysis of opium poppy crops in Geo Eye-1image (VHR). . . . . . . . . 54
Picture 10. Poppy crop detected in VHR image with a combination of RGB and IRc bands . . . . . . 57
Picture 11. Example of opium poppy crops interpreted in different analysis periods.. . . . . . . . . . . . . 61
Picture 12. A) Visible image (RGB). B) Image in near infrared (IRc) and C) False color image,
formed by a combination of visible bands and near infrared . . . . . . . . . . . . . . . . . . . . . . . . . . . . . . . 63
Picture 13. Sensors comparison with calibration adjustments. . . . . . . . . . . . . . . . . . . . . . . . . . . . . . 64
Picture 14. Intervalometer used in fieldwork. . . . . . . . . . . . . . . . . . . . . . . . . . . . . . . . . . . . . . . . . . . . 65
Picture 15. Capsule-type platform with external adaptation for rotatory wing aircraft (helicopter . . . 69
Picture 16. Metallic platforms built for rotatory and fixed wing aircrafts.. . . . . . . . . . . . . . . . . . . . . . . .72
Picture 17. Mobile wing aircraft with a porthole in the floor to install the metallic platform. . . . . . . . . 72
Picture 18. Fixed wing aircraft with a porthole in the floor to install the metallic base and cameras . 72
Picture 19. Example of installation of visible (VIS) and infrared cameras (IRc) in the metallic
platforms for rotatory and fixed wings. . . . . . . . . . . . . . . . . . . . . . . . . . . . . . . . . . . . . . . . . . . . . . . . . 73
PICTURES IN ANNEX
Picture 20. Details comparison between satellite images. . . . . . . . . . . . . . . . . . . . . . . . . . . . . . . . . . 101
Picture 21. Level of details by number of bits in each image . . . . . . . . . . . . . . . . . . . . . . . . . . . . . . . 102

XIV
MAP INDEX
Map 1. Study area composed of two monitoring sampling frames... . . . . . . . . . . . . . . . . . . . . . . . . . 12
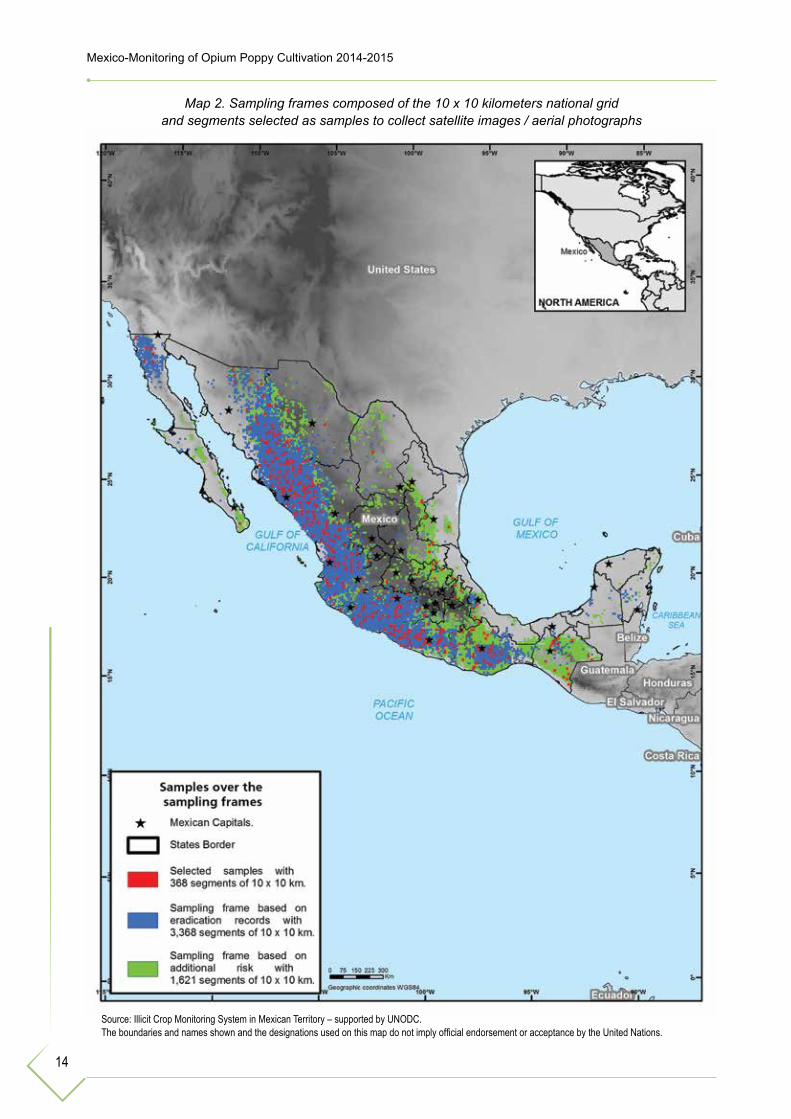
Map 2. Sampling frames composed of the10 x 10 kilometers national grid and segments
selected as samples to collect satellite images / aerial photographs . . . . . . . . . . . . . . . . . . . . . . . . . 14
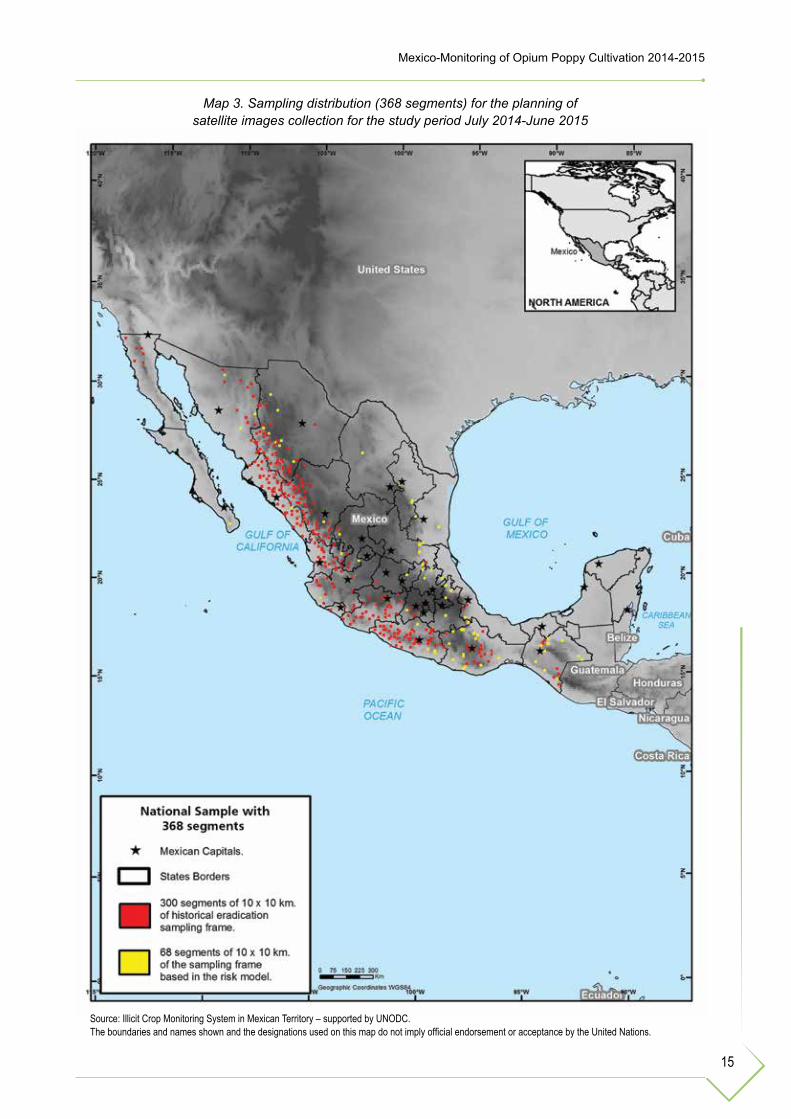
Map 3. Sampling distribution (368 segments) for the planning of satellite images collection
for the survey period July 2014-June 2015 . . . . . . . . . . . . . . . . . . . . . . . . . . . . . . . . . . . . . . . . . . . . 15
Map 4. Area (ha) under opium poppy cultivation in 368 segments (10 x 10 Km) of the sample. . . . . 23
Map 5. Acquisition percentage of satellite images and aerial photographs by segment of the
sample Averaged with the three four-month periods . . . . . . . . . . . . . . . . . . . . . . . . . . . . . . . . . . . . . 24
Map 6. National orthogonal grid of10 x10 Km (100 Km2 per segment) . . . . . . . . . . . . . . . . . . . . . . 27
Map 7. Sampling frames (I and II) used to estimate the area (Ha) under opium poppy cultivation . . 28
Map 8. Sampling frame with eradication historical records of illicit crops . . . . . . . . . . . . . . . . . . . . . 30
Map 9. National area of illicit crops probabilities / risk by determining factors . . . . . . . . . . . . . . . . . 32
Map 10. Location of the satellite images used in the sample of 368 segments. . . . . . . . . . . . . . . . . 33
Map 11. Distribution of the sampling frame I with 100 geo strata used to obtain the sample
of 300 segments of 10 x 10 km . . . . . . . . . . . . . . . . . . . . . . . . . . . . . . . . . . . . . . . . . . . . . . . . . . . . . 34
Map 12. Location of the test areas through satellite images LANDSAT 7 and 8.. . . . . . . . . . . . . . . . 36
Map 13. Mexican Continuum of Elevations model . . . . . . . . . . . . . . . . . . . . . . . . . . . . . . . . . . . . . . . 48
Map 14. Total segments of the sample (10 x 10 km) with aerial photographs collected during
the fieldwork . . . . . . . . . . . . . . . . . . . . . . . . . . . . . . . . . . . . . . . . . . . . . . . . . . . . . . . . . . . . . . . . . . . . 80
MAPS IN ANNEX
Map 15. Historical information of opium poppy eradication in 2010. . . . . . . . . . . . . . . . . . . . . . . . . . 87
Map 16. Historical information of cannabis eradication in 2010. . . . . . . . . . . . . . . . . . . . . . . . . . . . . 88
Map 17. Average altitudes of the Mexican territory (MASL) . . . . . . . . . . . . . . . . . . . . . . . . . . . . . . . . 89
Map 18. Slopes average (%) in the Mexican territory. . . . . . . . . . . . . . . . . . . . . . . . . . . . . . . . . . . . . 90
Map 19. Standard deviation of the slopes average (%) in the Mexican territory. . . . . . . . . . . . . . . . . 91
Map 20. Minimum distance of the paved roads (Km) to each segment centroid (10 x 10 Km) in
the Mexican territory . . . . . . . . . . . . . . . . . . . . . . . . . . . . . . . . . . . . . . . . . . . . . . . . . . . . . . . . . . . . . . 92
Map 21. Total population per towns and cities in the Mexican territory. . . . . . . . . . . . . . . . . . . . . . . . 93
Map 22. Average of the population marginalization index in the Mexican territory. . . . . . . . . . . . . . . 94
Map 23. Dense vegetation in the Mexican territory. . . . . . . . . . . . . . . . . . . . . . . . . . . . . . . . . . . . . . . 95
Map 24. Other types of vegetation in the Mexican territory. . . . . . . . . . . . . . . . . . . . . . . . . . . . . . . . . 96
Map 25. National area of illicit crops probabilities / risk by determining factors . . . . . . . . . . . . . . . . . 97

1
This report presents the first official national estimates of opium poppy crop cultivation in Mexico, resulting from the Project MEXK54 “Monitoring System for Illicit Crops in the Mexican Territory” jointly implemented by the Government of Mexico and the UNODC Illicit Crop Monitoring Pro-gramme.
The survey methodology was developed during the pilot project phase between the second half of 2012 and the first half of 2014. First, an analysis was made of illicit crop cultivation risk areas. Second, different spatial designs for statistical sampling were tested and the optimum plan for satellite image collection was established in accordance with crop calendars derived from a time series analysis of a large number of satellite images. Third, a tailor-made design was created and operational procedures were developed to capture aerial photographs from fixed-wing and rotato-ry-wing aircrafts. Finally, a standardized set of criteria was set up to interpret the images, including a quality control workflow and external accuracy assessments in cooperation with statistics and remote sensing experts from UNODC and two universities (from Mexico and from Austria).
The survey methodology was based on the analysis of satellite images and aerial photographs collected from areas of 10 by 10 kilometers each, which were selected by samples (so-called seg-ments). The selected sample segments (368 segments for each cycle) were obtained from two dif-ferent sampling frames. The first frame was based on the historical data of crop eradication and the second one on bio-physical and socio-economic factors that were correlated with illicit cultivation areas. This statistical analysis highlighted the correlation between illicit crop production and poor socio-economic conditions in the areas where illicit crop cultivation occurs.
The implemented satellite images have very high spatial resolutions (VHR) ranging from 1.5 to 0.50 meters per pixel. In addition, aerial photographs were taken by means of overflights with a better spatial resolution of up to 25 centimeters. Images were acquired during three potential “sow-ing-harvesting” periods: 1) from July to October 2014; 2) from November 2014 to February 2015; and 3) from March to June 2015. Since the agricultural cycle of opium poppy has a duration of at least 4 months, the detection of any poppy field grown in the segments in the period July 2014 to June 2015 should be guaranteed.
Satellite and aerial images were analyzed through visual interpretation techniques and with a systematic cross-checking of interpretations. Due to the difference in spatial resolutions between satellite and aerial images, some fields that might not have been detected in the lower resolution images could be detected in higher resolution images, especially in cases of cloud coverage on the satellite imagery. These differences were corrected by applying a correction factor.
According to the Illicit Crops Survey in Mexico, the estimated area under opium poppy cultiva-tion between July 2014 and June 2015 was:
• High value: 30,400 hectares.• Medium value: 26,100 hectares (more precise).• Low value: 21,800 hectares.
These results have a confidence interval of 95%. The observed opium poppy fields were mainly located in the Western Sierra Madre in the states of Sinaloa, Chihuahua, Durango and Nayarit; as well as the Southern Sierra Madre in the states of Guerrero and Oaxaca.
1. EXECUTIVE SUMMARY

Mexico-Monitoring of Opium Poppy Cultivation 2014-2015
2
The estimated area under opium poppy cultivation represents the area found only through the satellite images/aerial photographs and is not corrected for the historical record of eradication that might have taken place after the image acquisition. The government of Mexico reports that for the survey period (July 2014 – June 2015) a total of 24729 hectares of opium poppy were eradicated.
The next opium poppy cultivation monitoring cycle is being carried out between July 2015 and June 2016. Regular monitoring will enable the identification of trends and will provide an insight into the dynamics of crop cultivation with regards to space and time. In addition, two new goals have been added to the monitoring project: 1) to obtain a yield estimate for the production of opium gum (kg/ha) and 2) to determine the morphine content of Mexican opium gum through chemical analysis.
The survey also included the monitoring of cannabis cultivation, but its results are not yet com-plete as the monitoring and analysis of this crop are still under way in order to reach a technically reliable estimate. Cannabis is cultivated at a smaller scale than opium poppy and also takes place in urban places such as gardens, courtyards, and small plots of land or greenhouses. Moreover, the crop is sometimes combined with other (licit) crops, which complicates its detection through remote sensing images.
With this report, the Government of Mexico reaffirms its interest to advance in the collection of evidence for explaining the dynamics of the multidimensional drug phenomenon. The project is one of the elements to implement comprehensive public policies which take into account the so-cio-economic causes and consequences in consistence with the objectives and commitment of the Government of Mexico that resulted from the United Nations General Assembly Special Session on the World Drug Problem held in New York, on April 19-21, 2016 (UNGASS 2016).

3
2. INTRODUCTION
Illicit crop cultivation is a complex phenomenon in Mexico and should therefore be analyzed within a comprehensive approach that includes the understanding of economic, geographic and social factors. Not only does it requires additional efforts by the institutions in charge of controlling and reducing areas under poppy and cannabis cultivation but also of institutions that aim to improve the socio-economic and environmental conditions of these affected areas. In this regard, what is required is to design public policies aimed at implementing alternative development programmes and viable licit activities that support affected societies, which dwell mainly in rural areas, thereby guaranteeing the communities’ sustainability and the reduction of illicit crops.
The international community needs to work in a comprehensive and coordinated cooperation scheme against the damages caused in the operation of transnational economies based on illicit drug trafficking as well as their national, regional and global effects. The overall aim is to generate effective public policies to address this problem and manage to reduce the supply and demand of drugs.
UNODC is mandated to support governments in order to face international drug-related problems, organized crime, corruption and prevention of terrorism. This work is fueled by the different aspi-rations and mandates aimed at improving the satisfaction of particular needs shared by the United Nations Member States.
The basis of the present monitoring survey of opium poppy cultivation in Mexico is the “Internation-al Drug Control System”, which is composed of three main international treaties on drug control that complement each other and provide the legal base needed to guide the actions to address drug-related crimes.
These treaties codify international measures to guarantee the narcotic and psychotropic substanc-es available for medical and scientific purposes and to prevent the misuse of these substances for illicit purposes. These instruments also include general provisions about illicit trafficking and drug abuse. The three treaties previously mentioned are:
1. The Single Convention on Narcotics Drugs 1961. 2. The United Nations Convention on Psychotropic Substances 1971. 3. The United Nations Convention against Illicit Traffic in Narcotic Drugs and Psychotropic
Substances 1988.
Since 1999, UNODC (which is based in Vienna, Austria) has been establishing methodologies through the Illicit Crop Monitoring Programme (ICMP) to collect and analyze data in order to strengthen the capacity of governments to monitor illicit cultivation on their own territories and to assist the international community in monitoring the extent and evolution of illicit crops.
The ICMP currently covers seven countries: Colombia, Bolivia and Peru for coca leaf cultivation; Afghanistan, Laos and Myanmar and Mexico for opium poppy. In 2012 the Illicit Poppy Crop Mon-itoring Programme called Project MEXK54 “Illicit Crop Monitoring Project in the Mexican territory was initiated in Mexico”. The project was organized by UNODC in collaboration with the Mexican government through its federal institutions: the Ministry of Foreign Affairs (SRE), the Ministry of the National Defense (SEDENA), the Ministry of the Navy (SEMAR) and the General Attorney’s Office through the Criminal Investigation Agency and the National Center for Planning, Analysis and In-formation to Counter Crime.

Mexico-Monitoring of Opium Poppy Cultivation 2014-2015
4
The Government of Mexico thereby ventures into the illicit crop monitoring practice with technologi-cal inputs and own capabilities that have already been in place over the past years, with operation-al infrastructures. The Government of Mexico looks to exchange experiences at an international level in order to strengthen, expand and enhance the efficiency of the National Programme of Surface Estimation.
The project’s general objective is to “strengthen the Mexican Government’s technical capabilities to detect illicit crops with high precision, which will enable to develop comprehensive public poli-cies aimed at addressing the supply and demand of drugs”. The main goal of this first survey is “to estimate the area under poppy cultivation (ha) in one year (12 months)”.
To implement this initiative in Mexico, theoretical and technical assistance of experts was required on the field to improve the methodology, interpretation and data analysis with remote sensing in order to obtain results that allow to elaborate reliable statistics about the area of interest, which represents the entire national territory.
The first activities of the project were carried out from the second half of 2012 to the first half of 2014 under the so-called “Pilot Phase” whereby some of the methodological aspects applied by the project were developed, such as:
• Different spatial designs for monitoring.• Analysis of the potential/risk areas under illicit crops.• Standardization of the criteria used for various analysts’ interpretations and their quality
control.• Synchronization and programming of the satellite images and aerial photographs capture in
areas under opium poppy cultivation in accordance with their crop calendars. • Design and operation to take aerial photographs with a tailor-made system for aircrafts with
fixed wing (airplane) and rotatory wing (helicopter). • Statistical analysis of the area under opium poppy cultivation and the need to apply correc-
tion factors to the final estimation, when needed.
The report describes in detail the inputs, methods and processes used to reach an estimation of the illicit opium poppy cultivation. Chapters 3 and 4 describe the background, institutions and the personnel involved in the project. Chapter 5 briefly presents the methodology, while results are ex-posed in Chapter 6. Chapter 7 describes all the methodological details applied for the monitoring.
5
3. BACKGROUND
The main zones under opium poppy cultivation are concentrated in the convergence area between Sinaloa, Chihuahua and Durango states, in the area called “Golden triangle”, particularly in the Western Sierra Madre; Guerrero state is also affected at some parts of the Southern Sierra Madre. Additionally some crops are located in Nayarit, Jalisco, Michoacán and Oaxaca states but with a variable dynamic and lower area under poppy cultivation.
As a part of the Mexican government strategies and efforts, in 2006 the president decided to trans-fer the eradication tasks from the PGR to the Armed Forces in accordance with the 2013-2018 Sectorial Programme of the Ministry of the National Defense (SEDENA) and the Ministry of the Navy (SEMAR). These institutions have been authorized by the government to perform activities of narcotics prevention and eradication, in the particular case of SEDENA, by implementing the intensive eradication and interception operations in the main illicit crop cultivation areas to inhibit trafficking any type of drugs.
In this regard, the Mexican government is committed to tackle this growing trend and has identified the need to develop new strategies and technological tools capable of harmonizing global and local policies.
Thus, the Mexican government has strengthened its capacities through SEDENA and SEMAR intelligence actions to detect illicit crops by using satellite images to monitor the impact of illicit crops eradication strategies. Besides the Ministry of Foreign Affairs (SRE) and the General Attor-ney Office (PGR) have intensified the international cooperation actions used to achieve a supply reduction and the measures used to control and counter the related crimes through the Criminal Investigation Agency, an institution responsible for collecting and analyzing statistical information through the National Center for Planning, Analysis and Investigation to Counter Crime.
The Mexican government has raised the need to study the illicit crop phenomenon from a wider perspective that allows understanding the dimension of the poppy and cannabis cultivation prob-lem in Mexico and seeking to approach an international organization to elaborate a methodology with international standards to monitor and estimate the area under illicit cultivation.
Under the “2013-2018 National Development Plan”, Mexico recently adopted some strategies aimed at promoting the creation of interinstitutional coordination entities to generate the studies and research projects; promoting national and international cooperation schemes; strengthening the military activities in land, air and sea fields; as well as reinforcing the Military and Navy Intel-ligence Systems to integrate them into different federal public administration agencies with infra-structure and better technological resources. The Mexican Federal Government had made efforts and surveys about the problem of illicit crops in the country before implementing Project MEXK54 Illicit Crop Monitoring System in the Mexican Territory. Some of them included: eradication of illicit cultivations, crop monitoring, tests to obtain yield factors and phenological analysis, as well as alternative development projects focused on the reconversion of illicit crops in high incidence areas.
6
Mexico-Monitoring of Opium Poppy Cultivation 2014-2015
I. ILLICIT CROP ERADICATION WORKS
• In Mexico, during the 50s, an increasing trend of sowing, cultivating and trafficking narcotic drugs was observed. This situation forced the Mexican government to establish some mea-sures in order to hinder this illicit activity through the following action plans: “CANADOR Plan”, “CONDOR Operation”, “MARTE Task Force”, among others. These plans used great amounts of human and material resources to counter this illicit activity with the support of the armed forces because it was considered a risk for the national security.
• Under Mexico’s Strategy to Eradicate Narcotic Drugs, the development of technical and scientific surveys about illicit cultivation was planned in order to establish a specific meth-odology (according to physical-environmental, socio-economic and cultural conditions pre-vailing in drug-producing regions) to estimate the narcotic drug production in Mexico as well as the potential area under cultivation over the national territory.
• In 2004 the Bilateral Group for Analysis and Information Exchange on Interception (BGAIEI) was created in order to enhance the bilateral cooperation mechanisms to intercept drugs in accordance with the current laws of every country. The General Attorney Office led the Mexican efforts through the National Center of Planning, Analysis and Information to Count-er Crime (CENAPI); besides the American tasks were headed by the Executive Director of the Interception Coordination (USIC).
II. ILLICIT CROP MONITORING
• Since 1974 an initial illicit crop identification programme was carried out through an ad-vanced aerial photography system which located the poppy cultivation more accurately. The Mexican government efforts implemented strategies to monitor the drug-producing ar-eas in a better way and in 1983 the territory was divided into operative bases with the aim of carrying out activities such as: reconnaissance aerial operations, eradication and verifi-cation of illicit crops with plans and special operations in the historical periods identified as high incidence to sow and harvest drug narcotics as well as police investigation operations, among others.
• In 2003 the Mexican government implemented the first works to detect illicit crops over its territory with new technologies and an avantgarde vision through the institutions in charge of the national security (SEMAR - SEDENA). This launched the “Mexican Receiving Station of the SPOT Constellation (ERMEXS)” that allowed to receive satellite imagery of a 20, 10 and 2.5-meter spatial resolution. This station was located and operated in SEMAR prem-ises.
• From 2004 to 2006, SEMAR carried out the first activities to establish a methodology used to detect opium and cannabis illicit crops in the country with the SPOT constellation tech-nology. In 2008 this background contributed to create the inter-institutional collaboration group between both SEMAR and SEDENA analysts in order to detect and eradicate illicit cultivation.

7
Mexico-Monitoring of Opium Poppy Cultivation 2014-2015
• In 2009, SEMAR and SEDENA approached the United States of America government on behalf of Mexico and achieved relevant support such as the programming and delivery of high resolution satellite images obtained from the Ikonos, Quick Bird and World View 2 sensors whose spatial resolution ranges from 1.0 to 0.50 m.
• On March 1st of 2010, SEDENA and the Agro-alimentary and Fishing Information Service (SIAP) belonging to the Ministry of Agriculture, Cattle Industry, Rural Development, Fishing and Food signed a collaboration agreement to provide the “ERMEXS” with “SPOT” satellite images and support the projects implemented by the SEDENA. On March 9th of 2012 these institutions continued the ERMEXS station project by signing a new agreement to jointly op-erate the “Mexican Reception Station SPOT New Generation” (ERMEX ng) used to obtain and implement high resolution satellite images (SPOT 6 and SPOT 7) until 2023.
• In 2011 the SEMAR capacities increased with a new technology to get VHR satellite images used to remotely analyze and observe the Mexican territory. It managed to set the “Virtual Station of Very High Resolution Satellite Images” with the GEOEYE US company. This station is able to receive satellite images of up to 0.45 meters of spatial resolution, thereby expanding the illicit crop detection capacities and accuracy.
III. TESTS TO OBTAIN YIELD AND PHENOLOGY ANALYSIS OF ILLICIT CROPS:
• From 1999 to 2004 the Mexican government had already made a preliminary survey about the illicit crops yield, features, and poppy phenological development in the country through its institutions specifically the General Attorney Office (PGR). These studies were made in greenhouses of the Operation and Training Base “El Caracol” in Culiacán, Sinaloa. This base belonged to the former General Directorate of Eradication of Illicit Cultivation which was part of the Federal Investigation Agency (AFI) in the PGR and was absorbed by the Ministerial Federal Police in June 2012. In this period the yield parameters and growth stages of the illicit crops in Mexico were obtained and fostered special projects on poppy and cannabis genetic investigation. These findings supported the federal forces eradication efforts in several places of the states.
• Regarding the survey “Opium Gum Yield Rate in Mexico”, the United Nations (UN) meth-odology was implemented and then published in 2001 by UNODC as “Guidelines for Yield Assessment of Opium Gum and Coca Leaf from Brief Field Visits”. In the next year, the Mexican government trained military personnel to collect data during the field samplings for yield evaluation purpose. In February and March 2001, the first sampling took place in the North zone (including Chihuahua, Sinaloa, Durango and Nayarit states) and in the South zone (Michoacán, Guerrero and Oaxaca).
• “Characteristics and Phenological Development of Opium Poopy Cultivations” was another scientific survey available for the Monitoring Project in Mexico. This information provided references on the opium poppy plants phenology. In 2004 the investigation tasks were carried out and determined in the light of the laboratory conclusions that poppy cultivation has a length of 120 days for an optimal phenological development from the sowing to the harvest. The survey included a chart with the amount of days needed in each growth period.

8
Mexico-Monitoring of Opium Poppy Cultivation 2014-2015
IV. ILLICIT CROP CONVERSION PROGRAMME
Under the 1990-1993 Rural Development Programme, the Mexican government implemented a project called “Rural Development to Hinder Illicit Cultivation: the Mexican experience in Oaxaca, Guerrero and Michoacán” through the Ministry of Foreign Affairs (SRE) and the General Attorney Office (PGR) and the Governments of the States of Oaxaca, Guerrero and Michoacán. The initia-tive was aimed at expanding job opportunities and increasing the local communities’ income to hin-der illicit crop cultivation by establishing small-scale communitarian programmes of a productive, social and infrastructural kind in Oaxaca, Guerrero and Michoacán rural areas. However, the lack of follow up prevented this programme to provide benefits to rural societies of the states where it was applied.
9
4. INSTITUTIONS AND PROJECT PERSONNEL
Activities developed under the MEXK54 Monitoring Programme are the result of the combined efforts between UNODC and the Mexican Government with the participation of federal agencies as well as national and international academic institutions. Each part has contributed to the pro-gramme with its own inputs.
4.1. ORGANIZATION OF THE INVOLVED INSTITUTIONS
These institutions along with UNODC are in charge of implementing and contributing to the Poppy Crop Monitoring Programme activities in Mexico:
A. The Ministry of Foreign Affairs (SRE) is responsible for implementing the foreign policy determined by the Federal Executive. In this regard it promotes international cooperation in order to prevent and tackle the global problem of drugs. SRE monitors the UNODC ICMP programme currently executed in Mexico.
B. The Ministry of the National Defense (SEDENA) is the technical-operational entity in charge of detecting poppy cultivation through the analysis of satellite images due to its jurisdictional responsibility in most of the territory. It is also the institution that plays a significant role in the national efforts to eradicate illicit crops in the country. Its results are reported, managed and systematized by AIC/CENAPI. Besides, it gives logistic support by providing the project with aircrafts and satellite images to collect and validate field data.
C. The Ministry of the Navy (SEMAR) as SEDENA, is the technical-operational entity respon-sible for analyzing satellite images and aerial photographs to detect poppy cultivation. Like-wise it participates in the national efforts to eradicate illicit cultivation in Mexico. Finally, this Ministry collaborates in logistic activities like SEDENA does.
D. The General Attorney Office/Criminal Investigation Agency/National Center for Planning, Analysis and Information to Counter Crime (PGR/ AIC-CENAPI) is the administrative entity responsible for the project. It is in charge of the specialized systems and data bases to an-alyze and diagnose the national and transnational organized crime in Mexico.
E. The United Nations Office on Drugs and Crime (UNODC) is the agency in charge of coordi-nating the project and is responsible for the methodology development, quality control and transparency when reporting the results in accordance with international standards. It has a Liaison and Partnership Office in Mexico and an Executive Secretariat in Vienna, Austria.
4.2. EXTERNAL INSTITUTIONS (ACADEMIC)
The academic institutions involved in the project are: the Geography Institute of the National Au-tonomous University of Mexico (UNAM) and the University of Natural Resources and Life Scienc-es, Vienna, Austria (BOKU).

10
Mexico-Monitoring of Opium Poppy Cultivation 2014-2015
These institutions undertake research and train the university researchers. The experience of each of them helps to increase the project capacities in areas such as: creation of data bases, produc-tion of thematic cartography, analysis methods with remote sensors, quality control standardiza-tion, development of GIS technologies to assess geographic data, use of methods to analyze the regional environment and schemes of field sampling with aerial photography.
Thus, the academic experts actively assist and assess the monitoring project team by providing the scientific support required to get reliable and quality data.
4.3. ORGANIZATION OF THE PROJECT’S PERSONNEL
The monitoring project is composed of the UNODC and governmental institutions personnel. The project coordination is based in UNODC Mexico office and comprises a General Coordinator, an Analysis and Monitoring Technical Assistant and a Programme Assistant. The project is supported by a GIS and remote sensing expert, a statistics expert, and a programme officer who are based in Vienna.
SEDENA, SEMAR and AIC/CENAPI-PGR (the Mexican government stakeholders of the project) have provided the Monitoring Programme with personnel to support the satellite images process-ing and digital correction as well as the provision of field aerial photography which is a main input to analyze and validate the poppy cultivation fields.
The technical team in charge of collecting and analyzing the data is composed of seven persons with very different profiles: three geographers, two biologists, one photometrist and two remote sensing and GIS specialists. In general, this group is expert in cartography, digital correction pro-cess of satellite imagery, remote sensing photointerpretation, GIS analysis and field technologies (aerial and terrestrial GPS navigators, digital cameras with visible and infrared sensor, satellite GPS, among others).

11
5. BRIEF DESCRIPTION OF THE MONITORING METHODOLOGY
This chapter briefly explains the different elements of the monitoring in order to understand the principle of illicit crop area estimation. Chapter 7 gives a detailed explanation of all its elements.
The preliminary tasks included a test period called “pilot phase” during which all available infor-mation were analyzed such as the geographic inputs, infrastructure and computing media, and statistical analysis of the historical records of poppy cultivation. In this regard an analysis of the challenge to identify the main areas of incidence was carried out. Mexico is a very large country (2,000,000 km2 approximately) with a rugged terrain and hard-to-reach places where illicit crops are sowed in small fields and in very steep hills. Furthermore, illicit crops in Mexico are cultivat-ed at different times of the year which vary from region to region in various weathers conditions and others circumstances.
Therefore, a complete monitoring of the area (census) with remote sensing would be a very ex-pensive task and would require a disproportionate amount of human and technical resources. So in this pilot phase the three main problems of this type of projects were determined:
1. Determine (reduce) the study areas. 2. Determine the method to select the samples where the satellite images/aerial photos are
taken. 3. Determine the time nature and the quantity of annual sowing and harvesting.
5.1. DETERMINING THE STUDY AREAS: TWO SAMPLING FRAMES
Mexico has a significant area and geographic, socioeconomic and social characteristics that complicate the environment where poppy and cannabis are cultivated and harvested. This phe-nomenon is common in areas where physiographic conditions are optimal for the phenological development of plants i.e. in places whose weather and altitude boost the crops growth. On the other hand, water bodies are available for the sowing process. Finally the rugged orography makes the access difficult and is used to hide these fields.
The best starting point of the existence and location of illicit cultivation area in the country are the eradication historical records. This data was used in two ways: first a geographic eradication his-torical series was used; this information enables to know the high incidence areas of poppy culti-vation. Then the historical data base was used to apply a statistical model with a set of biophysical and socioeconomic criteria that can be correlated with the incidence of the eradicated fields.
The application of this model resulted in a risk map showing areas similar to those where illicit crops were found in the past (Annex I).1 The risk map identified a bigger area than the one obtained only through the eradication area. Additional areas were added to the initial survey area. Then, two studying areas were obtained and were called “sampling frame of eradication” and “sampling frame of additional risk”, as shown in Map 1.
1 Annex I. Survey about the statistical analysis of probability for illicit crops by determining factors (risk). In this analysis, categories of risk probability were obtained from very high, high, medium, low, very low. Likewise these areas were compared to the incidence of historical cultivation.

12
Mexico-Monitoring of Opium Poppy Cultivation 2014-2015
Map 1. Study area composed of two monitoring sampling frames.
Source: Illicit Crop Monitoring System in Mexican Territory – supported by UNODC. The boundaries and names shown and the designations used on this map do not imply official endorsement or acceptance by the United Nations.

13
Mexico-Monitoring of Opium Poppy Cultivation 2014-2015
Picture 1: Poppy crops in very high resolution satellite images (VHR).
World View-2 Image (0.50 meters)
Aerial photograph (0.25 meters)
5.2. SAMPLING-BASED METHODOLOGY
The estimation of the area under poppy cultivation is based on the identification of these crops in very detailed satellite images and aerial photos (with very high resolution) that enable to discov-er the small illicit crops (picture 1). Although the study area described in paragraphs above was reduced, analyzing the entire surface through these images would not be viable. Thus, a set of samples which helped to plan the capture of satellite images/aerial photos was selected (map 2).
In this particular case, 300 samples were chosen in the historical eradication sampling frame and 68 in the additional area with the sampling frame of illicit crops determining factors (risk) (map 3). The total samples were statistically chosen for the entire country to enhance the geographic dis-tribution.
Both sampling frames were made up within a national grid with 10 x 10 kilometers geographical squares (segments) which were overlapped on top of the study areas with the historical eradication data and the probability data by illicit crops determining factors (risk).
14
Mexico-Monitoring of Opium Poppy Cultivation 2014-2015
Map 2. Sampling frames composed of the 10 x 10 kilometers national grid and segments selected as samples to collect satellite images / aerial photographs
Source: Illicit Crop Monitoring System in Mexican Territory – supported by UNODC. The boundaries and names shown and the designations used on this map do not imply official endorsement or acceptance by the United Nations.
15
Mexico-Monitoring of Opium Poppy Cultivation 2014-2015
Map 3. Sampling distribution (368 segments) for the planning of satellite images collection for the study period July 2014-June 2015
Source: Illicit Crop Monitoring System in Mexican Territory – supported by UNODC. The boundaries and names shown and the designations used on this map do not imply official endorsement or acceptance by the United Nations.

16
Mexico-Monitoring of Opium Poppy Cultivation 2014-2015
Picture 2. Poppy crops in high resolution satellite image and in aerial photograph
World View-2 Image (0.50 meters) Aerial photograph (0.25 meters)
5.3. SAMPLES COLLECTED THREE TIMES OVER THE YEAR TO IDENTIFY OPIUM POPPY CROPS
The satellite images and the aerial photographs were collected at least three times in each four-month period during the monitoring year (July 2014-June 2015). This guaranteed that all the crops cultivated at any time in the year were detected by satellite images/aerial photos considering that the growth cycle of poppy crops is approximately 4 months.
Table 1: Three collection periods for satellite images / aerial photograph
Collect areasPeriods
July-October 2014 November 2014-February 2015 March-June 2015
Total sample in theMexican territory
368 segmentsof 10 x 10 Km
368 segmentsof 10 x 10 Km
368 segmentsof 10 x 10 Km
5.4. SENSORS USED TO COLLECT SATELLITE IMAGES AND AERIAL PHOTO-GRAPHS
The use of remote sensing images is based on satellite images from different sensors (SPOT-6 and 7, Ikonos, Quick Bird, Geo Eye-1, World View-2 y 3) in combination with aerial photos. In the monitoring year, 3 images were taken per each segment. The small field size requires using very high resolution images (0.4-0.7 meters) to determine and distinguish the crops and to take accu-rate measures.
In addition fieldwork took place on a yearly basis to collect the aerial photographs (with a resolu-tion of 0.25 meters) (picture 2) that complemented the information in areas where satellite imagery had no data due to cloud cover. Aerial photographs are a major input because they contribute to validate the poppy crops detection in the sample segments.
In the in-house analysis (office) the use of samples having both satellite images and aerial photos coverage was preferred. The difference in details has been significant and the possible interpreta-tion variation has been considered in the final area estimate by using a correction factor.

17
Mexico-Monitoring of Opium Poppy Cultivation 2014-2015
Picture 3. Satellite image with cloud cover and aerial photograph of the same area
World View-2 Image (0.50 meters) Aerial photograph (0.25 meters)
5.5. DETERMINING THE OPTIMAL DATES TO COLLECT SATELLITE IMAGES
For every four-month period, data capture was programmed around the optimal dates for poppy crops monitoring i.e. when the crops reflect a larger proportion of green and infrared light in images (Mattiuzzi et. al., 2014). The optimal date varies for each segment depending on their geographic position, their topography, local weather and water availability for cultivation. The pilot surveys were made between 2012 and 2013 and they identified the best dates by using the detected fields and searching the phenology (vegetative growth) of poppy cultivation through an extensive time series analysis of Landsat2 medium resolution satellite images (Chart 1).
At the beginning the following programming cycles were applied to collect the satellite images and aerial photography in the study areas. They used accurate dates adapted to the phenology survey for the three periods of four months:
1. July/October 20142. November 2014/February 20153. March/June 2015
2 Analysis date survey to determine crop calendars by using time series of satellite images and Normalized Difference Vegetation Index (NDVI). With this procedure the first crop calendar for opium poppy cultivation was established. Later on, it was used to program the collect of satellite images and aerial photography in the field in its high production phenological phase.
Chart 1: Examples of phenological cycles identified with time series of satellite images

18
Mexico-Monitoring of Opium Poppy Cultivation 2014-2015
Picture 4. Group of analysts interpreting the satellite images on screen
5.6. INTERPRETATION OF THE SATELLITE IMAGES
The collection of satellite images and aerial photographs was followed by intensive in-house works in order to interpret the satellite images. The analysts group systematically carried out visual pho-tointerpretation over all the available images and aerial photos, digitalizing detected illicit crops (polygons) throughout GIS tools. The process indicates the pre-established criteria in the meth-odology (decision tree, interpretation keys, and predefined display scales). An analysis to reduce subjectivity in opium poppy cultivation photointerpretation was performed afterwards, based on a robust verification workflow (see chapter 7.10.1). This technique consists in exchanging images between the analysts who make new revisions. When the analysis is finished, a final revision of the detected crops is carried out by the group supervisors.
Additionally, when the analysis was completed, the team of analysts carried out a last visual revi-sion on screen to reach an independent quality control with a collective discussion about the inter-pretations included in the final revision (picture 4). This gives a collective feedback about emerging doubts in the group and keeps enhancing the standardization of the criteria used in the analysis.

19
Mexico-Monitoring of Opium Poppy Cultivation 2014-2015
5.7. STATISTICAL CALCULATION TO ESTIMATE THE AREA UNDER OPIUM POPPY CULTIVATION
After digitalizing the crops (polygons), the areas (ha) were calculated for each crop and added up into each 10 x 10 km segment of the selected sample. The total sum of all the sampling segments was extrapolated to the original sampling frame in accordance with the corresponding statistical rules, according to the sampling method. However, the extrapolations were independently made for the two sampling frames because each sample was taken separately. The sum of the detected surfaces per four-month period and per sampling frame is the result of the national statistical figure of the area under opium poppy cultivation.3
The lower (low value) and higher (high value) limits were calculated following the rules and stan-dards for combined ratio estimators. It should be considered that the estimated area only represent an estimate made into the sampling frames established for the monitoring.
3 It should be noticed that additional corrections to the first results can exist, as it happened in this first survey when a correction was made due to different types of resolution. For instance, for undetected crops in available satellite images, correction factors are applied (as previously mentioned) considering the results obtained in aerial digital photographs collected in the field as a reference.
Picture 5. Digitalization of polygons and area (ha) in Geo Eye-1 satellite image (VHR)

20
6. ESTIMATE RESULTS OF THE AREA UNDER OPIUM POPPY CULTIVATION
After integrating the individual opium poppy crop measures, a national total estimation was ob-tained. By applying the statistical model, it was possible to calculate the national area under opium poppy cultivation through the interpretations and measures made on the previously programed satellite images and aerial photographs for the 368 segments of the sample used in the two sam-pling frames for the whole period. As it is shown on map 3: 1) 300 segments taken from historical eradication data and 2) 68 segments obtained from the analysis of determining factors for illicit crops/risk.
6.1. ESTIMATED AREA UNDER OPIUM POPPY CULTIVATION The estimated area under opium poppy cultivation in 12 months for the monitoring period July 2014-June 2015 is 26 100 hectares (average), with a 95% confidence interval and a statistical range4 from 21 800 to 30 400 hectares (table 2). This result is the addition of the tree estimates in this period considering that opium poppy crops can grow at different times of the year. Map 4 shows the total hectares found in each monitoring segment.
Table 2. Estimated area under opium poppy cultivation (ha) for 12 months of monitoring in 2014 -2015
Result period Area (ha)(lower estimate)
Area (ha) (best estimate)
Area (ha) (high estimate)
July 2014 - June 2015 21 800 26 100 30 400
No trend can be noticed in the opium poppy cultivation development because it is the first national report which uses this methodology. Data for the period July/2015 - June/2016 is being processed and analyzed, which will enable to interpret any trend and geographic dynamic about opium poppy cultivation. However according to the applied sample, opium poppy cultivations were mainly found in nine states: Sinaloa, Chihuahua, Durango, Nayarit, Jalisco, Michoacán, Guerrero, Oaxaca and Chiapas.
Other states do not show opium poppy cultivation for this study period; however they are not necessarily opium poppy free. Due to the low density of the selected samples in some states, the potential area is small and it is possible that some small fields were not.5
The result does not consider if opium poppy crops could have been eradicated after monitoring (detection). Consequently, the estimates only refer to cultivation levels at the time when the sat-ellite images and aerial photographs were captured. It is also worth mentioning that the Mexican government official figures for the same monitoring period (July 2014-June 2015) reported a total eradication of 24,729 hectares of opium poppy cultivation as a joint effort of the institutions involved such as SEDENA, SEMAR and PGR/AIC (picture 6).
4 The range is the interval between the higher and the lower value statistically used for the sampling. Range does not include non-sampling errors, as those possibly made during the photointerpretation of satellite images and aerial photographs.
5 The sample definitions were taken at a national level, not at a state level. So they cannot be used to draw conclusions for any particular state.

21
Mexico-Monitoring of Opium Poppy Cultivation 2014-2015
Picture 6. Poppy eradication efforts by participating institutions in monitoring programme
SEDENA SEMAR
PGR AIC
It is important to note that the estimate of area under cannabis cultivation requires to keep mon-itoring crops for a longer period in order to collect and analyze technically validated data which can show the statistical reality of this type of illicit cultivation in Mexico. For cannabis, unlike opium poppy, there are other factors to be taken into account, from the way of sowing to harvesting. This activity can be made at a smaller scale or in urban places like gardens, courtyards, small plots in farmland, greenhouses or by mixing cannabis with licit cultivations, which makes its detection with remote sensing images difficult. This situation has hindered this report to present a technically and statistically reliable result of the area under cannabis cultivation.
22
Mexico-Monitoring of Opium Poppy Cultivation 2014-2015
6.2. COVERAGE AREA OF THE COLLECTED IMAGES USED TO ESTIMATE OPIUM POPPY CULTIVATION
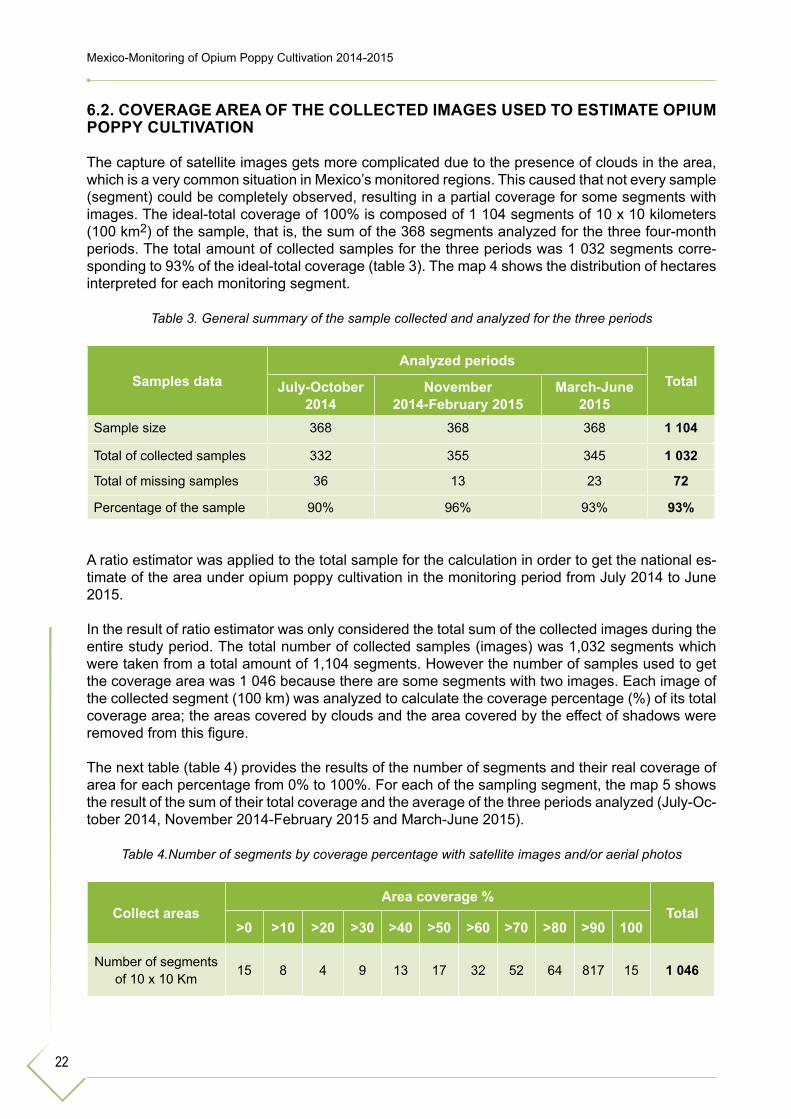
The capture of satellite images gets more complicated due to the presence of clouds in the area, which is a very common situation in Mexico’s monitored regions. This caused that not every sample (segment) could be completely observed, resulting in a partial coverage for some segments with images. The ideal-total coverage of 100% is composed of 1 104 segments of 10 x 10 kilometers (100 km2) of the sample, that is, the sum of the 368 segments analyzed for the three four-month periods. The total amount of collected samples for the three periods was 1 032 segments corre-sponding to 93% of the ideal-total coverage (table 3). The map 4 shows the distribution of hectares interpreted for each monitoring segment.
Table 3. General summary of the sample collected and analyzed for the three periods
Samples dataAnalyzed periods
TotalJuly-October 2014
November 2014-February 2015
March-June 2015
Sample size 368 368 368 1 104
Total of collected samples 332 355 345 1 032
Total of missing samples 36 13 23 72
Percentage of the sample 90% 96% 93% 93%
A ratio estimator was applied to the total sample for the calculation in order to get the national es-timate of the area under opium poppy cultivation in the monitoring period from July 2014 to June 2015.
In the result of ratio estimator was only considered the total sum of the collected images during the entire study period. The total number of collected samples (images) was 1,032 segments which were taken from a total amount of 1,104 segments. However the number of samples used to get the coverage area was 1 046 because there are some segments with two images. Each image of the collected segment (100 km) was analyzed to calculate the coverage percentage (%) of its total coverage area; the areas covered by clouds and the area covered by the effect of shadows were removed from this figure.
The next table (table 4) provides the results of the number of segments and their real coverage of area for each percentage from 0% to 100%. For each of the sampling segment, the map 5 shows the result of the sum of their total coverage and the average of the three periods analyzed (July-Oc-tober 2014, November 2014-February 2015 and March-June 2015).
Table 4.Number of segments by coverage percentage with satellite images and/or aerial photos
Collect areasArea coverage %
Total>0 >10 >20 >30 >40 >50 >60 >70 >80 >90 100
Number of segments of 10 x 10 Km 15 8 4 9 13 17 32 52 64 817 15 1 046

23
Mexico-Monitoring of Opium Poppy Cultivation 2014-2015
Source: Illicit Crop Monitoring System in the Mexican Territory – supported by UNODC. The boundaries and names shown and the designations used on this map do not imply official endorsement or acceptance by the United Nations.
Map 4. Area (ha) under opium poppy cultivation in the 368 segments (10 x 10 km) of the sample

24
Mexico-Monitoring of Opium Poppy Cultivation 2014-2015
Map 5. Acquisition percentage of satellite images and aerial photographs by segments of the sample averaged with the three four-month periods
Source: Illicit Crop Monitoring System in the Mexican Territory – supported by UNODC. The boundaries and names shown and the designations used on this map do not imply official endorsement or acceptance by the United Nations.

25
7. INPUTS OF THE DETAILED METHODOLOGY
Figure 1. Stages of the project’s methodology
Considering this is a national wide project and estimates need to be done at this scale and not with a regional, state or municipal level, the first step was to evaluate the available inputs and tools to plan the best strategy for the project development.
The methodology used to estimate the area under opium poppy cultivation is based on obtaining spatial information through remote sensing techniques, such as: satellite images, aerial photo-graph and/or video, obtained from artificial satellite in orbit or through aircrafts with either fixed (airplanes) or rotatory wings (helicopter).
The methodology is composed of seven stages, as shown in figure 1, including the use of tech-nologies, inputs, GIS tools, processes, validation, and verification of analyzed data through aerial photos collected in flights during fieldwork, and obtaining results by applying geo-statistics for the final estimate of the area under opium poppy cultivation.
However the information flow for the opium poppy crop photointerpretation faced some challenges which were overcome through the aforementioned complementary fieldwork. This gave the analyst a better vision to detect illicit crops. On the other side, the project established relations with two universities (one national and the other international) which permanently assessed the methodol-ogy and collaborated in searching the optimal growth stage of illicit crops and the potential areas/risk factors to cultivate these narcotic drugs in Mexico, thus guaranteeing the good quality of the final statistics.

26
Mexico-Monitoring of Opium Poppy Cultivation 2014-2015
7.1. NATIONAL GRID OF 10 X 10 KILOMETERS
A geographic grid was elaborated with 10 x 10 kilometers segments (100 km2) to obtain a mea-surement unit. This extent was selected according to the minimum size required to get satellite images/aerial photos. The geographic grids are commonly used as a geo-localization input, that is the spatial information expressed in cartesian coordinates (latitude and longitude).
In general terms, geographic grids are divided in two types: “equal angle” (grids with constant cells size expressed in latitude and longitude degrees) and “equal area” (grids with cell size of the same extent, for instance, 1,000 km2, 100 km2, 10 km2, 1 km2). By using grids it is possible to divide the area of any geographic space in series of cells or adjacent segments which have a particular geo-metric form, “square, rectangle, triangle, among others”; any of them are assigned with a particular numeric or alphanumeric identifier, used for indexing or spatial positioning.
For this project, an orthogonal alphanumeric6 grid of “equal areas”, square type, with “alphanumer-ic index” was created through GIS software (Arc- Map). This grid has a total of 22 308 segments of 10 x 10 kilometers distributed all over the country and each one covers a 100 km2 area (map 6). Each grid segment is assigned with an alphanumeric identifier, which allows to gather the selected parameters for each segment, as shown in figure 2.
With this grid of 22 308 segments the two sampling frames were obtained with those which were used to extract the representative sample of 368 segments of the national territory. For the first one (300 segments) the historical eradication data of illicit cultivation were used in the country; for the second additional sampling frame (68 segments), the analysis data of determining factors for illicit crops (risk) were used.
6 A reference system that enables to name locations in a point or zone of a map, photograph or other graphic in terms of numbers or letters, also known as “alphanumeric grid”.
Figure 2. Example of an alphanumeric grid
Source: MEXK54

27
Mexico-Monitoring of Opium Poppy Cultivation 2014-2015
Map 6. National orthogonal grid of 10 x10 km (100 km2 by segment)
Source: Illicit Crop Monitoring System in the Mexican Territory – supported by UNODC. The boundaries and names shown and the designations used on this map do not imply official endorsement or acceptance by the United Nations.

28
Mexico-Monitoring of Opium Poppy Cultivation 2014-2015
Map 7. Sampling frames (I and II) used to estimate the area (ha) under opium poppy cultivation
7.2. MONITORING ZONES
In Mexico, the vast majority of opium poppy cultivation is located in Sinaloa, Chihuahua, Duran-go, Nayarit, Jalisco, Michoacán, Guerrero and Oaxaca states. They are located along the Pacific Ocean coast, over the strip of the territory formed by the Western Sierra Madre and the Southern Sierra Madre. According to the eradication records reported by Federal Forces in Mexico, these areas have optimal conditions for phenological development of opium poppy crops.
The study area was delimited by mainly using historical eradication data. Once the study area was defined, the sampling frame was set up, that is the environment where the samples were taken. The results found in the selected samples were used to estimate the total area of the phenomenon (area under opium poppy cultivation) in the sampling frame. This means that the results are only representative of the extension covered by the sampling frame.
The initial sampling frame was extended in a second stage with a risk survey. Consequently, two sampling frames were applied: one based on the historical eradication data, and the second based on a statistical model of probabilities by determining factors for illicit crops (risk), as shown in map 7.
Source: Illicit Crop Monitoring System in the Mexican Territory – supported by UNODC. The boundaries and names shown and the designations used on this map do not imply official endorsement or acceptance by the United Nations.

29
Mexico-Monitoring of Opium Poppy Cultivation 2014-2015
7.3. SAMPLING FRAME OF THE HISTORICAL ERADICATION DATA
The historical illicit crop eradication data of the Mexican government for the years 2007-2009 and 20117 were used in the first sampling frame implemented by the monitoring project (map 8). Once the 10 x 10 km orthogonal grid was established, an initial analysis of every parameter estimated over the grid was made, as shown in map 8. This process was carried out with the GIS software (ArcMap) to include the historical eradication data.
In this analysis the cells with and without presence of illicit crops (poppy and cannabis) represent-ed in the eradication data were considered because it was necessary to evaluate the entire con-text of the Mexican territory to understand the patterns and process of this event. If one segment demonstrated eradication more than one time, then it could be selected (one time means at least once per year in both crop cultivation or eradication in two different years). The variables chosen and their parameters were applied to a geographic information system that enables to gather the selected parameters.
7 The year 2010 was excluded due to codification and geo-reference problems in the data.
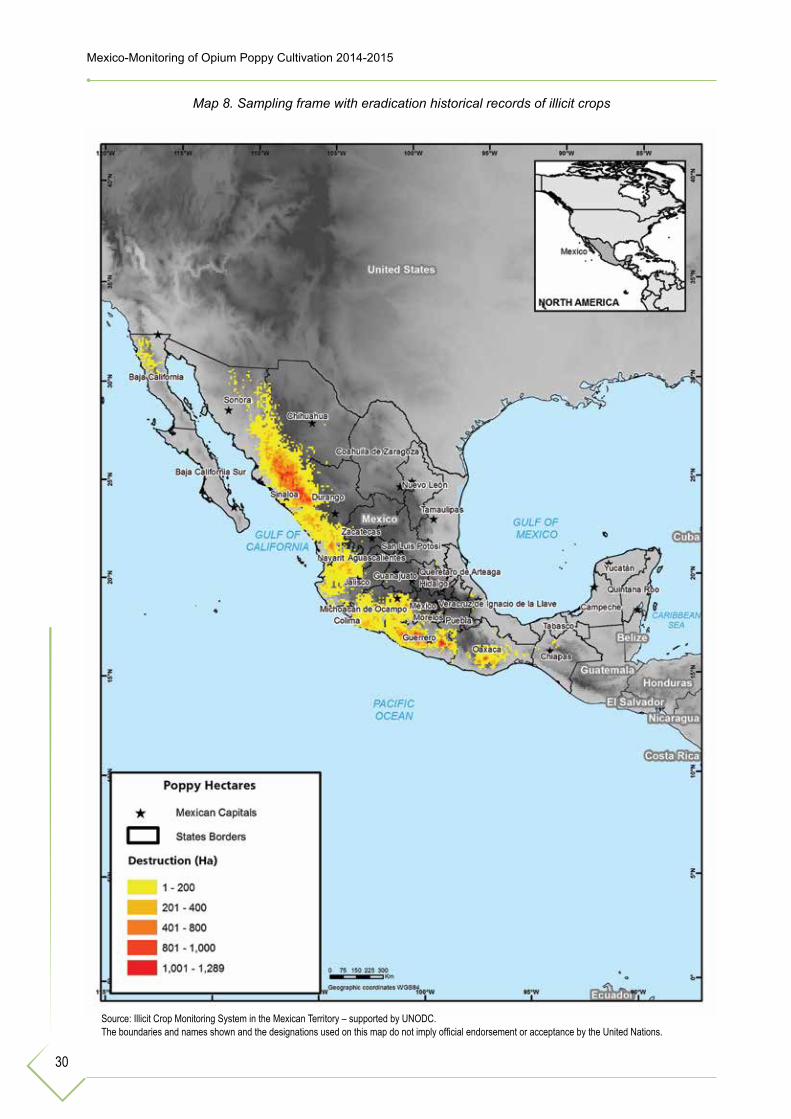
30
Mexico-Monitoring of Opium Poppy Cultivation 2014-2015
Map 8. Sampling frame with eradication historical records of illicit crops
Source: Illicit Crop Monitoring System in the Mexican Territory – supported by UNODC. The boundaries and names shown and the designations used on this map do not imply official endorsement or acceptance by the United Nations.
31
Mexico-Monitoring of Opium Poppy Cultivation 2014-2015
7.4. SAMPLING FRAME OF THE STATISTICAL ANALYSIS OF ILLICIT CROPS PROBABILITIES BY DETERMINING FACTORS
The survey team worked in coordination with the Geography Institute of the National Autonomous University of Mexico (UNAM) to apply a particular methodology describing the techniques to ob-tain, select and classify variables and parameters. This methodology was used to make a territorial analysis of the probable areas under illicit cultivation in Mexico, through a multivariate analysis with a comprehensive criteria where socioeconomic, administrative and physical variables were correlated to determine which of them are able to explain the probability to find illicit crops in the country, as well as their spatial distribution and the collective Mexican State actions aimed at achieving a social and institutional recovery of the territory.
The results show a first approximation of a geographic instrument that helps to detect illicit crops in the Mexican territory. This is the “National Map of Probability /Risk of Determining Factors for Illicit Crops” which classifies the national territory in 5 types according to the probability (very high, high, medium, low, and very low) of the areas to be under opium poppy cultivation.
The analysis were made through three statistical models: with historical eradication data prepared by the federal government; with indicators calculated from socioeconomic data from the National Institute of Statistics and Geography (INEGI); and with physiographic data taken from the data base of the Geography Institute of the UNAM. All the analysis for the integration of the model was carried out with the software “R” (http://www.R-project.org/).
The analysis is described in detail in the Annex I; this document provides some descriptive maps of the variables used which are representative of the phenomenon studied. It is useful for all the analysis made but it focuses on the methodology and results of the “National Map of Probability /Risk of Determining Factors for Illicit Crops”. In addition to the total sample for monitoring, 68 seg-ments were extracted from this survey.
It can be noticed that the area with large historical eradication data is located along the Western Si-erra Madre particularly in the so-called Golden Triangle as well as in Guerrero and Oaxaca where there is the highest probability/risk. The Northern area of the Western Sierra Madre also draws the attention because it has high probability/risk but no significant eradication registered. The same occurs in Chiapas.
Currently a new territorial analysis and the updating of probable areas are being carried out; for this survey, all the crops interpreted during the monitoring project from the beginning until now will be considered as the main input. This survey will enable to detect more specific areas under possible cultivation and elaborate the new “National Map of Probability /Risk of Determining Factors for Illicit Crops” (map 9). These new results should be reflected in the next monitoring surveys.

32
Mexico-Monitoring of Opium Poppy Cultivation 2014-2015
Map 9. National area of illicit crops probability / risk by determining factors
Source: Illicit Crop Monitoring System in the Mexican Territory – supported by UNODC. The boundaries and names shown and the designations used on this map do not imply official endorsement or acceptance by the United Nations.
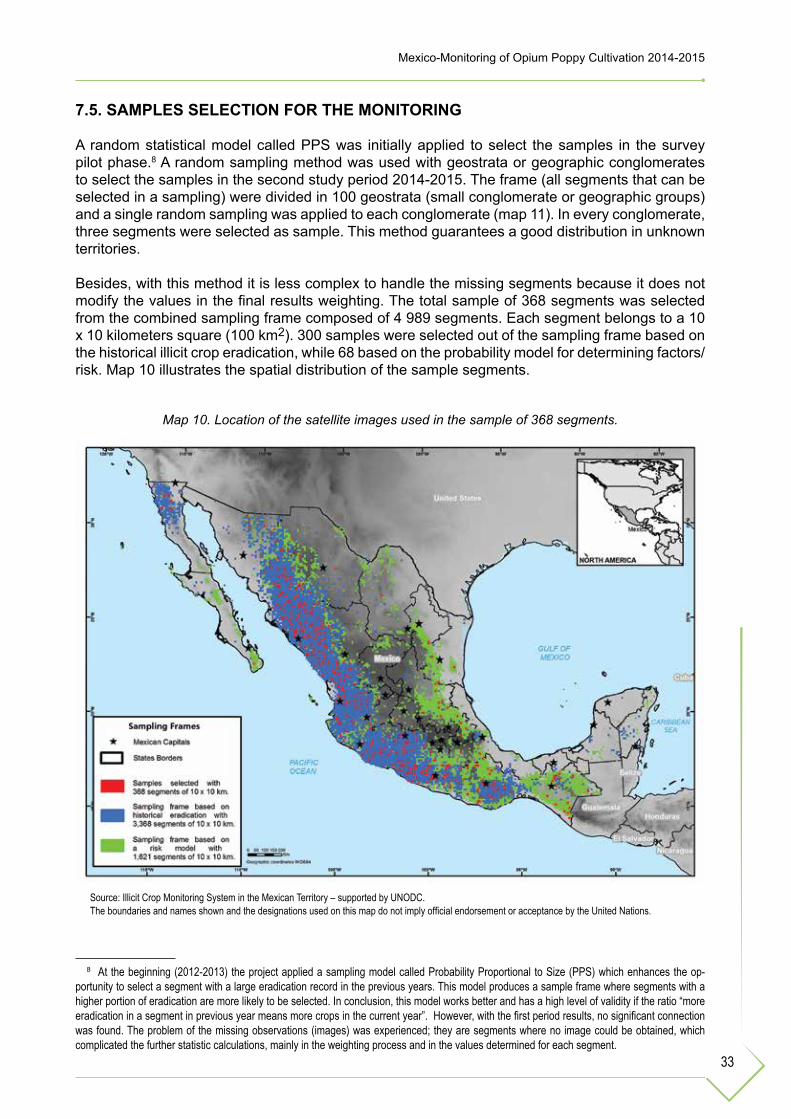
33
Mexico-Monitoring of Opium Poppy Cultivation 2014-2015
Source: Illicit Crop Monitoring System in the Mexican Territory – supported by UNODC. The boundaries and names shown and the designations used on this map do not imply official endorsement or acceptance by the United Nations.
Map 10. Location of the satellite images used in the sample of 368 segments.
7.5. SAMPLES SELECTION FOR THE MONITORING
A random statistical model called PPS was initially applied to select the samples in the survey pilot phase.8 A random sampling method was used with geostrata or geographic conglomerates to select the samples in the second study period 2014-2015. The frame (all segments that can be selected in a sampling) were divided in 100 geostrata (small conglomerate or geographic groups) and a single random sampling was applied to each conglomerate (map 11). In every conglomerate, three segments were selected as sample. This method guarantees a good distribution in unknown territories.
Besides, with this method it is less complex to handle the missing segments because it does not modify the values in the final results weighting. The total sample of 368 segments was selected from the combined sampling frame composed of 4 989 segments. Each segment belongs to a 10 x 10 kilometers square (100 km2). 300 samples were selected out of the sampling frame based on the historical illicit crop eradication, while 68 based on the probability model for determining factors/risk. Map 10 illustrates the spatial distribution of the sample segments.
8 At the beginning (2012-2013) the project applied a sampling model called Probability Proportional to Size (PPS) which enhances the op-portunity to select a segment with a large eradication record in the previous years. This model produces a sample frame where segments with a higher portion of eradication are more likely to be selected. In conclusion, this model works better and has a high level of validity if the ratio “more eradication in a segment in previous year means more crops in the current year”. However, with the first period results, no significant connection was found. The problem of the missing observations (images) was experienced; they are segments where no image could be obtained, which complicated the further statistic calculations, mainly in the weighting process and in the values determined for each segment.

34
Mexico-Monitoring of Opium Poppy Cultivation 2014-2015
Map 11. Distribution of the sampling frame I with 100 geostrata used to obtainthe sample of 300 segments of 10 x 10 km
Source: Illicit Crop Monitoring System in the Mexican Territory – supported by UNODC. The boundaries and names shown and the designations used on this map do not imply official endorsement or acceptance by the United Nations.

35
Mexico-Monitoring of Opium Poppy Cultivation 2014-2015
Picture 7. Example of opium poppy fields identified through World View-2 satellite image
7.6. DATES ANALYSIS TO DETERMINE CROP CALENDARS WITH TIME SERIES OF SATELLITE IMAGES
The Illicit Cultivation Monitoring Programme decided to survey crop calendars in order to deter-mine the timing to acquire images from different remote sensors because it is relevant that the opium poppy crops photointerpretation is done during their maturity stage with the intention to get the proper time in which the crops can be identified from satellite information.
The main objective of the survey is to analyze the opium poppy phenology (growing stages) in the different agricultural and environmental regions. This survey will contribute to understand in a bet-ter way the agricultural cycles and will reduce the acquisition time in future surveys. This analysis is based on historical time series of medium resolution satellite images (Landsat 7 y Landsat 8). The Normalized Difference Vegetation Index (NDVI) was used to search the vegetation development; it is referred to as the mathematic combination of the red band and the near infrared as it is the most sensible indicator of the presence and condition of green vegetation (Mattiuzzi et. al., 2014).
The results of this NDVI survey are preliminary and have been developed in coordination with the University of Natural Resources and Life Sciences, Vienna, Austria (BOKU) by using the data (polygons) of interpreted cultivations obtained by the Project analyst in Mexico with different types of high resolution satellite images (VHR), like SPOT-6, GeoEye-1, Ikonos, World View-2 (picture 7) and validated with aerial photographs taken by experts and analyst of the project. Therefore three testing areas were selected over the national territory.
7.6.1. Test areas for the three regions with Landsat images
For these testing areas, the project identified three major agricultural regions where preliminary agricultural cycles are comparable with those in the North, Center and South zones where the illicit crops were detected. The segments for these three regions were selected on Landsat 7 and Land-sat 8 (NASA 2012) images acquired from October 2012 to March 2014 and downloaded through USGS Earth Explorer application (EARTH EXPLORER 2014). The amount of total available im-ages for the period mentioned was 37 images of 180 x 180 kilometers in 7 different locations, as shown in map 12.
The regular acquisition of Landsat and the availability of free format images over the Mexican terri-tory allow to make time series of images, at least every 16 days. Additionally at the beginning of the survey, testing data obtained with satellite images SPOT-4 and SPOT-5 supplied by the Project were considered but these results only were taken as examples because the time coverage of the available images were too short to get significant results in the vegetation index (NDVI).

36
Mexico-Monitoring of Opium Poppy Cultivation 2014-2015
Map 12. Location of the test areas through satellite images LANDSAT 7 and 8
Source: Illicit Crop Monitoring System in the Mexican Territory – supported by UNODC. The boundaries and names shown and the designations used on this map do not imply official endorsement or acceptance by the United Nations.
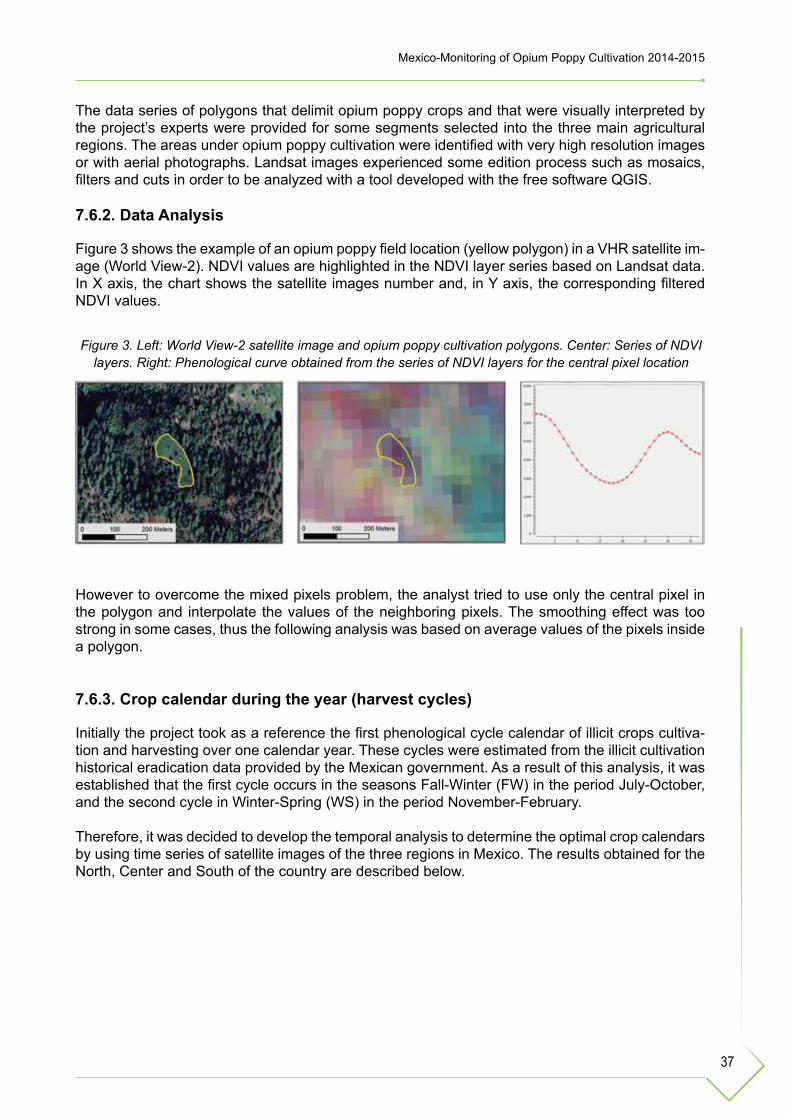
37
Mexico-Monitoring of Opium Poppy Cultivation 2014-2015
Figure 3. Left: World View-2 satellite image and opium poppy cultivation polygons. Center: Series of NDVI layers. Right: Phenological curve obtained from the series of NDVI layers for the central pixel location
The data series of polygons that delimit opium poppy crops and that were visually interpreted by the project’s experts were provided for some segments selected into the three main agricultural regions. The areas under opium poppy cultivation were identified with very high resolution images or with aerial photographs. Landsat images experienced some edition process such as mosaics, filters and cuts in order to be analyzed with a tool developed with the free software QGIS.
7.6.2. Data Analysis
Figure 3 shows the example of an opium poppy field location (yellow polygon) in a VHR satellite im-age (World View-2). NDVI values are highlighted in the NDVI layer series based on Landsat data. In X axis, the chart shows the satellite images number and, in Y axis, the corresponding filtered NDVI values.
However to overcome the mixed pixels problem, the analyst tried to use only the central pixel in the polygon and interpolate the values of the neighboring pixels. The smoothing effect was too strong in some cases, thus the following analysis was based on average values of the pixels inside a polygon.
7.6.3. Crop calendar during the year (harvest cycles)
Initially the project took as a reference the first phenological cycle calendar of illicit crops cultiva-tion and harvesting over one calendar year. These cycles were estimated from the illicit cultivation historical eradication data provided by the Mexican government. As a result of this analysis, it was established that the first cycle occurs in the seasons Fall-Winter (FW) in the period July-October, and the second cycle in Winter-Spring (WS) in the period November-February.
Therefore, it was decided to develop the temporal analysis to determine the optimal crop calendars by using time series of satellite images of the three regions in Mexico. The results obtained for the North, Center and South of the country are described below.

38
Mexico-Monitoring of Opium Poppy Cultivation 2014-2015
Figure 4. Location of the reference data (segments) in the North region
Source: Illicit Crop Monitoring System in the Mexican Territory – supported by UNODC.The boundaries and names shown and the designations used on this map do not imply official endorsement or acceptance by the United Nations.
Chart 2. Phenological curves of opium poppy in the North region
For the North region, data of the detected fields (polygons) were provided in the four test seg-ments, as shown in figure 4.
In chart 2 we can observe that the poppy cultivation is dispersed but the average (blue line) clear-ly shows the peak months between September and October. Another peak cannot be identified, which suggests that poppy was cultivated in a single area.

39
Mexico-Monitoring of Opium Poppy Cultivation 2014-2015
Figure 5. Location of the reference data (segments) in the Centre region
Source: Illicit Crop Monitoring System in the Mexican Territory – supported by UNODC.The boundaries and names shown and the designations used on this map do not imply official endorsement or acceptance by the United Nations.
Chart 3. Phenological curves of opium poppy in the Centre region
In the Centre region, few detected opium poppy crop (polygons) were provided for each of the two test segments (figure 5).
Chart 3 shows the results for poppy fields but the average (blue line) clearly identifies the peak months in August and September. The second peak could have corresponded to the end of March or April. In this peak only some detected cultivation can be observed.

40
Mexico-Monitoring of Opium Poppy Cultivation 2014-2015
Figure 6. Location of the reference data (segments) in the South region
Chart 4. Phenological curves of opium poppy in the South region
To analyze the South region more data of the area under opium poppy cultivation (polygons) were provided with 9 test segments located in the center region of Guerrero State (figure 6). This par-ticular region met the requirements and the number of interpreted crops was enough to complete the NDVI analysis.
In chart 4, we can clearly see two periods of peak months. The highest peak is between July and August, while the second peak (average) goes from the end of December until January; however the peaks of December are very diverse.
Source: Illicit Crop Monitoring System in the Mexican Territory – supported by UNODC.The boundaries and names shown and the designations used on this map do not imply official endorsement or acceptance by the United Nations.

41
Mexico-Monitoring of Opium Poppy Cultivation 2014-2015
7.6.4. First results of the crop calendar analysis
The first calendar was obtained from the first NDVI charts analysis about the illicit crops growth in the three selected regions. The conclusions were drawn with the interpretation experiences ac-quired all along the project monitoring (table 5). In some cases it was difficult to identify the high months in the crop cycles.
This was due to the lower sun altitude in winter where NDVI values are lower and sometimes more difficult to interpret. In summer time, the peak months are more obvious, mainly in the South region; the highest months have the same height in their values. This crop calendar is shown in table 5.
It has to be noticed that to get the peak months in the third period, from March to June 2015, it was necessary to average the higher months of this period with the high incidence dates obtained from historical eradication data provided by the Mexican Federal government and complement them with the detections of previously monitored periods and data collected during the fieldworks of the project.
Table 5. Calendar with the highest NDVI values (average) by region
Region States
Poppy
1st PeriodJuly-October
2014
2nd PeriodNovember
2014-February 2015
*3rd Period March-June 2015
North Sinaloa, Chihuahua and Durango September-October January-February March-April
Centre Nayarit and Jalisco August-September February-March April-May
South Guerrero July-August December-January April-May
* Note: for this period a new punctual NDVI survey validated with detected crops has to be made.
In conclusion, attention must be focused on the input pixels during the time series analysis in or-der to avoid mixed pixels as they can affect the final charts. A common problem in these surveys is the inclusion of very small fields because they require a better resolution to obtain charts with a significant representativeness. Therefore the use of satellite images with finer spatial resolution (between 5 and 10 meters) will improve the results.
The project is carrying out a new NDVI survey to update the first result of the crop calendar for the first and second monitoring period (July-October and November-February) and to determine the peak months of the third period (March-June) more precisely. These new results should be reflect-ed in the next monitoring surveys.

42
Mexico-Monitoring of Opium Poppy Cultivation 2014-2015
7.7. STAGES AND WORKFLOW FOR THE INTERPRETATION OF ILLICIT CROPS IN SATELLITE IMAGES
The methodology developed to interpret the areas under opium poppy cultivation in the Mexican monitoring project is mainly composed of seven stages. The seventh stage is a permanent evalu-ation of the previous stages; it enables the analyst group to detect weaknesses related to applied techniques that must be improved for future surveys. This stage is supported by experts in the field or universities collaborating in the search of new technologies and/or methods that will contribute to improve the current monitoring methodology.
Every applied stage has a series of processes and every stage depends on the previous one to continue the methodology flow cycle. The processes of every stage are explained below:
1. Inputs: request and reception of satellite images, historical search of missing satellite imag-es in the sample, Mexican Continuum of Elevations (CEM), vector data (rivers, highways, water bodies, etc.), national sample of 368 segments of 10 x 10 km.
2. Processes: satellite images correction (orthorectification, sharpening, segments cut, histo-grams enhancing).
3. In-house analysis (office): robust photointerpretation of the areas under opium poppy culti-vations from satellite images, spectral analysis, decision tree for opium poppy fields, use of interpretation keys for opium poppy crops, multitemporal analysis of the images taken with different remote sensors, delimitation of opium poppy cultivation polygons.
4. Field verification: flight plans in the selected 10 x 10 km segments, verification of the digital cameras calibration, installation of metallic platforms in the aircrafts, capture of vertical ae-rial photograph in the10 x 10 km. selected segments, creation of photomosaic.
5. Validation of in-house/field data: photomosaic, historical data base of detections, verifica-tion of areas under opium poppy cultivation between the image and photomosaic, addition of new opium poppy cultivation polygons.
6. Results: creation of a spatial explicit data base (polygons of opium poppy cultivation), ap-plication of the statistical formula to estimate the area (ha), application of correction factors, extrapolation over the sampling frame for the final estimation of area under opium poppy cultivation and calculation of the confidence interval.
7. Process evaluation: search for new tools for the satellite images correction and digital pro-cessing, assistance to implement new interpretation methods (interpretation keys, etc.), accuracy assessment of the photointerpretation and polygons delimitation (crops).
The application of all the methodology stages with their correlated processes is carried out for each of the three monitoring four-month periods. The final estimate of the opium poppy area is referred to 12 months of monitoring and covers from July 2014 to June 2015. The complete flow is displayed in figure 7.

43
Mexico-Monitoring of Opium Poppy Cultivation 2014-2015
Figure 7. Flow chart of the Illicit Crop Monitoring Project in Mexico
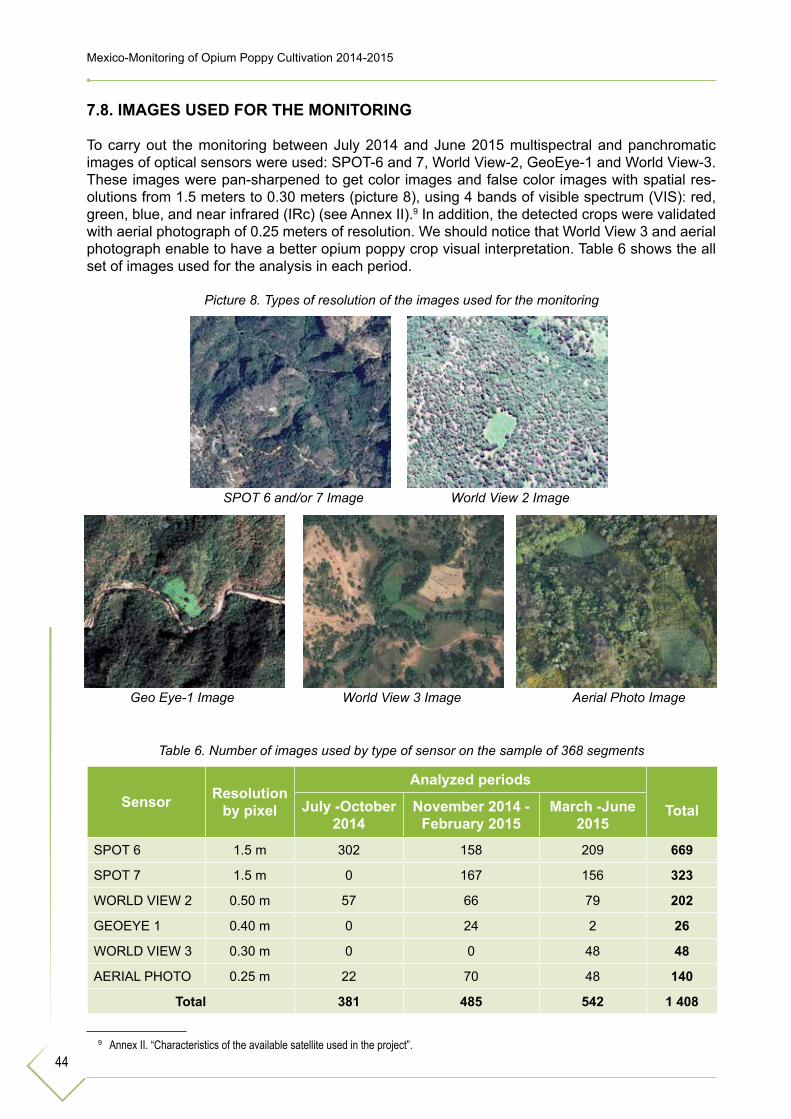
44
Mexico-Monitoring of Opium Poppy Cultivation 2014-2015
7.8. IMAGES USED FOR THE MONITORING
To carry out the monitoring between July 2014 and June 2015 multispectral and panchromatic images of optical sensors were used: SPOT-6 and 7, World View-2, GeoEye-1 and World View-3. These images were pan-sharpened to get color images and false color images with spatial res-olutions from 1.5 meters to 0.30 meters (picture 8), using 4 bands of visible spectrum (VIS): red, green, blue, and near infrared (IRc) (see Annex II).9 In addition, the detected crops were validated with aerial photograph of 0.25 meters of resolution. We should notice that World View 3 and aerial photograph enable to have a better opium poppy crop visual interpretation. Table 6 shows the all set of images used for the analysis in each period.
Table 6. Number of images used by type of sensor on the sample of 368 segments
Sensor Resolution by pixel
Analyzed periods
TotalJuly -October 2014
November 2014 - February 2015
March -June 2015
SPOT 6 1.5 m 302 158 209 669
SPOT 7 1.5 m 0 167 156 323
WORLD VIEW 2 0.50 m 57 66 79 202
GEOEYE 1 0.40 m 0 24 2 26
WORLD VIEW 3 0.30 m 0 0 48 48
AERIAL PHOTO 0.25 m 22 70 48 140
Total 381 485 542 1 408
9 Annex II. “Characteristics of the available satellite used in the project”.
SPOT 6 and/or 7 Image World View 2 Image
Geo Eye-1 Image World View 3 Image Aerial Photo Image
Picture 8. Types of resolution of the images used for the monitoring

45
Mexico-Monitoring of Opium Poppy Cultivation 2014-2015
The optimal period dates10 obtained in the survey “Date analysis to determine crop calendars (NDVI) using time series of satellite images” (NDVI) were used for each segment and period ana-lyzed to collect the most suitable satellite images from July 2014 to June 2015. Likewise, images of different sensors (available for the project) were collected to have the entire sample of 368 seg-ments of 10 x 10 km distributed throughout the country (table 7).
Table 7. Calendar for the collection of satellite images
Capture areas
Periods
July-October2014
November 2014-February 2015 March-June 2015
Sample with 368 segments of 10 x 10 km
High peaks of NDVI survey Average of high
months of the analysis made in the Project.
High peaks of NDVI survey
The total of satellite images and aerial photographs acquired for the period July 2014-June 2015 only covered the high incidence opium poppy cultivation zones into the sampling frames with a total area of 103 100 km2. This area represents 5.22% of the total continental area of Mexico.
7.9. CORRECTION AND IMPROVEMENT PROCESS OF THE SATELLITE IMAGES
The correction process of satellite images used for illicit crop photointerpretation is composed of several stages to obtain a suitable accuracy level and eliminate as much as possible the error margin. Therefore, the analyst has to identify the features and processing level of the way the images are provided by different sources such as: type of sensor, spectral mode, number of spectral bands, spatial and temporal resolution (see Annex III).11
All the images used in the project were geometrically corrected (orthorectified) by using the Mexi-can Continuum of Elevations with a vertical resolution of 15 meters as reference; this process was made with the software ERDAS Imagine v.2013 and/or SOCET GXP v.4x.
The complete flow to correct satellite images includes the following stages: orthorectify each spec-tral mode (panchromatic and multispectral), pansharpen both spectral modes, cut the image to adapt it at the sample size (10 x 10 km) and fix the contrasts and histograms. Finally, The GIS software interphase ArcGis v.10.2. was used to photo-interpret the areas under opium poppy cul-tivations.
10 When the opium poppy cultivations experience their optimal phenological period (growth), the highest peak between sowing and harvesting is the better time to observe and interpret the crops in satellite images and aerial photograph.
11 Annex III. “Description of passive sensor and/or optical satellites”.

46
Mexico-Monitoring of Opium Poppy Cultivation 2014-2015
7.9.1 Software for image processing
The monitoring project uses several commercial software to process, correct and analyze satellite images. Every application is used for a particular process which is previously established in the methodology applied. These programs are:
a. ArcGis: Software applied to the Geographic Information System (GIS) in order to digitize the crop polygons interpreted for each study period over the images and photomosaics.
b. Erdas Imagine: Remote sensing software used in the processing, histograms enhance-
ment and digital correction (orthorectification) of satellite images. c. Global Mapper: Software applied to the Geographic Information Systems (GIS). It is used
to create flight plans and draw the flights lines that will be uploaded into the aerial GPS and that will be used to take aerial photographs in the field.
d. Pix4D Mapper: Software used for photogrammetry and LIDAR data management, as well
as for the processing and digital correction of aerial photographs collected during the field-work to produce photomosaic.
e. R-Statistics: Software used for statistical analysis and calculation of area under opium
poppy cultivation. f. SOCET GXP: Remote sensing and analysis software where the processes made in ER-
DAS software are automated, which streamlines the times to correct and analyze the satel-lite images.
7.9.2. Mexican Continuum of Elevations
The Mexican Continuum of Elevations 3.0 (CEM 3.0) was used to orthorectify satellite images. This is a product generated by the National Institute of Statistics and Geography (INEGI) and rep-resents the elevation over the Mexican continental territory (map 13) through values that indicate specific points in the ground surface correlated with particular geographic locations identified with “x” and “y”, where the values representing the elevations (z) are integrated. Points are regularly spatially distributed.
In 2012 the version 3.0 of CEM whose main feature is a 15-meter resolution (previous versions had 30 meter of resolution) was released. This feature provides a product with better details which is therefore more reliable to support many tasks. This version was available on the market in 2013. The CEM features are described in table 8.

47
Mexico-Monitoring of Opium Poppy Cultivation 2014-2015
Table 8. Characteristics of the CEM used to correct the satellite images
Characteristics Description
Release year 2013
Resolution 15 m x 15 m
Z Values Positive and negative integers
Z Units Meters
Geodetic reference data The datum belongs to ITRF92, era 1988.0, ellipsoid GRS80, and geographic coordinates.
Geographic coverage Mexican continental territory
Mean square error 4.9 m
Distribution channels Mainly on the internet, on the INEGI website. There are some options.
Distribution formatBand Intertwined by Line (BIL). Raster form for the total down-load of the territory or by state. Tagged Image File Format for the download by area and map respectively.
Software used for its development ArcGis 10.1

48
Mexico-Monitoring of Opium Poppy Cultivation 2014-2015
Map 13. Mexican Continuum of Elevations (CEM) model
Source: Illicit Crops Monitoring System in the Mexican Territory – supported by UNODC. The boundaries and names shown and the designations used on this map do not imply official endorsement or acceptance by the United Nations.
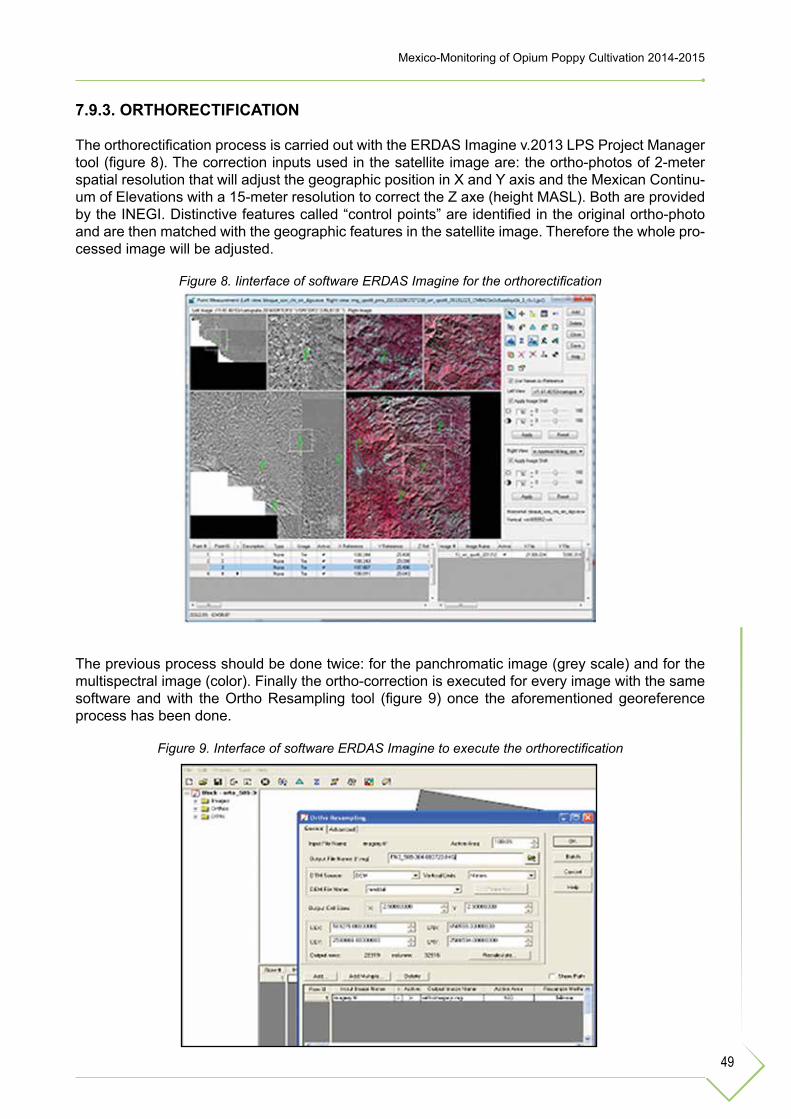
49
Mexico-Monitoring of Opium Poppy Cultivation 2014-2015
Figure 8. Iinterface of software ERDAS Imagine for the orthorectification
Figure 9. Interface of software ERDAS Imagine to execute the orthorectification
7.9.3. ORTHORECTIFICATION
The orthorectification process is carried out with the ERDAS Imagine v.2013 LPS Project Manager tool (figure 8). The correction inputs used in the satellite image are: the ortho-photos of 2-meter spatial resolution that will adjust the geographic position in X and Y axis and the Mexican Continu-um of Elevations with a 15-meter resolution to correct the Z axe (height MASL). Both are provided by the INEGI. Distinctive features called “control points” are identified in the original ortho-photo and are then matched with the geographic features in the satellite image. Therefore the whole pro-cessed image will be adjusted.
The previous process should be done twice: for the panchromatic image (grey scale) and for the multispectral image (color). Finally the ortho-correction is executed for every image with the same software and with the Ortho Resampling tool (figure 9) once the aforementioned georeference process has been done.

50
Mexico-Monitoring of Opium Poppy Cultivation 2014-2015
Figure 10. Interface of software Socet GXP for the orthorectification
Figure 11. Interface of software ERDAS Imagine used to merge images
Another way to make the orthorectification process is by using the Socet GXP ver. 4.x software that enables to get a quicker final result than ERDAS Imagine because the Socet process is automatic and can display CEM from its own menu. Any image can be displayed to georeference it automat-ically and can additionally be analyzed in its own display, as shown in figure 10.
In Socet GXP, it is posible to make the orthorectification process and save the file of the new cor-rected image with the Orthorectify tool.
7.9.4. Pansharpening
This process consists of uniting panchromatic and multispectral images, resulting in a color im-age with a panchromatic image resolution (the best resolution). The ERDAS Imagine v.2013 soft-ware is used with the Subtractive Resolution Merge tool (figure 11) to introduce the multispectral image (MS) and the panchromatic image (Pan) to finally assign a new name and an output format for the image.
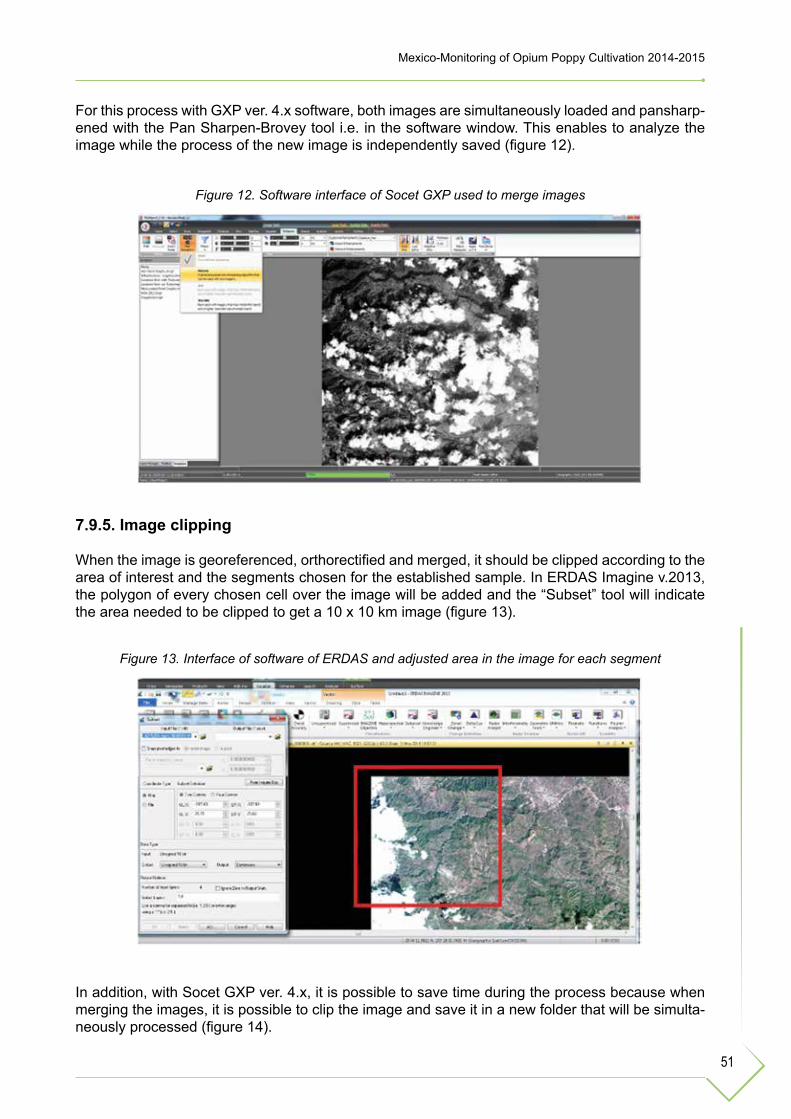
51
Mexico-Monitoring of Opium Poppy Cultivation 2014-2015
Figure 12. Software interface of Socet GXP used to merge images
Figure 13. Interface of software of ERDAS and adjusted area in the image for each segment
For this process with GXP ver. 4.x software, both images are simultaneously loaded and pansharp-ened with the Pan Sharpen-Brovey tool i.e. in the software window. This enables to analyze the image while the process of the new image is independently saved (figure 12).
7.9.5. Image clipping
When the image is georeferenced, orthorectified and merged, it should be clipped according to the area of interest and the segments chosen for the established sample. In ERDAS Imagine v.2013, the polygon of every chosen cell over the image will be added and the “Subset” tool will indicate the area needed to be clipped to get a 10 x 10 km image (figure 13).
In addition, with Socet GXP ver. 4.x, it is possible to save time during the process because when merging the images, it is possible to clip the image and save it in a new folder that will be simulta-neously processed (figure 14).
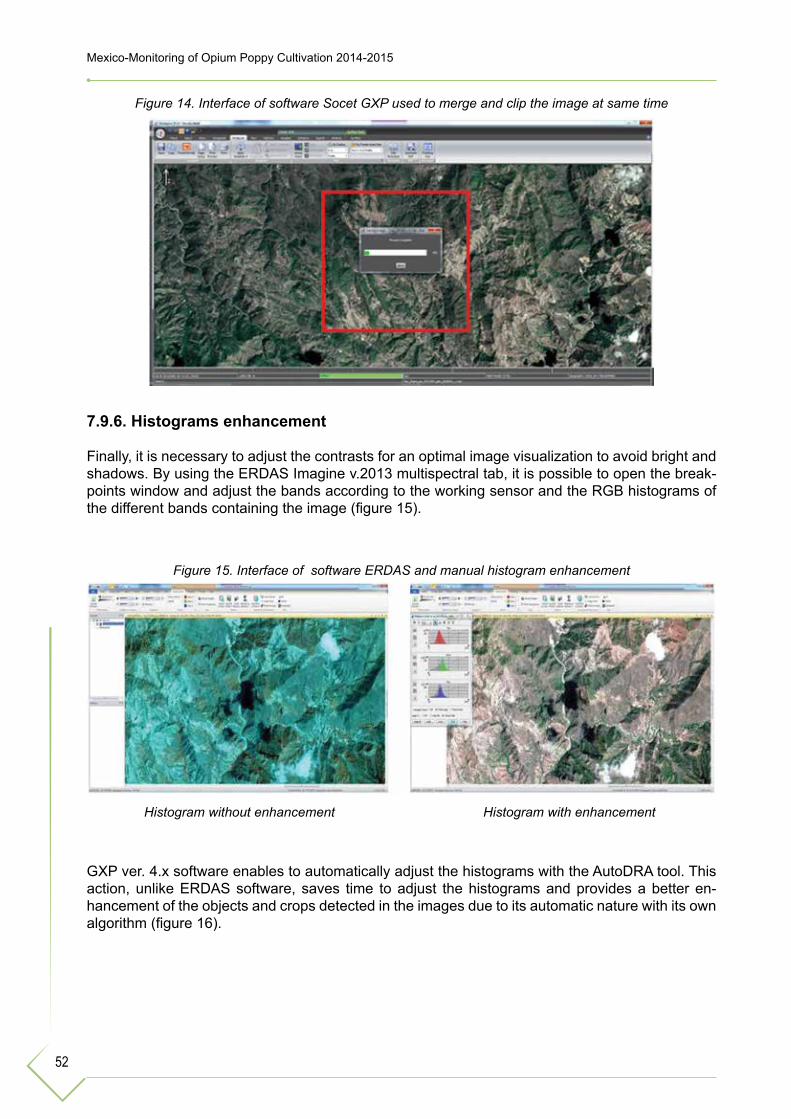
52
Mexico-Monitoring of Opium Poppy Cultivation 2014-2015
Figure 14. Interface of software Socet GXP used to merge and clip the image at same time
Figure 15. Interface of software ERDAS and manual histogram enhancement
Histogram without enhancement Histogram with enhancement
7.9.6. Histograms enhancement
Finally, it is necessary to adjust the contrasts for an optimal image visualization to avoid bright and shadows. By using the ERDAS Imagine v.2013 multispectral tab, it is possible to open the break-points window and adjust the bands according to the working sensor and the RGB histograms of the different bands containing the image (figure 15).
GXP ver. 4.x software enables to automatically adjust the histograms with the AutoDRA tool. This action, unlike ERDAS software, saves time to adjust the histograms and provides a better en-hancement of the objects and crops detected in the images due to its automatic nature with its own algorithm (figure 16).
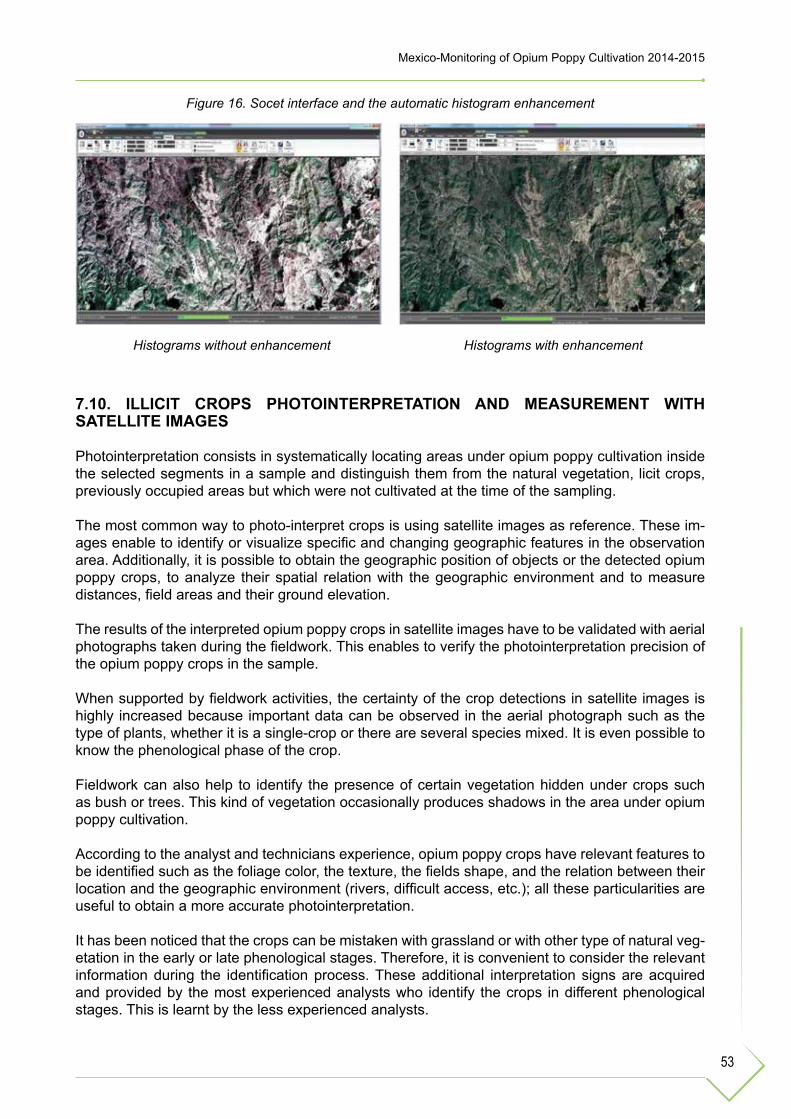
53
Mexico-Monitoring of Opium Poppy Cultivation 2014-2015
Figure 16. Socet interface and the automatic histogram enhancement
Histograms without enhancement Histograms with enhancement
7.10. ILLICIT CROPS PHOTOINTERPRETATION AND MEASUREMENT WITH SATELLITE IMAGES
Photointerpretation consists in systematically locating areas under opium poppy cultivation inside the selected segments in a sample and distinguish them from the natural vegetation, licit crops, previously occupied areas but which were not cultivated at the time of the sampling.
The most common way to photo-interpret crops is using satellite images as reference. These im-ages enable to identify or visualize specific and changing geographic features in the observation area. Additionally, it is possible to obtain the geographic position of objects or the detected opium poppy crops, to analyze their spatial relation with the geographic environment and to measure distances, field areas and their ground elevation.
The results of the interpreted opium poppy crops in satellite images have to be validated with aerial photographs taken during the fieldwork. This enables to verify the photointerpretation precision of the opium poppy crops in the sample.
When supported by fieldwork activities, the certainty of the crop detections in satellite images is highly increased because important data can be observed in the aerial photograph such as the type of plants, whether it is a single-crop or there are several species mixed. It is even possible to know the phenological phase of the crop.
Fieldwork can also help to identify the presence of certain vegetation hidden under crops such as bush or trees. This kind of vegetation occasionally produces shadows in the area under opium poppy cultivation.
According to the analyst and technicians experience, opium poppy crops have relevant features to be identified such as the foliage color, the texture, the fields shape, and the relation between their location and the geographic environment (rivers, difficult access, etc.); all these particularities are useful to obtain a more accurate photointerpretation.
It has been noticed that the crops can be mistaken with grassland or with other type of natural veg-etation in the early or late phenological stages. Therefore, it is convenient to consider the relevant information during the identification process. These additional interpretation signs are acquired and provided by the most experienced analysts who identify the crops in different phenological stages. This is learnt by the less experienced analysts.

54
Mexico-Monitoring of Opium Poppy Cultivation 2014-2015
Picture 9. Photointerpretation of opium poppy crops in Geo Eye-1 (VHR) image
2D visualization
Consequently, a relevant role of the senior analysts is to transfer their knowledge to the junior analysts whose training is completed through frequent visits to the areas under opium poppy cul-tivation.
Each analyst has additional methods to photo-interpret opium poppy crops in satellite images or aerial photos such as the “Robust workflow for photointerpretation of opium poppy crops in satellite images, decision tree for opium poppy crops and interpretation keys for opium poppy crop”. These methods will be explained in the next chapters (7.10.1 to 7.10.3).
The visual photointerpretation of opium poppy crops is also made in 2D and 3D satellite images; this enables the analyst to have a better perspective about the shape, slope, orientation of the hills, and features of the geographic environment where the crops are cultivated, thereby achieving a more accurate interpretation even if this requires additional work and time to analyze satellite im-ages or aerial photographs (picture 9).
On the other side, it has been noticed that not all the fields are sowed to produce opium poppy every four months and that some of them are abandoned during one or two years. Every year new opium poppy areas emerge and some of these fields are not entirely sowed to produce opium poppy.

55
Mexico-Monitoring of Opium Poppy Cultivation 2014-2015
3D visualization
Regarding the measurement, opium poppy cultivation fields are delineated with polygons in a geo-graphic information system (GIS) and immediately gives data about the interpretation date (image capture), the geographic location, the type of crop, the perimeter and area (ha). Then every opium poppy crop information will be used during the statistical analysis to estimate the whole country’s area under opium poppy cultivation.
It should be mentioned that the analyst and technicians share standardized criteria to delimit the areas and avoid an overestimate or underestimate when calculating the total area under opium poppy cultivation. The standardization of these criteria is constantly used as part of the method-ology. There are images where crops are detected with a concealment percentage due to the presence of clouds or shadows or there are crops that only have a fraction of the field cultivated at the time the image was taken. For these cases, images with different acquisition dates are used to come to a correct crop photointerpretation.

56
Mexico-Monitoring of Opium Poppy Cultivation 2014-2015
Figure 17. Robust workflow to photo-interpret satellite images
7.10.1. Robust workflow to photo-interpret poppy crops in satellite images
The group composed of ten analysts implemented a robust workflow and exchange of analyzed images in order to photo-interpret the opium poppy crops (figure 17). This robust workflow reduces each analyst’s subjectivity during the photointerpretation analysis.
To accomplish the established robust workflow, the analyst group has to consider the following:
1. A first revision called “R1” is made on the available images by the first group of four analysts (1, 2, 3 y 4).
2. The results of “R1” are exchanged with the second group of analysts (5, 6, 7 and 8) and a sec-ond revision called “R2” is made by taking the interpreted cultivations in R1 as a reference.
3. With the mixed cultivation R1 + R2; a final revision called “Final R” is carried out by supervisors (1 and 2) who are the final filter due to their greater experience.
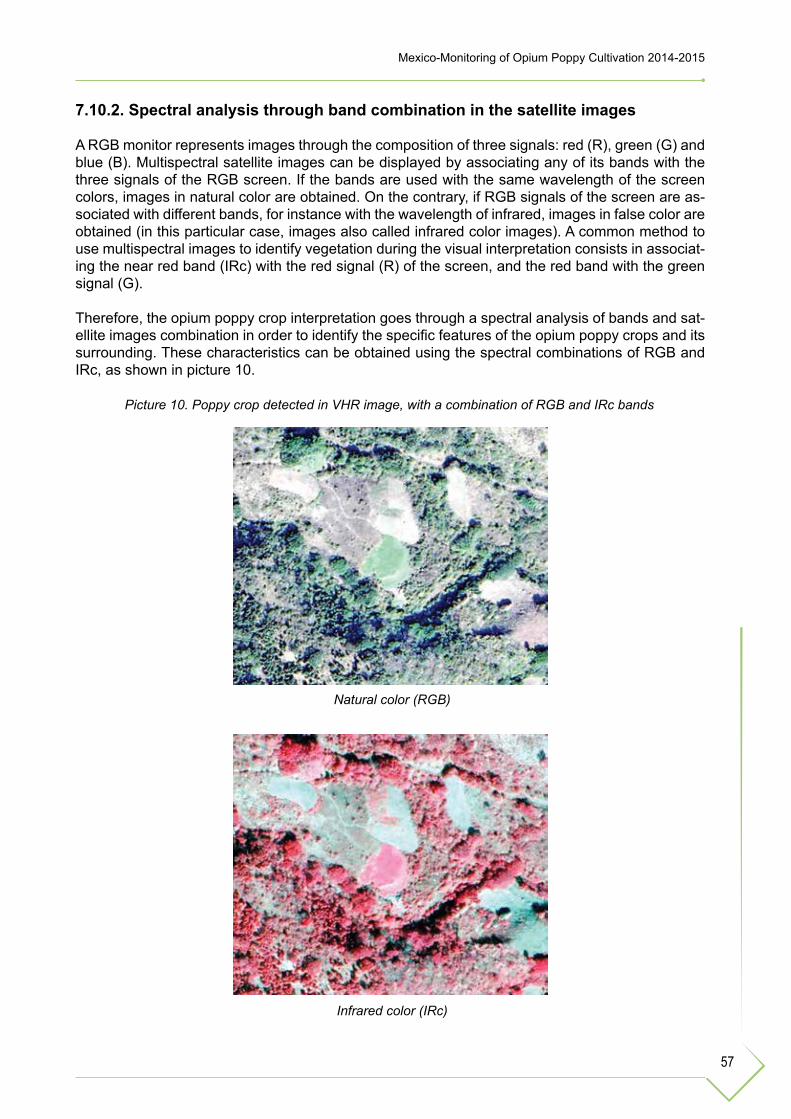
57
Mexico-Monitoring of Opium Poppy Cultivation 2014-2015
Picture 10. Poppy crop detected in VHR image, with a combination of RGB and IRc bands
Natural color (RGB)
Infrared color (IRc)
7.10.2. Spectral analysis through band combination in the satellite images
A RGB monitor represents images through the composition of three signals: red (R), green (G) and blue (B). Multispectral satellite images can be displayed by associating any of its bands with the three signals of the RGB screen. If the bands are used with the same wavelength of the screen colors, images in natural color are obtained. On the contrary, if RGB signals of the screen are as-sociated with different bands, for instance with the wavelength of infrared, images in false color are obtained (in this particular case, images also called infrared color images). A common method to use multispectral images to identify vegetation during the visual interpretation consists in associat-ing the near red band (IRc) with the red signal (R) of the screen, and the red band with the green signal (G).
Therefore, the opium poppy crop interpretation goes through a spectral analysis of bands and sat-ellite images combination in order to identify the specific features of the opium poppy crops and its surrounding. These characteristics can be obtained using the spectral combinations of RGB and IRc, as shown in picture 10.

58
Mexico-Monitoring of Opium Poppy Cultivation 2014-2015
Figure 18. Decision tree flow chart to determine opium poppy crops
7.10.3. Decision tree for opium poppy crops
One of the methods and criteria used by the project’s analysts group is a “Decision tree for opium poppy crops”. During the photointerpretation, the objective of this method is to verify through four mainly criteria if the analyzed cultivation “Is/Is not” an opium poppy crop; these criteria are:
1. tone/color,2. texture,3. shape4. geographic environment where the crops are found
The analysis process has been standardized by the analyst group on the basis of the experience achieved during the in-house and fieldwork. Thus opium poppy crops are detected in the satellite images and aerial photographs (figure 18). Opium poppy crops and their characteristics are inputs used to create interpretation keys (more details in next chapter); these keys are kept in a library organized for the three major regions in country (North, Center and South).

59
Mexico-Monitoring of Opium Poppy Cultivation 2014-2015
Figure 19. Example of an interpretation key for opium poppy cultivation
Source: MEXK54
7.10.4. Interpretation keys and their use to detect opium poppy crops
The main objective of the “Interpretation keys” elaboration is to make the remote perception opium poppy cultivation photointerpretation as objective and transparent as possible by standardizing the analyst group knowledge and experience and using a logical system that standardizes the interpre-tations results. It should be mentioned that those keys are supported by the information obtained from the “Decision tree for opium poppy crops”. However the keys have more detailed information about: region, state, municipality, town or city, geographic coordinates of the field, shape of the opium poppy cultivation, sensor used, extension in hectares, phenological stage, observations, among other data; such information contributes to strengthen the interpretation of all the categories of crops, additionally particular features of the satellite images and field photographs at different visualization scales are included (figure 19).
“Interpretation keys” are an important tool to analyze illicit crops and their locations; satellite im-ages and aerial photographs are used as a main input to create them. The keys are useful guides to identify and describe the interpreted objects in a homogeneous way by the group analysts. The monitoring survey has created and used these keys to identify opium poppy crops.

60
Mexico-Monitoring of Opium Poppy Cultivation 2014-2015
Figure 20. Time scheme used between the analysis periods
7.10.5. Multitemporal analysis with remote sensors
For each period, it is possible to obtain satellite images of the sample segments of the monitoring areas established with different acquisition dates and types of sensor; vertical aerial photographs of the same segments are acquired.
These images are the inputs used to make a multitemporal analysis, that is, the revision/detection of areas under opium poppy cultivation in images taken at different dates; this enables to make an accurate comparison and discrimination of the duplicated crops between the satellite images and/or aerial photographs.
The analyst group has established a “timing” criteria between the analyzed periods (detected crops) with a difference of at least 50 days between the collect date for the available images (fig-ure 20) to carry out this type of analysis between the three study periods and avoid detecting the same opium poppy crops located on a same field and the possible growth stages. The following information is considered:
• To analyze period 1: July-October 2014, the project’s historical detection data base for the period September 2012-February 2013 was used.
• To analyze the period 2: November 2014-February 2015, the detections obtained in period 1 were considered.
• To analyze period 3: March-June 2015, the detections obtained in period 2 were consid-ered.
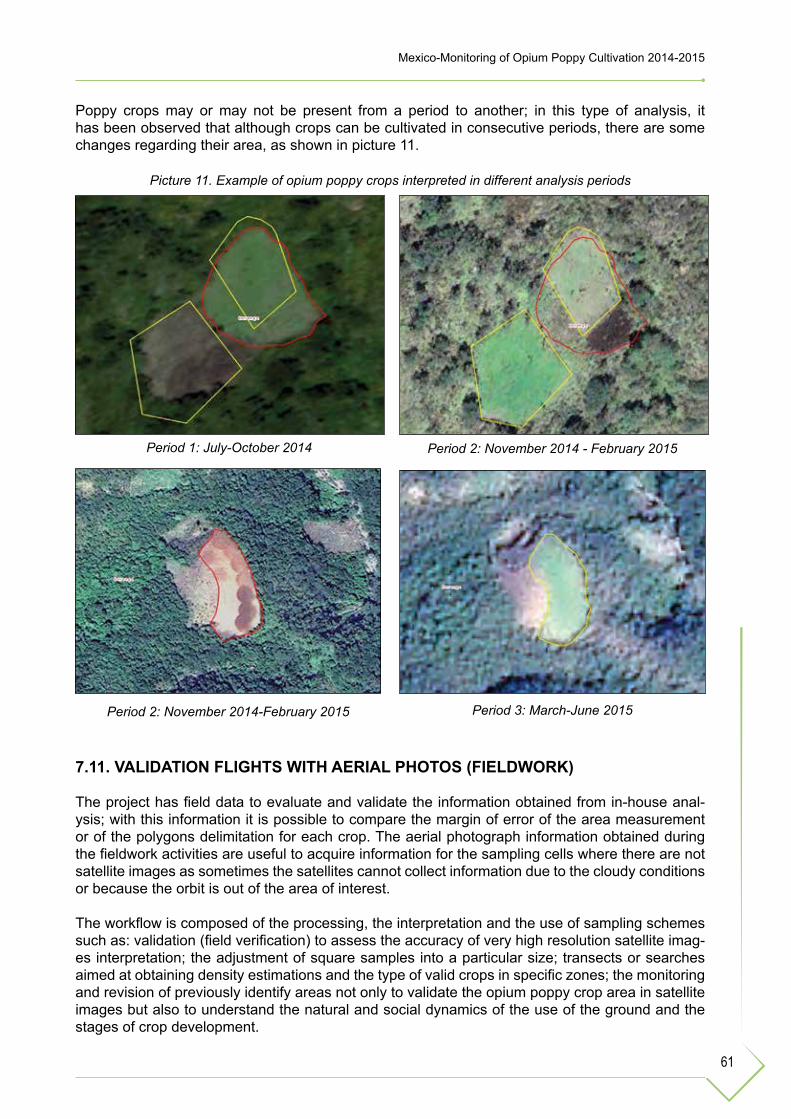
61
Mexico-Monitoring of Opium Poppy Cultivation 2014-2015
Period 2: November 2014-February 2015 Period 3: March-June 2015
Picture 11. Example of opium poppy crops interpreted in different analysis periods
Period 1: July-October 2014 Period 2: November 2014 - February 2015
Poppy crops may or may not be present from a period to another; in this type of analysis, it has been observed that although crops can be cultivated in consecutive periods, there are some changes regarding their area, as shown in picture 11.
7.11. VALIDATION FLIGHTS WITH AERIAL PHOTOS (FIELDWORK)
The project has field data to evaluate and validate the information obtained from in-house anal-ysis; with this information it is possible to compare the margin of error of the area measurement or of the polygons delimitation for each crop. The aerial photograph information obtained during the fieldwork activities are useful to acquire information for the sampling cells where there are not satellite images as sometimes the satellites cannot collect information due to the cloudy conditions or because the orbit is out of the area of interest.
The workflow is composed of the processing, the interpretation and the use of sampling schemes such as: validation (field verification) to assess the accuracy of very high resolution satellite imag-es interpretation; the adjustment of square samples into a particular size; transects or searches aimed at obtaining density estimations and the type of valid crops in specific zones; the monitoring and revision of previously identify areas not only to validate the opium poppy crop area in satellite images but also to understand the natural and social dynamics of the use of the ground and the stages of crop development.

62
Mexico-Monitoring of Opium Poppy Cultivation 2014-2015
Figure 21. Example of the distribution of the equipment used in helicopter for fieldwork
Source: MEXK54
7.11.1. Small-format digital camera with visible infrared sensor used during the flights of aerial photograph
The vertical aerial photograph survey is carried out by using a small-format reflex digital camera with a resolution of 36.8 million of pixels in visible spectrum (VIS), with a spectrum range of 400 to 750 nm and for the near infrared spectrum (IRc) with a spectrum range from 800 to 1 100 nm. The infrared sensor of this camera has a complete conversion function to get images with the same features as the visible one.
The sensor modification also contributes to extend its sensibility to ultraviolet. This type of spec-trum could also be used for forensic purpose because removing the infrared filter makes the cam-era capture the entire spectrum from ultraviolet to the aforementioned IRc zone. However, the reason to remove the sensor of the modified camera is to take aerial photographs to identify some crops in the near infrared spectrum.
Additionally, a filter which totally eliminates the ultraviolet and visible spectrums is inserted in front of the 35 mm lens. The technical specifications of the camera are shown in table 9.

63
Mexico-Monitoring of Opium Poppy Cultivation 2014-2015
Picture 12. A) Visible image (RGB). B) Near infrared image (IRc) y C) Composite image in false color, formed by the combination of visible and near infrared bands.
Table 9. Characteristics of the reflex digital camera
Description Characteristics
Color depth Color 36 bits
Type of sensor CMOS
Total of pixels 36.8 millions of total pixels
Effective resolution of sensor 36.3 millions of pixels
Sensor size 35.9 mm x 24 mm
Frame coverage (regarding to a 35 mm. negative) 1.0 Full frame
Light sensibility
ISO 100 -6400Lo-1 (ISO 50)Hi-1 (ISO 12 800)Hi-2 (ISO 25 600)
Image processor EXPEED 3
Special effects Neutral, vivid, monochrome
Maximum shutter speed 1/8000 sec.
Minimum shutter speed 30 sec.
GPS Unit GPS GP-1.
The photographs obtained with both cameras (VIS and IRc) are simultaneously taken in order to achieve visible images that match with infrared ones. This process makes possible the union between the bands of visible and near infrared spectrums in a single image file where the pixel coincide; this enables to classify different types of vegetation in the image. Aerial photograph can also be visualized in false color or it is possible to make different combinations according to the geographic features of interest supporting the opium poppy crops photointerpretation (picture 12).

64
Mexico-Monitoring of Opium Poppy Cultivation 2014-2015
Picture 13.Sensors comparison with calibration adjustments
Sensor without calibration (pixelated) Sensor with calibration (soft image)
7.11.2. Sensor calibration of the digital camera
The sensor calibration of the digital cameras is useful to take photographs and exploit all the cam-era technical capacities at the heights where photogrammetric flights are carried out. These elec-tronic sensors are very stable and do not significantly modify their geometry when experiencing temperature changes and vibration.
Generally, these sensors are firmly installed during their manufacture, thus it is not required to insert them into the body of the camera with micrometric precision. On the other hand, for pho-togrammetric purposes, it should be considered that the displacement of some pixels affect the orthocorrection quality and can cause wrong measurements in the photomosaics.
If we consider that a pixel has a physical dimension of approximately 5 microns per side, minimum changes in the sensor position have significant effects on the final quality. However, it is possible to determine their position regarding the optical axe of the lens under a mathematic model that give an optimal and very precise result. This process is the sensor calibration of the camera.
In general, digital cameras sensors can lose this calibration due to the use of interchangeable lenses or because the sensor installation is not rigid. Consequently, the geometric configuration of the electro-optical system may vary between the lens and the sensor position. This can be caused by temperature changes, vibration, lens mounting flange wear (thread or bayonet), and by other factors.
Thus it is very important to check the photographs visual quality before every fieldwork to preserve the same calibrations or to make the necessary calibrations to come to a good result. The next picture shows an example with and without calibrated sensors (see picture 13).

65
Mexico-Monitoring of Opium Poppy Cultivation 2014-2015
Picture 14. Intervalometer used in fieldwork
On the other hand, cameras specifically built for aerial photogrametric purpose have the same sensors than commercial ones, generally between 30 and 60 millions of pixels, but are installed in more rigid bodies calibrated with high precision. Some of them have several sensors or groups of two or more individual cameras whose images are digitally merged. These sensors are highly precise equipment and are sold with a calibration certificate provided by the manufacturer. For an optimal use, it is necessary to have it periodically readjusted and recalibrated. This is not neces-sary for the digital cameras used in the project as they do not include this type of certificate.
The aerial photogrammetric sensors are used to accomplish specific tasks or get products such as land registry, layout of roads or energy lines, and sometimes for official high precision cartography. To get high quality products (as those recently mentioned), it is required to follow parameters spec-ified in the calibration certificate describing the camera internal orientation which includes:
• Lens focal length• The main point of the camera (position of the optical axis in the sensor)• Lens radial distortion
The digital cameras sensors used in the survey can be calibrated by measuring the differences between the image projection to any distant object focused. Those details can be identified and measured in three dimensions as well as the position of the same pixels in the matrix of the result-ing digital image. In addition, aerial photographs can be used for the zone observed whose precise geographic location of the pixels in X, Y and Z of the ground features are known. Therefore it is possible to determine the differences and deformations produced by the optical axis displacement and the radial distortion of the lens used.
7.11.3. Intervalometer functionality
The intervalometer is an equipment used to take photos from one or more digital cameras at a spe-cific time; usually the time interval is measured in seconds (picture 14). In this case, the equipment is mainly used to collect aerial photographs during fieldwork. Cameras should point downwards, vertically, in the structure previously installed for this purpose. These cameras are simultaneously controlled by the intervalometer and successively take photographs which will have an overlap between each other depending on the time interval used.

66
Mexico-Monitoring of Opium Poppy Cultivation 2014-2015
The overlap is a relevant factor to be considered because it results in a correct air photo triangu-lation to make orthophotos, photomosaics and elevations models. This project uses the program Pix4D Mapper. This software requires at least a 60% overlap between the photos; however if the photograph has an 80% overlap the results will be more accurate. Thus, it is important to use the triggering interval calculated before the flight and to adjust it according to the aircraft speed over the ground.
The intervalometer implemented in the monitoring project has been designed by the Geography In-stitute of the UNAM. It has an integrated circuit which can deliver an electric pulse with output char-acteristics used as reference at the time when digital cameras are used to acquire the coordinate data of the aerial GPS receptor and synchronize the geographic location of the photographs taken. The intervalometer rheostat12 is used to set an interval value of the initial time and make adjust-ments to conserve the overlap of the selected photographs. It is necessary to familiarize oneself with the rheostat position and its relation with the triggering time in case of headwind and tailwind. As shown in table 10, approximately each spin adds four seconds.
Table 10. Ratio of number of spins and number of shots per second
Number of spins (rheostat)
Seconds (approximately)
0 1
1 5
2 9
3 13
4 17
5 21
6 25
7 29
8 33
9 37
Until 10 41
7.11.4. Digital aerial photograph geoposition
Knowing the aerial photography geoposition, i.e. the camera and aircraft spatial position at the shooting time is relevant to analyze opium poppy crops. This geopositioning is defined by their hori-zontal geographic coordinates (x and y) and their height (z) and they are required to carry out some essential functions after the flight. For instance, it enables to quickly obtain its geopositioning, veri-fy the mapping coverage of all the collected aerial photographs and create a digital photo-index as a reference of the areas included in the analysis.
Georeference is obtained from aerial GPS receptors that internally register the complete aircraft route metadata and also send this information to cameras in NMEA-0183 format.
12 Electric composite used to adjust the current intensity without opening the circuit; it is formed by an electric resistance with electric pulses that can be voluntarily changed.
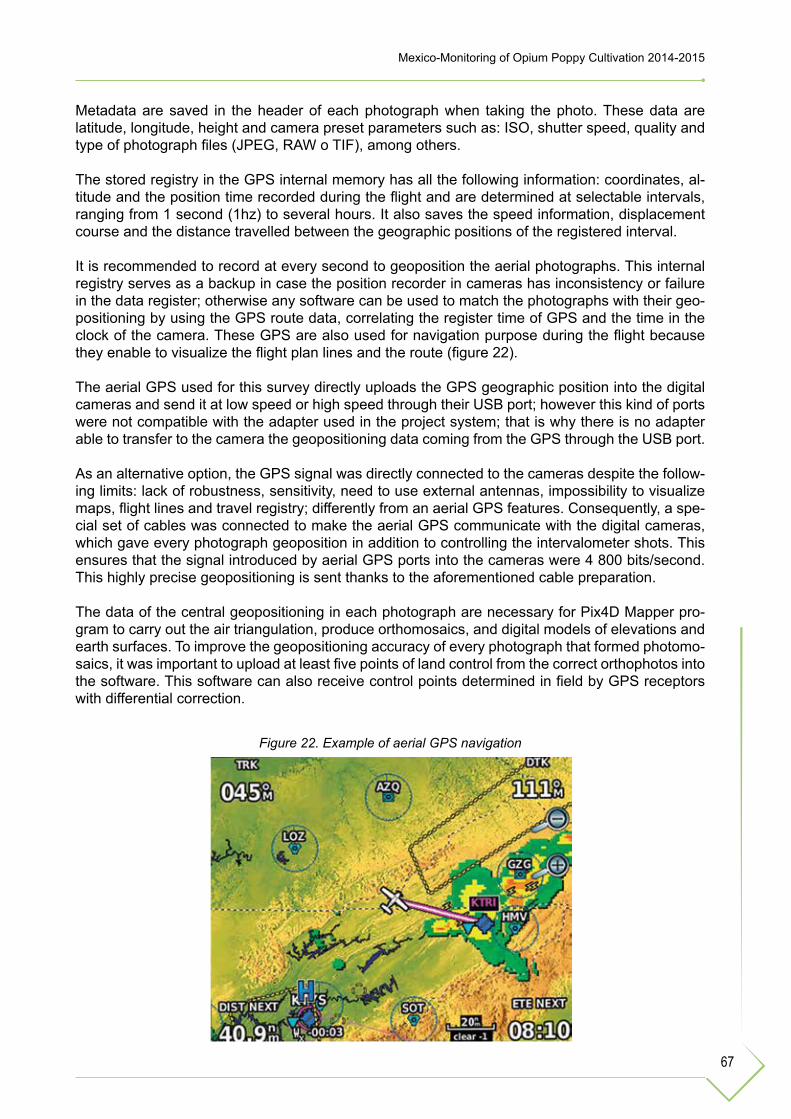
67
Mexico-Monitoring of Opium Poppy Cultivation 2014-2015
Figure 22. Example of aerial GPS navigation
Metadata are saved in the header of each photograph when taking the photo. These data are latitude, longitude, height and camera preset parameters such as: ISO, shutter speed, quality and type of photograph files (JPEG, RAW o TIF), among others.
The stored registry in the GPS internal memory has all the following information: coordinates, al-titude and the position time recorded during the flight and are determined at selectable intervals, ranging from 1 second (1hz) to several hours. It also saves the speed information, displacement course and the distance travelled between the geographic positions of the registered interval.
It is recommended to record at every second to geoposition the aerial photographs. This internal registry serves as a backup in case the position recorder in cameras has inconsistency or failure in the data register; otherwise any software can be used to match the photographs with their geo-positioning by using the GPS route data, correlating the register time of GPS and the time in the clock of the camera. These GPS are also used for navigation purpose during the flight because they enable to visualize the flight plan lines and the route (figure 22).
The aerial GPS used for this survey directly uploads the GPS geographic position into the digital cameras and send it at low speed or high speed through their USB port; however this kind of ports were not compatible with the adapter used in the project system; that is why there is no adapter able to transfer to the camera the geopositioning data coming from the GPS through the USB port.
As an alternative option, the GPS signal was directly connected to the cameras despite the follow-ing limits: lack of robustness, sensitivity, need to use external antennas, impossibility to visualize maps, flight lines and travel registry; differently from an aerial GPS features. Consequently, a spe-cial set of cables was connected to make the aerial GPS communicate with the digital cameras, which gave every photograph geoposition in addition to controlling the intervalometer shots. This ensures that the signal introduced by aerial GPS ports into the cameras were 4 800 bits/second. This highly precise geopositioning is sent thanks to the aforementioned cable preparation.
The data of the central geopositioning in each photograph are necessary for Pix4D Mapper pro-gram to carry out the air triangulation, produce orthomosaics, and digital models of elevations and earth surfaces. To improve the geopositioning accuracy of every photograph that formed photomo-saics, it was important to upload at least five points of land control from the correct orthophotos into the software. This software can also receive control points determined in field by GPS receptors with differential correction.

68
Mexico-Monitoring of Opium Poppy Cultivation 2014-2015
Figure 23. Elements of the camera’s external orientation; it is defined by the angle of the three rotation axis and by their X, Y and Z position in a cartographic projection and by a reference datum.
7.11.5. Use of metallic platforms with aerial specifications
The main function of the metallic platforms is to support all the required equipment used to take aerial photography. However, it is not only used to fix cameras or other devices for fixed-wing or rotatory-wing aircrafts but it can be oriented towards any direction which is generally nadir.
The other components of the system such as the intervalometer and the interconnections with the aerial GPS receptors are aimed at automating the geopositionned photo-taking process with consistent and complete results. The data obtained can be quickly and accurately processed in photomosaics.
Vertical aerial photograph has nine orientation elements: six belong to the external orientation and three to the internal one. The elements of the external orientation produced by the aircraft are divided into transversal and rotational. The firsts are the x, y and z plan and belong to the latitude, longitude and altitude. The seconds are φ, ω, κ and correspond to pitch, roll and yaw or drift move-ments, as shown in figure 23.
These aircraft movements have to be reduced with a stable and balanced flight or with the mecha-nisms included in the metallic platforms to get a right orientation and stability for the cameras. The movements are known as internal orientation elements and are related with the camera handle; that is why it is easier to control them. These elements are the calibrated camera focal length and the main point that moves in x, y plane. These latter correspond to the radial deformation coeffi-cient according to the type of lens used. However the use of metallic airborne and stabilized plat-forms reduces the deviation of the first three elements of the external orientation.
Another deviation produced when the aircraft axis is not aligned with the flight direction due to crosswinds is the drift or image spin on the vertical axis. Even when photogrammetric methods are not applied, correcting it during the flight eases the further tasks such as photomosaics.
Other functions have to be accomplished by airborne metallic platforms; for instance, the reduction of the aircraft vibrations and the camera protection against extreme weather conditions such as: temperature, humidity, rain, dust and shocks. To minimize these factors, the Geography Institute of the UNAM has developed several ways to set the camera and manufactured specialized platforms which have become easier to build, transport, install and control due to the project’s experience.

69
Mexico-Monitoring of Opium Poppy Cultivation 2014-2015
Picture 15. Capsule-type platform with external adaptation for rotatory wing aircraft (helicopter)
Regarding the camera installation, the project exploited the porthole or iron fittings in some air-crafts to place small-format cameras over them, which allowed to use non-specialized airplanes or helicopters (figures 17 and 18). It is very important neither to interfere with the aircraft navigation and electronic systems nor to modify its aerodynamics.
Some small airplanes and most of the helicopters are certificated to fly without one or more doors, which eased the metallic platforms installation. Despite the simple appearance of these installa-tions, they enable to get high quality images and metric products with an acceptable accuracy if the flight is adequately carried out. Another option to avoid pitch and the internal and external deviations during the flight is to have a device called “inertial measurement unit” which records all the flight movements (internal and external orientation) even when the platform used was manu-al. These data are useful to compensate the drift and other displacements in the collected aerial photograph.
Another scheme used in the project’s metallic platforms was to enable operators to control the digital cameras during the flight because it is important to keep access to their controls and options to adjust the shooting speed and the ISO in order to have brighter or darker photographs of the ground, among other adjustments required.
On the other hand, most of the available digital cameras nowadays allow this control and adjust-ments by computer and the direct transfer of the collected images to the hard disk. The navigation aerial GPS data can be displayed by GIS devices. The GPS screen can be used for the pilot nav-igation and save the flight route in its internal memory. Likewise, it is possible to monitor photo-graphs with a portable screen (TV) and make overlap adjustments in the photographs when taking them through the electronic intervalometer.
Capsule-type metallic platforms that can be used outside the helicopters were also built. Those structures enable to install two (reflex) digital cameras with or without stabilization. This type of platforms which holds the cameras have a shock-absorbing system with springs and viscoelastic material; and the orientation can be made remotely through electric actuator. It is also possible to connect it to an inertial system to stabilize it automatically. Identical aerodynamic cross bars were used to make this platform reversible and avoid the dragging caused by the wind at the front and at the back; they were manually fixed with bungee-like elastic bands (picture 15).

70
Mexico-Monitoring of Opium Poppy Cultivation 2014-2015
7.11.6. Design, characteristics and installation of the airborne metallic platforms to acquire digital aerial photographs for the project
This project needed to set metallic platforms on a porthole in the aerial platforms (fuselage) where one visible camera and/or a couple of visible and infrared cameras were adapted in a common metal plate with their quick-release plate to guarantee that both lens always point in the same direction even when cameras were disassembled several times. This plate is also installed in the external containers with a multidirectional spherical joint.
In this regard, two independent airborne systems for vertical aerial photography were designed and integrated to take photographs in visible (VIS) and near infrared (IRc) spectrum. Every photo-graph taken has its own central coordinate (geopositioning). The system can additionally capture oblique video in any direction, which enables to increase fieldwork efficiency and the coverage capacity to monitor areas.
The most important requirement in designing these platforms is the shooting angle or the optical axis of the system verticality, because it is essential in order to apply the triangulation method. The photograph cannot have an inclination angle larger than 5° to make the material work. But gen-erally, with these systems, it is possible to obtain images with only 3° or less angle of inclination.
The version initially built for the project is designed to install two cameras (visible and infrared) in rotatory-wing aircrafts (helicopter MI-17) and has a symmetric aerodynamic profile with an aircraft orientation control in three axis with a single lever and a unique supporting point based on an spherical joint (pictures 16 and 17).
Originally, systems of some levers to correct pitch, roll and drift were used inside the aircraft but they were heavy and mechanically complex; thus, they were replaced by this system that enables to correct the three axis with a single lever. This lever was designed to be installed in a quickly and secure way in non-specialized aircrafts without the need of making any structural modification.
The camera control and data storage are executed inside the aircraft. The plates containing the heads to pint the three axis can be mounted in different structure configurations with or without neoprene shock absorbers; consequently adapting them is quickly and simple in the aircrafts.
A second structure was also built to adapt the platform on fixed-wings aircrafts specifically on Pila-tus PC-6 PORTER airplanes (picture 16 and 18) which have a big hatch in the fuselage (floor) with two doors which can be kept open or closed during the flight; likewise, this structure can be easily adapted in CESSNA airplanes, among others.

71
Mexico-Monitoring of Opium Poppy Cultivation 2014-2015
Figure 24. Digital modelling of the platform on the porthole to determine their dimensions and the position of the aluminum cross bars, traverses and other components to be installed on rotatory and
mobile wing aircrafts
The criteria used for their design and constructions were:
1. Positioning the cameras in the nadir direction, which allows a modular motion in the three axes to point them and to correct the aircraft pitch, roll and drift.
2. Keeping both cameras together in the same direction; for instance, visible and infrared camer-as to form a compact package.
3. Easing the access to the controls and the camera configuration menus before and during the flight as well as making the connections, revising them and solving the faults.
4. Easy construction and replication. 5. Modularity and possibility to replace the components. 6. Safety ensured when fastening the camera and integrity of all the components, redundancy of
the fastening devices. 7. Aircraft systems independence to avoid affecting their aeronautic, operational and security
features. 8. Vibration and shock absorption during the takeoff and landing. 9. Minimal use of tools for their installation. 10. Easy to transport; easy and intuitive installation.
To design the metallic platforms used in the project, the dimensions of the hatches in the aircrafts were measured and some possible configurations were simulated with a graphic design software. Then the components and the fastening systems were measured, as shown in figure 24.
The project exploited as much as possible the anchors and the fastening iron fittings located in the aircrafts. During the construction, some structural aluminum angular strips as well as anti-corrosion aeronautic screws of stainless steel were used for aeronautic purpose (picture 16). As previously mentioned, metallic platforms can be installed in fixed-wing or rotatory-wing aircrafts (see picture 17 and 18), as shown in picture 19. The easy installation of the digital cameras is also represented in picture 19.

72
Mexico-Monitoring of Opium Poppy Cultivation 2014-2015
Picture 16. Metallic platforms built for rotatory and fixed-wing aircrafts
Platform for rotatory wing (MI-17) Platform for fixed wing (Pilatus)
Picture 17. Mobile wing aircraft with a porthole in the floor to install the metallic platform
Helicopter MI-17 Platform installed in the internal porthole MI-17
Picture 18. Fixed wing aircraft with a porthole in the floor to install the metallic base and cameras
Pilatus airplane PC-6 Platform installed in the porthole (Porter PC-6)

73
Mexico-Monitoring of Opium Poppy Cultivation 2014-2015
Picture 19. Example of installation of visible (VIS) and infrared cameras (IRc) in the metallic platforms for mobile and fixed wing
Bar with quick-release plate to install the cameras
Coupling cameras on the quick plate
Figure 25. Flight lines with its recommended overlap
7.12. FLIGHT PLANNING TO CAPTURE AERIAL PHOTOGRAPH
The flight plan to take aerial photographs requires good quality and precision to achieve the de-sired results. In this regard, the quality depends on the identification of the type of field, the aircraft altitude and the digital cameras parameters used when overflying the study area. The most im-portant thing to consider is the recommended overlap for most of the cases with a 75% front (flight direction) and a minimum of 50% between the flight lines (figure 25).

74
Mexico-Monitoring of Opium Poppy Cultivation 2014-2015
Figure 26. Calculation spreadsheet and parameters of the flight lines
General parameters: resolution, lateral overlap, elevation, coverage area and average speed.
Parameters of the distances between the flight lines, number of photographs per line and camera shooting interval.
Result of the vertexes with their coordinates.
The parameters and characteristics of the cameras and lens are used to calculate an adequate flight plan and a photogrametric coverage of the of 10 x 10 km segment areas. All the necessary data of the ground topography, coverage and photographs resolution, among other, are used, as shown in figure 26.
For the flight plans, the data obtained from spreadsheet are used such as: the lateral overlap be-tween the flight lines expressed in percentage; the minimum and maximum resolution of pixel in centimeters required in the photographs (this depends on the required precision by the project); the average elevation over the ground to be photographed (obtained from the CEM provided by the IN-EGI); the flight altitude in meters and feet; the number of flight lines and the number of photographs per flight line; the speed in m/s, the distance to flight in miles, the area to cover in square meters and the estimated flight time. These last data are provided to the pilot so that he can calculate the necessary amount of fuel.

75
Mexico-Monitoring of Opium Poppy Cultivation 2014-2015
Figure 27. Software interface used to create flight lines
Integration of the vertexes for each flight line
Tracing of flight lines
The total of flight lines is seven. Each line length is 10 kilometers which is enough to cover a total area of 100 km2. They are traced with a GIS software for each 10 x 10 km segment of the sample. These lines will be followed by the aircraft during the flight, as shown in figure 27.
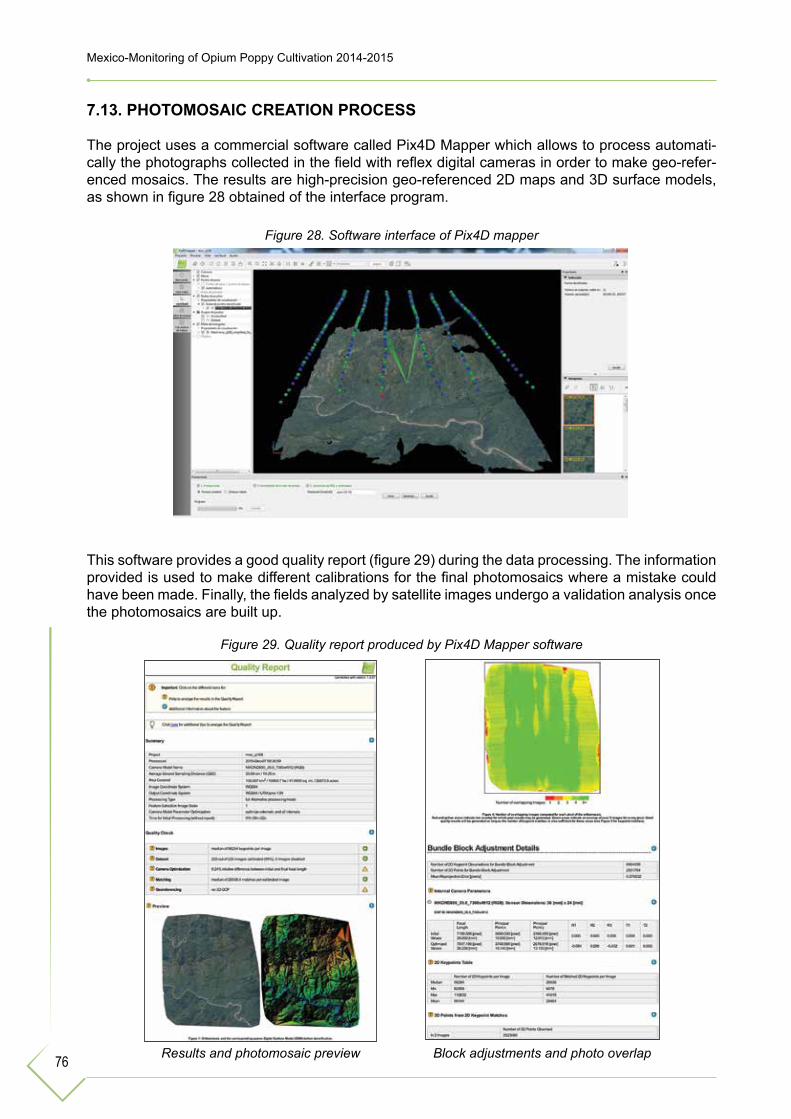
76
Mexico-Monitoring of Opium Poppy Cultivation 2014-2015
Figure 28. Software interface of Pix4D mapper
Figure 29. Quality report produced by Pix4D Mapper software
Results and photomosaic preview Block adjustments and photo overlap
7.13. PHOTOMOSAIC CREATION PROCESS
The project uses a commercial software called Pix4D Mapper which allows to process automati-cally the photographs collected in the field with reflex digital cameras in order to make geo-refer-enced mosaics. The results are high-precision geo-referenced 2D maps and 3D surface models, as shown in figure 28 obtained of the interface program.
This software provides a good quality report (figure 29) during the data processing. The information provided is used to make different calibrations for the final photomosaics where a mistake could have been made. Finally, the fields analyzed by satellite images undergo a validation analysis once the photomosaics are built up.

77
Mexico-Monitoring of Opium Poppy Cultivation 2014-2015
7.14. FORMULA APPLIED TO THE STATISTIC ESTIMATE OF EVERY SAMPLING FRAME
The statistical estimations were made by using the interpretations results for each segment in ev-ery period of four months. For a high percentage of selected segments, a partial information was obtained due to the fact that the clouds covered some part of the images that consequently could not be interpreted. Thus, the average area under opium poppy cultivation estimated per segment was divided by the averages of visible area (not covered by clouds) estimated per segment. This ratio was then multiplied by the area of interest to obtain an estimate of the total opium poppy area (in ha):
with H the number of strata (H=100), the stratum weight the estimated mean per segment with opium poppy in stratum the estimated mean of the observable area per segment in stratum h, and A the total area of the area covered by the sampling frame (I) based on the historical eradication data (table 11).
The sampling variance was estimated by first computing the residuals for the selected segments ( is the observed area (not covered by clouds) in segment ). The sampling variance of the mean of the residuals in a stratum h was then estimated by:
with the estimated spatial variance of the residuals in stratum h:
The sampling variance of the mean of the residuals in the area covered by the sampling frame based on historical eradication data was then estimated by:
The variance of the ratio was estimated by:
with the mean of the observable area per segment estimated as a weighted average of the stra-tum means of observable area per segment:
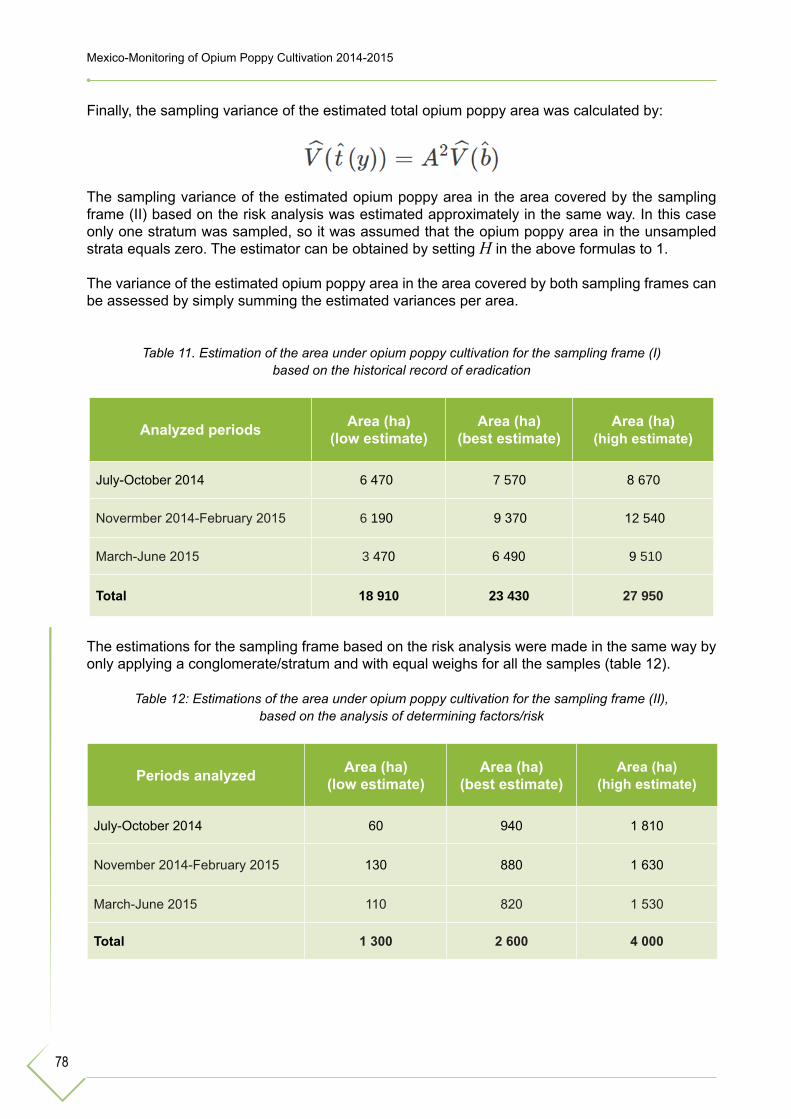
78
Mexico-Monitoring of Opium Poppy Cultivation 2014-2015
Finally, the sampling variance of the estimated total opium poppy area was calculated by:
The sampling variance of the estimated opium poppy area in the area covered by the sampling frame (II) based on the risk analysis was estimated approximately in the same way. In this case only one stratum was sampled, so it was assumed that the opium poppy area in the unsampled strata equals zero. The estimator can be obtained by setting H in the above formulas to 1.
The variance of the estimated opium poppy area in the area covered by both sampling frames can be assessed by simply summing the estimated variances per area.
Table 11. Estimation of the area under opium poppy cultivation for the sampling frame (I) based on the historical record of eradication
Analyzed periods Area (ha)(low estimate)
Area (ha)(best estimate)
Area (ha)(high estimate)
July-October 2014 6 470 7 570 8 670
Novermber 2014-February 2015 6 190 9 370 12 540
March-June 2015 3 470 6 490 9 510
Total 18 910 23 430 27 950
The estimations for the sampling frame based on the risk analysis were made in the same way by only applying a conglomerate/stratum and with equal weighs for all the samples (table 12).
Table 12: Estimations of the area under opium poppy cultivation for the sampling frame (II),based on the analysis of determining factors/risk
Periods analyzed Area (ha)(low estimate)
Area (ha)(best estimate)
Area (ha)(high estimate)
July-October 2014 60 940 1 810
November 2014-February 2015 130 880 1 630
March-June 2015 110 820 1 530
Total 1 300 2 600 4 000
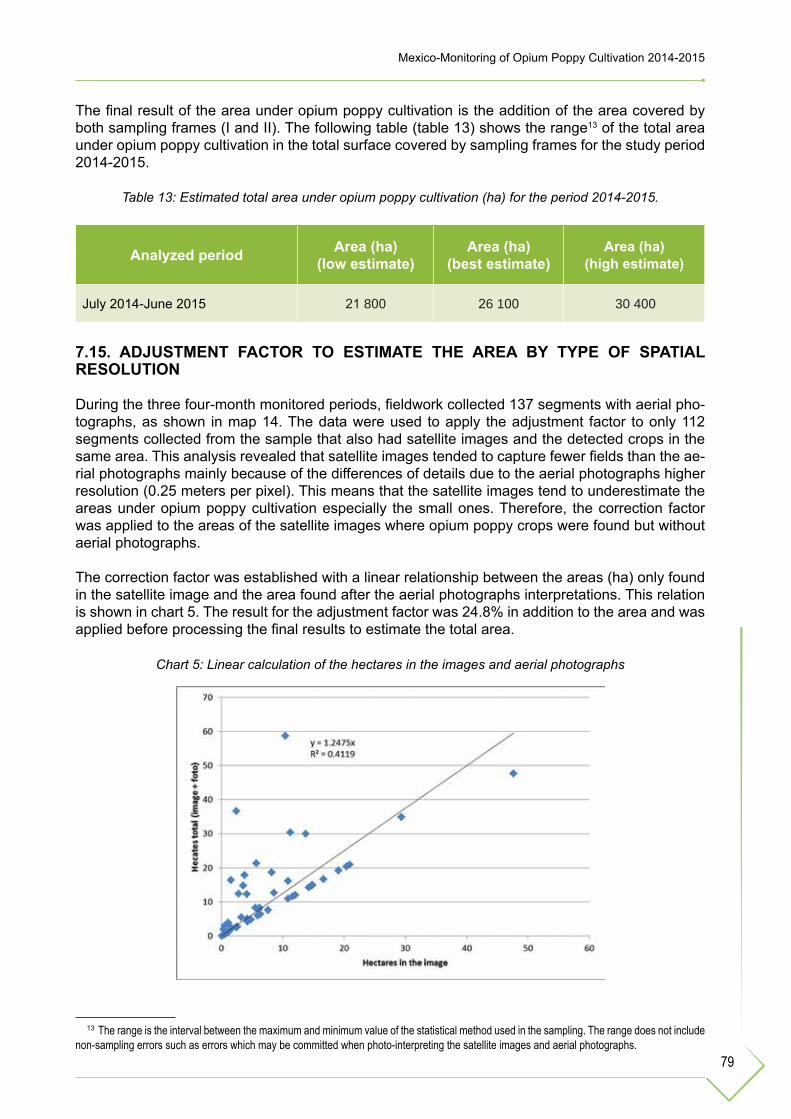
79
Mexico-Monitoring of Opium Poppy Cultivation 2014-2015
The final result of the area under opium poppy cultivation is the addition of the area covered by both sampling frames (I and II). The following table (table 13) shows the range13 of the total area under opium poppy cultivation in the total surface covered by sampling frames for the study period 2014-2015.
Table 13: Estimated total area under opium poppy cultivation (ha) for the period 2014-2015.
Analyzed period Area (ha)(low estimate)
Area (ha)(best estimate)
Area (ha)(high estimate)
July 2014-June 2015 21 800 26 100 30 400
7.15. ADJUSTMENT FACTOR TO ESTIMATE THE AREA BY TYPE OF SPATIAL RESOLUTION
During the three four-month monitored periods, fieldwork collected 137 segments with aerial pho-tographs, as shown in map 14. The data were used to apply the adjustment factor to only 112 segments collected from the sample that also had satellite images and the detected crops in the same area. This analysis revealed that satellite images tended to capture fewer fields than the ae-rial photographs mainly because of the differences of details due to the aerial photographs higher resolution (0.25 meters per pixel). This means that the satellite images tend to underestimate the areas under opium poppy cultivation especially the small ones. Therefore, the correction factor was applied to the areas of the satellite images where opium poppy crops were found but without aerial photographs.
The correction factor was established with a linear relationship between the areas (ha) only found in the satellite image and the area found after the aerial photographs interpretations. This relation is shown in chart 5. The result for the adjustment factor was 24.8% in addition to the area and was applied before processing the final results to estimate the total area.
13 The range is the interval between the maximum and minimum value of the statistical method used in the sampling. The range does not include non-sampling errors such as errors which may be committed when photo-interpreting the satellite images and aerial photographs.
Chart 5: Linear calculation of the hectares in the images and aerial photographs

80
Mexico-Monitoring of Opium Poppy Cultivation 2014-2015
Map 14. Total segments of the sample (10 x 10 km) with aerial photographs collected during the fieldwork.
Source: Illicit Crop Monitoring System in the Mexican Territory – supported by UNODC. The boundaries and names shown and the designations used on this map do not imply official endorsement or acceptance by the United Nations.

81
ANNEX
ANNEX I. NATIONAL MAP OF ILLICIT CROPS PROBABILITIES BY DETERMINING FACTORS / RISK
The purpose of the national map is to indicate the probable presence of illicit crops in the different regions of the country. The main input for this analysis is the illicit crops historical data provided by the federal government.
The analysis aims at discovering the physical and socio-economic characteristics that favour the illicit cultivation presence, the places where these characteristics are common, and if there were eradication activities or not.
The result is a probability map elaborated through a statistical analysis known as binomial logistic analysis. This analysis estimates the relevance of each series of independent variables in the prob-ability that an event represented by a dependent variable happens or not. In this case, the event the dependent variable is referring to is, obviously, the presence or the absence of illicit crops.
To make this analysis it was necessary in order to develop a national database that will indicate information from different sources which are helpful to calculate the risk of illicit crops presence in a same level of aggregation. More than 80 variables that may be useful to predict this risk were collected. Only ten that produced the best statistical model were used.
The methodology and the analysis results are explained below.
DATA BASE CONSTRUCTION
The construction of a national database with variables from different sources involved the com-bination of diverse spatial scales and different aggregation levels. Therefore, it was important to select a single territorial unit with an aggregation level that was not only small enough to represent local scales but also suitable to carry out the survey in a country with an extension of more than 2 000 000 of square kilometers, despite the information restrictions.
After observing the data sources, the project decided to use and implement the alphanumeric national grid with territorial units (cells) of 100 km2. The database included more than 80 physical and socio-economic variables. Regarding the socio-economic data, 2010 figures were used; the reference time of the physical data sources was more variable. However, this type of information is more consistent over time.
SELECTION AND CLASSIFICATION OF VARIABLES
A diagram of relations was elaborated to identify the possible elements or variables that directly or indirectly interact with the presence of illicit crops considering their physical and socioeconom-ic-administrative aspects (characterization and spatial representation).
In this regard, the characterization in the diagram includes the elements related to these phenom-ena, such as: land and vegetation use, weather, superficial hydrography, topography, population, infrastructure and urban furnishing, government organization, among others. Once the character-ization was obtained, the analysts made the identification and representation of the spatial data, that is, the selection of variables and their parameters, as shown in figure 30.

82
Mexico-Monitoring of Opium Poppy Cultivation 2014-2015
Figure 30. Diagram of relations
It is worth mentioning that selecting some variables faces some limits. One of them is the quality and quantity of the suitable and available information; another limit is the measurement scale se-lected to report the basic (qualitative and quantitative) information and the geographic scale select-ed. For this reason, different types of work scales were established, as described in the paragraphs below:
1. Operational scale, with abstraction levels:• Regional level, scale 1:250 000, 1:1 000 000 y 1:4 000 000: maps of land use, weather,
physiographic provinces, hydrological network, annual average of precipitation, evapo-transpiration, services and road infrastructure.
• Local level, scale 1:50 000: topographical mapping, housing topology, socio-economic aspects by municipality, demographic aspects and topography.
2. Cartographic scale through a 10 km2 a orthogonal grid of to symbolize: population average, accessibility index, marginalization index, among others.
3. Timing cartography for illicit cultivation (cannabis and opium poppy crops): eradication dates, cultivation months, phenological periods, beginning month and finalization.
4. Thematic cartography to have a perspective of the place: weather, hydrography, topogra-phy, land and vegetation use, evapotranspiration, precipitation, among others.
TYPES OF VARIABLES
The qualitative variables were categorized on the basis of the related topic; that is, they were as-signed with a numeric value by type of variable and were then correlated with quantitative variables (table 14 of the variables used).
To evaluate the variables different parameters were used; they were expressed in terms of averag-es, variances, standard deviation, index and areas depending on the nature of the analyzed data.

83
Mexico-Monitoring of Opium Poppy Cultivation 2014-2015
Table 14. Total of the variables used in the survey
Variables Parameters
Roads
Minimum length of the roads (tertiary path, secondary path, dirt road, paved road), maximum length of the roads (tertiary path, secondary path, dirt road, paved road), average length of the roads (tertiary path, secondary path, dirt road, paved road), total length of the roads (tertiary path, secondary path, dirt road, paved road), standard deviation of the roads (tertiary path, second-ary path, dirt road, paved road), variance of the roads (tertiary path, secondary path, dirt road, paved road), roads density (tertiary path, secondary path, dirt road, paved road), minimum length of the paved roads, maximum length of the paved roads, average length of the paved roads, total length of the paved roads, standard deviation of the paved roads, variance of the paved roads, density of the paved roads, minimum distance of the roads (tertiary path, sec-ondary path, dirt road, paved road) from the grid centroid, minimum distance of the paved roads from the grid centroid.
Slope Minimum slope, maximum slope, range of the slope, average of the slope, standard deviation of slope, total slope per grid.
Altitude Minimum altitude, maximum altitude, altitude average, standard deviation of the altitude, variance of the altitude.
Land use and vegetation
Type of land and vegetation use, Type of use of the land and vegetation grouped, maximum area by grid of land and vegetation use, average of the maximum area of land and vegetation use, standard deviation of the land and vegetation use, variance of the land and vegetation use, dense vegetation.
Weather Type of weather
Temperature Annual average of the temperature
Evapotranspiration Evapotranspiration by range
Precipitation Annual average of precipitation range
Hydrographic network Types of runoff (rivers), rivers length, total length of rivers by grid
Physiographic regions Maximum area of physiographic regions by grid, type of physiographic province.
Population and housing
Population average by town or city, total population by town or city, total hous-es by town or city, inhabited houses by town or city, average (weighted by grid) of the marginalization index by town or city, marginalization level by town or city, minimum accessibility index by town or city, maximum accessibility in-dex by town or city, average of accessibility index by town or city, accessibility index by town or city, standard deviation of accessibility index by town or city, variance of the accessibility index by town or city.
Eradication of illicit crops Eradication date, eradication place, etc.
Governance Governance by municipality, governance average by municipality

84
Mexico-Monitoring of Opium Poppy Cultivation 2014-2015
Data analysis
The analysis used to elaborate the risk map for illicit crops is a statistical technique known as binomial logistic analysis. In this type of analysis there is a dichotomous dependent variable i.e a variable which can acquire one or two values: 0 and 1. In this analysis, this dependent variable is predicted by one or more independent variables which have a dichotomous or numeric nature. The general formula for a binomial logistic analysis is:
With:
Ŷ = Estimation of the dependent variable in the territorial unit.Βi = Coefficient for every independent variable - Βo is a constant (“y” intercept).Xi = Value of the independent variable i in the territorial unit.
Once the analysis results were obtained, the values of the model coefficient were used to predict the risk of illicit crops (in probability terms) for each of the 10 x 10 km segments of the national grid. The results were expressed in 5 categories, as shown in the annex map 25: very low risk, low risk, medium risk, high risk, and very high risk. The categorization was made through the stratification method of Jenks, commonly known in GIS packaging as Natural Breaks. All the statistical analysis was carried out in R v.3.02 software (R Core Team, 2014).
Table 15. Independent variables selected for the binomial logistic model(CONAPO, 2010; INEGI, 2010).
Alias Description Source
1. Slope Slope average in the cell.
Calculated through the Digital Terrain Model ob-tained from the interpolation of the INEGI level curves at every 20 meters.
2. Slopesd Standard deviation of the slope in the cell.
3. Altitude Average altitude in the cell.
4. LnpobNatural logarithm of the total pop-ulation in towns or cities in the cell.
Calculated from the INEGI town or city informa-tion.
5. MarginalizationWeighted average by population of the Marginalization Index of town or cities in the cell.
Calculated with the index provided by CONAPO
6. Vegdens Dense vegetation 1=Yes, 0 = No. INEGI
7. Vegother Other type of vegetation.
Reclassification of INEGI, version III, 2008. La-tent category: Woods.8. Vegjungle Vegetation: jungle.
9. Veg sec Secondary bush vegetation.
10. Disttrans Distance from the centroid cell to the nearest paved road.
Calculation made with the INEGI information of the road network.

85
Mexico-Monitoring of Opium Poppy Cultivation 2014-2015
Results of the variables used
The following maps (15 to 25) show the spatial distribution of the variables used in the analysis. Maps 15 and 16 show the information of the historical eradication of illicit crops and their distribu-tion in 2010. There is a clear spatial pattern that concentrates both cultivations in the Pacific coast states with a bigger density in the states of Chihuahua, Durango, Sinaloa, the South of Nayarit, the north and south of Jalisco in the border with Michoacán where activity was also found around its border with Guerrero. This state together with Oaxaca has the biggest activity in the south of the country. Regarding the types of crops, cannabis is present in all the areas but in a lesser extent in the southern states while opium poppy crops are concentrated in Guerrero and Oaxaca and in the border area between Sinaloa, Durango and Chihuahua better known as the Golden Triangle.
The rest of the maps show the variables selected in the survey. The observation of these maps shows that illicit crops are located in rough terrain regions, as noticed in the maps of slopes and standard deviation of the slopes. They also show that the vegetation is usually dense and that woods and jungles prevail in the areas of narcotic-drug eradication. Finally, the maps seem to indicate that the eradication areas have a low population with a complicated access by roads and with high marginalization levels.
National estimate of probabilities for illicit cultivations
The logistic model gave the results shown in table 16. According to Pseudo R2 of McFadden, the model adjustment is R2=0.33 and R2=0.39 according to Nagelkerke, which makes it a well-adjust-ed model considering the type of analysis (Pebesma and Bivand, 2005); pscl (Jackman, 2012); rms (Harrell, 2014) and map tools (Bivand et. al., 2014).
The results show that the most important variables in the illicit crop production are the population and vegetation characteristics. Regarding the cells where the population is lower than 2 500 in-habitants, they have an increase illicit crop risks by 280% every time the population is duplicated but as the population grows, the variable relevance starts to decrease. This means illicit cultivation requires inhabited places but with a low population.
Besides, the model shows that the areas with marginalized population have a bigger probability to find illicit crops. The duplication of the marginalization increases the probability to find illicit crops by 12%.
In terms of vegetation, in the areas of dense vegetation, the probability of illicit cultivation de-creases by 30%. This result seems the opposite of what was observed in the maps. However the negative direction of the variable could be produced by any interaction effect with the rest of the variables included in the model. Regarding the woods areas, jungle is more likely to have illicit cultivation by 13% while the bush vegetation has 53% of lower probability. In areas with other type of vegetation, the probability to find illicit cultivation is even lower i.e. 77% less than in the woods. In terms of topography, altitude has a very low negative coefficient.
The table below shows the predicted values of binomial logistic model i.e. the probability to find illicit crops that can be interpreted as a risk map for illicit crops. It was categorized in five ranks.

86
Mexico-Monitoring of Opium Poppy Cultivation 2014-2015
N= 22306; McFadden R2 = 0.33; Nagelkerke R2=0.39Log-l (Complete model) = -4356.9; Log-l (Only Constant) = -6532.1
We can observe that the large historical eradication areas along the Eastern Sierra Madre partic-ularly in the Golden Triangle, in Guerrero and Oaxaca have the biggest probability/risk. It is also remarkable that the North of the Western Sierra Madre has no eradication although the map shows a high probability/ risk. The same situation happens in Chiapas State.
Table 16. Binomial logistic model: probability of illicit crops
Variable Coefficient Standard error Odds-Ratio
(Constant) -3.86 0.12 0.02
Physical variables
Slope (average) 0.14 0.01 1.15
Slope (Standard deviation) 0.06 0.02 1.06
Altitude (m) -1.481E-04 4.361E-05 9.999E-01
Dense vegetation (Yes = 1) -0.36 0.07 0.70
Vegetation. Latent category: woods
Other type of vegetation (Yes =1) -1.49 0.09 0.23
Jungle (Yes =1) 0.12 0.10 1.13
Bush vegetation (Yes =1) -0.75 0.08 0.47
Socio-economic variables
Distance to transportation (Km) 2.07E-03 1.81E-04 1.002E+00
Population. Latent category: without population
1 – 2 500 inhabitants 1.35 0.09 3.87
2 500 -15 000 inhabitants 1.00 0.11 2.73
More than 15 000 inhabitants 0.73 0.23 2.07
Marginalization index 0.11 0.04 1.12
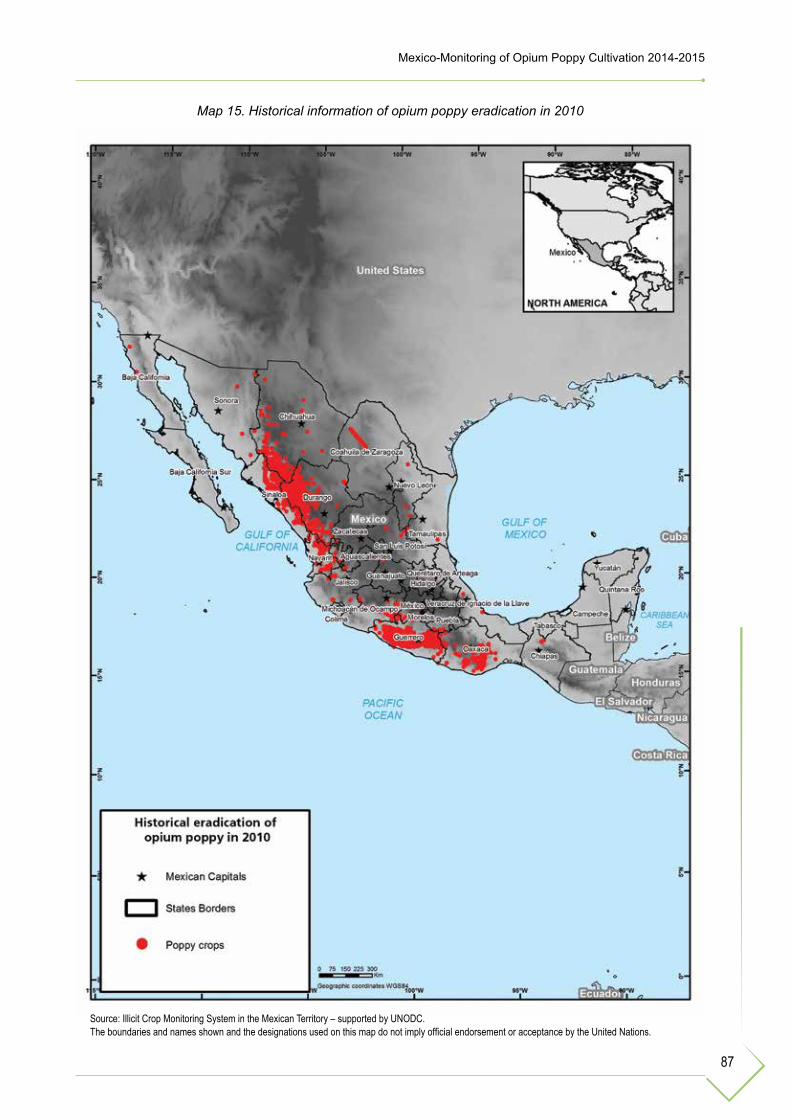
87
Mexico-Monitoring of Opium Poppy Cultivation 2014-2015
Map 15. Historical information of opium poppy eradication in 2010
Source: Illicit Crop Monitoring System in the Mexican Territory – supported by UNODC. The boundaries and names shown and the designations used on this map do not imply official endorsement or acceptance by the United Nations.

88
Mexico-Monitoring of Opium Poppy Cultivation 2014-2015
Map 16. Historical information of cannabis eradication in 2010
Source: Illicit Crop Monitoring System in the Mexican Territory – supported by UNODC. The boundaries and names shown and the designations used on this map do not imply official endorsement or acceptance by the United Nations.

89
Mexico-Monitoring of Opium Poppy Cultivation 2014-2015
Map 17. Average altitudes of the Mexican territory (MASL)
Source: Illicit Crop Monitoring System in the Mexican Territory – supported by UNODC. The boundaries and names shown and the designations used on this map do not imply official endorsement or acceptance by the United Nations.

90
Mexico-Monitoring of Opium Poppy Cultivation 2014-2015
Map 18. Slopes average (%) in the Mexican territory
Source: Illicit Crop Monitoring System in the Mexican Territory – supported by UNODC. The boundaries and names shown and the designations used on this map do not imply official endorsement or acceptance by the United Nations.

91
Mexico-Monitoring of Opium Poppy Cultivation 2014-2015
Map 19. Standard deviation of the slopes average (%) in the Mexican territory
Source: Illicit Crop Monitoring System in the Mexican Territory – supported by UNODC. The boundaries and names shown and the designations used on this map do not imply official endorsement or acceptance by the United Nations.
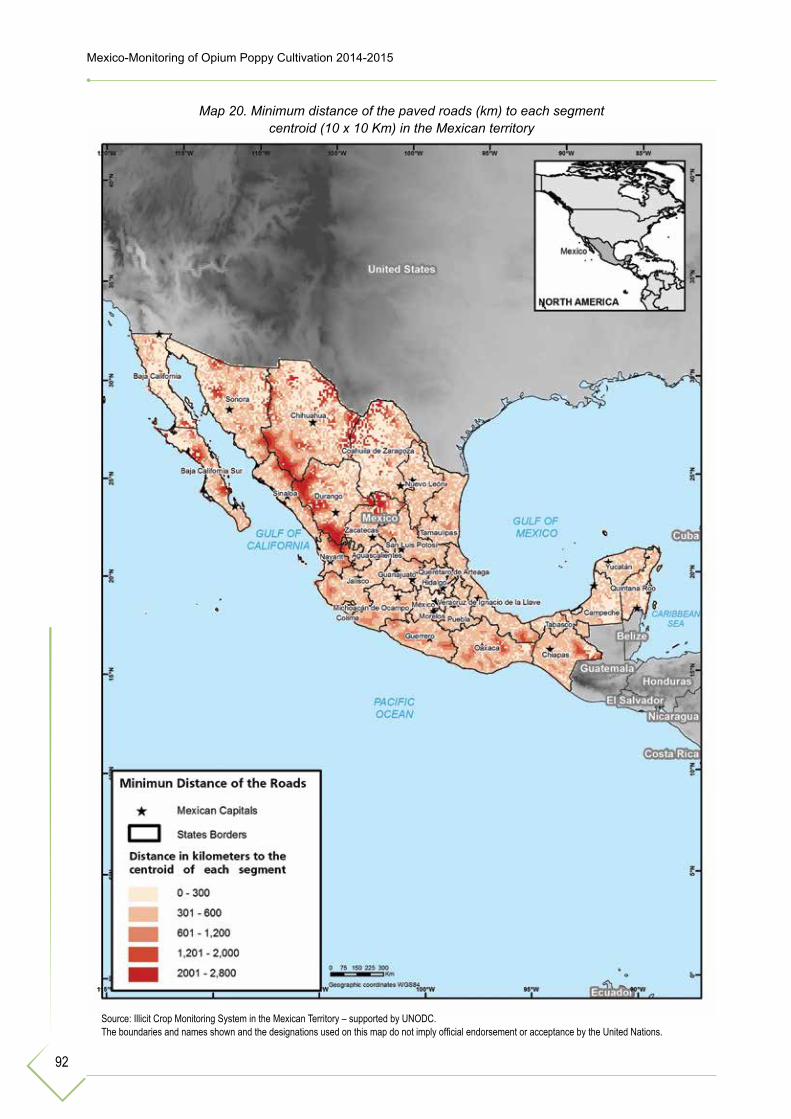
92
Mexico-Monitoring of Opium Poppy Cultivation 2014-2015
Map 20. Minimum distance of the paved roads (km) to each segment centroid (10 x 10 Km) in the Mexican territory
Source: Illicit Crop Monitoring System in the Mexican Territory – supported by UNODC. The boundaries and names shown and the designations used on this map do not imply official endorsement or acceptance by the United Nations.

93
Mexico-Monitoring of Opium Poppy Cultivation 2014-2015
Map 21. Total population per town and cities in the Mexican territory
Source: Illicit Crop Monitoring System in the Mexican Territory – supported by UNODC. The boundaries and names shown and the designations used on this map do not imply official endorsement or acceptance by the United Nations.

94
Mexico-Monitoring of Opium Poppy Cultivation 2014-2015
Map 22. Average of the population marginalization index in the Mexican territory
Source: Illicit Crop Monitoring System in the Mexican Territory – supported by UNODC. The boundaries and names shown and the designations used on this map do not imply official endorsement or acceptance by the United Nations.

95
Mexico-Monitoring of Opium Poppy Cultivation 2014-2015
Map 23. Dense vegetation in the Mexican territory
Source: Illicit Crop Monitoring System in the Mexican Territory – supported by UNODC. The boundaries and names shown and the designations used on this map do not imply official endorsement or acceptance by the United Nations.
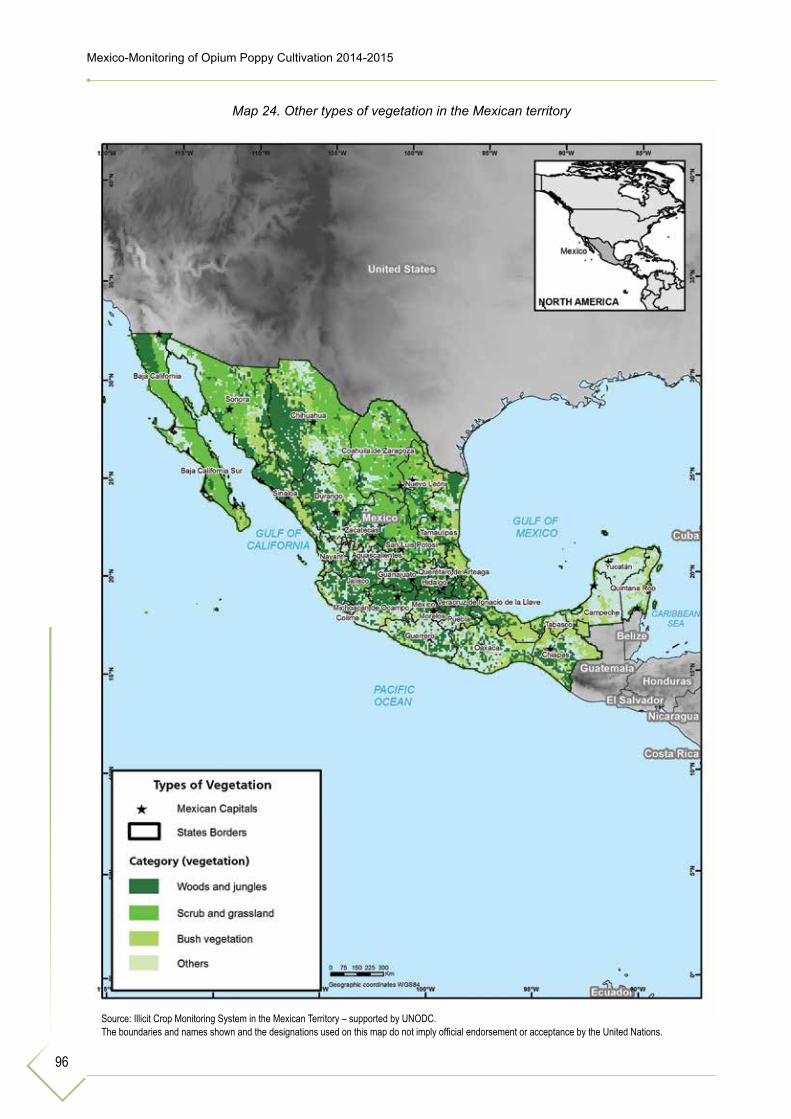
96
Mexico-Monitoring of Opium Poppy Cultivation 2014-2015
Map 24. Other types of vegetation in the Mexican territory
Source: Illicit Crop Monitoring System in the Mexican Territory – supported by UNODC. The boundaries and names shown and the designations used on this map do not imply official endorsement or acceptance by the United Nations.

97
Mexico-Monitoring of Opium Poppy Cultivation 2014-2015
Map 25. National area of illicit crops probability / risk by determining factors
Source: Illicit Crop Monitoring System in the Mexican Territory – supported by UNODC. The boundaries and names shown and the designations used on this map do not imply official endorsement or acceptance by the United Nations.

98
Mexico-Monitoring of Opium Poppy Cultivation 2014-2015
ANNEX II. CHARACTERISTICS OF THE AVAILABLE SATELLITE IMAGES USED IN THE PROJECT
Satellite images are the main input to analyze the areas under opium poppy cultivation in the pres-ent survey. The analyzed areas correspond to the sample of 368 segments statistically obtained in the sampling frames applied to the national grid with each of the 10 x 10 km segments.
Thus, the images represent a particular portion of the land area which is captured with a pas-sive-optical remote sensor that requires solar energy to collect information in its artificial satellite sensor that permanently orbits around the earth.
The satellite images obtained in the same location on a regular basis allows us to observe the development of any terrestrial phenomena, to perceive the objects colors and to interpret their contour (shape). Consequently, passive sensors were used because they are the most relevant to identify illicit crops.
However, there is an endless number of satellites orbiting the earth with passive solar sensors which provide a wide spectrum of satellite images. Choosing which image is suitable depends on the type of study to be made and this will enable the user to select the characteristics and resolu-tions needed such as the spatial, spectral, radiometric and temporal natures. Table 17 shows some examples of different commercial sensors.
Table 17. Characteristics of the passive sensors used for the monitoring
Satellite # Bands Sensor and resolution
Dynamic range and precision Scope width Orbit
altitude
SPOT 6 and 7
Panchromatic RedGreenBlueNear infrared
Panchromatic: 1.5 mMultispectral: 6 m
11 bits/pixel
10 m CE9060 x 180 Km 822 Km
Ikonos
Panchromatic RedGreen BlueNear infrared
Panchromatic: 0.82 mMultispectral: 3.2 m
11 bits/pixel
2 m CE9011 x 60 Km 681 Km
Quick Bird
PanchromaticRedGreen BlueNear infrared
Panchromatic: 0.65 mMultispectral: 2.62 m
11 bits/pixel
23 m CE9018 x 50 Km 482 Km
Geo Eye 1
PanchromaticRedGreen BlueNear infrared
Panchromatic: 0.46 mMultispectral: 1.84 m
11 bits/pixel
5 m CE9015 x 50 Km 770 Km
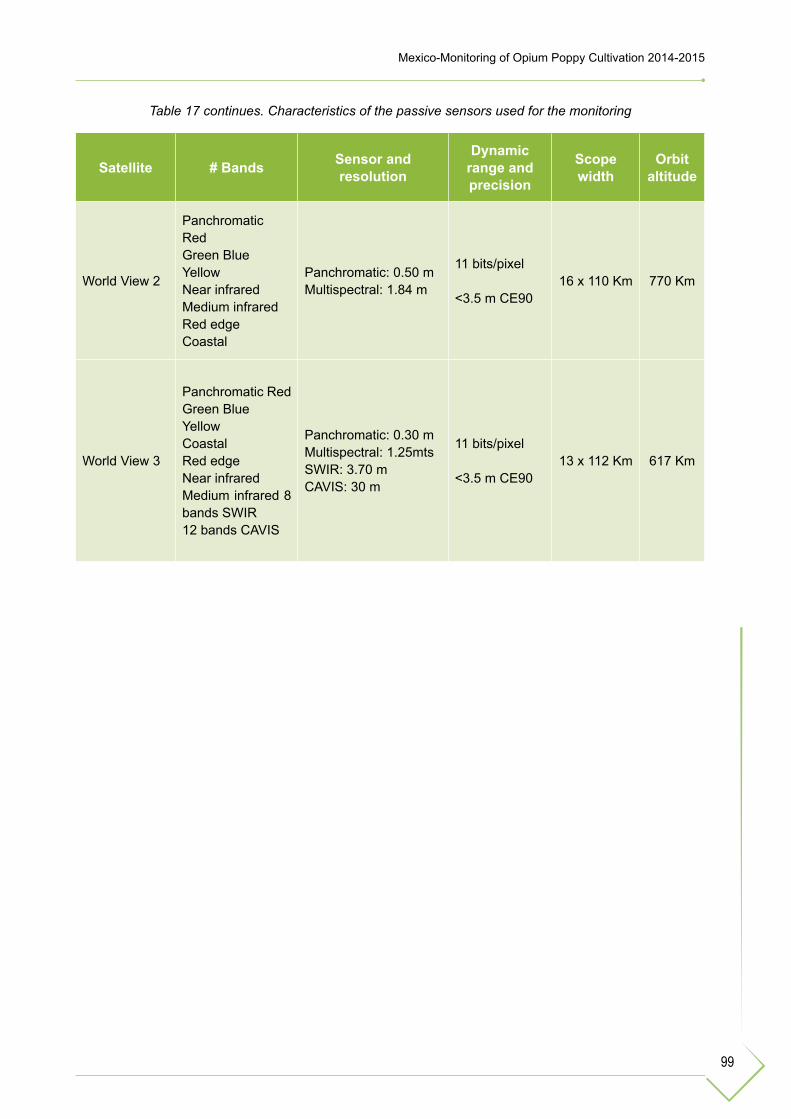
99
Mexico-Monitoring of Opium Poppy Cultivation 2014-2015
Table 17 continues. Characteristics of the passive sensors used for the monitoring
Satellite # Bands Sensor and resolution
Dynamic range and precision
Scopewidth
Orbit altitude
World View 2
PanchromaticRedGreen BlueYellowNear infrared Medium infrared Red edgeCoastal
Panchromatic: 0.50 mMultispectral: 1.84 m
11 bits/pixel
<3.5 m CE9016 x 110 Km 770 Km
World View 3
Panchromatic RedGreen BlueYellowCoastalRed edgeNear infrared Medium infrared 8 bands SWIR12 bands CAVIS
Panchromatic: 0.30 mMultispectral: 1.25mtsSWIR: 3.70 mCAVIS: 30 m
11 bits/pixel
<3.5 m CE9013 x 112 Km 617 Km

100
Mexico-Monitoring of Opium Poppy Cultivation 2014-2015
ANNEX III. DESCRIPTION OF THE PASSIVE SENSOR AND/OR OPTICAL SATELLITES
The passive sensors and/or optical satellites can capture in the electromagnetic spectrum14 (figure 31).The characteristics of this type of sensor are:
• The images can only be captured during the day because an external source of light is required such as the sun.
• Multispectral sensor which can collect bands of panchromatic, Red, Green. Blue, (RGB) and the bands of near, medium and far infrared (IR-NIR).
• Their scope width (ground coverage) is from 225 km2 to 3 750 km2.• These images have a very high resolution: up to 0.30 meters per pixel.• They can be affected by atmospheric conditions such as aerosols, clouds or fog when the
image is captured between the sensor and the ground.
Types of resolutions
There are four different types of resolution corresponding to every remote sensor: spatial, spectral, radiometric, and temporal.
Spatial resolution
It refers to the detailed level of the objects that can be observed in the image by their pixel size i.e the smaller the pixel, the more objects can be detected in the image, as shown in picture 20. The SPOT-7 image of 1.50 meters is on the left side and the Geo-Eye image of 0.50 meters is on the right side. When comparing the images, a better detail of the fields and/or geographic features can be observed.
Likewise, there are some cases where the resolution can be affected by adverse meteorological factors: fog, clouds, low illumination, or shadows caused by the satellite inclination when the image is collected in relation with the ground.
14 It is the range of the energy or electromagnetic radiations that have different wavelengths of all the possible electromagnetic radiations. The object spectrum is the distribution characteristic of the electromagnetic radiation of this object.
Figure 31. Wavelengths of the (visible) spectrum
Source: MEXK54

101
Mexico-Monitoring of Opium Poppy Cultivation 2014-2015
Figure 32. Number of bands by type of spectrum in Geo-Eye I images
Picture 20. Details comparison between satellite images
SPOT-7 Image Geo Eye-1 Image
Source: MEXK54
Spectral resolution
Spectral resolution is the number and types of bands an image has in the electromagnetic spec-trum (figure 32). Each band captured by the satellite sensor helps to discriminate some type of object over the earth surface such as: blue band (water bodies), green band (vegetation), red band (chlorophyll absorption-vegetal covers), near infrared band (biomass), medium infrared band (bare rocky soils) and far infrared band (humidity on the ground).

102
Mexico-Monitoring of Opium Poppy Cultivation 2014-2015
Picture 21. Level of details by number of bits in each image
8 bits (SPOT)
11 bits (GEO-EYE)
Figure 33. Examples of orbits (left) and satellite scope (right)
Radiometric resolution
It is the sensor sensibility i.e. the capacity to distinguish between minimum variations in the cap-tured radiation. Those values are expressed by the number of bits necessary to be saved for every pixel in the image i.e. the larger the number of bits, the higher the number of values for each pixel. This feature contributes to observe a better delimitation of the outline of the objects captured in the image (picture 21).
Temporal resolution
It indicates the time interval between each image captured by the sensor (satellite) in the same orbit and in the same incidence angle (sensor inclination). High temporal resolution enables to observe repeatedly the same geographic point of the ground in very short periods of time (figure 33). Some satellites have very high temporal resolutions, which is important to monitor constantly changing phenomena.

103
BIBLIOGRAPHIC REFERENCES
Bivand, Roger S., Edzer Pebesma, Virgilio Gomez-Rubio, 2013. Applied spatial data analysis with R, Se- cond edition. Springer, NY. http://www.asdar-book.org/
CONAPO (2010), Anexo Metodológico en Índice de Marginación por Localidad, México, Consejo Nacional de Población.
EARTH EXPLORER, 2014: http://earthexplorer.usgs.gov (14.02.2014).
Harrell Jr, Frank E (2015). rms: Regression Modeling Strategies. R package version 4.3-1. http://CRAN.R- project.org/package=rms
INEGI 2010, Censo Nacional de Población y Vivienda, México Instituto Nacional de Geografía y Estadística.
Jackman, Simon (2015). pscl: Classes and Methods for R Developed in the Political Science Computational Laboratory, Stanford University. Department of Political Science, Stanford University. Stanford, California. R package version 1.4.9. URL http://pscl.stanford.edu/
MATTIUZZI M., BUSSINK C., BAUER T., 2014: Analysing Phenological Characteristics Extracted from Land- sat NDVI Time Series to Identify Suitable Image Acquisition Dates for Cannabis Mapping in Afghanistan. Photogrammetrie Fernerkundung Geoinformation . 2014; (5): 383-392.
R Core Team (2014). R: A language and environment for statistical computing. R Foundation for Statistical Computing, Vienna, Austria. URL http://www.R-project.org/.