mexico’s construction industry s-construction... · pdf filegrupo cementos de...
TRANSCRIPT

Mexico’s Construction Industry OverviewApril 2016
Washington, D.C. Mexico City, Mexico Monterrey, Mexico
2.0
4.5
3.53.7
5.4
3.24.3
2.4
1.00.1
1.9
-1.5
-3.7
-2.3-3.4
-1.3
-4.8-5.8
-6.4-6.2
-8.2-7.7
-4.9
-2.0 -2.0 -2.5
-0.2
-3.8
-0.3
2.33.2
3.64.3
6.0
4.9
6.8 6.4
1.0
6.0 5.6
0.9
2.3
4.2
2.3
3.8
2.2
-1.2-1.4
4.6
I II III IV V VI VII VIII IX X XI XII I II III IV V VI VII VIII IX X XI XII I II III IV V VI VII VIII IX X XI XII I II III IV V VI VII VIII IX X XI XII I
49%
75%
51%
25%
0.21 0.24 0.23 0.31 0.42 0.56 0.69 0.85 0.88 0.89 1.1 1.3 1.4 1.6 1.7 1.9 1.9 1.9 2.1 2.3 2.1 2.2 2.2
0%
10%
20%
30%
40%
50%
60%
70%
80%
90%
100%
1993 1994 1995 1996 1997 1998 1999 2000 2001 2002 2003 2004 2005 2006 2007 2008 2009 2010 2011 2012 2013 2014 2015
Private Investment Public Investment
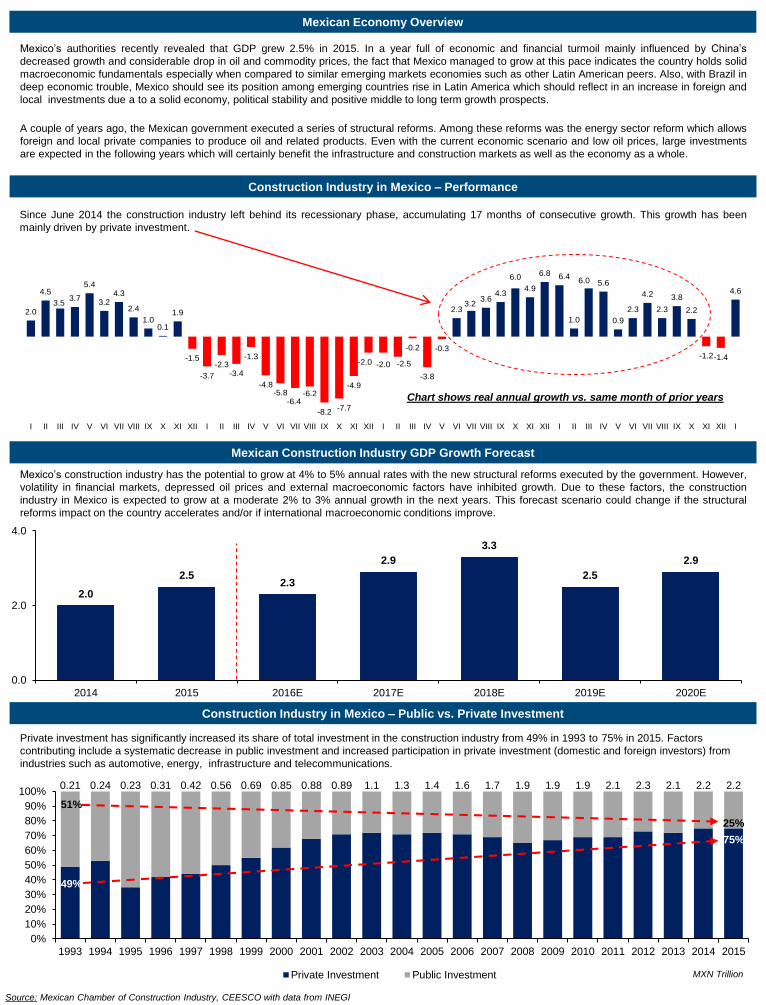
Chart shows real annual growth vs. same month of prior years
Since June 2014 the construction industry left behind its recessionary phase, accumulating 17 months of consecutive growth. This growth has been
mainly driven by private investment.
Construction Industry in Mexico – Performance
Source: Mexican Chamber of Construction Industry, CEESCO with data from INEGI
Mexican Construction Industry GDP Growth Forecast
Construction Industry in Mexico – Public vs. Private Investment
Mexico’s authorities recently revealed that GDP grew 2.5% in 2015. In a year full of economic and financial turmoil mainly influenced by China’s
decreased growth and considerable drop in oil and commodity prices, the fact that Mexico managed to grow at this pace indicates the country holds solid
macroeconomic fundamentals especially when compared to similar emerging markets economies such as other Latin American peers. Also, with Brazil in
deep economic trouble, Mexico should see its position among emerging countries rise in Latin America which should reflect in an increase in foreign and
local investments due a to a solid economy, political stability and positive middle to long term growth prospects.
A couple of years ago, the Mexican government executed a series of structural reforms. Among these reforms was the energy sector reform which allows
foreign and local private companies to produce oil and related products. Even with the current economic scenario and low oil prices, large investments
are expected in the following years which will certainly benefit the infrastructure and construction markets as well as the economy as a whole.
Mexican Economy Overview
MXN Trillion
Mexico’s construction industry has the potential to grow at 4% to 5% annual rates with the new structural reforms executed by the government. However,
volatility in financial markets, depressed oil prices and external macroeconomic factors have inhibited growth. Due to these factors, the construction
industry in Mexico is expected to grow at a moderate 2% to 3% annual growth in the next years. This forecast scenario could change if the structural
reforms impact on the country accelerates and/or if international macroeconomic conditions improve.
2.0
2.52.3
2.9
3.3
2.5
2.9
0.0
2.0
4.0
2014 2015 2016E 2017E 2018E 2019E 2020E
Private investment has significantly increased its share of total investment in the construction industry from 49% in 1993 to 75% in 2015. Factors
contributing include a systematic decrease in public investment and increased participation in private investment (domestic and foreign investors) from
industries such as automotive, energy, infrastructure and telecommunications.
2011 2012 2013 2014 2015EV /
EBITDA
EV /
Sales
CEMEX, S.A.B. de C.V. MEX $0.71 $13,103 18.7% $9,500 $24,991 11.0x 10.7x 11.3x 12.2x 10.7x 10.3x 2.0x
Corporación Moctezuma, SAB de CV MEX $3.38 $640 40.9% $2,973 $2,807 9.2x 8.3x 10.9x 13.0x 11.7x 10.9x NM
Elementia, S.A.B. de C.V. MEX $1.18 $985 17.7% $1,034 $1,337 - - - - 7.5x 7.9x 1.4x
Grupo Cementos de Chihuahua SAB de CV MEX $2.57 $695 21.7% $854 $1,133 13.3x 13.5x 13.2x 10.7x 9.3x 7.8x 1.7x
Grupo Lamosa, SAB de CV MEX $2.04 $617 20.2% $773 $972 7.5x 6.2x 7.2x 8.7x 8.3x 8.1x 1.6x
Mean 10.3x 9.7x 10.6x 11.2x 9.5x 9.0x 1.7x
Median 10.1x 9.5x 11.1x 11.4x 9.3x 8.1x 1.7x
Company Company Country
Annual Avg. EV / EBITDA 4/12/2016Price
4/12/2016
Revenue
US$ MM
EBITDA
Margin
Mkt. Cap
US$ MM
Enterprise
Value
2011 2012 2013 2014 2015EV /
EBITDA
EV /
Sales
Consorcio ARA, S. A. B. de C. V. MEX $0.35 $397 12.4% $460 $503 7.0x 6.8x 9.7x 12.5x 11.3x 9.9x 1.3x
Corpovael, S.A. de C.V. MEX $0.85 $205 18.1% $293 $311 - - - - 11.9x 8.6x 1.6x
Grupo Mexicano de Desarrollo, S.A.B. MEX $1.47 $173 27.6% $245 $452 6.4x 4.9x 4.6x 6.4x 8.5x 9.7x 2.7x
Promotora y Op. de Infraestructura SAB de CV* MEX $12.13 $609 51.1% $5,745 $5,571 10.3x 10.6x 15.8x 18.5x 16.6x 17.0x 9.4x
Mean 6.7x 5.8x 7.2x 9.4x 10.6x 9.4x 1.8x
Median 6.7x 5.8x 7.2x 9.4x 11.3x 9.7x 1.6x
Company Company Country
Annual Avg. EV / EBITDA 4/12/2016Price
4/12/2016
Revenue
US$ MM
EBITDA
Margin
Mkt. Cap
US$ MM
Enterprise
Value
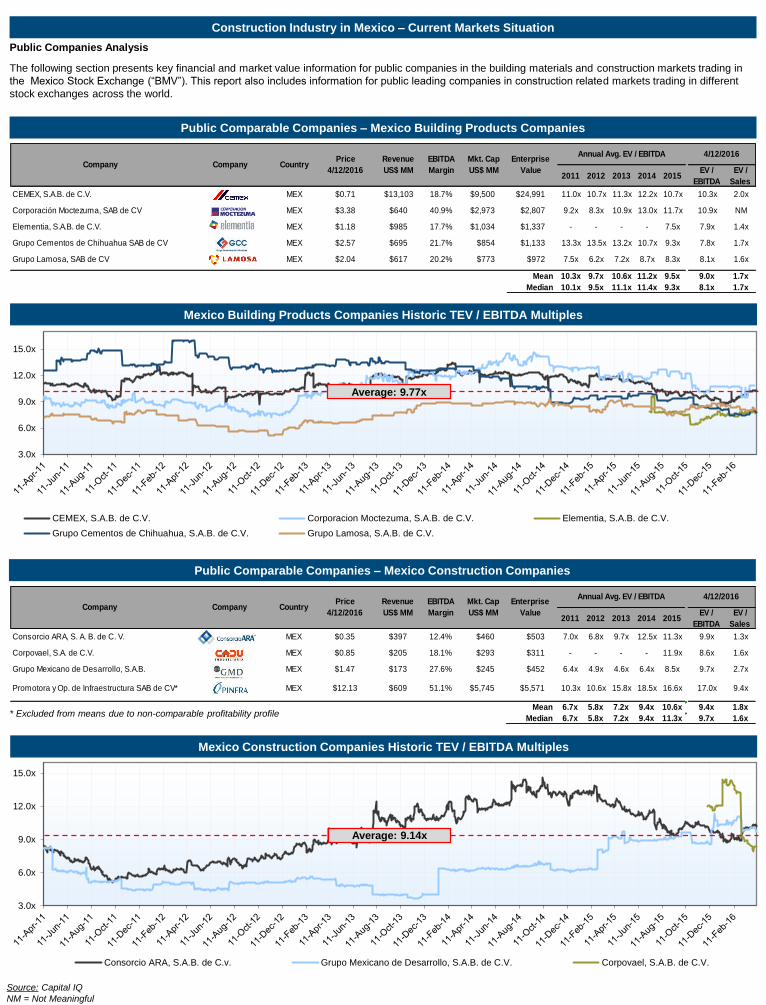
Construction Industry in Mexico – Current Markets Situation
Public Companies Analysis
The following section presents key financial and market value information for public companies in the building materials and construction markets trading in
the Mexico Stock Exchange (“BMV”). This report also includes information for public leading companies in construction related markets trading in different
stock exchanges across the world.
Source: Capital IQ
NM = Not Meaningful
Public Comparable Companies – Mexico Building Products Companies
Mexico Construction Companies Historic TEV / EBITDA Multiples
Public Comparable Companies – Mexico Construction Companies
Mexico Building Products Companies Historic TEV / EBITDA Multiples
* Excluded from means due to non-comparable profitability profile
3.0x
6.0x
9.0x
12.0x
15.0x
CEMEX, S.A.B. de C.V. Corporacion Moctezuma, S.A.B. de C.V. Elementia, S.A.B. de C.V.
Grupo Cementos de Chihuahua, S.A.B. de C.V. Grupo Lamosa, S.A.B. de C.V.
Average: 9.77x
3.0x
6.0x
9.0x
12.0x
15.0x
Consorcio ARA, S.A.B. de C.v. Grupo Mexicano de Desarrollo, S.A.B. de C.V. Corpovael, S.A.B. de C.V.
Average: 9.14x
2011 2012 2013 2014 2015EV /
EBITDA
EV /
Sales
Ashtead Group plc GBR $12.00 $3,427 45.3% $6,021 $9,112 5.7x 6.3x 8.1x 8.8x 8.0x 5.8x 2.6x
Black Diamond Group Limited CAN $3.19 $203 29.9% $131 $253 10.1x 9.3x 9.3x 9.6x 5.5x 4.0x 1.2x
H&E Equipment Services Inc. USA $17.49 $1,040 14.4% $620 $1,491 NM 16.4x 15.0x 15.6x 10.6x 9.9x 1.4x
McGrath Rentcorp USA $23.35 $405 21.3% $557 $937 11.7x 10.3x 12.6x 13.9x 12.0x 10.9x 2.3x
Mobile Mini, Inc. USA $32.62 $531 35.3% $1,450 $2,346 12.8x 11.3x 14.4x 17.8x 15.8x 12.5x 4.4x
Royal Wolf Holdings Limited AUS $0.80 $116 26.0% $80 $165 12.2x 9.3x 10.3x 9.8x 7.5x 5.2x 1.4x
Toromont Industries Ltd. CAN $25.33 $1,299 15.4% $1,972 $2,039 8.1x 8.6x 8.6x 9.1x 10.0x 9.5x 1.5x
United Rentals, Inc. USA $59.58 $5,817 30.9% $5,364 $13,347 13.6x 14.2x 11.4x 11.6x 9.0x 7.4x 2.3x
Mean 10.6x 10.7x 11.2x 12.0x 9.8x 8.2x 2.1x
Median 11.7x 9.8x 10.8x 10.7x 9.5x 8.4x 1.9x
Company Company Country
Annual Avg. EV / EBITDA 4/12/2016Price
4/12/2016
Revenue
US$ MM
EBITDA
Margin
Mkt. Cap
US$ MM
Enterprise
Value
2011 2012 2013 2014 2015EV /
EBITDA
EV /
Sales
Anhui Conch Cement Co. Ltd. CHN $2.78 $7,852 23.2% $14,258 $15,510 11.6x 6.9x 9.1x 6.2x 7.0x 8.5x 2.0x
Cementos Argos S.A. COL $3.85 $2,493 19.3% $4,430 $6,386 NM 19.1x 16.2x 16.0x 14.1x 12.8x 2.5x
Cementos Pacasmayo SAA PER $1.60 $361 31.1% $861 $1,145 10.4x 11.5x 12.4x 8.7x 8.4x 10.1x 3.1x
CEMEX, S.A.B. de C.V. MEX $0.71 $13,103 18.7% $9,500 $24,991 11.0x 10.7x 11.3x 12.2x 10.7x 10.3x 2.0x
China National Building Material Company Limited CHN $0.54 $15,447 15.8% $2,924 $35,391 13.2x 7.8x 10.7x 8.0x 7.3x 14.2x 2.3x
HeidelbergCement AG GER $85.00 $14,633 17.1% $15,974 $23,280 8.2x 7.5x 8.3x 8.5x 8.7x 8.0x 1.5x
LafargeHolcim Ltd. SUI $48.02 $23,555 4.9% $29,142 $51,975 7.6x 8.1x 8.9x 9.2x 10.9x NM 2.1x
Tangshan Jidong Cement Co.,Ltd. CHN $1.68 $2,263 15.5% $2,269 $2,378 14.3x 11.6x 14.0x 11.0x 18.0x 6.8x 1.0x
Mean 10.9x 10.4x 11.3x 10.0x 10.7x 10.1x 2.1x
Median 11.0x 9.4x 11.0x 9.0x 9.7x 10.1x 2.0x
Company Company Country
Annual Avg. EV / EBITDA 4/12/2016Price
4/12/2016
Revenue
US$ MM
EBITDA
Margin
Mkt. Cap
US$ MM
Enterprise
Value
2011 2012 2013 2014 2015EV /
EBITDA
EV /
Sales
Actividades de Construcción y Servicios, S.A. ESP $30.92 $37,938 5.8% $9,423 $15,590 10.7x 6.1x 4.8x 5.7x 6.8x 5.8x 0.4x
Aecon Group Inc. CAN $12.95 $2,103 4.3% $741 $772 NM 8.9x 7.2x 8.2x 7.5x 6.8x 0.3x
AECOM USA $29.77 $18,077 5.5% $4,620 $8,689 7.8x 6.1x 7.7x 8.6x 11.3x 7.9x 0.5x
Granite Construction Incorporated USA $45.37 $2,371 6.8% $1,819 $1,607 9.3x 6.4x 10.9x NM 10.5x 9.6x 0.7x
Hochtief AG GER $126.94 $22,912 4.7% $8,187 $8,532 6.2x 5.4x 4.6x 5.1x 10.3x 6.5x 0.4x
Peab AB SWE $8.61 $5,257 4.2% $2,562 $3,263 9.0x 8.4x 12.7x 13.9x 9.5x 14.2x 0.6x
SNC-Lavalin Group Inc. CAN $35.63 $6,910 6.7% $5,436 $5,109 11.0x 9.8x 14.1x NM 10.3x 10.0x 0.7x
Technip SA FRA $55.51 $11,228 10.3% $6,302 $5,906 8.0x 9.2x 8.9x 6.9x 4.9x 4.6x 0.5x
VINCI S.A. FRA $73.78 $42,705 14.6% $41,798 $57,448 6.9x 6.3x 6.6x 7.5x 8.0x 8.6x 1.3x
Mean 8.6x 7.4x 8.6x 8.0x 8.8x 8.2x 0.6x
Median 8.5x 6.4x 7.7x 7.5x 9.5x 7.9x 0.5x
Company Company Country
Annual Avg. EV / EBITDA 4/12/2016Price
4/12/2016
Revenue
US$ MM
EBITDA
Margin
Mkt. Cap
US$ MM
Enterprise
Value
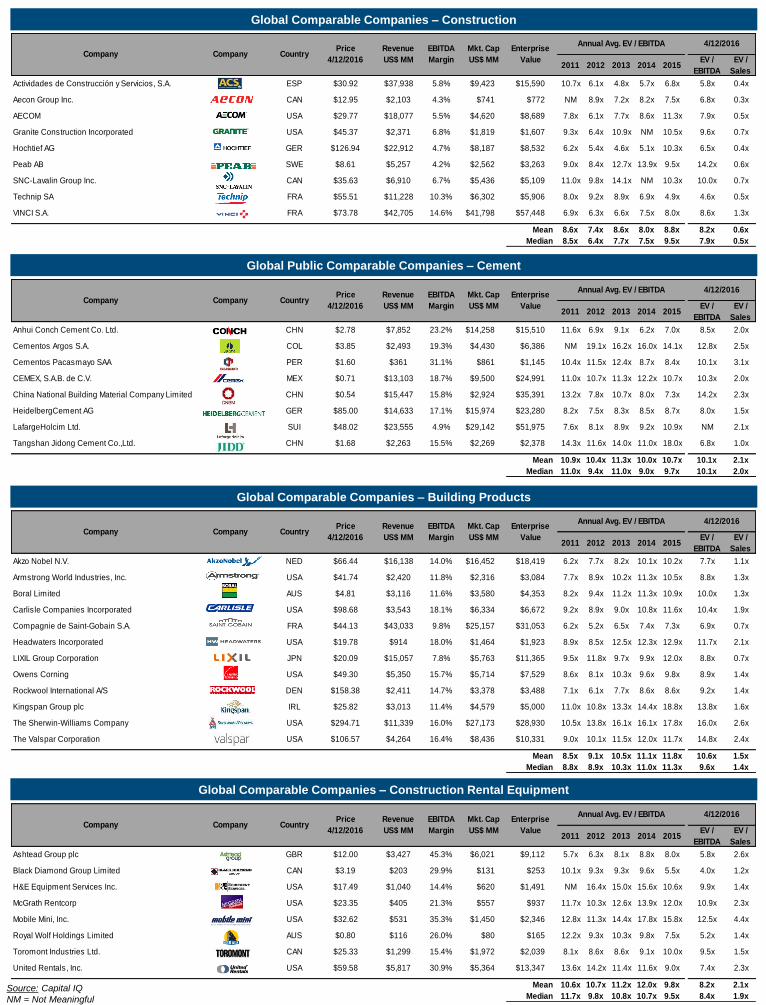
Global Comparable Companies – Construction
Global Public Comparable Companies – Cement
Global Comparable Companies – Building Products
Global Comparable Companies – Construction Rental Equipment
Source: Capital IQ
NM = Not Meaningful
2011 2012 2013 2014 2015EV /
EBITDA
EV /
Sales
Akzo Nobel N.V. NED $66.44 $16,138 14.0% $16,452 $18,419 6.2x 7.7x 8.2x 10.1x 10.2x 7.7x 1.1x
Armstrong World Industries, Inc. USA $41.74 $2,420 11.8% $2,316 $3,084 7.7x 8.9x 10.2x 11.3x 10.5x 8.8x 1.3x
Boral Limited AUS $4.81 $3,116 11.6% $3,580 $4,353 8.2x 9.4x 11.2x 11.3x 10.9x 10.0x 1.3x
Carlisle Companies Incorporated USA $98.68 $3,543 18.1% $6,334 $6,672 9.2x 8.9x 9.0x 10.8x 11.6x 10.4x 1.9x
Compagnie de Saint-Gobain S.A. FRA $44.13 $43,033 9.8% $25,157 $31,053 6.2x 5.2x 6.5x 7.4x 7.3x 6.9x 0.7x
Headwaters Incorporated USA $19.78 $914 18.0% $1,464 $1,923 8.9x 8.5x 12.5x 12.3x 12.9x 11.7x 2.1x
LIXIL Group Corporation JPN $20.09 $15,057 7.8% $5,763 $11,365 9.5x 11.8x 9.7x 9.9x 12.0x 8.8x 0.7x
Owens Corning USA $49.30 $5,350 15.7% $5,714 $7,529 8.6x 8.1x 10.3x 9.6x 9.8x 8.9x 1.4x
Rockwool International A/S DEN $158.38 $2,411 14.7% $3,378 $3,488 7.1x 6.1x 7.7x 8.6x 8.6x 9.2x 1.4x
Kingspan Group plc IRL $25.82 $3,013 11.4% $4,579 $5,000 11.0x 10.8x 13.3x 14.4x 18.8x 13.8x 1.6x
The Sherwin-Williams Company USA $294.71 $11,339 16.0% $27,173 $28,930 10.5x 13.8x 16.1x 16.1x 17.8x 16.0x 2.6x
The Valspar Corporation USA $106.57 $4,264 16.4% $8,436 $10,331 9.0x 10.1x 11.5x 12.0x 11.7x 14.8x 2.4x
Mean 8.5x 9.1x 10.5x 11.1x 11.8x 10.6x 1.5x
Median 8.8x 8.9x 10.3x 11.0x 11.3x 9.6x 1.4x
Company Company Country
Annual Avg. EV / EBITDA 4/12/2016Price
4/12/2016
Revenue
US$ MM
EBITDA
Margin
Mkt. Cap
US$ MM
Enterprise
Value
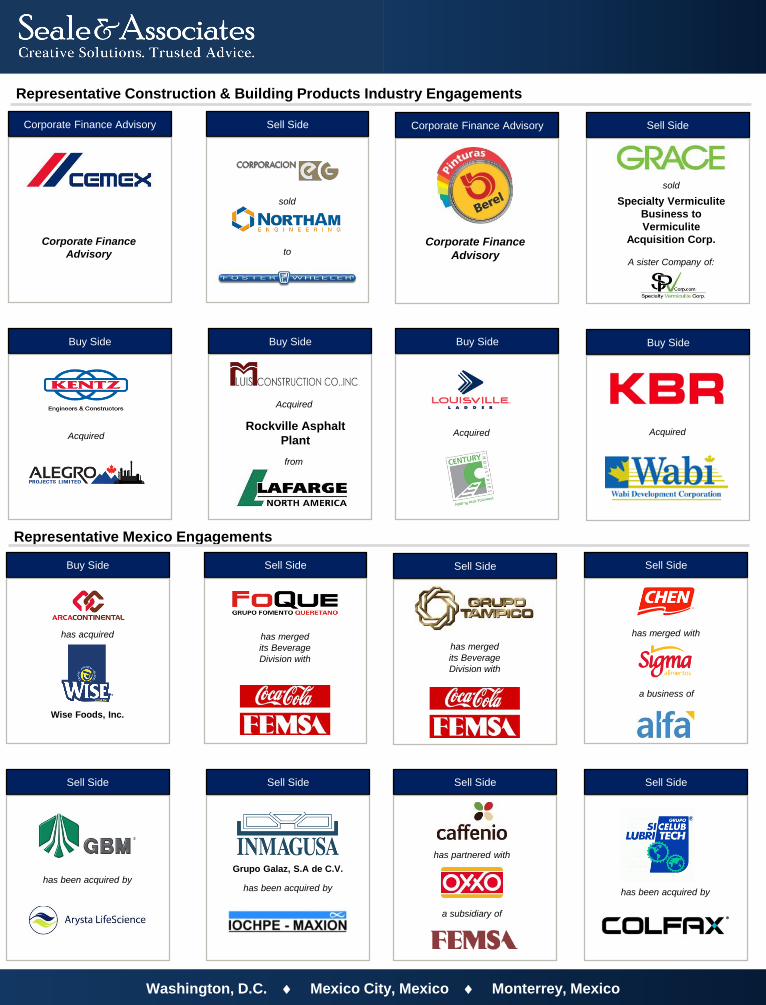
Representative Construction & Building Products Industry Engagements
Corporate Finance Advisory
Buy Side
Corporate Finance AdvisorySell Side
Washington, D.C. Mexico City, Mexico Monterrey, Mexico
Representative Mexico Engagements
Buy Side
has acquired
Wise Foods, Inc.
Sell Side
has merged with
a business of
Sell Side
has been acquired by
Sell Side
has merged
its Beverage
Division with
Sell Side
Grupo Galaz, S.A de C.V.
has been acquired by
Sell Side
has merged
its Beverage
Division with
Sell Side Sell Side
has been acquired by
Corporate Finance
Advisory
Buy Side Buy Side Buy Side
Sell Side
sold
toCorporate Finance
Advisory
AcquiredAcquired
Acquired
from
Rockville Asphalt
PlantAcquired
sold
A sister Company of:
Specialty Vermiculite
Business to
Vermiculite
Acquisition Corp.
has partnered with
a subsidiary of
Mexico Contact Information
James A. Seale
President
Brett M. Carmel
Senior Managing Director
Felipe Bueno Viesca
Managing Director
Adrian E. Llerena
Managing Director
Sergio Garcia del Bosque
Managing Director
Adan Sierra
Vice President
Carlos Hernandez
Vice President
Francisco Viornery
Vice President
Oscar Tapia
Analyst
Since 1999, Seale & Associates has been the trusted advisor to highly
respected public and private companies from around the world, with a
track record of success in a diverse range of industries. Seale is an elite
boutique global investment banking firm with extensive experience in
mergers and acquisitions (M&A), corporate finance advisory, and
enterprise level strategy consulting. Our experienced team of
professionals are committed to serving clients with excellence and
integrity, while offering innovative ideas and solutions to address
complex dealings. All securities related transactions are cleared through
Seale Capital, Inc., a registered broker dealer and member of FINRA
and SIPC.
Washington, D.C. Mexico City, Mexico Monterrey, Mexico
For more information please visit: www.sealeassociates.com
Office Information
950 N. Glebe Road
Suite 950
Arlington, Virginia 22203
Phone: +1 (703) 294 6770
Paseo de la Reforma 115
Col. Lomas de Chapultepec
Mexico City, 11000
Phone: +52 (55) 8000 7463
* Multiple engagements
Advisor to Leading Companies Worldwide
Please contact us if you would like further information about
M&A trends and/or specific transaction multiples for your
industry.