mezzan holding co. (k.s.c) - s3-eu-west … · increased competition from existing and ... the...
TRANSCRIPT

P.O.BOX 1137, PC 111 – CPO, Sultanate of Oman l CR No. 1279406 l Tel: +968 2494 9000 l Fax: +968 2494 9099 l Email: [email protected] l Web: www.u-capital.net 1
MEZZAN HOLDING CO. (K.S.C) TP : KWD 0.820/share
Date 31 May 2018 Recommendation Accumulate
Bloomberg Ticker MEZZAN KK CMP (KWD) – 30/05/2018 0.709 52wk High / Low (KWD) 0.990 / 0.686 12m Average Vol. 217,000 Mkt. Cap. (USD/KWD mn) 734 / 221 Shares Outstanding (mn) 311.3 Free Float (%) 30% P/E 2018e (x) 16.0 P/Bv 2018e (x) 1.9 3m Avg Daily Turnover 183,423 6m Avg Daily Turnover 159,644 Price Performance: 1 month (%) -1.0% 3 month (%) -10.3% 12 month (%) -27.9%
Price Volume Performance:
Hettish Karmani Head of Research [email protected] Tel: 00968 – 2494-9034
We initiate coverage of Mezzan Holding with an Accumulate at a target price of KWD0.820/share, upside of 15.7%. The Company offers entry into the defensive sector of Kuwait via its operations which expand beyond MENA. The company is currently trading at 2018 P/E and P/Bv of 16.0x and 1.9x, respectively and offers a dividend yield of 4.2%. Acquisitions and expansions has been a part of the past and will continue in the future Mezzan Holding is currently working on multiple projects, which at one end are expected to add additional revenue to the topline while on the other hand are expected to reduce its cost by bringing in efficiencies. Company is coming up with two Kitco Chips line, one extruder line, one PET bottling unit in Kuwait and Qatar each. Company is working on two warehouse projects which will streamline its inventory management system. Along with that Mezzan is in final stages of closing a deal in the pharma segment where the Company is planning to acquire a hospital along with its pharmaceutical chain. Revenue to grow at a CAGR of 4.5% during 2018-21 We expect the Company to report revenue CAGR of 4.5% during 2018-21. Revenue is expected to grow from KWD 204.5mn to KWD 243.9mn by 2021. During 2018, revenue is expected to grow by 4.5% as some of the planned expansions in UAE, Qatar and KSA are expected to start commercial operations this year. Full impact of these expansions would be realized in 2019 as most of the expansions are coming online in 2H18. Margins expected to improve going forward In 2018, we expect the gross margins of the Company to be at 25.7% while operating margins of the company to be at 7.0% during 2018 as company is working on multiple warehouse and inventory management system which will aid the company in lowering its cost. Going forward, we expect the Company gross and operating margins to average around 26.2% and 7.2% during our forecast period. Net Income to grow at CAGR of 8.8% during 2018-21 During 2018, we expect the company to report net income of KWD 13.7mn compared to KWD 12.9mn in 2017. We are particularly positive on the fact that the company is delivering on its promises to break-even at the Saudi operation in 2018 after pushing the date couple of times. We expect earnings growth to continue to improve in 2018 after a challenging 2017. Going forward, we expect the company to report net income CAGR of 8.8% during 2018-21. Growth in income is expected to result from improvement in topline along with better cost control which would result in better margins.
Source: Bloomberg
600
650
700
750
800
850
900
950
1,000
0
200
400
600
800
1,000
1,200
1,400
1,600
1,800
2,000
Ma
y-1
7
Jul-
17
Au
g-17
Oct
-17
Dec
-17
Jan
-18
Mar
-18
Ma
y-1
8
Volume (000) - LHS MEZZAN KK (FILS) - RHS

P.O.BOX 1137, PC 111 – CPO, Sultanate of Oman l CR No. 1279406 l Tel: +968 2494 9000 l Fax: +968 2494 9099 l Email: [email protected] l Web: www.u-capital.net 2
Valuation Methodology For arriving at the fair value of the company, we have used a blend of two valuation methods:
Cash flow approach represented by the Discounted Cash Flow Method. (80% weightage)
Relative Valuation approach based on 2018e P/E multiple of the sector. (20% weightage)
Discounted Cash Flow Method – DCF
The DCF is based on a 4-year forecast of free cash flows to the firm (2018-21). The free cash flows for the forecasted period and the terminal value are then discounted back at the weighted average cost of capital (WACC) to arrive at the total net present value (NPV) of the company. Subsequently cash and non-operating assets are added while long-term debt is subtracted to arrive at the equity value. Cost of Equity is derived using the Capital Asset Pricing Model (CAPM). Assumptions: Terminal Growth Rate: 3.0% Risk Free Rate (Kuwait Government 10yr Bond Yield): 4.0% Risk Premium (US): 7.3% Cost of Equity: 11.3% Cost of Debt: 6.0%
Sensitivity Analysis
(KWD '000) 2018e 2019e 2020e 2021e
Free Cash Flow 9,353 14,405 15,164 17,130
Discounted Cash Flow 8,911 12,632 12,238 12,725
Primary Value 46,507
Terminal Value 312,283
NPV of Terminal Value 231,975
Value of Investments 5,651
Cash 15,726
Debt 43,643
Enterprise Value 299,859
Equity Value 256,217
Shares Outstanding (000) 311,300
Per Share Value (KWD) 0.823
Source: U Capital
DISCOUNTED CASH FLOW VALUE
0.823 1.0% 2.0% 3.0% 4.0% 5.0% 0.823 7.0% 8.0% 11.3% 10.0% 11.0%
6.7% 0.866 1.043 1.318 1.800 2.866 4.0% 1.960 1.620 1.017 1.195 1.054
7.7% 0.723 0.844 1.017 1.285 1.756 5.0% 1.620 1.378 0.911 1.054 0.941
8.7% 0.618 0.705 0.823 0.992 1.254 6.0% 1.378 1.195 0.823 0.941 0.848
9.7% 0.537 0.602 0.688 0.803 0.968 7.0% 1.195 1.054 0.750 0.848 0.771
10.7% 0.473 0.524 0.588 0.671 0.784 8.0% 1.054 0.941 0.688 0.771 0.705
Source: U Capital Research
Growth Rate (%) Cost of Equity (%)
WA
CC
(%
)
Co
st
of
Deb
t (%
)
P.O.BOX 1137, PC 111 – CPO, Sultanate of Oman l CR No. 1279406 l Tel: +968 2494 9000 l Fax: +968 2494 9099 l Email: [email protected] l Web: www.u-capital.net 3
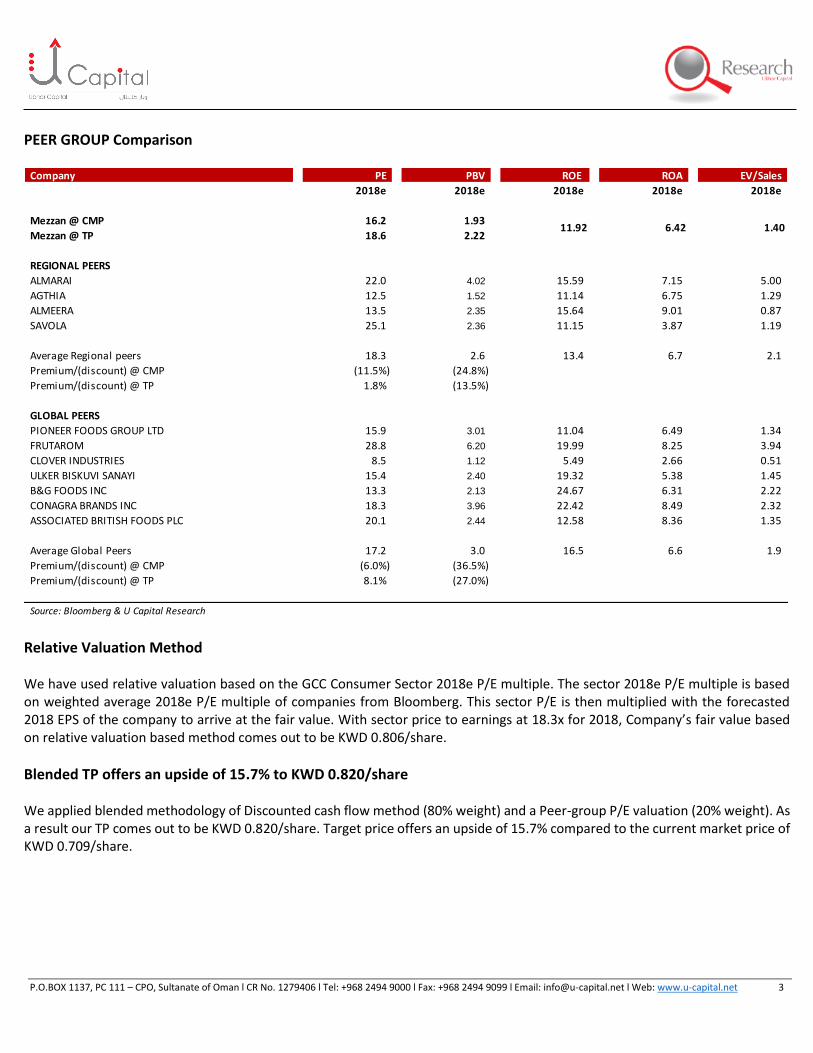
PEER GROUP Comparison
Relative Valuation Method We have used relative valuation based on the GCC Consumer Sector 2018e P/E multiple. The sector 2018e P/E multiple is based on weighted average 2018e P/E multiple of companies from Bloomberg. This sector P/E is then multiplied with the forecasted 2018 EPS of the company to arrive at the fair value. With sector price to earnings at 18.3x for 2018, Company’s fair value based on relative valuation based method comes out to be KWD 0.806/share.
Blended TP offers an upside of 15.7% to KWD 0.820/share We applied blended methodology of Discounted cash flow method (80% weight) and a Peer-group P/E valuation (20% weight). As a result our TP comes out to be KWD 0.820/share. Target price offers an upside of 15.7% compared to the current market price of KWD 0.709/share.
Company PE PBV ROE ROA EV/Sales
2018e 2018e 2018e 2018e 2018e
Mezzan @ CMP 16.2 1.93
Mezzan @ TP 18.6 2.22
REGIONAL PEERS
ALMARAI 22.0 4.02 15.59 7.15 5.00
AGTHIA 12.5 1.52 11.14 6.75 1.29
ALMEERA 13.5 2.35 15.64 9.01 0.87
SAVOLA 25.1 2.36 11.15 3.87 1.19
Average Regional peers 18.3 2.6 13.4 6.7 2.1
Premium/(discount) @ CMP (11.5%) (24.8%)
Premium/(discount) @ TP 1.8% (13.5%)
GLOBAL PEERS
PIONEER FOODS GROUP LTD 15.9 3.01 11.04 6.49 1.34
FRUTAROM 28.8 6.20 19.99 8.25 3.94
CLOVER INDUSTRIES 8.5 1.12 5.49 2.66 0.51
ULKER BISKUVI SANAYI 15.4 2.40 19.32 5.38 1.45
B&G FOODS INC 13.3 2.13 24.67 6.31 2.22
CONAGRA BRANDS INC 18.3 3.96 22.42 8.49 2.32
ASSOCIATED BRITISH FOODS PLC 20.1 2.44 12.58 8.36 1.35
Average Global Peers 17.2 3.0 16.5 6.6 1.9
Premium/(discount) @ CMP (6.0%) (36.5%)
Premium/(discount) @ TP 8.1% (27.0%)
Source: Bloomberg & U Capital Research
11.92 6.42 1.40

P.O.BOX 1137, PC 111 – CPO, Sultanate of Oman l CR No. 1279406 l Tel: +968 2494 9000 l Fax: +968 2494 9099 l Email: [email protected] l Web: www.u-capital.net 4
Risks to Valuation
Exaggeration in geopolitical issues
Rise in prices of raw material
Increased competition from existing and upcoming players
Increase in interest rates making borrowing more expensive
Fall in demand for existing products
Delays in capacity expansions
Breakeven of KSA operation further gets delayed
P.O.BOX 1137, PC 111 – CPO, Sultanate of Oman l CR No. 1279406 l Tel: +968 2494 9000 l Fax: +968 2494 9099 l Email: [email protected] l Web: www.u-capital.net 5
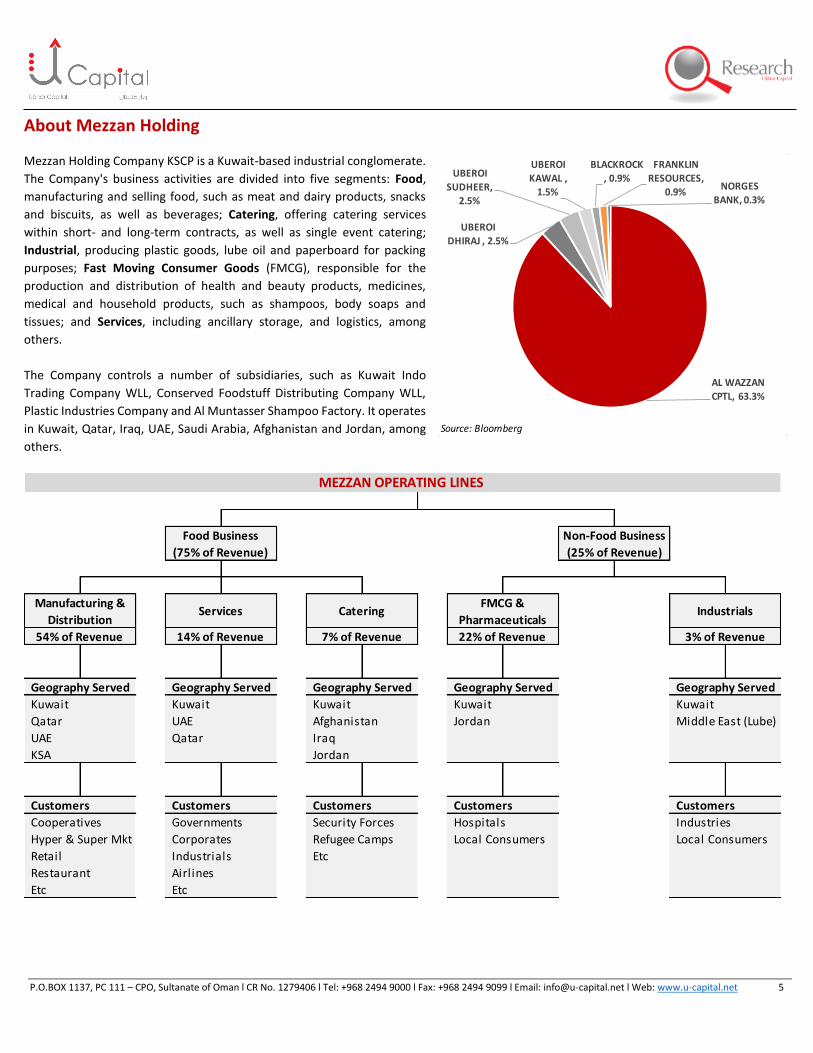
About Mezzan Holding Mezzan Holding Company KSCP is a Kuwait-based industrial conglomerate.
The Company's business activities are divided into five segments: Food,
manufacturing and selling food, such as meat and dairy products, snacks
and biscuits, as well as beverages; Catering, offering catering services
within short- and long-term contracts, as well as single event catering;
Industrial, producing plastic goods, lube oil and paperboard for packing
purposes; Fast Moving Consumer Goods (FMCG), responsible for the
production and distribution of health and beauty products, medicines,
medical and household products, such as shampoos, body soaps and
tissues; and Services, including ancillary storage, and logistics, among
others.
The Company controls a number of subsidiaries, such as Kuwait Indo
Trading Company WLL, Conserved Foodstuff Distributing Company WLL,
Plastic Industries Company and Al Muntasser Shampoo Factory. It operates
in Kuwait, Qatar, Iraq, UAE, Saudi Arabia, Afghanistan and Jordan, among
others.
Kuwait Kuwait Kuwait Kuwait Kuwait
Qatar UAE Afghanistan Jordan Middle East (Lube)
UAE Qatar Iraq
KSA Jordan
Cooperatives Governments Security Forces Hospitals Industries
Hyper & Super Mkt Corporates Refugee Camps Local Consumers Local Consumers
Retail Industrials Etc
Restaurant Airlines
Etc Etc
3% of Revenue22% of Revenue7% of Revenue14% of Revenue54% of Revenue
MEZZAN OPERATING LINES
Catering Manufacturing &
DistributionServices
FMCG &
PharmaceuticalsIndustrials
Food Business
(75% of Revenue)
Non-Food Business
(25% of Revenue)
Geography ServedGeography ServedGeography ServedGeography ServedGeography Served
Customers Customers Customers Customers Customers
Source: Bloomberg
AL WAZZAN
CPTL, 63.3%
UBEROI DHIRAJ , 2.5%
UBEROI
SUDHEER, 2.5%
UBEROI KAWAL ,
1.5%
BLACKROCK , 0.9%
FRANKLIN RESOURCES,
0.9%NORGES
BANK, 0.3%

P.O.BOX 1137, PC 111 – CPO, Sultanate of Oman l CR No. 1279406 l Tel: +968 2494 9000 l Fax: +968 2494 9099 l Email: [email protected] l Web: www.u-capital.net 6
Business Segments Food Business Line:
Manufacturing: Manufacturing division has presence across Kuwait, UAE, Afghanistan and Qatar. The division manufactures food and beverages. Product line includes: Meats, chips, snacks, bottled water, canned food, and baked goods. Key brands under this segment are: Alwazzan, Khazan, Daniah, Dana, Kitco, Aqua Gulf etc.
Distribution: This division has presence in Kuwait, UAE, KSA and Qatar. This division distributes owned brands and global agency brands across the Gulf countries. Currently pursuing an aggressive expansion into the UAE market following the acquisition of Unitra Mets Group (UMG) in January 2014. This division mainly deals with beverages, dairy products, potato chips, biscuits, rice, tuna, sugar, salt, and canned vegetables. Major brands under this segment are: Sara Lee, Betty Crocker, Red Bull, Nature Valley Crunchy & More, Puck, The Three Cows, Lurpak, Green Giant, Cadbury, and Foster Clarks.
Services: This division has presence in Kuwait, UAE and Qatar. This segment provides catering services to corporations, hotels, hospitals and government agencies. Serves over 100,000 meals a day.
Catering: This division has presence in Kuwait, Jordan, Afghanistan and Iraq. This segment provides long term food supply services, from food manufacturing to retail operations. Through this segment the company is tied up with militaries and refugee camps, including the UN World Food Program.
Non-Food Business Line:
FMCG: This segment operated in Kuwait and Jordan. This division distributes various products from 33 global brands through agency agreements and exclusive supplier rights with manufacturers. Major brands under this segment are: Reckitt Benckiser Arabia, Olayan Kimberly Clark, Johnson & Johnson etc. The company also distributes its own Softy brand which owns 66 products.
Pharmaceuticals: This segment operates within Kuwait. This segment distributes medication and healthcare products to the local market and owns and operates 16 pharmaceutical retail outlets. Key medicines sold under this segment are: Zyrtec, Tylenol, Xyzal, Keppra, Seven Seas, Olfen, Misporin, Gaviscon, Betadine, Reparil, Clinil, Rinoclenil, Budair, Somatostatin, Kordel’s, and Hermesetas.
Industrials: Mezzan’s Industrial business division operates in Kuwait, KSA, Jordan, Qatar and Iraq. This segment deals into following three products:
Plastics: This division supplies packaging materials and other plastic products to companies in Iraq, Saudi Arabia, Jordan and Qatar through Kuwait-based manufacturing facilities.
Cartons: This division is to serve the internal demand of packaging materials within various other sub-segments such as water bottle trays, carton boxes for meat and snacks.
Lube Oil: The Company produces lube oil and recycles oil byproducts to produce motor oil, diesel oil, hydraulic oil, gear oil, radiator water, mould release oil etc.

P.O.BOX 1137, PC 111 – CPO, Sultanate of Oman l CR No. 1279406 l Tel: +968 2494 9000 l Fax: +968 2494 9099 l Email: [email protected] l Web: www.u-capital.net 7
Major Historical Events:
2013 Contracted services to Syrian refugee camps in Jordan
Awarded five-year sub-contract with ANHAM FZCO
2014 Acquired UAE-based Unitra Mets Group
Contracted to provide ration packages for Syrian refugee in Iraq
Consolidated Kitco Group by buying 49% shares from Oberoi Family
Acquired distribution rights for Starbucks chilled beverage products and for Dr. Scholl’s
2015 Completed the construction of new Kettle Cooked chips line with a capacity of 18m packs.
A new water bottling line was introduced. Lifting production capacity from 23,000 bottles an hour to 56,000 bottles per hour
Went public at an IPO price of KWD 0.740/share in June 2015
2016 Entered the Saudi market through a strategic acquisition of 70% of Al Safi Foods Company (now rebranded to Mezzan Food), and in partnership with Al Faisaliah Group.
Launch of Azraq Camp store in Jordan
Acquisition of Danone Business
New management team in place in the Company
2017 Qatar blockade: Supply chain complexities, disruption of raw materials
Busy capex year with new water line completing ahead of time and warehouse project in UAE on time
MOH Kuwait delay in tenders and price reduction drags on FMCG Performance
Services sector experiencing challenges in Afghanistan as US stopped order amid a revamp of its security and procedures
Delays in the Kuwait Warehouse and UAE chips line project
Co ops in Kuwait introduced new inventory management system which halted Mezzan sales
Implementation of excise duty in UAE on select categories ahead – impact to be assessed in Q4’17
Mezzan enters into a factoring agreement to ease cash flow pressure from receivables
P.O.BOX 1137, PC 111 – CPO, Sultanate of Oman l CR No. 1279406 l Tel: +968 2494 9000 l Fax: +968 2494 9099 l Email: [email protected] l Web: www.u-capital.net 8
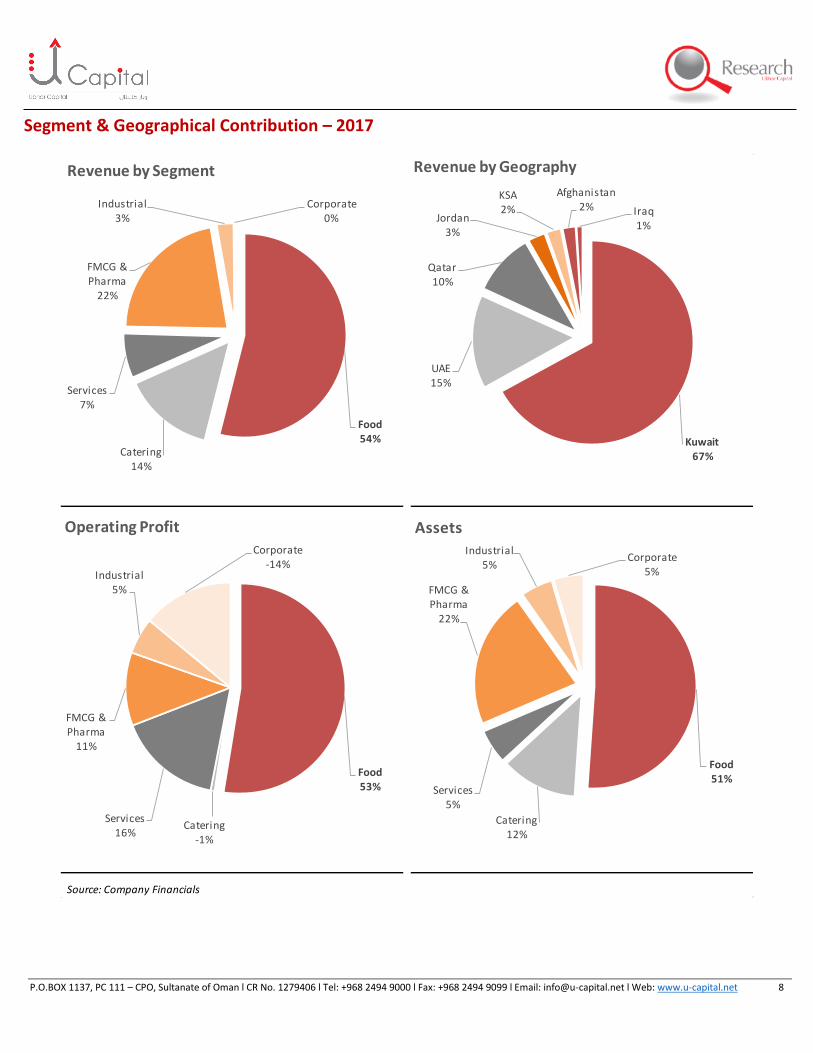
Segment & Geographical Contribution – 2017
Source: Company Financials
Food54%
Catering14%
Services7%
FMCG & Pharma
22%
Industrial3%
Corporate0%
Revenue by Segment
Food53%
Catering-1%
Services16%
FMCG & Pharma
11%
Industrial5%
Corporate-14%
Operating Profit
Food51%
Catering12%
Services5%
FMCG & Pharma
22%
Industrial5%
Corporate5%
Assets
Kuwait67%
UAE15%
Qatar10%
Jordan3%
KSA2%
Afghanistan2% Iraq
1%
Revenue by Geography

P.O.BOX 1137, PC 111 – CPO, Sultanate of Oman l CR No. 1279406 l Tel: +968 2494 9000 l Fax: +968 2494 9099 l Email: [email protected] l Web: www.u-capital.net 9
Investment Rationale Expansions in multiple segments Mezzan Holding is currently working on multiple projects, which at one end are expected to add additional revenue to the topline while on the other hand are expected to reduce its cost by bringing in effeciences. Company is coming up with 2 Kitco Chips line, One extruder line, one PET bottling unit in Kuwait and in Qatar each along with that Mezzan is in final stages of closing a deal in the medicine segment where the Company is planning to acquire a hospital along with pharmaceutical chain. Overall, the capital expenditure of the Company on its upcoming projects for the year 2018 and 2019 would range between KWD 8-10mn, which is much lesser than the levels seen in 2017.
Growth / New Plants Warehouses PET Bottle Plant
KITCO Chips UAE 3Q18 UAE - UAR 3Q18 PET Kuwait 2Q18
KITCO Chips Qatar 3Q18 Kuwait JAWS 2 4Q18 PET Qatar 2Q18
KITCO Extruder, KSA 4Q18
Note: Dates mentioned indicate timing of start of commercial operation
PET manufacturing facilities in Qatar and Kuwait Mezzan is planning to install two PET manufacturing facilities, one in Qatar and and the other one in Kuwait at a combined capital expenditure of ~KWD 3.5mn. Although no such guidline was given by the management in terms of how much margin improvement will be seen, we however believe that the integration of these units would give more control over the raw materials and aid in margin improvement. To facilitate the movement of raw materials for its bottling unit in Qatar, Mezzan in mid last year opened new shipping routes with Oman after its earlier source of raw materials from Saudi Arabia were halted due to Saudi Arabia/UAE led diplomatic cut of Qatar. Company also expedited its new bottled water line in Kuwait so as to reduce its reliance on Qatar’s bottled water operations.

P.O.BOX 1137, PC 111 – CPO, Sultanate of Oman l CR No. 1279406 l Tel: +968 2494 9000 l Fax: +968 2494 9099 l Email: [email protected] l Web: www.u-capital.net 10
Chips Line and Extruder Lines Mezzan Holding will be coming with two KITCO chips line, one in Qatar and one in UAE. The expansion in this segment was initiated because of constraints in the existing snack lines. The incremental capacity of these two lines combined is 1000 kgs/ hour and both are expected to commence operation in 3Q18. Company is also coming up with an extruder chips line in Saudi Arabia, which is expected to commence operations by 4Q18. Warehouses in Kuwait and UAE Mezzan is constructing two warehouses, one in UAE and the other in Kuwait. Um Al Ramoul warehouse in UAE is expected to commence operation in 3Q18 with an estimated capital expenditure of KWD 4mn while JAWS 2 warehouse in Kuwait is expected to commence operation in 4Q18 with almost same capital expenditure as of UAE. Both the facilities will aid the Company in cost savings and better inventory control and would result in cost savings of KWD 1-1.5mn per annum starting 2019. KSA: Turn Around Plan Mezzan acquired controlling stake (70%) in Al Safi Food Company in 3Q16, in a move described as its “first real entry” into the kingdom’s food manufacturing and distribution sector. Under the terms of the deal, Al Safi was renamed Mezzan Food Company, and got exclusive rights to import, manufacture, sell and distribute all Mezzan Holding brands in Saudi Arabia, and will also continue to manufacture, market and distribute Al Faisaliah Group’s bakery and snack products. Mezzan Holding is exploiting Saudi operations to serve Kuwait at lower cost. Company will also deploy injected capital in expanding new product lines and build new factories to serve Saudi from within Saudi, and serve growing demand in Kuwait through Saudi. The Company Al Safi Foods was acquired in a start-up phase and at that time faced various challenges and the operation were expected to breakeven by end of 2017, which have now been pushed into 2018. Company expect Saudi operations to add 5-10% to the total revenue by 2019. Acquiring a Hospital/Pharmaceutical chain Mezzan Holding is in the process of acquiring a hospital/pharmaceutical chain in Kuwait. Although no details of the deal were given as the process is currently ongoing, we believe amongst the two listed healthcare providers i.e. Advanced Technology Company and YIACO Medical Company, the later fits more into the area they are targetting. Having said that it could be any company apart from the public listed ones as well, as the Company has not disclosed wether it would be a public listed company or not.

P.O.BOX 1137, PC 111 – CPO, Sultanate of Oman l CR No. 1279406 l Tel: +968 2494 9000 l Fax: +968 2494 9099 l Email: [email protected] l Web: www.u-capital.net 11
Headwinds Excise Duty on Energy Drinks in UAE UAE in October 2017 applied excise tax on tobacco and energy drinks at the rate of 100 percent, while 50 percent tax was imposed on soft drinks. Mezzan is the sole distributor of famous energy drink Red Bull in UAE which is very popular amongst the youth. However with implementation of excise tax, the prices rose which resulted in drop in sales in UAE in 4Q17 by over 38%. Company management is of the view that sales will recover in 1-2 years time. However we are of the opinion that the competition has intensified in that segment and many new products have hit the market as well. We continue to see lower sales from Red Bull segment in UAE. To control the impact of the drop in sales, Mezzan is taking measures to reduce the cost structure relating to the Red Bull segment. It will also emphasize more on KITCO brand to drive growth in UAE. The new chips line is expected to come on-line in 3Q18. Qatar Operations Post the dplomatic cut by Saudi Arabia and UAE in June 2017, Mezzan Holding operations in Qatar also got affected. Although revenue rose during 2017 by 3.2%, supply chain disruptions lead to initial added Expenses which dropped the net income of Qatar operations by 26%. Due to geopolitical tensions, Company’s bottled water capacity in Qatar faced some constraints. Mezzan’s water bottling plant in Qatar which was utilized to export additional produce is facing headwinds because of inability to export. However, the company is currently looking for outlets outside the GCC to export its bottled water. We believe with the new tie-ups framed by the government in facilitating trade, Mezzan would be easily able to export its produce, however, it will increase the transportation expense of the company and hence would lower the margins. Secondly, Mezzan Holding will be adding KITCO chips line in Qatar. For the time being this will offset the drop in revenue from bottling segment of Qatar. Ban on bottled water exports from Kuwait In 4Q17, Kuwaiti government announced a ban on bottled water exports from Kuwait. Following the opening of the new 100,000 bottles/hour water line in Kuwait in 3Q17, Mezzan’s bottled water distribution coverage doubled during the period. The company also planned to export excess produce. The ban is likely to restrict distribution coverage growth and export capabilities and with increasing competition from other producers, the prices are expected to fall as well.

P.O.BOX 1137, PC 111 – CPO, Sultanate of Oman l CR No. 1279406 l Tel: +968 2494 9000 l Fax: +968 2494 9099 l Email: [email protected] l Web: www.u-capital.net 12
Financial Performance & Outlook Revenue to grow at a CAGR of 4.5% during 2018-21 The year 2017 came with many challenges for the Company, the main being the supply disruption in Qatar because of blockade and introduction of new inventory management system by co-ops in Kuwait. Overall, Company reported revenue of KWD 204.5mn in 2017, which was down by 1.4%. The food business line accounted for 75.4% of revenue. Total revenue for the food business line reached KWD154.2mn, a slight decrease of 0.7% compared with the same period in 2016. The non-food business line accounted for 24.6% of revenue. Revenue from non-food business line reached KWD50.3mn, a decrease of 3.3% compared with the same period in 2016. In terms of geographical performance, KSA revenues rose the most. Revenue grew by 243.5% as Mezzan continues to focus on gaining a foothold in the region’s largest consumer market. Revenue in the main market, Kuwait grew by 1.8% due to steady performance as the local retail market returns to buoyancy. Despite supply chain and other issues, Qatar revenue rose by 3.2%. Revenue in UAE decreased by 12.7% due to lower exports to Qatar and the impact of excise tax introduced in October 2017. While revenue from Afghanistan decreased by 16.1% as operations were suspended for three months during the year.
During 1Q18, Company reported revenue of KWD 58.8mn, up 2.2% from 1Q17. The food business line accounted for 67.8% of revenue at KWD39.9mn, a decrease of 0.5% compared with the same period in 2017. The non-food business line accounted for 32.2% of revenue and reached KWD18.9mn, an increase 8.4% compared with the same period in 2017. Geography wise, Kuwait revenue rose the most by 10% while revenue from UAE dropped the most by 29.2% due to impact of excise tax in Oct-17 and general market competition. Going forward, we expect the Company to report CAGR of 4.5% during 2018-21. Revenue is expected to grow from KWD 204.5mn to KWD 243.9mn by 2021. During 2018, revenue is expected to grow by 4.5% as some of the planned expansions in UAE, Qatar and KSA are expected to start commercial operations this year. Full impact of these expansions would be realized in 2019 as most of the expansions are coming online in 2H18.
Revenue (KWD mn)
Souce: Company Report & U Capital
(5.0)
-
5.0
10.0
15.0
20.0
25.0
2015 2016 2017 2018e 2019e 2020e 2021e
Food Non Food Corporate

P.O.BOX 1137, PC 111 – CPO, Sultanate of Oman l CR No. 1279406 l Tel: +968 2494 9000 l Fax: +968 2494 9099 l Email: [email protected] l Web: www.u-capital.net 13
Margins expected to improve going forward
During 2017, cost of sales dropped by 2% to KWD 151mn compared to KWD 153.6mn in 2016. Active management of its raw materials and better management at its warehouses resulted in drop in cost which resulted in slight increase in its margins for 2017. Gross margins during the year rose to 26.1% in 2017 from 25.9% in 2016. However, operating margins dropped during the year to 7.0% from 8.8% in 2016 due to supply chain issues in Qatar whereby company had to redirect the raw materials from different location along with issues in other segment. Operating margins of its FMCG/Pharma and food manufacturing segment dropped to 4.9% and 9.1% in 2017 from 8.9% and 11.4% in 2016, respectively. Catering business continued to remain in losses during 2017 owing to challenges arising at Afghanistan as US stopped order amid a revamp of its security and procedures.
During 1Q18, margins remained under pressure as well reason being continuation of low margin tender business pressuring service segment and higher operating expenses in UAE post implementation of excise and VAT. Gross margins dropped to 22.7% from 26.4% in 1Q17 while operating margins dropped to 9.8% from 10.5% in the same period last year. In 2018, we expect the gross margins of the Company to be at 25.7% while operating margins of the company to be at 7.0% during 2018 as company is working on multiple warehouse and inventory management system which will aid the company in lowering its cost. Going forward, we expect the Company gross and operating margins to average around 26.2% and 7.2% during our forecast period.
Margins (%)
Souce: Company Report & U Capital
25.8% 25.9% 26.1% 25.7% 26.2% 26.4% 26.6%
8.6% 8.8%7.0% 7.0% 7.1% 7.3% 7.5%
2015 2016 2017 2018e 2019e 2020e 2021e
Gross Margins Operating Margins
Operating Expenses (KWD mn)
Souce: Company Report & U Capital
-
5
10
15
20
25
30
2015 2016 2017 2018e 2019e 2020e 2021e
General & Adm. Expenses Selling & Dis. Expenses

P.O.BOX 1137, PC 111 – CPO, Sultanate of Oman l CR No. 1279406 l Tel: +968 2494 9000 l Fax: +968 2494 9099 l Email: [email protected] l Web: www.u-capital.net 14
Net profit to grow by 6% during 2018 and at a CAGR of 8.8% during 2018-21 As a result of the expansion and growth in the past, net profit of the Company grew at a CAGR of 7.7% over 2012-17. In 2017, company profitability dropped to KWD 12.9mn from KWD 17.2mn in 2016. The year came with numerous unanticipated one-off external factors that challenged profitability and helped the Company in identifying areas for further improvement.
In 1Q18, net profitability of the Company dropped by 6% to KWD 4.9mn compared to KWD 5.3mn in similar period last year. Effective 1 January 2018, new IFRS standards 15 and 9 for revenue and investments resulted in changes in accounting treatment of sales returns, selling and distribution expenses relating to customers and investments and trade receivables. If this impact is taken into account, then the profitability drop would have been only 2%. During 2018, we expect the company to report net income of KWD 13.7mn compared to KWD 12.9mn in 2017. We are particularly positive on the fact that the company is delivering on its promises to break-even at the Saudi operation in 2018 after pushing the date couple of times. We expect earnings growth to continue to improve in 2018 after a challenging 2017 (Qatar blockade, regulatory changes related to export restrictions from Qatar and VAT/excise taxes in UAE and KSA). Going forward, we expect the company to report net income CAGR of 8.8% during 2018-21. Growth in income is expected to result from improvement in topline along with better cost control which would result in better margins. Dividends to increase gradually Mezzan Holding on average pays 50% of its income as dividends. Due to high capex incurred in 2017 which will continue in 2018, we expect the payout to remain low for 2018. However, once Mezzan recovers from the impact of the geo-political disruptions and the fruits of capacity expansion start to bear, we expect the dividend payout to rise over 50% post 2019, implying dividend payments of over KWD 10mn 2020 onwards and a dividend yield reaching 5.6%.
Net Income
Souce: Company Report & U Capital
-40.0%
-20.0%
0.0%
20.0%
40.0%
-
5.0
10.0
15.0
20.0
25.0
2015 2016 2017 2018e 2019e 2020e 2021e
Net Income (KWD mn) Growth - %

P.O.BOX 1137, PC 111 – CPO, Sultanate of Oman l CR No. 1279406 l Tel: +968 2494 9000 l Fax: +968 2494 9099 l Email: [email protected] l Web: www.u-capital.net 15
Financial Statements(KWD 000) 2015 2016 2017 2018e 2019e 2020e 2021e
Revenue 196,129 207,433 204,548 213,724 223,331 233,391 243,924
Cost of Sales (145,588) (153,665) (151,110) (158,794) (164,857) (171,714) (179,113)
Gross Profit 50,541 53,768 53,438 54,930 58,474 61,677 64,811
S G & A (33,623) (35,570) (39,094) (40,042) (42,546) (44,707) (46,493)
Operating Profit 16,918 18,198 14,344 14,887 15,928 16,970 18,318
Financial Charges (976) (1,368) (2,188) (2,158) (2,077) (1,990) (1,905)
Other Income 4,763 1,577 1,428 1,710 1,990 2,198 2,399
Profit Before Taxation 20,704 18,407 13,584 14,440 15,842 17,178 18,812
Taxes & Other Expenses (776) (895) (726) (765) (830) (891) (966)
Zakat & Minority Interest (491) (332) 81 86 94 102 112
Net Profit 19,437 17,180 12,939 13,760 15,106 16,389 17,958
Cash and Bank Balance 7,681 18,157 15,726 12,783 14,013 14,815 19,229
Receivables and Prepayments 55,065 69,790 60,166 60,311 59,963 61,385 63,186
Inventories 36,827 36,609 37,516 37,626 39,077 40,708 41,467
Other Current Assets 49 41 37 37 37 37 37
Total Current Assets 99,622 124,597 113,445 110,757 113,089 116,944 123,920
Investments 6,900 6,866 6,761 6,809 6,858 6,908 6,960
Intangible Assets 12,480 13,823 13,567 13,252 12,945 12,644 12,351
Net Fixed Assets 61,329 66,405 77,114 80,759 84,623 87,136 89,774
Total Fixed Assets 80,709 87,094 97,442 100,820 104,426 106,688 109,085
Total Assets 180,331 211,692 210,887 211,577 217,515 223,632 233,005
Accounts Payables 35,436 44,597 40,689 37,626 39,536 41,665 43,965
Short-term Loan 21,034 32,627 39,652 37,835 36,017 34,200 32,383
Other Current Liabilities 15,224 11,535 7,020 7,405 7,311 7,418 7,448
Long-term Debt 4,608 7,158 3,991 3,808 3,625 3,442 3,260
Employee End-of-Service Benefits 3,997 4,073 4,449 4,860 5,308 5,798 6,333
Share Capital 29,650 31,133 31,133 31,133 31,133 31,133 31,133
Retained Earnings 40,874 44,803 46,296 48,452 51,051 53,109 57,965
Other Reserves 26,952 30,418 32,694 35,582 38,750 42,186 45,948
Total Shareholders Equity 97,476 106,354 110,123 115,167 120,934 126,427 135,046
Minority Interest 2,556 5,347 4,963 4,877 4,783 4,681 4,569
Total Equity & Liability 180,331 211,692 210,887 211,577 217,515 223,632 233,005
Cash Flow from Operating Activities 11,737 17,582 24,659 18,277 23,799 23,438 25,787
Cash Flow from Investing Activities (2,105) (7,580) (16,365) (8,731) (9,059) (7,858) (8,158)
Cash Flow from Financing Activities (15,046) 4,278 (6,579) (12,489) (13,509) (14,778) (13,214)
Change in Cash (6,497) 13,783 1,206 (2,944) 1,230 802 4,415
Net Cash at End 7,681 18,157 15,726 12,783 14,013 14,815 19,229
Gross Margin 25.8% 25.9% 26.1% 25.7% 26.2% 26.4% 26.6%
Operating Margin 8.6% 8.8% 7.0% 7.0% 7.1% 7.3% 7.5%
Net Margin 9.9% 8.3% 6.3% 6.4% 6.8% 7.0% 7.4%
Return on Assets 10.8% 8.1% 6.1% 6.5% 6.9% 7.3% 7.7%
Return on Equity 19.9% 16.2% 11.7% 11.9% 12.5% 13.0% 13.3%
Quick Ratio (x) 0.9 1.0 0.9 0.9 0.9 0.9 1.0
Debt / Equity (x) 0.4 0.5 0.5 0.4 0.4 0.4 0.3
Adj. EPS (KWD) 0.062 0.055 0.042 0.044 0.049 0.053 0.058
Adj. Book Value Per Share (KWD) 0.313 0.342 0.354 0.370 0.388 0.406 0.434
Market Price (KWD) * 1.104 0.930 0.775 0.709 0.709 0.709 0.709
Market Capitalization (KWD 000) 327,336 289,509 241,258 220,712 220,712 220,712 220,712
Dividend Yield 2.5% 3.0% 3.6% 4.2% 4.9% 4.9% 5.6%
P/E Ratio (x) 16.8 16.9 18.6 16.0 14.6 13.5 12.3
P/BV Ratio (x) 3.4 2.7 2.2 1.9 1.8 1.7 1.6
Source: Company Reports & U Capital Research
* Market price for 2018 and subsequent years as per closing prices on May 30, 2018
INCOME STATEMENT
CASH FLOW STATEMENT
RATIO ANALYSIS
BALANCE SHEET

P.O.BOX 1137, PC 111 – CPO, Sultanate of Oman l CR No. 1279406 l Tel: +968 2494 9000 l Fax: +968 2494 9099 l Email: [email protected] l Web: www.u-capital.net 16
Recommendation Scale BUY Greater than 20%
ACCUMULATE Between +10% and +20%
HOLD Between +10% and -10%
REDUCE Between -10% and -20%
SELL Lower than -20%
Ubhar Capital SAOC (U Capital)
Website: www.u-capital.net PO Box 1137
PC 111, Sultanate of Oman Tel: +968 2494 9000 Fax: +968 2494 9099
Email: [email protected]
Disclaimer: This report has been prepared by research department in Ubhar Capital SAOC (U Capital), and is provided for information purposes only. Under no circumstances is to be used or considered as an offer to sell or solicitation of any offer to buy. While all reasonable care has been taken to ensure that the information contained therein is not untrue or misleading at the time of publication, we make no representation as to its accuracy or completeness and it should not be relied upon as such, and the Company accepts no responsibility whatsoever for any direct or indirect consequential loss arising from any use of this report or its contents. All opinions and estimates included in this document constitute U Capital’s Research department judgment as of the date of production of this report, and are subject to change without notice. This report may not be reproduced, distributed or published by any recipient for any purpose.