mg grinding day at p&g 2010pdf
TRANSCRIPT

Milling WorkshopP&G Technical Centre
Longbenton24th February 2010
Mojtaba Ghadiri
Iain Crosley
John Sherwood
Introduction
Industrial Relevance & Key issues
• Selection of appropriate mills is conducted by trial and error – particularly true for organic solids for which our fundamental understanding is limited.
• Costly and time consuming

Milling Issues
Process Engineering:• Scaling of power consumption, energy utilisation and capacity• Milling aids• Method of application of stresses, i.e. point loading,
distributed loading or loading accompanied by frictional traction, etc.
Material-Related Issues:• Feed and product characteristics
• Smallest possible particle size which could be comminuted.• Size distribution of comminuted materials for feed materials larger
than this limit.• Level of stresses required for comminution to a certain size
range.• Mechanical activation and mechanochemical processing
Energy Laws
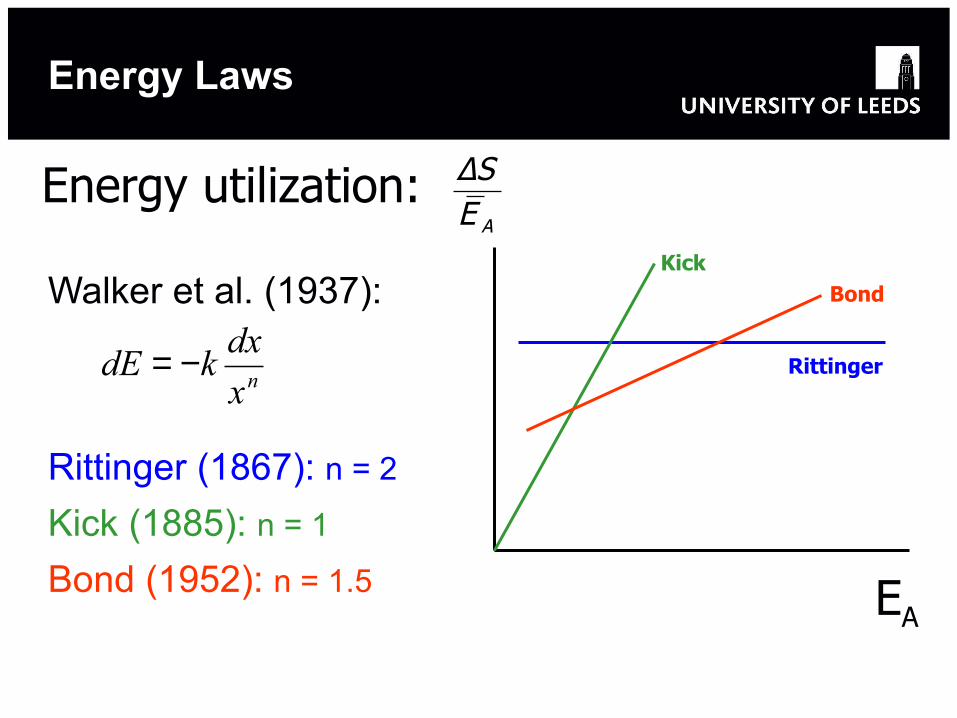
Walker et al. (1937):
Rittinger (1867): n = 2
Kick (1885): n = 1
Bond (1952): n = 1.5
nx
dxkdE −=
Bond
Rittinger
Kick
Energy utilization: AESΔ
EA

Coupled Effects of Process Engineering – Product Characteristics
Polymorphic form- Phase change - Product size range
Product Quality- Amorphous content and stability -
Methods of Stressing Particles
1. Impact
2. Compression
3. Shear
4. Attrition
Milling is an art at present. The science of size reduction is at its infancy and cannot yet satisfy the demands of industry. As a simple example, we cannot even predict the size distribution of a given material impacting on a single rigid target! Empiricism is still the order of the day.

Scope of Lectures
• Equipment: Iain Crosley
• Product characteristics affected by the process and feed: John Sherwood
• Fundamentals: Mojtaba Ghadiri
School of somethingFACULTY OF OTHER
Putting Science into the Art of Milling
Procter & Gamble Grinding Day24th February 2010
Mojtaba Ghadiri
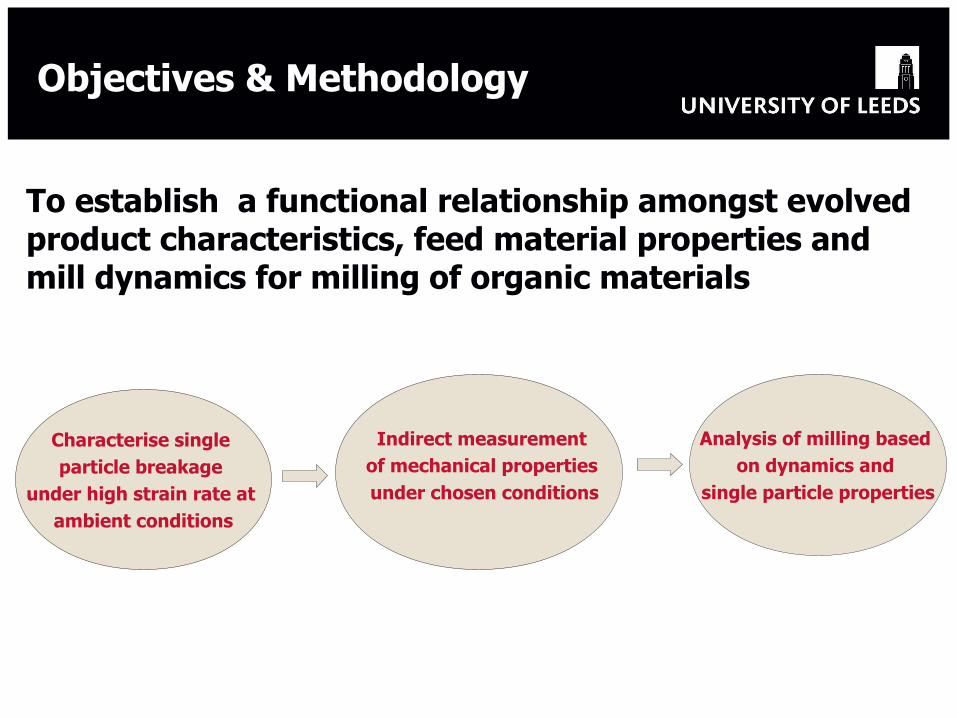
Objectives & Methodology
To establish a functional relationship amongst evolved product characteristics, feed material properties and mill dynamics for milling of organic materials
Characterise single particle breakage
under high strain rate at ambient conditions
Analysis of milling based on dynamics and
single particle properties
Indirect measurement of mechanical properties under chosen conditions
10
�
�(a)
�
�(c)
�
�(b)
�
�(d)
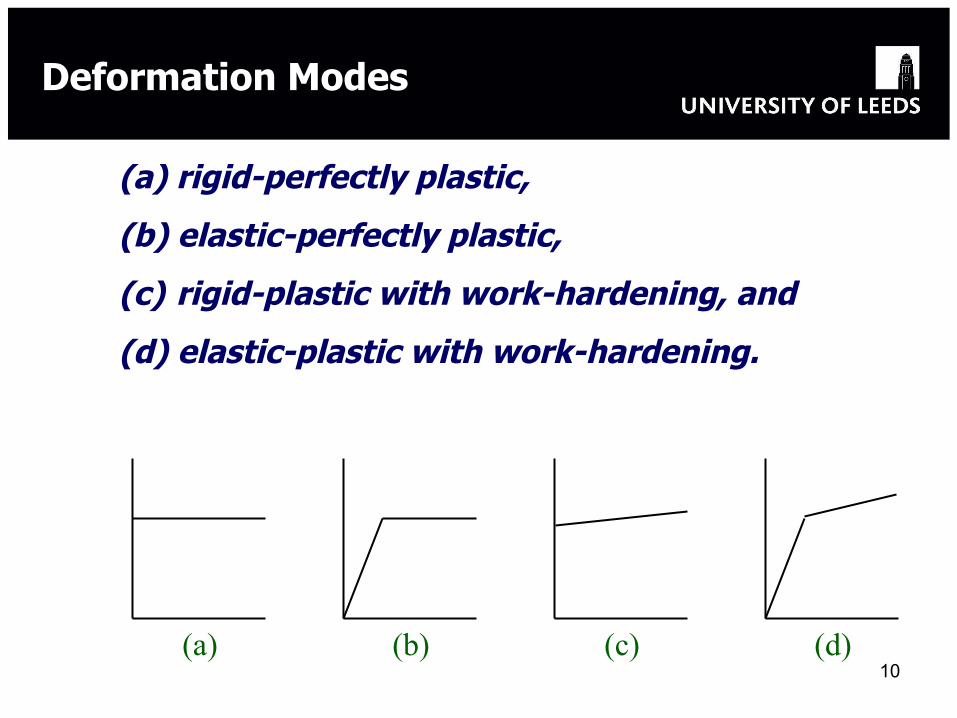
(a) rigid-perfectly plastic,
(b) elastic-perfectly plastic,
(c) rigid-plastic with work-hardening, and
(d) elastic-plastic with work-hardening.
Deformation Modes
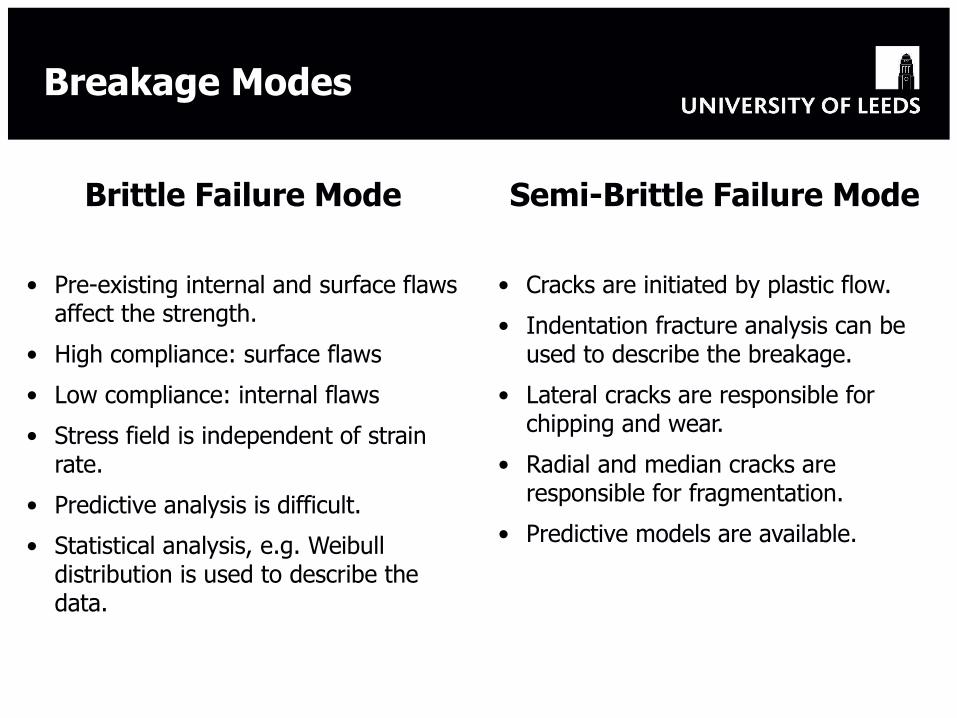
Breakage Modes
Brittle Failure Mode
• Pre-existing internal and surface flaws affect the strength.
• High compliance: surface flaws
• Low compliance: internal flaws
• Stress field is independent of strain rate.
• Predictive analysis is difficult.
• Statistical analysis, e.g. Weibull distribution is used to describe the data.
Semi-Brittle Failure Mode
• Cracks are initiated by plastic flow.
• Indentation fracture analysis can be used to describe the breakage.
• Lateral cracks are responsible for chipping and wear.
• Radial and median cracks are responsible for fragmentation.
• Predictive models are available.
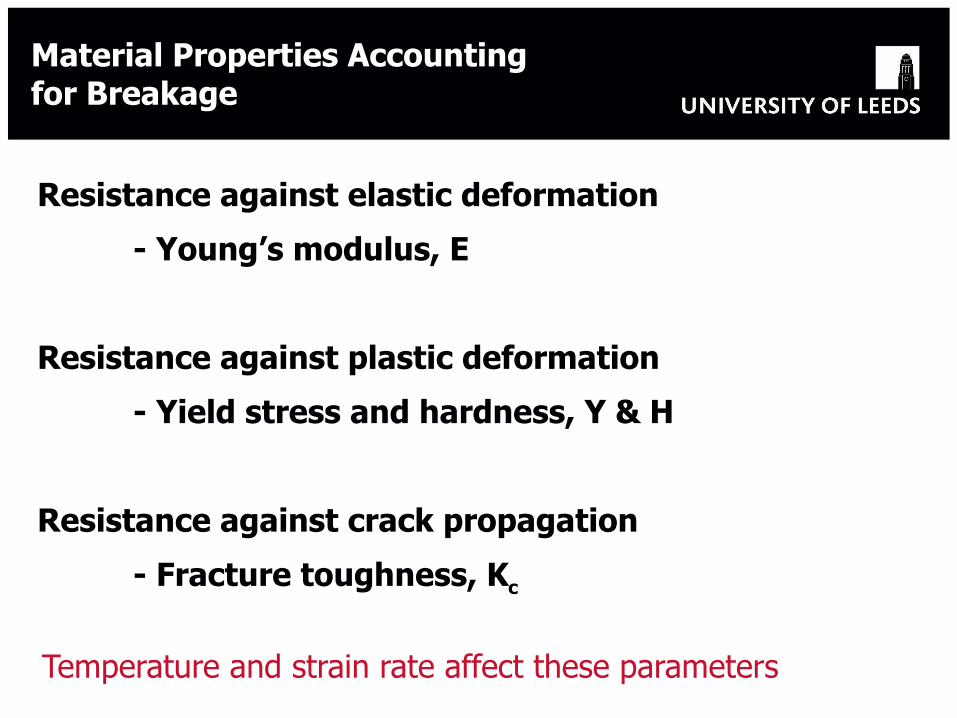
Resistance against elastic deformation
- Young’s modulus, E
Resistance against plastic deformation
- Yield stress and hardness, Y & H
Resistance against crack propagation
- Fracture toughness, Kc
Material Properties Accountingfor Breakage
Temperature and strain rate affect these parameters

Characterisation of Breakage and the Effect of Mechanical Properties
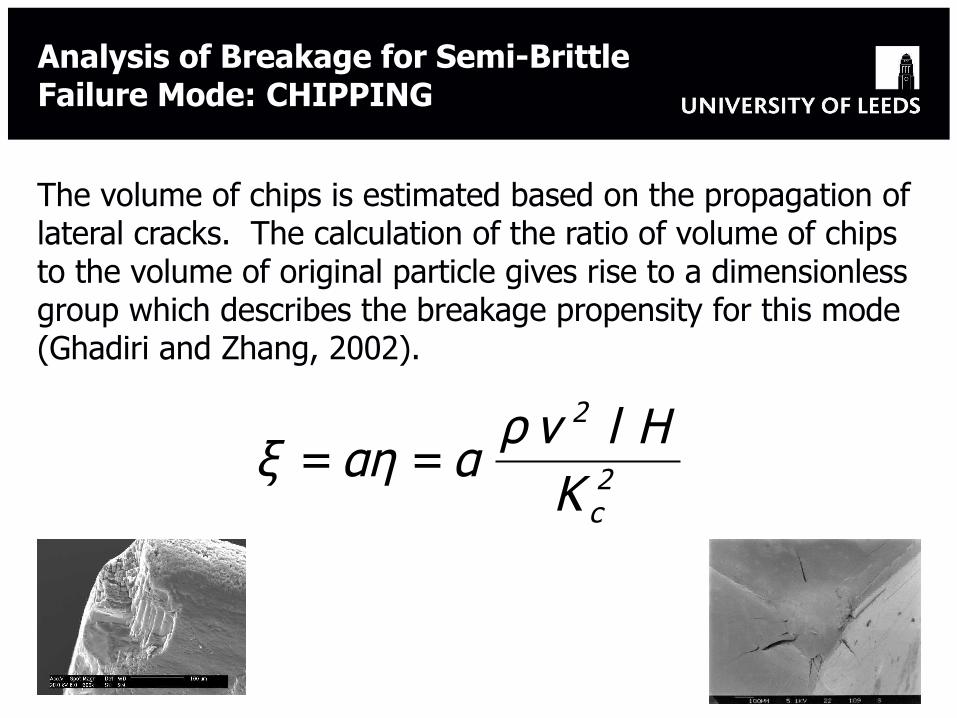
The volume of chips is estimated based on the propagation of lateral cracks. The calculation of the ratio of volume of chips to the volume of original particle gives rise to a dimensionless group which describes the breakage propensity for this mode (Ghadiri and Zhang, 2002).
2c
2
KH l v ρ
ααηξ ==
Analysis of Breakage for Semi-BrittleFailure Mode: CHIPPING

Various Materials
α-Lactose H= 640MPa
Kc=0.16MPa.m0.5
SucroseH=645MPa
Kc=0.08MPa.m0.5
Aspirin H=140MPa+
Kc=0.16MPa.m0.5
MCC H=168MPa
Kc=0.76MPa.m0.5
Starch H= 78MPa
Kc not yet available
SorbitolH=645MPa+
Kc=0.08MPa.m0.5
Material H/Kc2 Tm, oC Tc,
oC
Sucrose 100781 186 60-75α-LM 23795 201 118Aspirin 3570 139 -30MCC 293 265 160Starch (☼) 250 170*
H – Hardness; Kc – Fracture toughness☼ Not yet available* Decrease with increasing moisture content+ Measured using nano-indentation on single crystals

X-ExtMailInfo: <[email protected]> bdc-notes003.na.pg.com [155.125.116.11]Subject: Squeeze Mechnical propertiesTo: Mojtaba Ghadiri <[email protected]>Cc: [email protected], [email protected]: [email protected]: Thu, 15 Mar 2001 13:41:37 +0000X-MIMETrack: Serialize by Router on BDC-NOTES003.NA.PG.COM/PGI(Release 5.0.3 (Intl)|21 March 2000) at 03/15/2001 08:43:21 AM
Dear Mojtaba,
Attached is a write-up of the mechanical properties of Squeeze that we feel is
the reasons behind the particle low propensity for fracture under plant
conditions of compressive, shear & impact conditions. I thought there may be
time for you reveiw before meeting tomorrowing morning.
Look forward to seeing you tomorrow,
(See attached file: Squeeze Mechanical Property Definitions.doc)
Kind Regards sam
Squeeze Mechanical Property Definitions.doc
Project Sqeeze used this approach

Project Sqeeze used this approach
1. A water-soluble and/or a water-dispersible particle having a mean particle diameter of less than 20mm, preferably less than 2mm, and having a Hardness (H) of 500 MPa or less, when measured at a temperature of 20oC, a relative humidity of 20%; and a Fracture Toughness (Kc) of 0.04 MPa.m1/2 or greater, when measured at a temperature of 20oC, a relative humidity of 20% and a strain rate of 30 s-1; said particle comprises an active ingredient, said particle is obtained by a non-freeze dry process.
2. A particle according to any preceding claim, wherein said particle has a Fracture toughness of 2 MPa.m1/2 or greater and/or a Hardness of 200 MPa or less, when measured at a temperature of 20oC and a relative humidity of 20%.
3. A particle according to any preceding claim, wherein said particle has a ratio of H/Kc2 of 312500 Pa-1.m-1/4 or less, preferably from 50 Pa-1.m-1/4 or less.
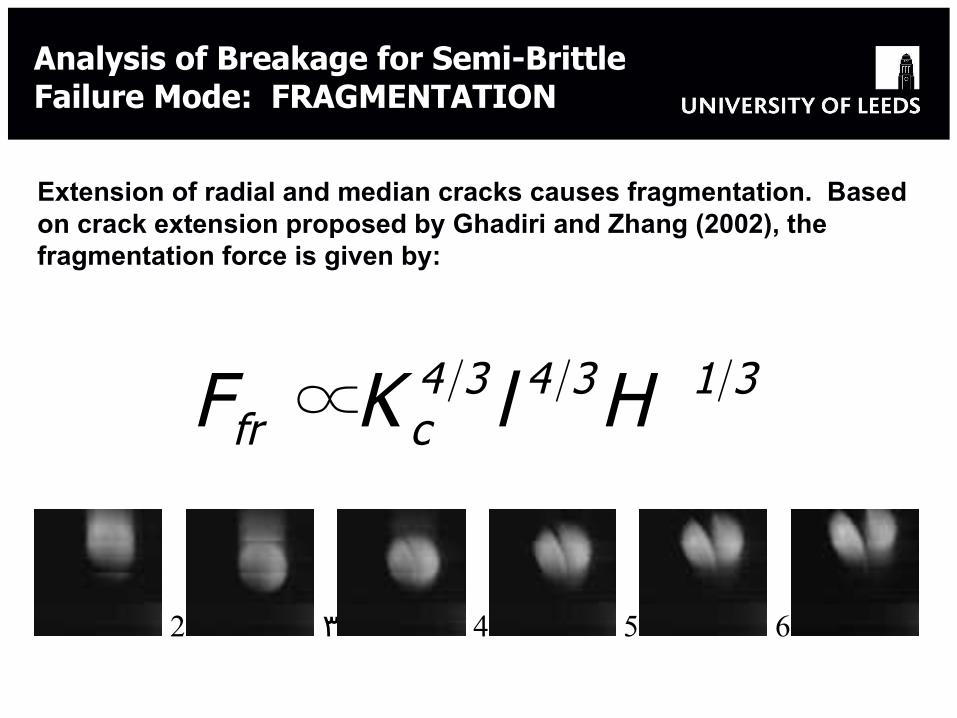
Extension of radial and median cracks causes fragmentation. Based on crack extension proposed by Ghadiri and Zhang (2002), the fragmentation force is given by:
313434cfr HlKF ∝
2 3 4 5 6
Analysis of Breakage for Semi-Brittle Failure Mode: FRAGMENTATION

Plastic Deformation-Chipping Transition
Critical load for lateral fracture (Marshall et al., 1982):
For velocity:
22121
4c
ch l ρ HE
] HK
[ V --∝
Transition Velocities
4c
cl ]HK
[ E F ∝

Transition Velocities
Chipping – Fragmentation Transition
Hutchings (1992) specified a critical load for fragmentation based on the indentation fracture model of Hagan (1981):
For velocity:3
4c
cf HK
F ∝
221-214
cfr l ρ H ]
HK
[ V -∝
Transition Velocities
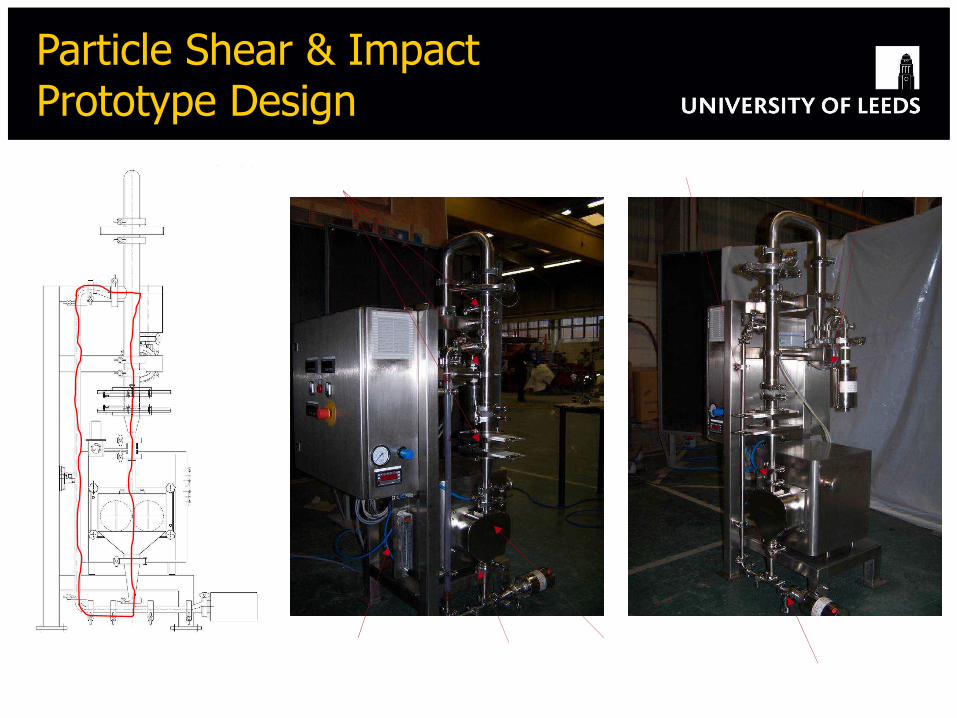
Particle Shear & Impact Prototype Design
RotameterOrifice
Cabinet Seal
Porous ring (1mm thickness)
Roller abrasion
Etching Bracket

www.leeds.ac.uk/ipse www.lipse.org+44 (0)113 343 2404
Feeding funnel
Glass tube
Photodiodes
Collection chamber
Target
Filter
Vacuum line connection
Vacuum line
Manual feeding
PI Collection chamber
PhotodiodesGlass tube
Target
Filter
Single Particle Impact Testing
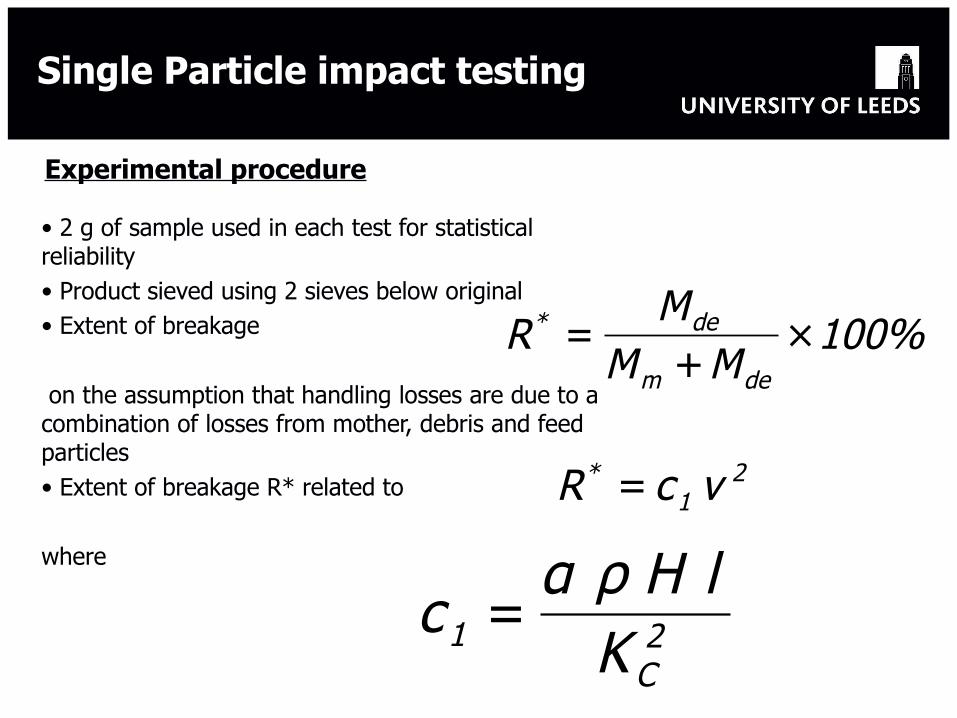
Single Particle impact testing
Experimental procedure
• 2 g of sample used in each test for statistical reliability• Product sieved using 2 sieves below original• Extent of breakage
on the assumption that handling losses are due to a combination of losses from mother, debris and feed particles• Extent of breakage R* related to where
%100MM
MR
dem
de* ×+
=
21
* v cR =
2C
1 Kl H ρ α
c =

Single Particle impact tests - Results
Size range μm C1 C1/l R2
425 - 500 0.0483 104.4 0.996
355 - 425 0.0415 106.4 0.981
300 - 355 0.0319 97.4 0.989
250 - 300 0.0231 84.0 0.988
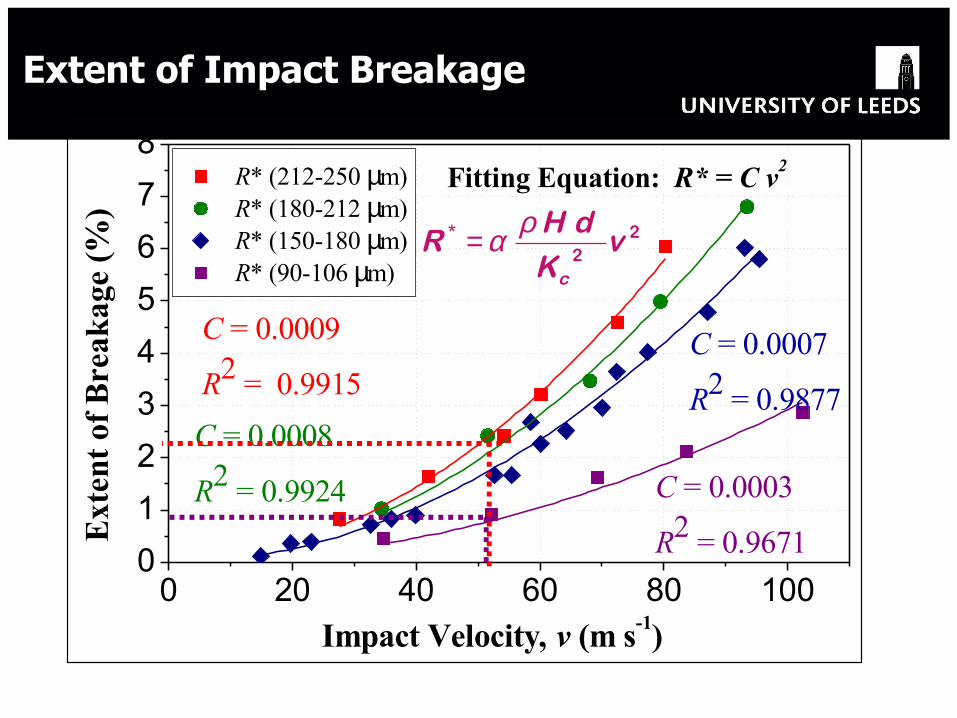
• Breakage propensity increases with particle size and impact velocity
• C1/l remains relatively constant with particle size
• Well described by Ghadiri & Zhang model (2002)
Aspirin - ambient temperature and humidity

Single Particle impact tests - Results
Material C1 Error C1/density R2
Aspirin 0.0129 ± 6.3 E-04 9.21 E-06 0.96
Sucrose 0.00113 ± 8.0 E-05 0.71 E-06 0.94
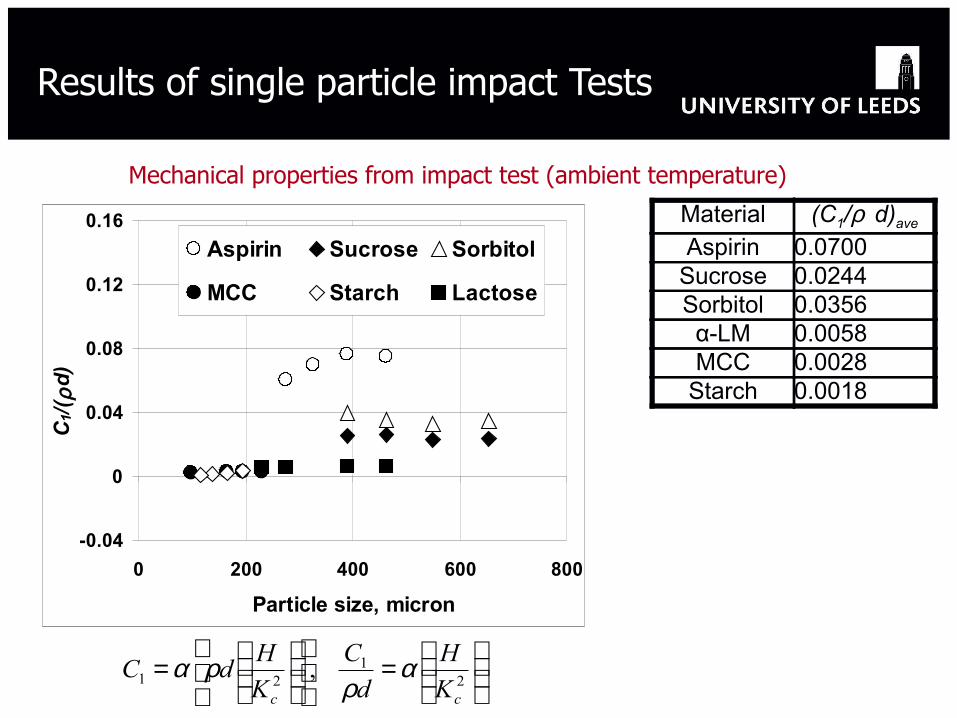
Results of single particle impact Tests
Material (C1/ρ d)aveAspirin 0.0700
Sucrose 0.0244Sorbitol 0.0356α-LM 0.0058MCC 0.0028
Starch 0.0018
=
=
21
21 ,cc K
H
d
C
K
HdC α
ρρα
-0.04
0
0.04
0.08
0.12
0.16
0 200 400 600 800
Particle size, micron
C1/
( ρd
)
Aspirin Sucrose Sorbitol
MCC Starch Lactose
Mechanical properties from impact test (ambient temperature)
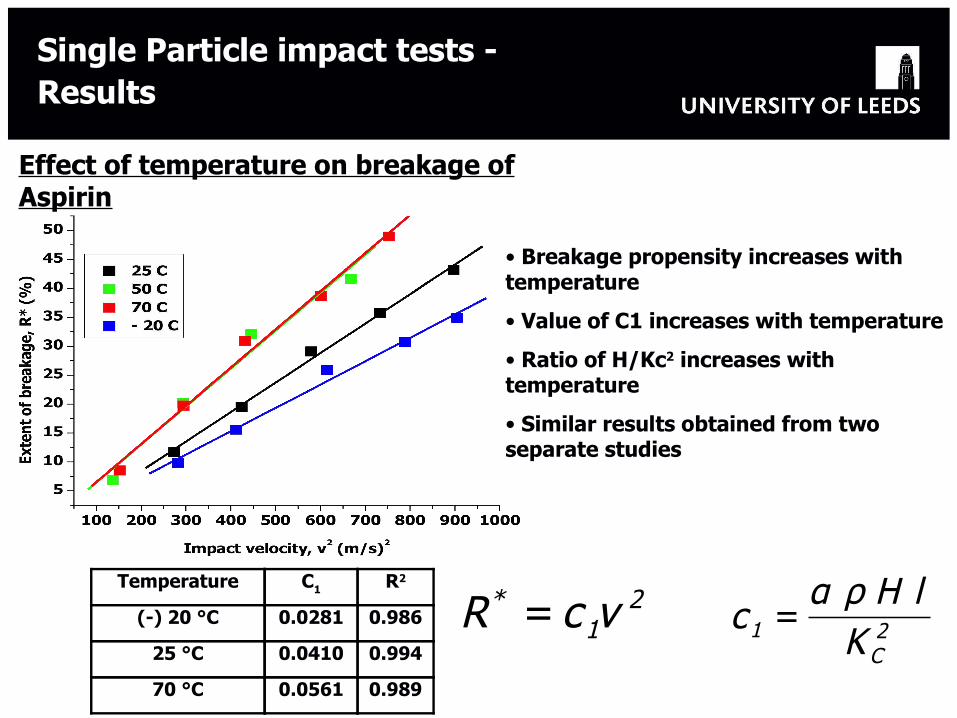
Single Particle impact tests - Results
Effect of temperature on breakage of Aspirin
Temperature C1 R2
(-) 20 °C 0.0281 0.986
25 °C 0.0410 0.994
70 °C 0.0561 0.989
• Breakage propensity increases with temperature
• Value of C1 increases with temperature
• Ratio of H/Kc2 increases with temperature
• Similar results obtained from two separate studies
21
* vcR = 2C
1 Kl H ρ α
c =
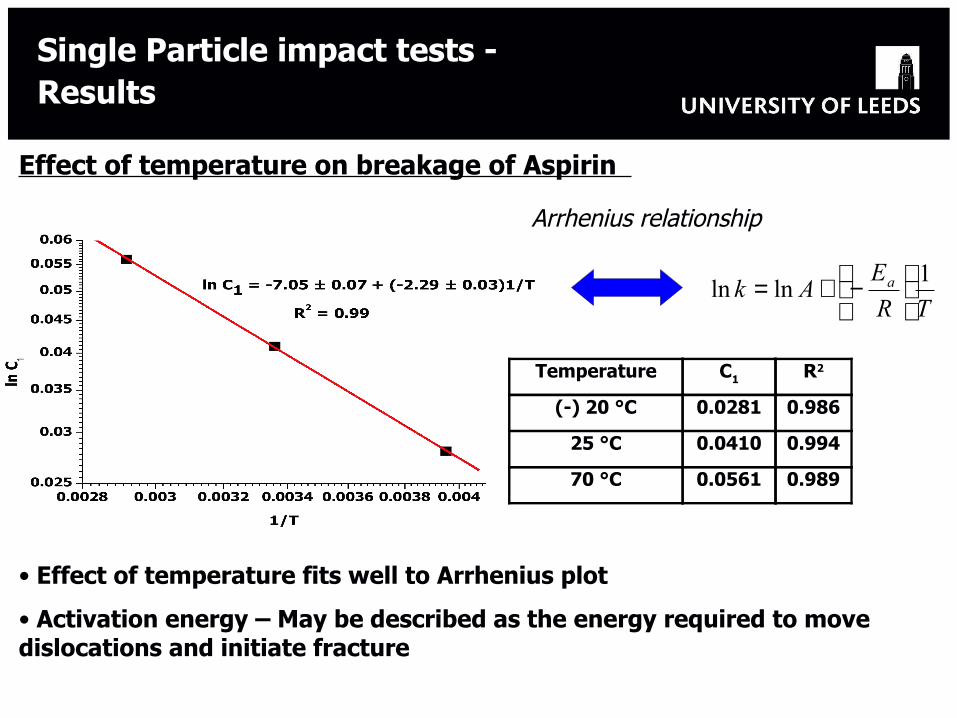
Single Particle impact tests - Results
Effect of temperature on breakage of Aspirin
• Effect of temperature fits well to Arrhenius plot
• Activation energy – May be described as the energy required to move dislocations and initiate fracture
Arrhenius relationship
TR
EAk a 1
lnln
−+=
Temperature C1 R2
(-) 20 °C 0.0281 0.986
25 °C 0.0410 0.994
70 °C 0.0561 0.989

Agglomerate Breakage

Agglomerate Breakage
Breakage energy is related linearly to the incident energy (Moreno, 2003):
23
3
4
2
1VRN ANC πρ∝Γ
The damage ratio is given by:
A
VR
N
NC
Γ∝
23ρ
35
23235
/
//C VED
N
N
Γ∝ ρ
32 /2C EDDV
N
N
Γ×
Γ∝ ρ
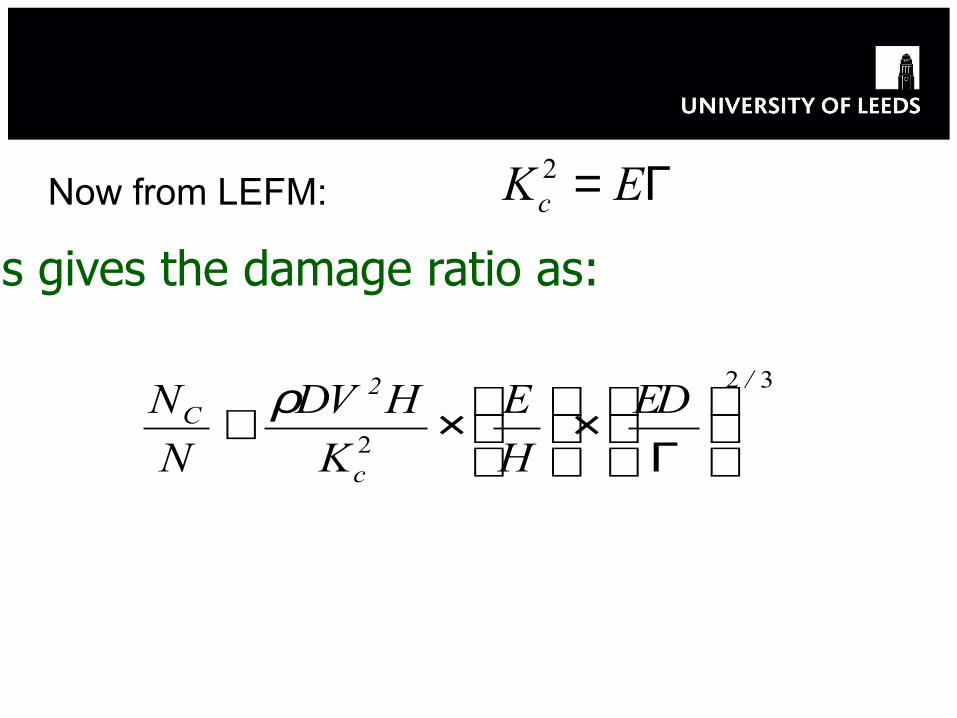
Now from LEFM: Γ= EKc2
This gives the damage ratio as:
32
2
/
c
2C ED
H
E
K
HDV
N
N
Γ×
×∝ ρ

Analysis of Breakage for Brittle Mode
Weibull Analysis (1951): Probability of fracture, S, when a brittle material is subjected to stress:
−−=
m
s
zexpSσσ
1
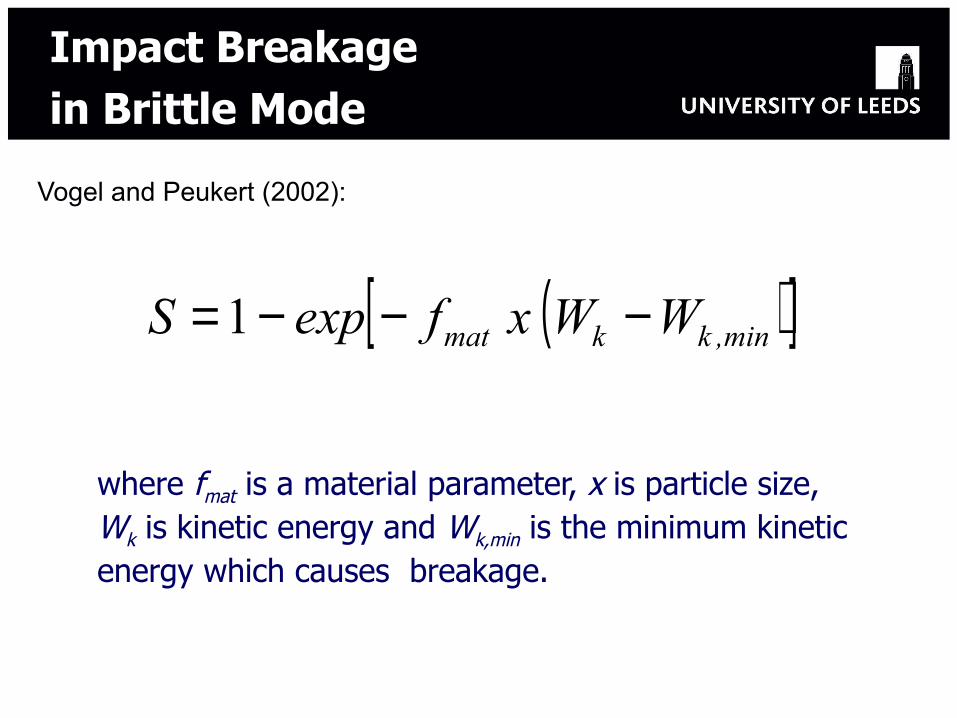
Vogel and Peukert (2002):
( )[ ]min,kkmat WW x fexpS −−−= 1
where fmat is a material parameter, x is particle size, Wk is kinetic energy and Wk,min is the minimum kinetic energy which causes breakage.
Impact Breakage in Brittle Mode

Methods:
• Compression
• Shear
• Fluid bed
• Ball mill
• Tumbler
• Vibration
Features:
• Reflect particle interactions
• Close to industrial case
• Difficult to interpret
• Only useful for relative comparison
• Hydrodynamic interactions depend on scale
• Misleading
Bulk Tests

Analysis of Bulk Milling
Can common conceptual models be analysed with recourse to single particle breakage characteristics?
First Order Rate Process:
Population Balance model:
iii M K-
t dM d
=
i
n
1jiii,jjj
j M S B M S- t d
M d∑
+=
+=
www.leeds.ac.uk/ipse www.lipse.org+44 (0)113 343 2404
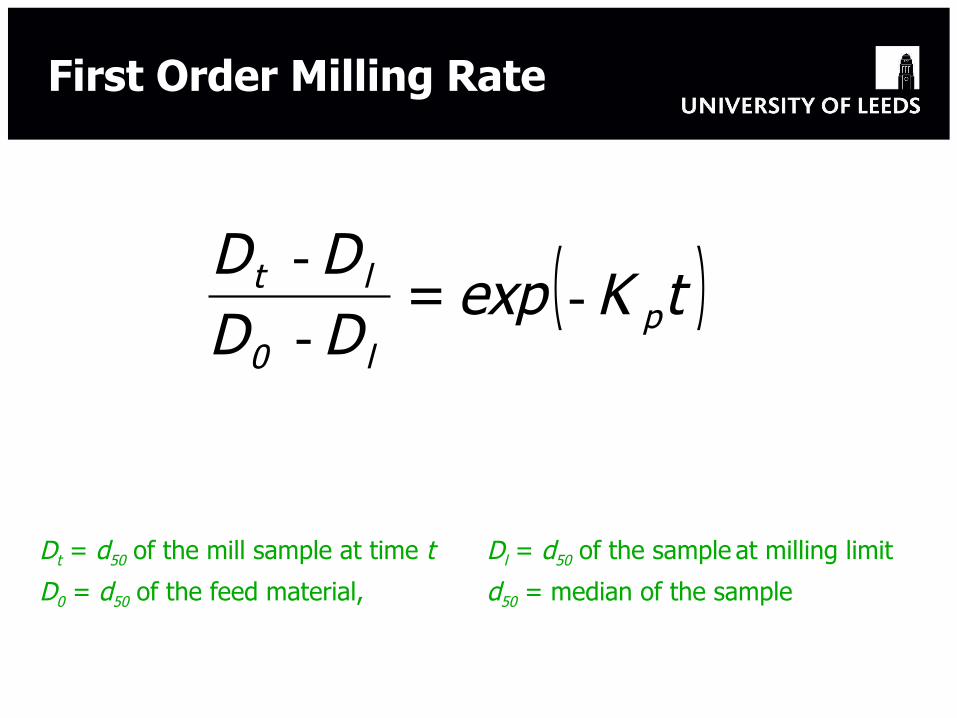
Dt = d50 of the mill sample at time t Dl = d50 of the sample at milling limit
D0 = d50 of the feed material, d50 = median of the sample
First Order Milling Rate
( )tKexpDDDD
pl0
lt --
-=

Detachable cooling jacket
Stainless steel milling jar
Counter weight
Detachable jar holder
50 mm (11 ml)
x
z
Jar movement
12 mmy
Example: Analysis of Single Ball Milling
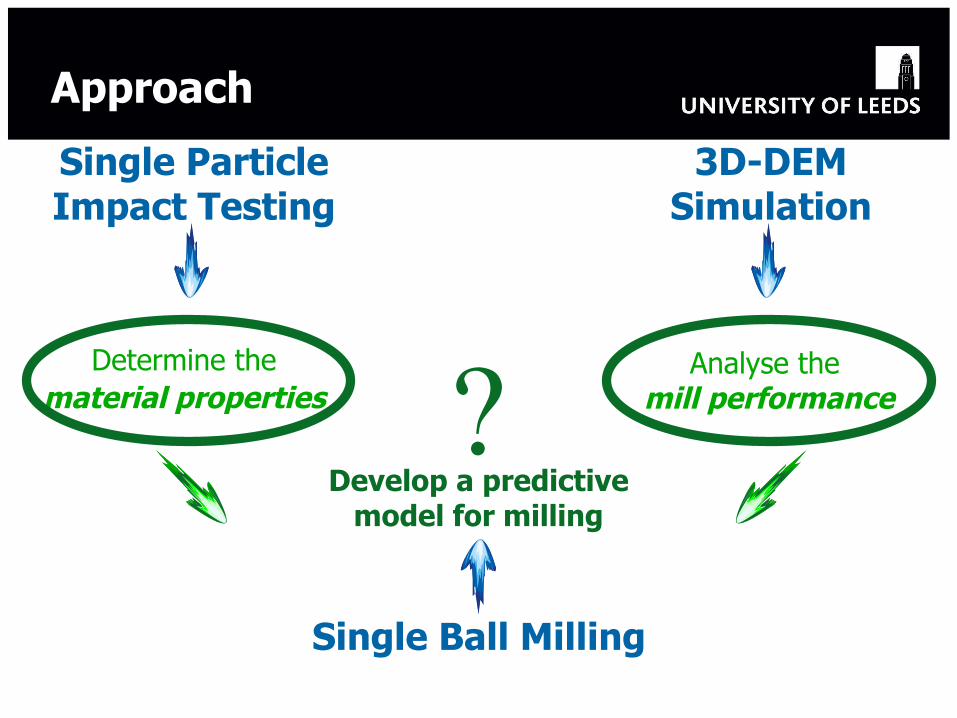
Develop a predictive model for milling
?
Single Particle Impact Testing
Determine the material properties
Analyse the mill performance
3D-DEM Simulation
Single Ball Milling
Approach
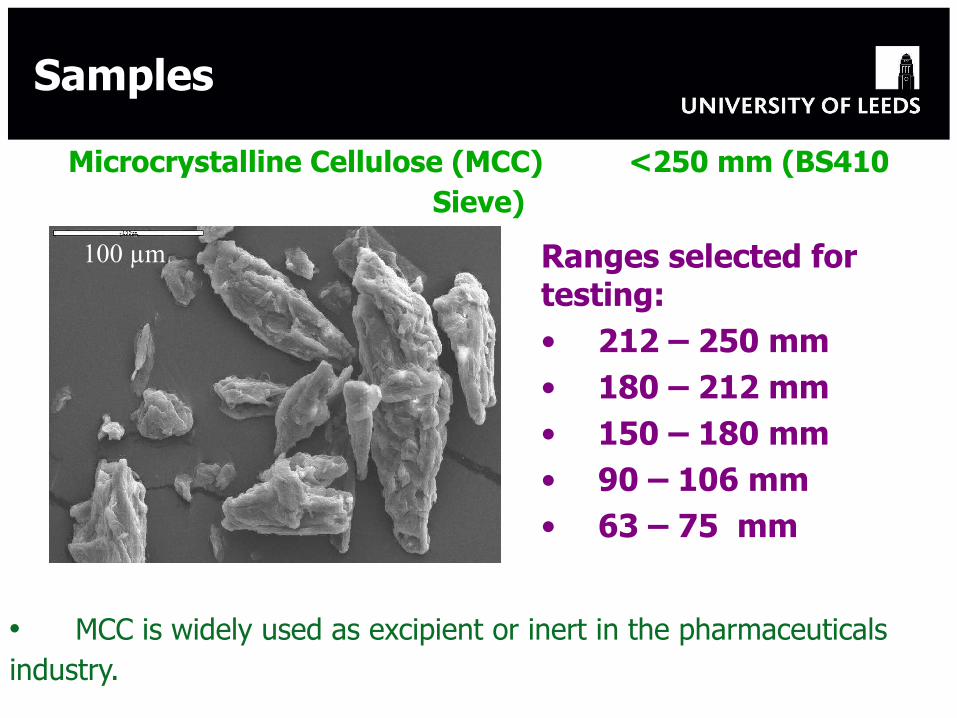
• MCC is widely used as excipient or inert in the pharmaceuticals industry.
Microcrystalline Cellulose (MCC) <250 mm (BS410 Sieve)
100 µm Ranges selected for testing:• 212 – 250 mm• 180 – 212 mm• 150 – 180 mm• 90 – 106 mm• 63 – 75 mm
Samples

www.leeds.ac.uk/ipse www.lipse.org+44 (0)113 343 2404
0 1000 2000 3000 4000 5000 6000
0.0
0.2
0.4
0.6
0.8
1.0
Kp = 0.0016, R2 = 0.9946
Kp = 0.0024, R2 = 0.9978
Kp = 0.0041, R2 = 0.9947
Kp = 0.0047, R2 = 0.9943
Kp = 0.0057, R2 = 0.9965
Kp = 0.0038, R2 = 0.9864
(Dt-D
l)/(D
0-Dl)
Time, t (s)
Original MCC 212-250 µm 180-212 µm 150-180 µm 90-106 µm 63-75 µm
Milling of MCC at 18 Hz

www.leeds.ac.uk/ipse www.lipse.org+44 (0)113 343 2404
0 1000 2000 3000 4000 5000 6000
0.0
0.2
0.4
0.6
0.8
1.0
Kp = 0.0045, R2 = 0.9735
Kp = 0.0108, R2 = 0.9823
Kp = 0.0129, R2 = 0.9793
Kp = 0.0144, R2 = 0.9689
Kp = 0.0073, R2 = 0.8837
(Dt -
Dl)
/ (D
0- D
l)
Time, t (s)
Original MCC 212-250 µm 180-212 µm 150-180 µm 90-106 µm
Milling of MCC at 25 Hz

www.leeds.ac.uk/ipse www.lipse.org+44 (0)113 343 2404
K p = 6.262E-05 d
R 2 = 0.9410
K p = 2.463E-05 d
R 2 = 0.99820
0.002
0.004
0.006
0.008
0.01
0.012
0.014
0.016
50 100 150 200 250 300
Mean Sieved Feed Size, d (µm)
Kp
(s-1
)
18 Hz
25 Hz
Milling Rate Constant at 18 & 25 Hz

dem
de
MMM
R+
=*
Mde = mass of debrisMm = mass of mother particles
The extent of breakage (R*) is determined by gravimetric analysis.
Single Particle Impact Testing
Manual feeding
PI Collection chamber
PhotodiodesGlass tube
Target
Filter
0 20 40 60 80 1000
1
2
3
4
5
6
7
8Fitting Equation: R* = C v2
C = 0.0007
R2 = 0.9877C = 0.0008
R2 = 0.9924
C = 0.0009
R2 = 0.9915
C = 0.0003
R2 = 0.9671
R* (212-250 µm) R* (180-212 µm) R* (150-180 µm) R* (90-106 µm)
Ext
ent
of B
reak
age
(%)
Impact Velocity, v (m s-1)
22
* v
KdH
Rc
ρα=
Extent of Impact Breakage

K p = 16.237 C
R 2= 0.9965K p = 6.3714 C
R 2= 0.93570
0.0020.0040.0060.0080.01
0.0120.0140.016
0 0.0002 0.0004 0.0006 0.0008 0.001
C (s2 m-2)
Kp
(s-1
)
MCC-18 HzMCC-25 Hz
Dependence of Milling Rate on Particle Properties

x
zy
Spring
Compressive force
Knηn
wnDashpot
ws
Ks
ηs
Slider
Shear force
µf
φ
tw
wKF nnnnn ∆
∆+∆= η( )
( )t
rrw
rrwKF
ss
sss
∆∆+∆+∆+
∆+∆+∆=
2211
2211
φφη
φφ
DEM Simulationsto estimate input energy

DEM simulation at 25 Hz of milling frequency in the single ball mill
DEM Simulations
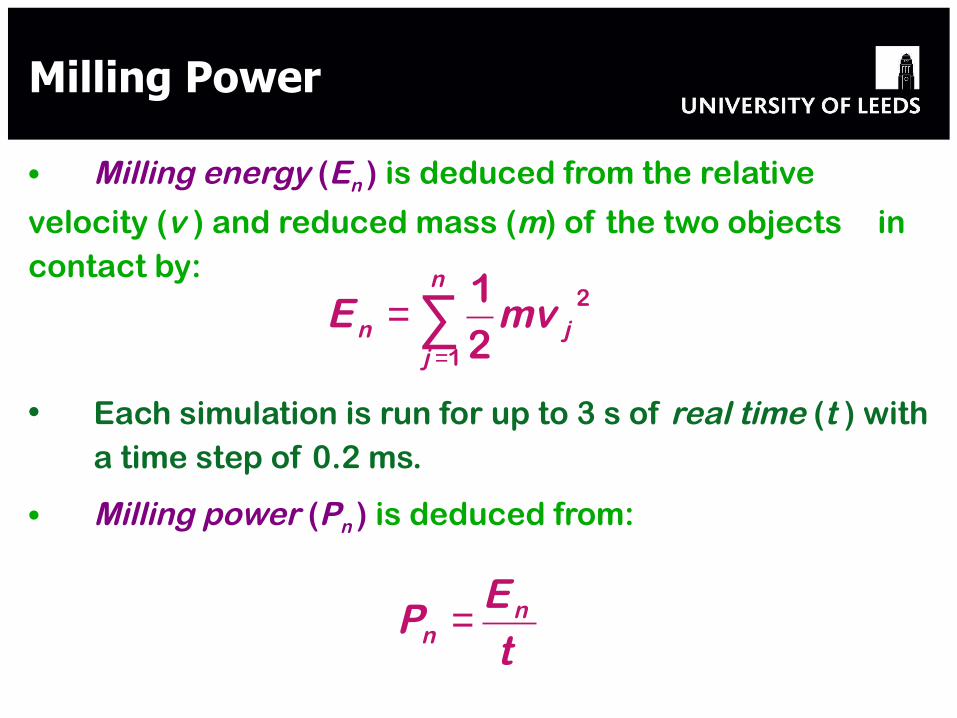
∑=
=n
jjn mvE
1
2
21
• Each simulation is run for up to 3 s of real time (t ) with a time step of 0.2 ms.
• Milling power (Pn ) is deduced from:
• Milling energy (En ) is deduced from the relative
velocity (v ) and reduced mass (m) of the two objects in contact by:
tE
P nn =
Milling Power
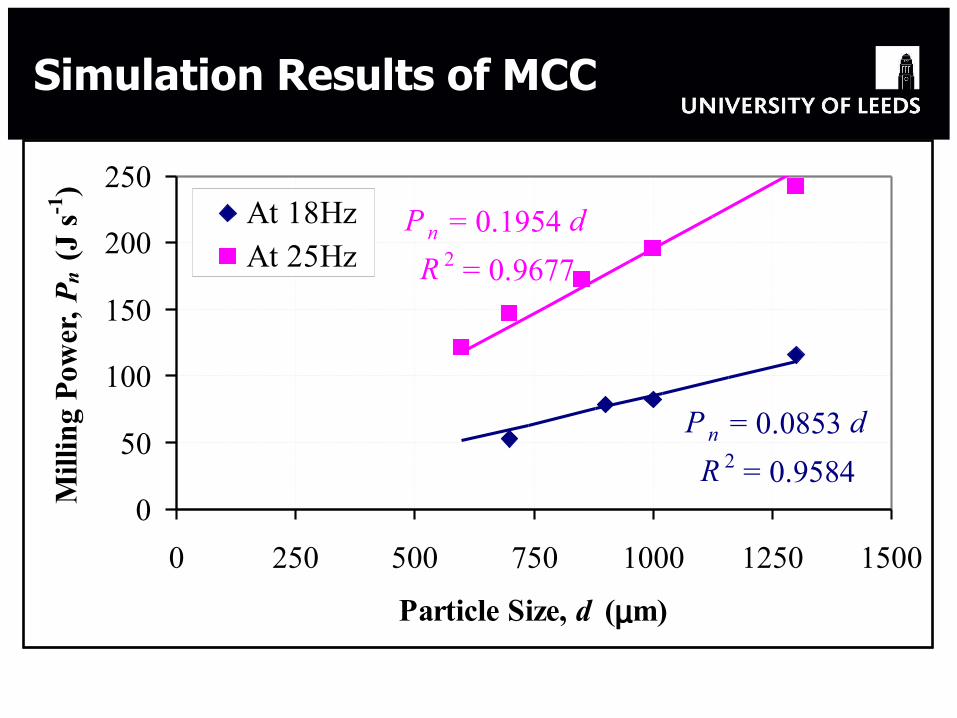
P n = 0.1954 d
R 2 = 0.9677
P n = 0.0853 d
R 2 = 0.95840
50
100
150
200
250
0 250 500 750 1000 1250 1500
Particle Size, d (µm)
Mill
ing
Pow
er, P
n (
J s-1
)
At 18HzAt 25Hz
Simulation Results of MCC
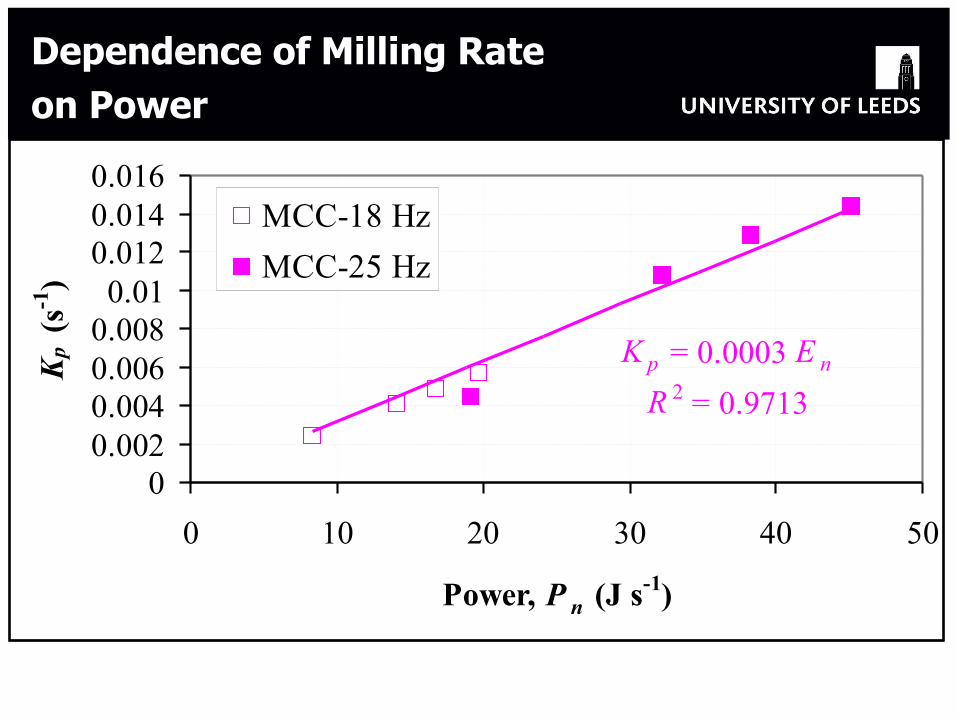
K p = 0.0003 E n
R 2 = 0.9713
00.0020.0040.0060.008
0.010.0120.0140.016
0 10 20 30 40 50
Power, P n (J s-1)
Kp
(s-1
)
MCC-18 Hz
MCC-25 Hz
Dependence of Milling Rateon Power
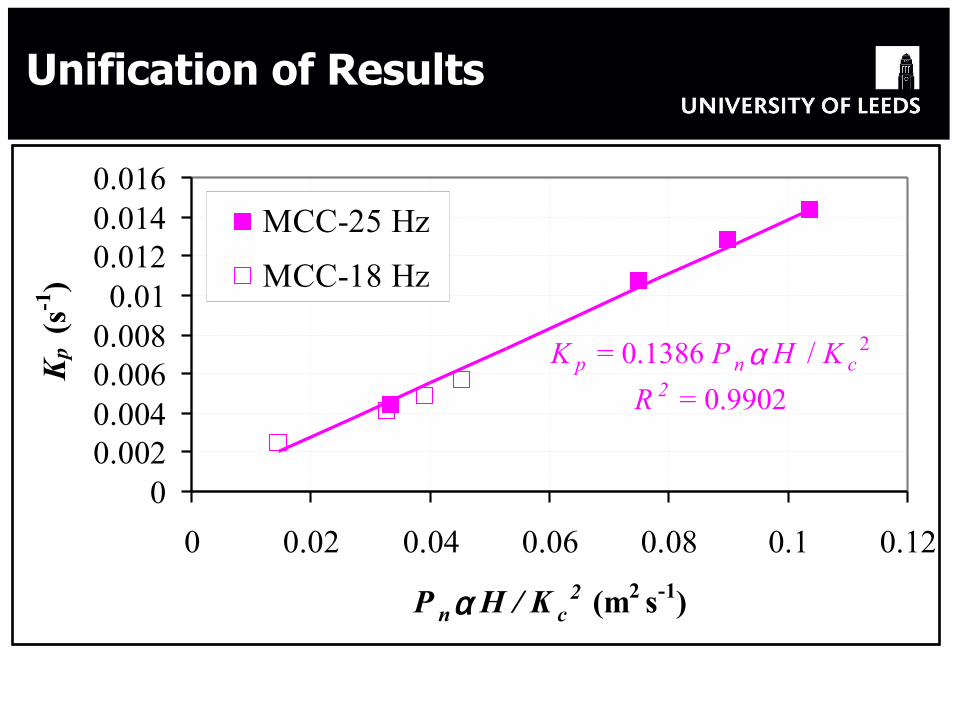
K p = 0.1386 P n α H / K c2
R 2 = 0.9902
00.0020.0040.0060.008
0.010.0120.0140.016
0 0.02 0.04 0.06 0.08 0.1 0.12
P nα H / K c2 (m2 s-1)
Kp
(s-1
)
MCC-25 Hz
MCC-18 Hz
Unification of Results

www.leeds.ac.uk/ipse www.lipse.org+44 (0)113 343 2404
α-Lactose Monohydrate (αLM)
<710 µm
Semi-Brittle
Sucrose
<1000 µm
Brittle
Starch 1500
<300 µm
Ductile
Additional Samples

K p = 0.1218 P n α H / K c2
R 2 = 0.9826
00.010.020.030.040.050.060.070.080.09
0 0.1 0.2 0.3 0.4 0.5 0.6
P nα H / K c2 (m2 s-1)
Mill
ing
Rat
e C
onst
ant,
Kp
(s-1
)
MCC-18 HzMCC-25 HzαLM-25 HzStarch-25 HzSucrose-12 HzSucrose+Aerosil-25 Hz
Unification of Results

The results presented provide evidence that the milling behaviour of a material can be quantified from the knowledge of mechanical properties and the mill dynamics as follows:
Kp = milling rate constant Pn = milling energy
H = hardness Kc = fracture toughness
Conclusions
:c
np K
H PK ∝

What to do next?On Milling:•Short term: Consultancy•Medium term: Four months MSc projects•Long term: PhD, KTP and PDRA
On continuing training:•Powder Flow•Mixing and Segregation•Sizing, etc

Analysis of Segregation of MixturesVibrated heap experiment
High Speed Video at 1000 fps
Experimental Set-Up
Heaps of binary mixtures of glass beads

(b) CASE 2 (c) CASE 3 (a) CASE 1
Analysis of Segregation of MixturesVibrated heap experiment

•First test - CASE 1:• For case where both types of beads are free flowing, system segregates (a)•Second test – CASE 2:• Light fine beads cohesive to different levels, solid coarse beads free-flowing • At higher cohesion level light fine beads formed clusters that accumulated at the
bottom and the top of the heap (b)•Third test – CASE 3:• Solid coarse beads cohesive to different levels, light fine beads free-flowing • At an increased cohesion no segregation was observed (c)
(b) CASE 2Highly segregates
(c) CASE 3Does not segregate
(a) CASE 1Segregates
Analysis of Segregation of MixturesVibrated heap experiment: different size, density and cohesion

Thank you for your attention.