mg mmoles/kg
TRANSCRIPT

CHEMISTRY OF SUBMARINE HYDROTHERMAL SOLUTIONS
AT
21° NORTH, EAST PACIFIC RISE
AND
GUAYMAS BASIN, GULF OF CALIFORNIA
by
Karen Louise Von Damm
B.S., Yale University(1977)
SUBMITTED IN PARTIAL FULFILLMENT OF THEREQUIREMENTS FOR THE DEGREE OF
DOCTOR OF PHILOSOPHY
at the
MASSACHUSETTS INSTITUTE OF TECHNOLOGY
and the
WOODS HOLE OCEANOGRAPHIC INSTITUTION
August 1983
© Massachusetts Institute of Technology 1983
Signature of AuthorJoint Program in Oceanography, Massachusetts Institute ofTechnology - Woods Hole Oceanographic Institution, and theDepartment of Earth, Atmospheric and Planetary Sciences,Massachusetts Institute of Technology, August 1983
Certified by_John M. Edmond
Thesis Supervisor
Accepted byChairman, Joint Crm itt& for Chemical Oceanography,Massachusetts InsUtute of Technology - Woods HoleOceanographic Institution Archives
MASSACHUSETTS INSTITUTEOF TECHNOLOGY
NOV 1 5 1983
I Inn A lrC
2
CHEMISTRY OF SUBMARINE HYDROTHERMAL SOLUTIONSat
210 NORTH, EAST PACIFIC RISEand
GUAYMAS BASIN, GULF OF CALIFORNIA
by
Karen Louise Von Damm
Submitted to the Joint Oceanographic Committee ofthe Department of Earth, Atmospheric and PlanetarySciences, Massachusetts Institute of Technology, andthe Woods Hole Oceanographic Institution on August 5,1983, in partial fulfillment of the requirementsfor the degree of Doctor of Philosophy.
ABSTRACT
Submarine hydrothermal solutions at 210 north latitude on the EastPacific Rise were sampled for the first time in November 1979 and again inNovember 1981. In the 1981 program, four vent fields were sampled and amaximum temperature of 350-355 C was measured for three of the areas (OBS,SW, and HG) and only 273 C for the fourth area (NGS). The temperatureswere stable over the twelve days of the diving program. The hot springsare "black smokers" which are forming constructional features of Fe, Zn andCu sulfides and Ca and Ba sulfates. The solutions are seawater which hasbeen heated during convection through the oceanic crust and has reactedwith basqlt. The hydrothermal solutions are acid (pH = 3.3-3.8, 25° C, 1atm), reducing (H2S = 6.6-8.4 mmoles/kg, S04 <1 mmoles/kg), and metal rich(Fe = 0.8-2.4 mmoles/kg, Mn = 0.7-1.0 mmoles/kg, Zn = 40-106 moles/kg, Cu= 0-44 moles/kg, Pb = 183-359 nmoles/kg, Co = 22-227 nmoles/kg, Cd =17-180 nmoles/kg and Ag = <1-38 nmoles/kg). Mg and S04 are quantitativelyremoved from these solutions while other elements are highly enriched. Liincrease- to 0.9-1.3 moles/kg, K to 23.2-25.8 mmoles/kg, Rb to 27-33molesi'kg and Ca to 11.7-20.8 mmoles/kg. Sr both increases and decreases
from the seawater concentration to 65-97 moles/kg. Na and C1 alsoincrease and decrease; the gain can be attributed to a -7% loss of water
due to rock hydration. Silica increases to 15.6-19.5 mmoles/kg. Silicaincreases along strike from the southwest to the northeast; variations inthe other chemical components are not geographically consistent. Quartzgeobarometry indicates a pressure of reaction between 300-600 bars,implying a depth f reaction within the oceanic crust of 0.5-3.5 kms; inagreement with the geophysical estimates. The silica data imply that theNGS vent is conductively cooling.
The Guaymas Basin, Gulf of California hydrothermal system was firstsampled in January 1982. A total of ten vent areas were sampled with amaximum a3mperatu:e of 315° C. In contrast to the 21 N systems where thesolutions exit directly from basalt, the hydrothermal systems at Guaymaspass through and react with approximately 500 meters of sediment cover

3
before they exit on the seafloor. This difference is reflected in thechemistry of these solutions. The sediment also provides a trappingmechanism for the metals in solution and a sediment-hosted type ore depositmay be forming at depth. These solutions differ from those at 210 N asthey are less acid (pH = 5.9, 250 C, 1 atm), sulfur rich (H2S = 3.8-6.0mmoles/kg, S04 <1 mmole/kg) and metal rich (Fe = 0.02-0.18 mmoles/kg, Mn =0.13-0.24 mmoles/kg, Zn = 0-40 imoles/kg, Cu <6 moles/kg, Pb = 230-652nmoles/kg, Ag <230 nmoles/kg, Cd <46 nmoles/kg and Co <5 nmoles/kg). Thehigher pH and extremely high alkalinity (2.8-10.6 meq/kg) can be attributedto dissolution of CaCO3 and thermal degradation of organic matter whichoccur in the sediment column. The organic matter degradation is alsoresponsible for the very high levels of ammonium (10.3-15.6 mmoles/kg)found in the solutions. The high pH and alkalinity are responsible for thelower concentrations of the metals which form insoluble sulfides. Theammonium exchanges for K and Rb in the sediments raising their levels insolution to a maximum of 49.2 mmoles/kg and 86 moles/kg, respectively;significantly higher than the values observed at 210 N. Li increases to0.6-1.1 mmoles/kg, Ca to 41.5 mmoles/kg and Sr to 253 moles/kg. Na and C1increase between 8-18%; this is attributed to hydration. Na is lostpreferentially to C1. Quartz geobarometry indicates a depth of reaction of-0.5 kms into the oceanic crust.
These two sites demonstrate the importance of seawater reactions withbasalt in altering the composition of seawater. The 210 N system isdependent only on reactions between seawater and basalt at elevatedtemperatures for its chemistry. The Guaymas system is a more complicatedcase in which reactions between the hydrothermal solutions and sedimentoverprint the basalt signature. The presence of large amounts of CaCO3 andorganic matter in the sediments at Guaymas is probably very important indetermining the solution chemistry.
Thesis Supervisor: Professor John M. Edmond, M.I.T.

4
To my parents
ACKNOWLEDGEMENTS
Without the enthusiasm of my advisor John Edmond this thesis would not
have succeeded. I would like to thank him for the opportunity to work with
him on this project.
Barry Grant and Chris Measures provided tireless help at sea and back
in the lab, as well as good company through it all. Without their help
this thesis would not have been finished. Ed Boyle, Russ McDuff, Alan
Shiller, Bob Stallard, Bob Collier, Peggy Delaney, Art Spivack and Glen
Shen were always ready to have a perceptive discussion.
Special thanks to Karl Turekian who provided me with my first exposure
to this field as a college freshman. As my undergraduate thesis
supervisor, and as a member of my thesis committee he has enriched my
understanding of global processes and has provided immeasurable help. Bill
Jenkins explained the mysteries of 3He to me and as a member of my thesis
committee was always ready to listen and to help. As a member of the
committee, Mike Mottl's discussions aided the interpretation of the data
set.
This thesis is based on several field sampling programs of
hydrothermal solutions. Without the help of the captain and crew of the
Alvin/Lulu these programs would not have succeeded. Special thanks to the
Alvin pilots Ralph Hollis, George Ellis and Bob Brown whose virtuousity in
handling the submarine and samplers obtained the most pristine hydrothermal
samples yet. Barrie Walden's sampler design has worked flawlessly on three
diving cruises to date. The captains and crews of the Gilliss, Melville
and E.B. Scripps provided the support facilities which made these cruises a
success. Bob Ballard and the ANGUS group and many co-workers from Scripps
helped to make these cruises a success as well as enjoyable.

My parents and friends have stood by me the last five years. I cannot
thank them enough for their support.
The National Science Foundation through grants OCE-8020203,
OCE-8118481, and 7919843-0CE provided financial support for this research.

7
TABLE OF CONTENTS
Page Number
Title page 1
Abstract 2
Dedication 4
Acknowledgements 5
Table of Contents 7
List of Figures 9
List of Tables 11
Chapter 1 - Introduction 12
Chapter 2 - Results and Discussion of 210 North, East Pacific 21Rise Solution Chemistry
2.1 Sample setting 21
2.2 Solution chemistry 272.3 Sulfur system 882.4 Silica concentration and the depth of reaction 962.5 21° N model 1042.6 Comparison to chimney chemistry 1092.7 Comparison to ore deposits 1122.8 Comparison to observed basalt alteration 1142.9 Comparison to experimental work 1172.10 Comparison to metalliferous sediments 1222.11 Summary 125
Chapter 3 - Results and Discussion of Guaymas Basin, Gulf of 127California Solution Chemistry
3.1 Sample setting 1273.2 Solution chemistry 1313.3 Sulfur system 1733.4 Silica concentration and the depth of reaction 1743.5 Guaymas model 1763.6 Comparison to DSDP Leg 64 1773.7 Comparison to chimney chemistry 1803.8 Comparison to ore deposits 1813.9 Comparison to experimental work 1843.10 Comparison to metalliferous sediments 1863.11 Summary 186
Chapter 4 - Conclusions 188
4.1 Comparison of 210 N and Guaymas 188
4.2 Hydrothermal fluxes 190

Page Number
4.3 Further work 194
References 196
Appendix 1 - Sample Collection and Treatment 205
Appendix 2 - Analytical Methods 215
Appendix 3 - Data Tables 231
Biographical Note 240
9
LIST OF FIGURES
Page Number
Chapter 1
1-1 Map of discovered submarine hydrothermal systems. 161-2 Schematic comparison of the Galapagos Spreading 18
Center; 210 North, East Pacific Rise; and GuaymasBasin, Gulf of California hydrothermal systems.
Chapter 2
2-1 Simplified geology and vent locations at 210N. 222-2 Lithium versus magnesium at 210 N. 382-3 Sodium versus magnesium at 21° N. 412-4 Potassium versus magnesium at 210 N. 432-5 Rubidium versus magnesium at 21° N. 452-6 Lithium versus potassium at 210 N. 462-7 Beryllium versus magnesium at 21° N. 492-8 Calcium versus magnesium at 210 N. 512-9 (Calcium - sulfate) versus magnesium at 210 N. 522-10 Strontium versus magnesium at 210 N. 542-11 Barium versus magnesium at 210 N. 552-12 Silica versus magnesium at 210 N. 592-13 pH versus magnesium at 210 N. 612-14 Alkalinity versus magnesium at 210 N. 622-15 Fluoride versus magnesium at 210 N. 642-16 Chloride versus magnesium at 210 N. 652-17 Charge balance sodium versus chloride at 210 N. 682-18 Sulfate versus magnesium at 210 N. 702-19 Hydrogen sulfide versus magnesium at 210 N. 722-20 Manganese versus magnesium at 210 N. 762-21 Iron versus magnesium at 21° N. 782-22 Iron versus manganese at 210 N. 792-23 Copper versus magnesium at 210 N. 812-24 Zinc versus magnesium at 210 N. 832-25 Solubility of quartz as a function of temperature 100
and pressure.
Chapter 3
3-1 Location map for Guaymas. 128
3-2 Dive and vent locations at Guaymas. 1293-3 Lithium versus magnesium at Guaymas. 1373-4 Sodium versus magnesium at Guaymas. 1393-5 Potassium versus magnesium at Guaymas. 1403-6 Rubidium versus magnesium at Guaymas. 1423-7 Beryllium versus magnesium at Guaymas. 1443-8 Calcium versus magnesium at Guaymas. 1453-9 Strontium versus magnesium at Guaymas. 148
10
Page Number
3-10 Barium versus magnesium at Guaymas. 1503-11 Aluminum versus magnesium at Guaymas. 1513-12 Silica versus magnesium at Guaymas. 1523-13 pH versus magnesium at Guaymas. 1543-14 Alkalinity versus magnesium at Guaymas. 1553-15 Ammonium versus magnesium at Guaymas. 1573-16 Chloride versus magnesium at Guaymas. 1593-17 Charge balance sodium versus chloride at Guaymas. 1603-18 Sulfate versus magnesium at Guaymas. 1633-19 Hydrogen sulfide at Guaymas. 1643-20 Manganese versus magnesium at Guaymas. 1673-21 Iron versus magnesium at Guaymas. 1693-22 Iron versus manganese at Guaymas. 1703-23 Zinc versus magnesium at Guaymas. 172
Chapter 4
Appendix 1
Al-1 Titanium water sampler. 207
Appendix 2
Appendix 3

11
LIST OF TABLES
Page Number
Chapter 1
Chapter 2
2-1 21° N Vent Locations. 242-2 SW Vent Descriptions. 262-3 Calculated Water/Rock Ratios and Extraction 31
Efficiencies for 21 N.
2-4 Endmember Concentrations - The Alkalis. 392-5 Endmember Concentrations - The Alkaline Earths. 482-6 Endmember Concentrations. 572-7 Sodium versus Chloride - 21° N. 672-8 Endmember Concentrations - Sulfur Species. 712-9 Total Sulfur Concentration. 732-10 Endmember Concentrations - Trace Metals. 772-11 Endmember Concentrations - Arsenic and Selenium. 842-12 Temperature, Silica and the Depth of Reaction. 982-13 Comparison of 21° N to Experiments. 1212-14 Ratios of Elements to Iron in Metalliferous Sediments 124
and the 210 N Hydrothermal Solutions.
Chapter 3
3-1 A Values for Guaymas Solutions. 1363-2 Sodium versus Chloride - Guaymas. 1613-3 Comparison of Guaymas Hydrothermal Solutions and 178
Pore Waters.
Chapter 4
4-1 Comparison of Hydrothermal and River Fluxes. 192
Appendix 1
Al-1 Particle Digestion Analyses. 214
Appendix 2
A2-1 Analytical Determinations and Methods. 216
Appendix 3
A3-1 Major Element Results. 232A3-2 Trace Element Results. 236

12
CHAPTER 1
Introduction
The existence of oceanic hot springs had been postulated for several
years on a geophysical (Elder, 1965) and a geochemical basis (Corliss,
1971) before their discovery in 1977. On a geophysical basis they were
postulated to explain the anomalously low conductive heat flow observed on
young ocean crust as being due to convective cooling (Wolery and Sleep,
1976). On a geochemical basis they were invoked as being a possible
control on the composition of seawater and sediments, as well as providing
the missing source/sink in several elemental mass balance calculations.
The metalliferous sediments found on the ocean ridges and as the basal
section of the sediment column (Bonatti, 1975) implied that these waters
might be an effective medium of metal transfer from basalt to the seafloor
(Corliss, 1971). The ophiolite sections observed on land provided evidence
for the hydrothermal alteration of oceanic crust as well as the deposition
of massive metal sulfides by these fluids (Coleman, 1977). Further
evidence for pervasive high and low temperature hydrothermal alteration of
the oceanic crust came from rocks dredged from the seafloor (Humphris and
Thompson, 1978a,b; Delaney et al., 1983). Water column anomalies of
helium-3 (Craig and Lupton, 1981) and manganese (Weiss, 1977; Klinkhammer
et al., 1977) over the ridge crest implied that an injection process must
be active at the present time.
Submarine hot springs were first observed and sampled at the Galapagos
Spreading Center (GSC) (00 47'N, 86°08'W) (Corliss et al., 1979) . The hot
water reached a maximum temperature of 30° C. Various chemical parameters
indicated that the water was seawater which had reacted with basalt at
13
temperatures of ~350° C and then mixed subsurface with ambient seawater
resulting in the deposition of metal sulfides and alkaline earth sulfates
at depth (Edmond et al., 1979a,b). The chemistry of the hydrothermal water
was greatly altered from that of normal seawater. The helium/heat
relationship found in these samples (Jenkins et al., 1978), when combined
with the global helium budget implied that these hydrothermal waters have a
great influence on the chemistry of seawater. The 350° C endmember had,
however, not been observed. The mixing with ambient seawater at depth in
the system and resulting oxidation and precipitation reactions precluded
"seeing back" to the original endmember composition for many of the trace
metals. The iron, copper, zinc, silver, sulfur, etc. concentrations in the
endmember, which are important for the interpretation of massive sulfide
deposits in ophiolite and other terrains could not be determined.
Experimental work on seawater-basalt reactions at temperatures in the
300-400 C range suggested that these solutions carried significant amounts
of these "ore-forming" species (Bischoff and Dickson, 1975; Hajash, 1975;
Seyfried and Bischoff, 1977; Seyfried and Mottl, 1977; Mottl and Holland,
1978; Mottl, Holland and Corr, 1979; Seyfried and Dibble, 1980).
In early 1979 hot springs were found at 210 N on the East Pacific Rise
(EPR) with exit temperatures of 380+300 C (RISE Project Group, 1980). In
November 1979 in a series of five Alvin dives we sampled these "black
smokers" and measured temperatures of 350+50 C. This was a reconnaissance
cruise to test sampling schemes and based on this experience we returned to
210 N in 1981 with new sampling equipment. Most of this thesis is based on
the 1981 sampling of the hot springs, although occasional reference is made
to the 1979 samples. Four vent areas were sampled in 1981: the same three
as were sampled in 1979 as well as one newly discovered one. A fuller
14
description of the sample collection is given in Appendix 1.
The solutions sampled at 21° N do not mix with ambient seawater until
they exit on the seafloor. There, as the hot, acid, metal and sulfide rich
hydrothermal solution mixes with the cold, alkaline sulfate rich seawater,
sulfides and sulfates are precipitated building large (up to 20 meter)
constructional features on the pillow terrain. The buoyant solutions form
plumes of "black smoke" (predominately pyrrhotite (FeS) with other metal
sulfides present) as they mix with seawater and these particles are
dispersed through the water column. The hydrothermal solutions are clear
until they mix with seawater and with the samplers used in 1981, which
could reach into the "throat" of the vents, the "pure" hydrothermal
solution was sampled. This allowed the concentrations of iron, copper,
zinc, sulfur, etc. to be measured directly in these solutions.
North of the vent fields at 21 N the East Pacific Rise enters the
Gulf of California. The Gulf is the closest western hemisphere analog to
the Red Sea and the spreading center is covered by several hundred meters
of sediment. Guaymas Basin, located approximately halfway up the Gulf, is
divided into a northern and southern trough by a transform fault. This
basin was thought to be a present site of hydrothermal activity based on
heat flow (Lawver et al., 1975), helium-3 in the water column (Lupton,
1979), deposits sampled by submersible (Lonsdale et al., 1980) and the
results of DSDP drilling in the basin (Curray, Moore, et al., 1982).
In January 1982 we sampled the hydrothermal solutions in the Guaymas
Basin for the first time. The temperatures were not as high as at 21 N
(315° C was the maximum measured temperature) but the main difference
between the two areas is that the solutions at Guaymas must pass through
~500 meters of sediment before they exit (some also as "black smokers") on

15
the seafloor.
In the spring of 1982 the French found many smokers at 130 N on the
East Pacific Rise and sampled several of them (Michard et al., 1983).
Based on water column anomalies of helium-3, manganese and methane there is
good evidence that hot springs also exist on the East Pacific Rise at
15-20 S (Lupton and Craig, 1981), although they have not been sampled
directly. Similar water column and pictorial evidence exists for hot
springs on the Juan de Fuca/Gorda Ridge (Normark et al., 1982) but they
have not as yet been sampled directly. The discovery of these other areas
suggests that hot springs are a common phenomenon on the intermediate to
fast spreading sections of the world ridge crest (Figure 1-1). Additional
evidence that this is so comes from the same specialized fauna (+ a few
species) found at all these sites, although they are separated by thousands
of kilometers.
The main objective of this thesis is to define the chemistry of the
hydrothermal solutions at two of these sites: 210 N EPR and Guaymas Basin,
Gulf of California, and to evaluate their importance to ocean chemistry and
other phenomena such as massive sulfide deposits. These two areas will be
compared to the solutions sampled at the GSC. These areas provide examples
of three kinds of seafloor hydrothermal activity, although the basic
process occurring at all three is the same. In all cases seawater reacts
with basalt at temperatures of >300° C. At GSC the system is "leaky" and
the hydrothermal solutions mix with ambient seawater and precipitate below
the seafloor. As a result the solutions are relatively cool and depleted
in metals and sulfur when they reach the seafloor. At 210 N the system is
"tight" and it is at the seafloor that the hydrothermal solutions mix with
ambient seawater and precipitate metal sulfides and sulfates as the

16a. .. .... ,, , ....· ,
Jua
a~
a
t
IIIa 111ii
Figure 1-1: Map of discovered submarine hydrothermal systems.
II
IIIIIIIIIIIIIIIIIIIII

17
constructional "chimneys" and plumes of "black smoke". At Guaymas the
hydrothermal solutions react with the sediments through which they pass on
their way to the seafloor, depositing some of their metal sulfides in the
sediment column as well as increasing their concentration of other species.
These solutions retain enough metals and sulfide to still build chimneys
and be black smokers when they exit on the seafloor. Figure 1-2 is a
schematic comparison of these three systems.
It is important to understand what causes the differences in chemistry
between these systems, as whether they are low temperature and "leaky"
(like GSC), high temperature and "tight" (like 210 N), or sediment covered
(like Guaymas) will affect their net input to the ocean. Understanding
their chemistry is also important for an understanding of the deposits they
can form. The 210 N solutions can be called "ore-forming" based on their
solution chemistry but much of this metal content is dispersed in the water
column. At Guaymas, the sediment cover provides a trapping mechanism and
it may be an example of a sediment-hosted or Besshi-type ore deposit
(Franklin et al., 1981) in formation.
Chapter 2 of this thesis contains the results of the major and trace
element analyses of the 210 N hydrothermal solutions as well as a
discussion of the data. It addresses the question of what is controlling
the solution chemistry. The solution chemistry is also compared to what is
known about the alteration assemblages found in oceanic rocks, the
composition of the chimneys at the 210 N site, the composition of massive
sulfide deposits in ophiolites, metalliferous sediments, and to the
experimental work on seawater-basalt interaction. Chapter 3 contains the
results and discussion of the Guaymas data. It addresses the same
questions as were posed in Chapter 2. In addition the solution composition

18
Figure 1-2: Schematic showing a comparison of three hydrothermal systems.
Galapagos Spreading Center where seawater mixes with thehydrothermal solutions subsurface leading to the subsurfaceprecipitation of metal sulfides (shown by the ##).
210 North, East Pacific Rise where seawater mixes with thehydrothermal solutions on the seafloor leading to theprecipitation of metal sulfides as chimneys and black smoke.
Guaymas Basin, Gulf of California where the hydrothermalsolutions also react with sediments leading to theprecipitation of metal sulfides in the sediments and on theseafloor. Secondary hydrothermal systems driven by dikeintrusions also occur in the basin.

19
Galapagos Spreading Center
Seawater
HEAT'-
21'North, East Pacific Rise
Seawater
Basalt
IHEAT-
Guaymas Basin, Gulf of California
Sea-water
Sediment
Basalt
_
I
I
I · I-CIY · - --
L I I Ill I I I · ~l _11
A9 L4F
Vej
j
t
L
: AT -_
20
is compared to the results of pore water and sediment analyses in DSDP
sites 477 and 477A, which were in the Guaymas Basin. Chapter 4 is a
comparison of the two systems and in conclusion attempts to access the
general importance of seafloor hydrothermal activity to ocean chemistry.
21
CHAPTER 2
210 N - Results and Discussion
Two major questions need to be addressed with respect to the 21 N
solution chemistry. As these were the first high temperature submarine hot
springs sampled and as they comprise the most complete data set it is
important to define their composition and the magnitude of variability
which exists between vents. To be able to generalize the hot spring
composition in an attempt to define their total input to the oceans it is
necessary to understand what is controlling their chemistry. This chapter
is a presentation of the results from 210 N, followed by a discussion of
the data. The discussion addresses the question of what is controlling the
solution chemistry.
Submarine hydrothermal solutions were postulated to be the source of
massive sulfide deposits and metalliferous sediments and to be responsible
for the alteration of seafloor rocks. The final part of this chapter is a
comparison of the hot spring chemistry to the chemistry of these other
observed phenomenon, in order to set some constraints on whether the hot
springs could be responsible and what major disparities exist.
2.1 Sample Setting
At the 21 N site three active vent areas were sampled in 1979 and a
fourth area was found and sampled in the 1981 series of ANGUS tows and
Alvin dives. The ridge axis here trends N38°E (Ballard et al., 1981) and
the vents occur over a distance of 8.4 km (Figure 2-1). Starting from the
north the vent areas are: National Geographic Society (NGS), Ocean Bottom
Seismograph (OBS), Southwest (SW) and Hanging Gardens (HG). Their x,y
o
%s,
Po.
---\- ---- , \ \ i N I
(increase in dteptl) TOPOGRAPHIC TICGH) (increase in deptih)
- HG I t4 ':
"P.lack Smokers
(decrease in exiting temperature) ·(increasin g in racturing witlin V
· 5 Zone I votanics)----/. - '\ I I / \ _ . . . I \ \ - -,4
0O49
/Oc , o S. .--I 'O',<0,j, 0-4 oo
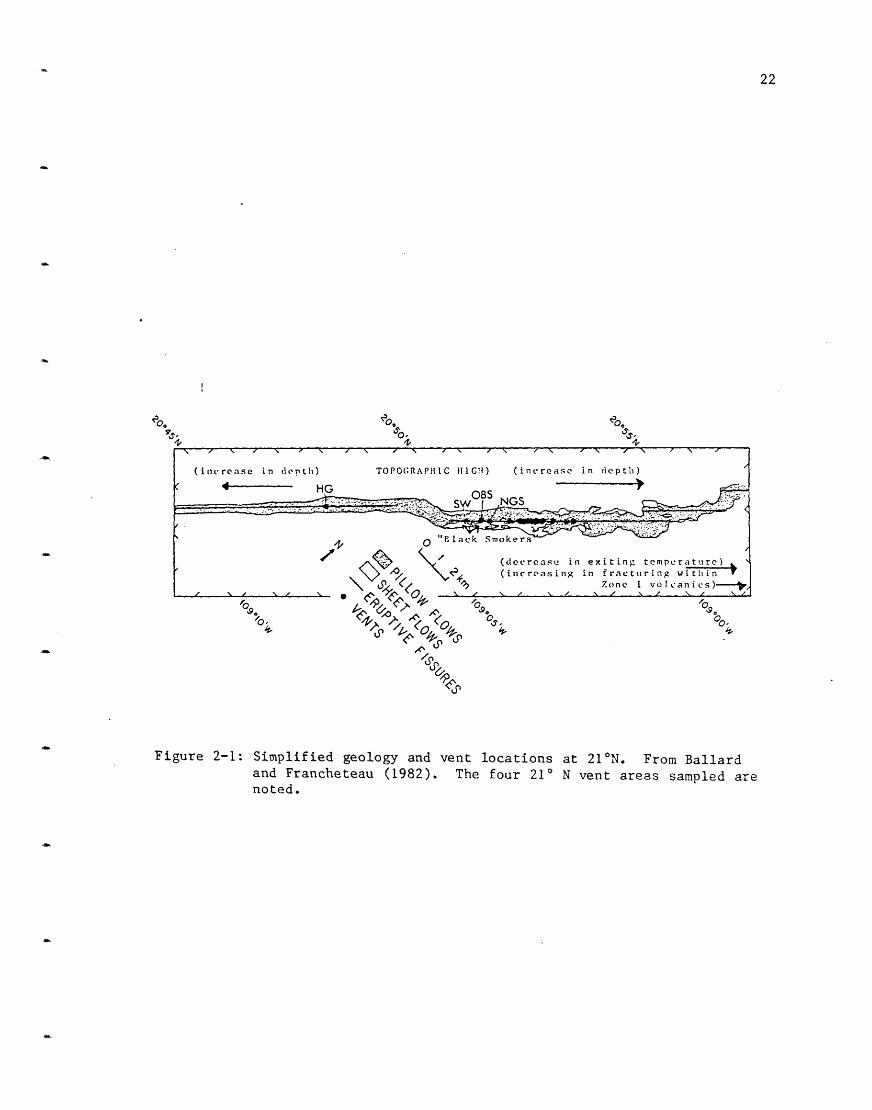
Figure 2-1: Simplified geology and vent locations at 210 N. From Ballardand Francheteau (1982). The four 21 N vent areas sampled arenoted.
22
%PO
.
I I I I i \ / \ / \ /
23
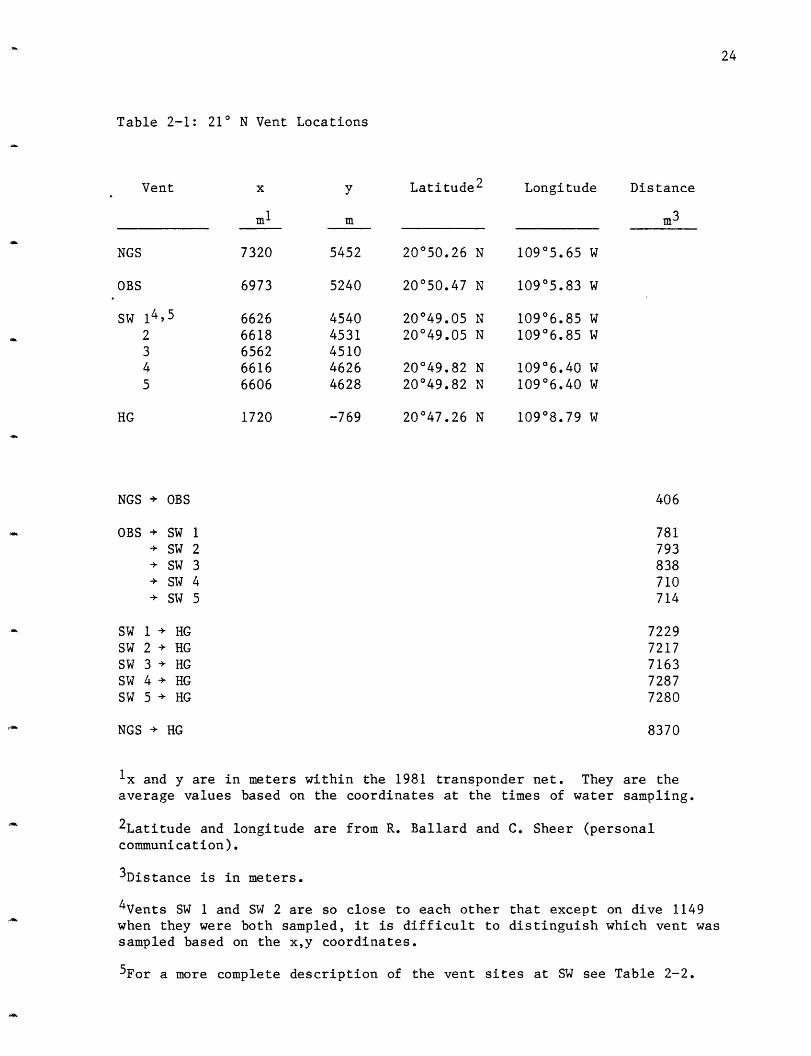
locations in the 1981 transponder net as well as their absolute latitude
and longitude and distance from each other are given in Table 2-1.
The East Pacific Rise at 210 N has a moderate spreading rate of 6.2
cm/yr (Larson, 1971) and the axial valley averages 5 km in width (Ballard
et al., 1981). Ballard et al. (1981) describe in detail the ridge axis at
21 N based on 1979 ANGUS tows and submersible work, as well as earlier
results. The HG vent area (the one furthest to the southwest) was not
found at the time of that survey but is included in a discussion by Ballard
and Francheteau (1982) which includes some of the results of the 1981
cruise. From the 1981 survey Ballard et al. (1981) assigned relative ages
to the lava flows on which the vents occur, based on the relative sediment
cover. NGS and SW are on the youngest flows while OBS is on a slightly
older one (HG was not included in this survey). All four of the vent areas
appear to be above eruptive fissures which are presumed to be the source of
the lava flows. Ballard and Francheteau (1982) point out that all of the
axial springs found to date occur on the topographic high between two
fracture zones. At 210 N, NGS, OBS and SW are north of this high while HG
is south of it (and separated from SW by 7.2 km) (Figure 2-1). HG is on
very young sheet flows, as are the other thrce vent areas, although the
flows at HG appear to be fed by a different fissure. At both GSC and 21 N
as the distance from this high increases, the temperature of the vents
decreases. NGS is the most northerly vent sampled and is cooler. Cooler
vents (not black smokers) exist further to the north. The survey with the
French submersible Cyana was still further to the north at 21° N and found
extinct vents but not active ones (Cyamex Scientific Team, 1981).
At the NGS area two vents exist; both -'re sampld in 1979 while only
one was sampled in 1981. The vent sampled in 1981 is the more southerly of
24
Table 2-1: 21° N Vent Locations
Vent x y Latitude 2 Longitude Distance
ml
7320
6973
6626
66186562
66166606
1720
m
5452
5240
45404531
451046264628
-769
m3
20°50.26 N
20050.47 N
20049.05 N20049.05 N
20049.82 N20049.82 N
20047.26 N
109°5.65 W
10905.83 W
109°6.85 W10906.85 W
10906.40 W10906.40 W
10908.79 W
NGS + OBS
OBS + SW 1+ SW 2
+ SW 3
+ SW 4
+ SW 5
SW 1 + HGSW 2 + HGSW 3 + HGSW 4 + HGSW 5 + HG
NGS + HG
406
781
793
838
710
714
722972177163
72877280
8370
Ix and y are in meters within the 1981 transponder net. They are the
average values based on the coordinates at the times of water sampling.
2Latitude and longitude are from R. Ballard and C. Sheer (personalcommunication).
3 Distance is in meters.
4Vents SW 1 and SW 2 are so close to each other that except on dive 1149
when they were both sampled, it is difficult to distinguish which vent wassampled based on the x,y coordinates.
5For a more complete description of the vent sites at SW see Table 2-2.
NGS
OBS
SW 14,5
2
3
4
5
HG

25
the two sampled in 1979. No water was exiting from this vent when the
submarine first approached it but after excavating it, the chimney began to
flow freely and the measured temperature of 273 C was stable over the five
days during which this vent was visited three times. In 1979 its measured
temperature was 350 C.
Only one active vent was found at the OBS site although the several
large extinct chimneys at this site have sometimes caused it to be called
the "Black Forest". This vent was a triptych of three approximately three
meter high chimneys on top of a large basal mound. The biology at this
site is extremely sparse and only a few crabs were observed. Of the four
vent areas visited at 21 N it has the largest visible sulfide deposit.
The maximum measured temperature was 350° C.
The SW vent has four active black smokers along with several extinct
ones and numerous warm vents or seeps between the pillows. At least one of
the vents at SW was extinct and began flowing after the submersible
excavated it. At another extinct chimney, overgrown by tube worms, water
of 274 C was found under the worms. The maximum temperature of 3550 C was
measured in this area. A fuller description of the vent sites is given in
Table 2-2. The vents at SW lie close to the edge of a collapse pit
believed to have been formed by the draining of a lava lake. There is a
greater profusion of biological activity at SW than at either NGS or OBS
and there are large areas with clams nestled between pillows.
The HG area consists of one mound with several chimneys on it. It
also contains a very profuse biological community. The maximum measured
temperature was 351 C.
An additional vent was observed north of NGS on dive 915 during the
RISE expedition in the spring of 1979. However only extinct chimneys were
found on the 1981 dives.

26
Table 2-2: SW Vent Descriptions
Vent Description
SW 1 (x=6626, y=4540) A single vent with three orifices, it wasfirst sampled on dive 1149 (all three orifices). It was also
sampled on dive 1153 and may have been sampled on dives 1150and 1157.(Samples 1149-3,4,7,8,9,10,11,12, all 1150?, 1153-5,9,13,14,1157-2?,4?,7?,8?,9?,13?)Maximum temperature = 355 C.
SW 2 (x=6618, y=4531) A single vent on a large mound, it was firstsampled on dive 1149. It is very close to SW 1 and it is
difficult to discern if SW 1 or SW 2 were sampled on dives 1150
(probably SW 2) and 1157.
(Samples 1149-1,2,6,13, all 1150?, 1157-2?,4?,7?,8?,9?,9?,13?)Maximum temperature = 346° (3500?) C.
SW 3 (x=6562, y=4510) This vent was sampled on dive 1153 and was
extinct until it was excavated by the submarine. It is
approximately 8.9 m high.(Samples 1153-6,12,13,18)Maximum temperature = 270 C.
SW 4 (x=6616, y=4626) This vent was sampled on dive 1157.
(Samples 1157-6,10,14,15,17,18)Maximum temperature = 275 C.
SW 5 (x=6606, y=4628) This was an extinct vent buried under tubeworms.(Samples 1153-10,11)Maximum temperature = 274 C.
27
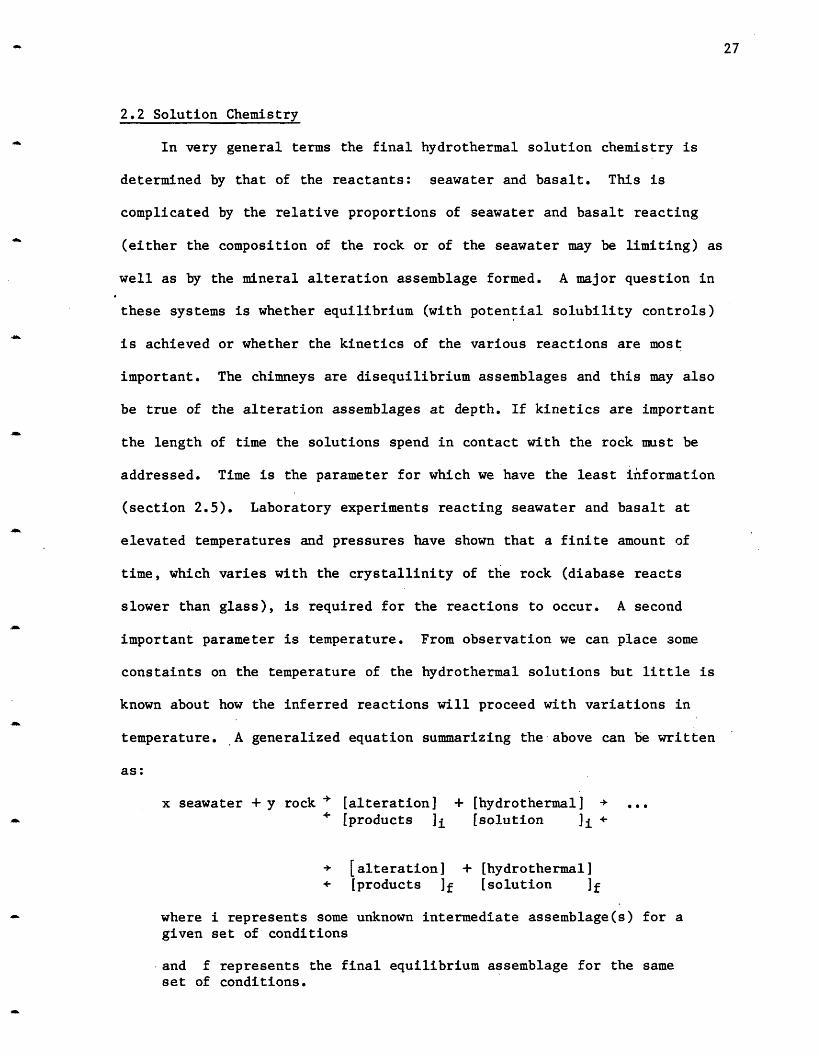
2.2 Solution Chemistry
In very general terms the final hydrothermal solution chemistry is
determined by that of the reactants: seawater and basalt. This is
complicated by the relative proportions of seawater and basalt reacting
(either the composition of the rock or of the seawater may be limiting) as
well as by the mineral alteration assemblage formed. A major question in
these systems is whether equilibrium (with potential solubility controls)
is achieved or whether the kinetics of the various reactions are most
important. The chimneys are disequilibrium assemblages and this may also
be true of the alteration assemblages at depth. If kinetics are important
the length of time the solutions spend in contact with the rock must be
addressed. Time is the parameter for which we have the least information
(section 2.5). Laboratory experiments reacting seawater and basalt at
elevated temperatures and pressures have shown that a finite amount of
time, which varies with the crystallinity of the rock (diabase reacts
slower than glass), is required for the reactions to occur. A second
important parameter is temperature. From observation we can place some
constaints on the temperature of the hydrothermal solutions but little is
known about how the inferred reactions will proceed with variations in
temperature. A generalized equation summarizing the above can be written
as:
x seawater + y rock + [alteration] + [hydrothermal] + ...+ [products ]i [solution ]i +
+ [alteration] + [hydrothermal]+ [products If [solution ]f
where i represents some unknown intermediate assemblage(s) for agiven set of conditions
and f represents the final equilibrium assemblage for the sameset of conditions.
28
These assemblages will be influenced by x/y, the water/rock ratio as well
as by the differences between the various reaction rate constants. Changes
in temperature will affect the reaction rates and products. In a closed
system with increasing time this series of reactions and assemblages will
proceed to the right (i.e. the reactions should have gone further towards
the equilibrium assemblage). The reaction sequence is more complicated in
an open system (more representative of the actual case), because new rock
surfaces and/or new solutions are continuously available.
The concentration of an individual species can be expressed as:
C = (CO + f(Cr) - w)h
where C = concentration in the hydrothermal solutionCo = starting concentration in seawaterf(Cr) = some function of the concentration in the rockw = a removal term which may be related to solubility or the
production of alteration phases.h = hydration factor.
In this expression the water/rock ratio (x/y), time and temperature
parameters are included in the f(Cr) term. It is not known how each of
these factors will affect the concentration and since they cannot be
separated, they are combined in one term. Most of the major elements,
excepting magnesium and sulfur, show a net gain as the solutions traverse
the hydrothermal system; therefore f(Cr)-w>O.
ENDMEMBER CONCENTRATIONS
As mentioned above, magnesium is lost from seawater during reaction at
elevated temperatures with basalt. Experimental work on these systems has
shown that the magnesium is essentially quantitatively removed from the
seawater at low water/rock ratios as are found at 210 N. (Water/rock
ratios will be discussed below.) Bischoff and Dickson (1975) have shown
that the magnesium reacts with a silicate species and water to form a

29
Mg-hydroxy-silicate with a resultant release of protons. These protons
then undergo further reaction with silicates, exchanging for cations such
as K and Ca2+ and releasing them to solution.
At 210 N, Guaymas and the GSC magnesium decreases in all the vent
fields and is assumed to reach zero in the pristine hydrothermal solution.
Surface seawater is used to fill the dead volume in the samplers (3.8 out
of 755 milliliters - Appendix 1), therefore seawater (and some magnesium)
is present in all the samples. Some ambient seawater may also be entrained
during sampling and based on mineralogical evidence the chimneys themselves
are somewhat "leaky" to seawater (Haymon and Kastner, 1981; Goldfarb,
1982). The assumption that magnesium is zero in the pure hydrothermal
solution can therefore not be proven directly. The magnesium content of a
solution is used as a mixing indicator. At 210 N samples with Mg <2.1
mmoles/kg (>96% hydrothermal water) were obtained in all the vent fields.
A check that the magnesium is actually a sampling artifact comes from the
Mg/SO4 ratio. If this (molar) ratio is equal to the seawater value, both
of these species can be assumed to be from seawater entrainment. The
observed Mg/SO 4 ratio is close to the seawater value in all of the samples
and within a small error they extrapolate to zero together (see sulfur
discussion and Table 2-8).
The concentration of the "pure" hydrothermal endmember for a given
element is obtained by fitting a least squares line to the data, forcing it
through the composition of ambient seawater at the appropriate depth and
extrapolating to zero magnesium. These calculated endmember concentrations
are the ones given in the tables throughout this chapter. The complete
data set is given in Appendix 3.
Once the endmember concentration has been determined several other

30
parameters can be calculated. A simple but important calculation is to
find the net addition (6) of an element to the solution and to then
determine what fraction of the original rock composition this represents.
The net addition (6) is arrived at by correcting for the water loss due to
rock hydration and the amount of the element originally present in the
seawater:
C6 = - - Co = f(Cr) - w.
h
The correction for hydration can be made based on either of two
parameters. From the 618 0-6D results (Craig and Welhan, personal
communication) it appears that the solutions from all of the 210 N vent
areas have lost approximately 10% of their water; presumably due to rock
hydration. From the chloride data, which only show an increase in the NGS
vent, the water loss appears to be 7%. (In the other vents there is a net
C1 loss.) To calculate the net additions (6) to the solution given in
Table 2-3, all of the solutions are corrected for a 7% loss of water (as
the isotopes show the same loss for all the areas) and then corrected for
the original composition of the seawater (i.e. assuming w is zero and
solving for f(Cr) ). The water loss due to C is used rather than that
from the isotopes because the isotopic value is dependent on assumptions
about the temperature of reaction and the isotopic fractionation factors
which are not well known. If the 7% water loss from C1 is an underestimate
(i.e. a C1 sink is also active at NGS) the 6 values will be too large. The
tabulated 6 values can be viewed as an upper limit.
A calculation based on the net addition (6) of an element to seawater
can be made to derive the approximate water/rock ratio. If it is assumed
that the element of interest is quantitatively leached from the rock
(extraction efficiency = 1), the amount originally present in the rock

31
Table 2-3: Calculated Water/Rock Ratios and Extraction Efficiencies for21 N
Element RockWater/
6 Rock
ExtractionEfficiency3
AlkaliExtractionEfficiency4
Li NGSOBSSW
HG
Na NGSOBSSWHG
K NGSOBSSWHG
Rb NGSOBSSWHG
Be NGSOBSSW
HG
Ca NGSOBSSWHG
1.45Wml,2
0.78JM
24Jm
50W-
2.15JM
Mg NGSOBSSW
HG
1.6
1.8
1.8
1.1
60
1.7
2.02.01.9
0.29-1.60.32-1.80.33-1.90.27-1.5
2000360054004200
230
500
4103100
0.450.390.390.45
0.012
0.420.340.340.26
0.43-2.50.38-2.20.37-2.10.33-1.9
3.5x10⁻⁴
2.0x10⁻⁴
1.3x10⁻⁴
1.2x10⁻⁴
0.0030.0010.0021.6x10-4
1.1
1.1
1.1
1.7
0.028
- 1
- 1
= 1
= 1
1.0-6.01.1-6.31.0-6.01.2-7.1
8.5x10⁻⁴
5.6x10⁻⁴
3.7x10⁻⁴
4.6x10- 4
7.2x10⁻³
4.0x10⁻³
4.9x10⁻³
6.2x10⁻⁴
0.7-1.8KHm 3p 230-600-11-10-26
0.001-0.003 0.007-0.003
Ba NGSOBSSWHG
0.05-0.070.02-0.030.03-0.040.02-0.03
0. 12-0.170.07-0.090.09-0.120. 09-0.13
937p805
812
1296
13m-60-54-50
14.3m11.8
11.8
12.5
28p
25
24
30
25n14
9.3
12
9.2m4.3
5.3
0.7
-52.7m-52.7-52.7-52.7
Sr NGSOBSSW
HG
15S
7
9
10
10-1421-3017-2315-21
150-210R~

32
Element Rock
C1 NGSOBSSWHG
SiO2 NGSOBSSWHG
Al NGSOBSSWHG
S04 NGSOBSSWHG
H2S NGSOBSSWHG
As NGSOBSSWHG
Water/6 Rock
ExtractionEfficiency3
AlkaliExtractionEfficiency4
= Om
-84-77
-77
8.25JM
3.02JM
13Rm
13-27WI
18.0m16.2
15.9
14.3
3.7p
4.84.44.2
460510
520
580
8.2x10⁵
6.3x10⁵
6.9x10⁵
7.2x10⁵
0.00150.00140.00130.0009
8.6x10⁻⁷
1. 1x10 - 6
1.0x10- 6
7.0x10⁻⁷
0.00370.00390.00390.0033
2. 1x10- 6
3.2x10- 6
2.9x10⁻⁶
2.6x10⁻⁶
-27.9m-27.4-27.3-27.5
6.13m6.81
6.957.81
<30n203172
393
2.1
1.9
1.9
1.7
64-13076-16033-69
0.330.370.370.30
0.005-0.0110.004-0.0090.007-0.015
0.801.1
1.7
1.1
0.015-0.0310.013-0.0260.028-0.057
1.9-2.3KHi
26Jm
1.33JM
0.75KHm
<ln
63
63
63
935p
895
652
819
812P
1552
699
2265
21n199
62
212
30-3730-3730-37
28
29
40
32
1600
8601900
590
360003800120003500
0.019-0.0230.019-0.0230.014-0.017
0.0250.0240.0180.016
4.3x10⁻⁴
8.2x10⁻⁵
3.7x10⁻⁴
8.5x10⁻⁴
2.0x10⁻⁵
1.9x10⁻⁴
5.8x10⁻⁵
1.4x10⁻⁴
0.055-0.0660.055-0.0660.052-0.063
0.0610.0690.0500.060
1.0x10⁻³
2.3x10- 3
1.1x10⁻³
3.2x10⁻³
4.8x10⁻⁵
5.3x10⁻⁴
1.7x10⁻⁴
5.4x10⁻⁴
Se NGSOBSSWHG
Mn NGSOBSSWHG
Fe NGSOBSSWHG
Co NGSOBSSWHG
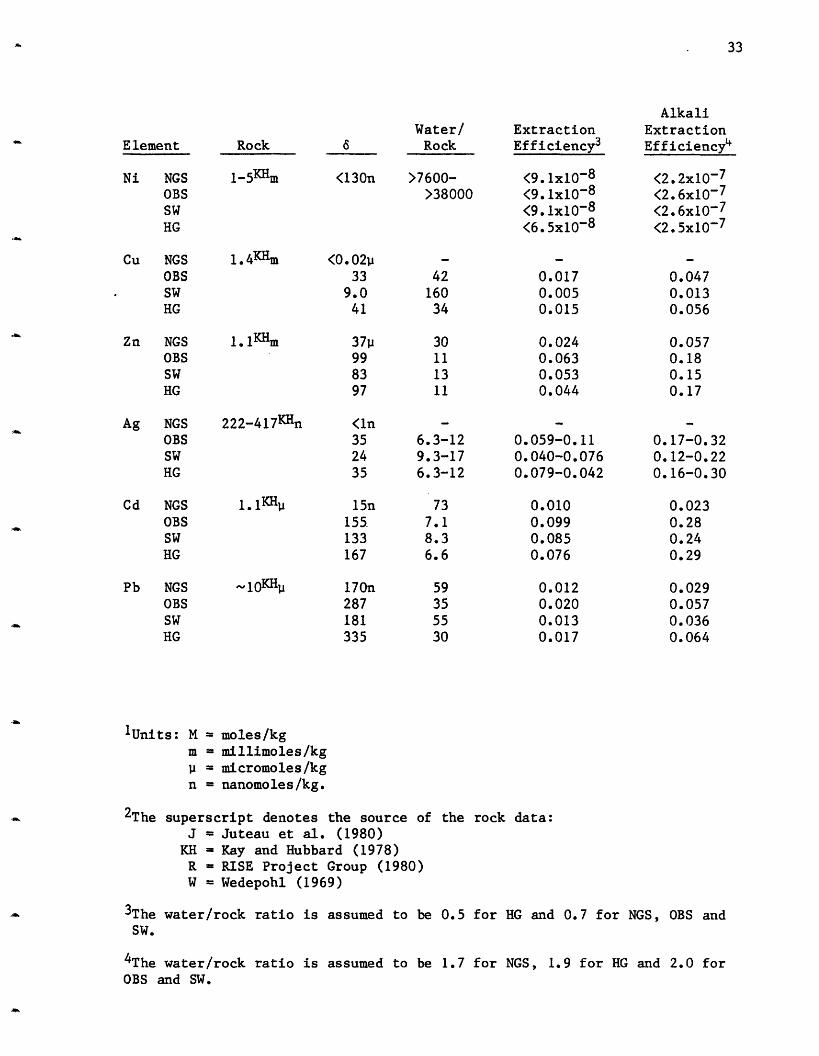
33
Water/6 Rock
<130n >7600->38000
<0.0233
9.041
37"99
83
97
42
160
34
30
11
13
11
ExtractionEfficiency3
(9. lx10 - 8
<9. 1x10 - 8
<9. lx10 - 8
<6.5x10- 8
0.0170.0050.015
0.0240.0630.0530.044
AlkaliExtractionEfficiency4
<2.2x10⁻⁷
<2.6x10⁻⁷
<2.6x10⁻⁷<2.5x10⁻⁷
0.0470.0130.056
0.0570.180.150.17
222-417KHn
1. 1K H
<ln
35
24
35
15n
155
133
167
170n287181
335
6.3-129.3-176.3-12
73
7.1
8.36.6
59
35
55
30
0.059-0.110.040-0.0760.079-0.042
0.0100.0990.0850.076
0.0120.0200.0130.017
0.17-0.320.12-0.220.16-0.30
0.0230.280.240.29
0.0290.0570.0360.064
1Units: M = moles/kgm = millimoles/kg
= micromoles/kgn = nanomoles/kg.
2The superscript denotes the source of the rock data:J = Juteau et al. (1980)KH = Kay and Hubbard (1978)R = RISE Project Group (1980)W = Wedepohl (1969)
3The water/rock ratio is assumed to be 0.5 for HG and 0.7 for NGS, OBS andSW.
4The water/rock ratio is assumed to be 1.7 for NGS, 1.9 for HG and 2.0 forOBS and SW.
Element
Ni NGSOBSSWHG
Cu NGSOBSSWHG
Zn NGSOBSSWHG
Rock
1-5KHm
1.4KHm
1.1Hm
Ag NGSOBSSWHG
Cd NGSOBSSWHG
Pb NGSOBSSWHG

34
divided by the net addition to the solution is the water/rock ratio:
water/rock ratio concentration in the rock/6.
These values are given in Table 2-3. This definition assumes a closed
system. A difficulty is knowing the concentration in the rock accurately.
The rock values have been taken from a variety of sources. Where possible
the rock concentration data were taken from the RISE Study Group (1980);
Juteau et al. (1980); or Moore et al. (1977); all of whom analyzed rocks
collected from 21 N on the EPR. Otherwise the values of Kay and Hubbard
(1978) were used. If no other data were available the values given in the
Handbook of Geochemistry (Wedepohl, 1969) were used. As the alkalis have
been shown to be almost quantitatively leached from the rocks in
experiments (Mottl and Holland, 1978) and to undergo only minor secondary
reactions, they are the elements best used to determine the water/rock
ratio. Many of the other elements appear to undergo secondary
precipitation reactions and this is apparent from their high calculated
water/rock ratios (e.g. Ca and Mn). From the alkali results (Table 2-3) it
can be seen that the 21 N system has a low water/rock ratio of close to 1.
This has important implications for the final solution and rock
composition.
A second parameter that can be determined if the water/rock ratio is
known is the extraction efficiency:
Extraction - (water/rock ratio) x (net addition 6 to solution)Efficiency initial rock concentration
Based on the water isotopes, Craig and Welhan (personal communication) have
calculated that the water/rock ratio is 0.5 at HG and 0.7 at SW, OBS and
NGS. As mentioned above their are some difficulties in using the isotopic
values. The uncertainities in this case would be much greater if
composition data were used because the rock composition is not good and the

35
assumption of total extraction from the rock is an oversimplification. The
water/rock ratios of Craig and Welhan have been used to calculate the
extraction efficiency in the fifth column of Table 2-3. The final column,
alkali extraction efficiency, is calculated on the basis of potassium, the
only alkali for which determinations in 21° N rocks are available.
Potassium is assumed to be quantitatively removed from the rock (extraction
efficiency = 1) and the water/rock ratio obtained for each vent area from
this calculation is used to calculate the extraction efficiency for the
other elements. Values greater than one are physically impossible and are
a result of the uncertainities in the calculation.
As the concepts of water/rock ratio and extraction efficiency are
important in the following they will be discussed more fully. The
water/rock ratio is a measure of the total transfer of a species from rock
to solution. It is often called an effective water/rock ratio (Ohmoto and
Rye, 1974) because it is dependent on many factors. Seyfried and Mottl
(1982) have defined it as the total mass of water which has passed through
a hydrothermal system during its lifetime divided by the mass of altered
rock within the system. In the case of 210 N this ratio is dependent on
the "freshness" of the rock (i.e. if the rock has been previously altered),
the pathlength (i.e. the amount of rock the solution comes in contact with,
which may vary between vent areas), the time the solution spends in contact
with the rock (presumably longer contact time will result in more being
leached into the solution), whether the solution sees a different
temperature history at depth (precipitation or retrograde reactions may
occur if the temperature drops or the leaching may be more efficient at a
higher temperature). 210 N is also an open system rather than a closed
flow system. As all of these complexities are incorporated into the term
water/rock ratio it should be kept in mind that it is not truly a physical
36
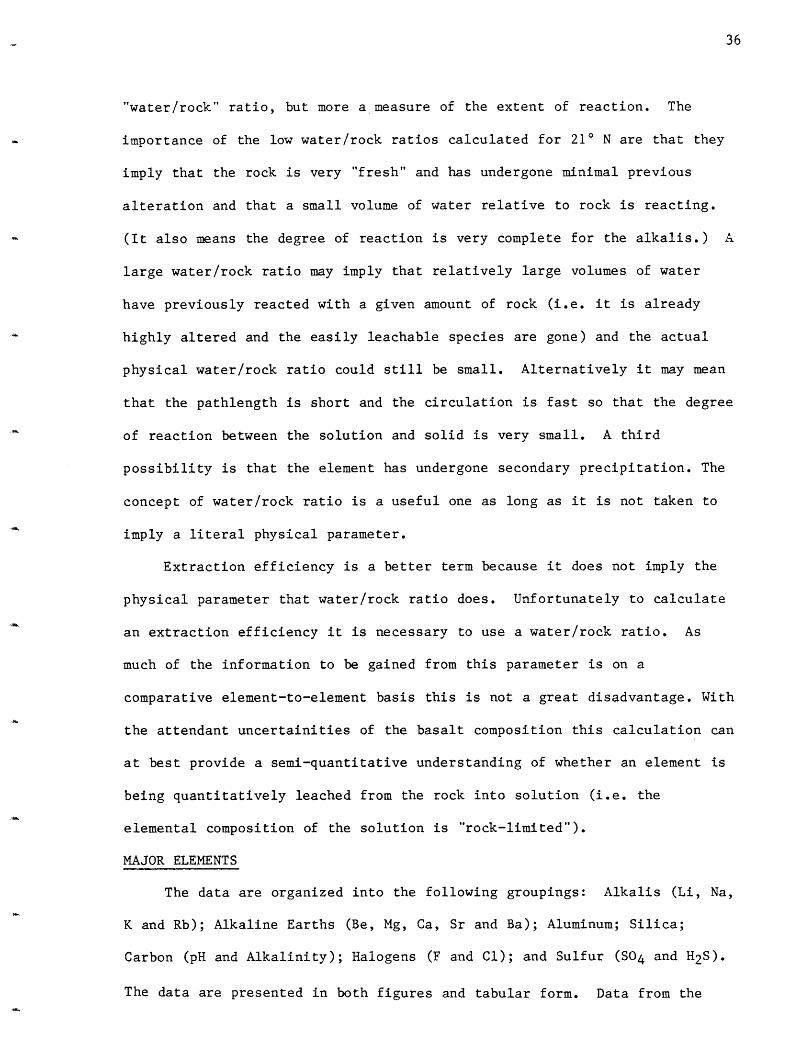
"water/rock" ratio, but more a measure of the extent of reaction. The
importance of the low water/rock ratios calculated for 21 N are that they
imply that the rock is very "fresh" and has undergone minimal previous
alteration and that a small volume of water relative to rock is reacting.
(It also means the degree of reaction is very complete for the alkalis.) A
large water/rock ratio may imply that relatively large volumes of water
have previously reacted with a given amount of rock (i.e. it is already
highly altered and the easily leachable species are gone) and the actual
physical water/rock ratio could still be small. Alternatively it may mean
that the pathlength is short and the circulation is fast so that the degree
of reaction between the solution and solid is very small. A third
possibility is that the element has undergone secondary precipitation. The
concept of water/rock ratio is a useful one as long as it is not taken to
imply a literal physical parameter.
Extraction efficiency is a better term because it does not imply the
physical parameter that water/rock ratio does. Unfortunately to calculate
an extraction efficiency it is necessary to use a water/rock ratio. As
much of the information to be gained from this parameter is on a
comparative element-to-element basis this is not a great disadvantage. With
the attendant uncertainities of the basalt composition this calculation can
at best provide a semi-quantitative understanding of whether an element is
being quantitatively leached from the rock into solution (i.e. the
elemental composition of the solution is "rock-limited").
MAJOR ELEMENTS
The data are organized into the following groupings: Alkalis (Li, Na,
K and Rb); Alkaline Earths (Be, Mg, Ca, Sr and Ba); Aluminum; Silica;
Carbon (pH and Alkalinity); Halogens (F and C1); and Sulfur (SO4 and H2S).
The data are presented in both figures and tabular form. Data from the

37
Galapagos Spreading Center (GSC) hydrothermal solutions (Edmond et al.,
1979a,b) are included in the tables of the 210 N and Guaymas data for
comparison. All of the tabulated data are of the extrapolated endmember
concentrations (Mg = 0, as discussed above). At Guaymas samples with low
magnesium were sampled in some but not all of the vent fields and almost
every vent sampled has a different composition. The GSC data are the
result of much greater extrapolations as no samples with Mg <50 mmoles/kg
(seawater = 53 mmoles/kg) were obtained in this area. Consequently these
values have a greater uncertainty.
The data for each element are also presented in a figure. The figures
are all of the same form with the element of interest (y-axis) versus Mg
(x-axis) and they are mixing lines between the hydrothermal endmember and
seawater. These mixing lines are artifacts of the sampling procedure and
are only useful for the soluble elements where they can aid in determining
endmember composition with more confidence than by analyzing a few endmember
samples alone. A discussion on an element by element basis follows.
THE ALKALIS
Lithium, sodium, potassium and rubidium were determined in the
hydrothermal solutions.
Lithium: Lithium increases in all four vent areas sampled at 21 N
(Figure 2-2). The HG vent area has the highest concentration, 1322
pmoles/kg, NGS is next at 1033 and the SW site at 899 and OBS site at 891
are indistinguishable. These values are comparable to the GSC values (Table
2-4) of 689-1142 pmoles/l, although the HG vent is higher. The lithium
concentration in seawater is 26 moles/kg; the vent concentrations
represent enrichment factors of up to 50 times the ambient values.
Approximately half of the lithium is removed from the rock (Table
2-3). The water/rock ratio calculated from Li is approximately twice that
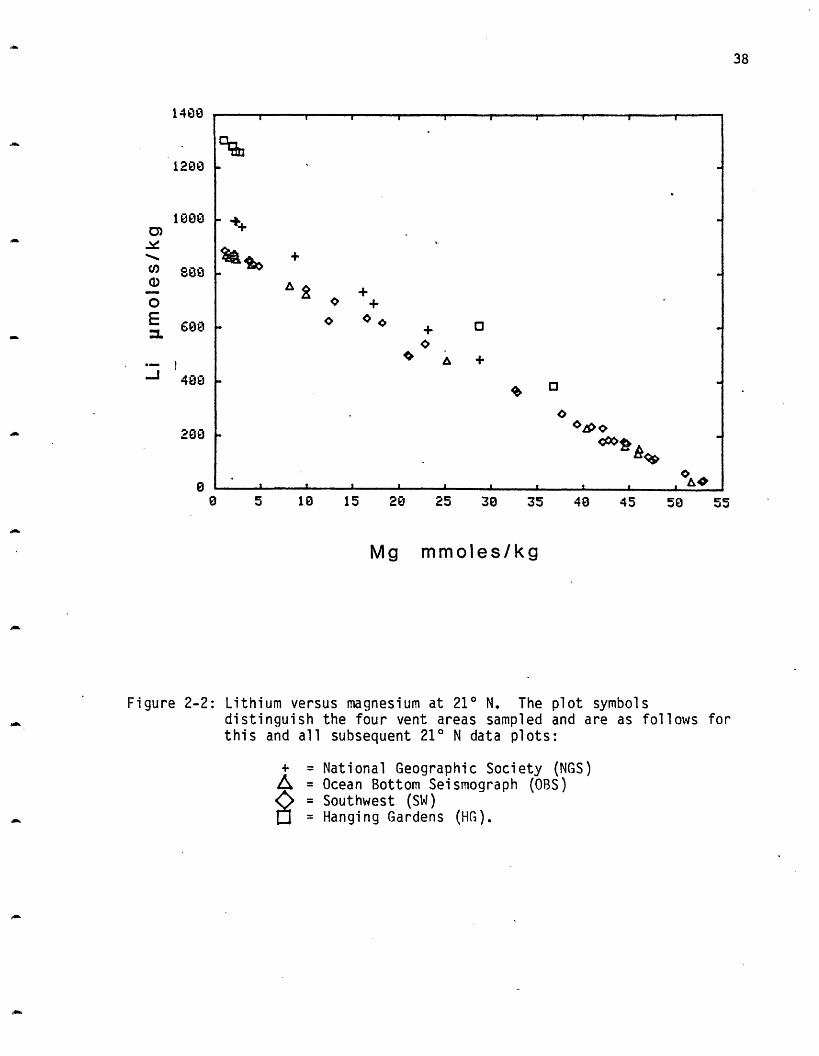
0 5 18 15 20 25 35 48 45 50
Mg mmoles/kg
Figure 2-2: Lithium versus magnesium at 210 N. The plot symbolsdistinguish the four vent areas sampled and are as follows forthis and all subsequent 210 N data plots:
+ = National Geographic Society (NGS)= Ocean Bottom Seismograph (OBS)= Southwest (SW)= Hanging Gardens (HG).
1400
1200
38
a,
0EMz
1800
608
- ~+
X> +
o A +
I 0.- I .,I I I , , p.-
055
_· __
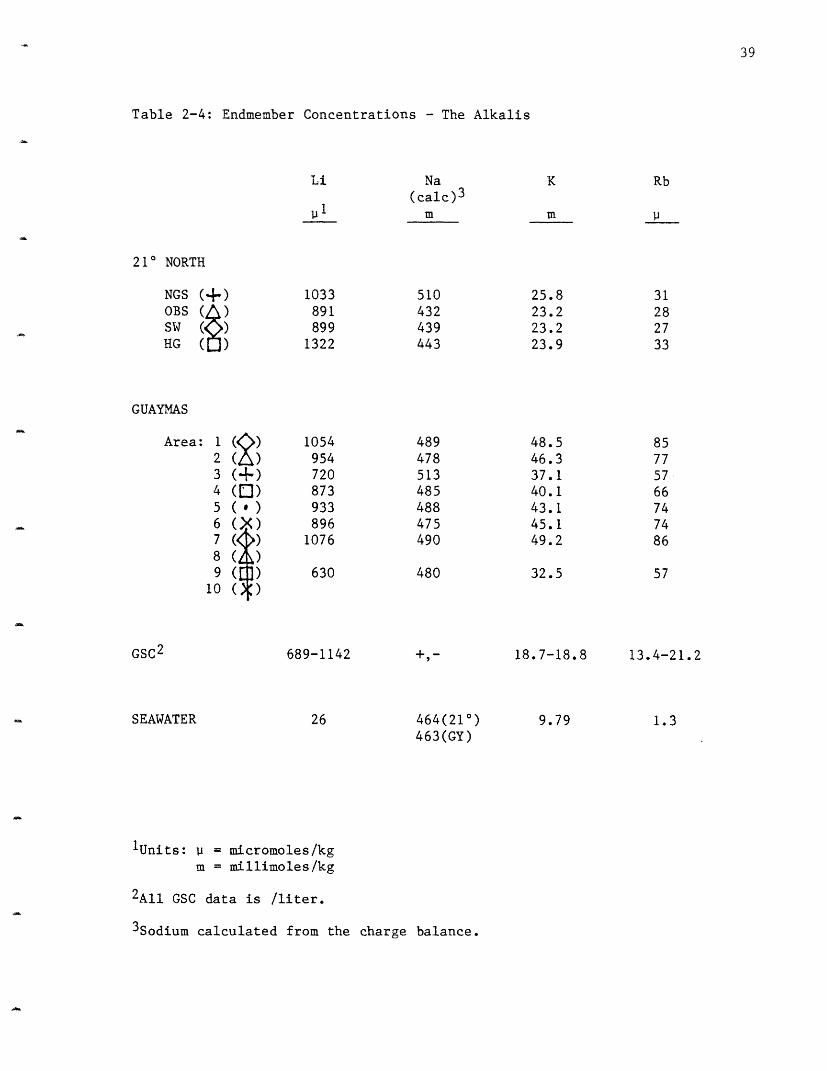
Table 2-4: Endmember Concentrations - The Alkalis
Li Na(calc)3
_l m
210 NORTH
NGS (4.) 1033 510OBS (A) 891 432SW ( ) 899 439HG ( ) 1322 443
GUAYMAS
Area: 1 (C)) 1054 4892 (z) 954 478
3 (4.) 720 5134 (0) 873 4855 ( ) 933 4886 ( ) 896 4757 ( ) 1076 490
8 ( )9 ( ) 630 480
10 ( )
GSC2 689-1142
26SEAWATER
18.7-18.8
464(21°)463(GY)
1Units: = micromoles/kgm = millimoles/kg
2All GSC data is /liter.
3Sodium calculated from the charge balance.
39
K
m
Rb
p
25.823.223.223.9
31
28
27
33
48.5
46.3
37.1
40.1
43.1
45.1
49.2
32.5
85
77
57
66
74
74
86
57
13.4-21.2
1.39.79
40
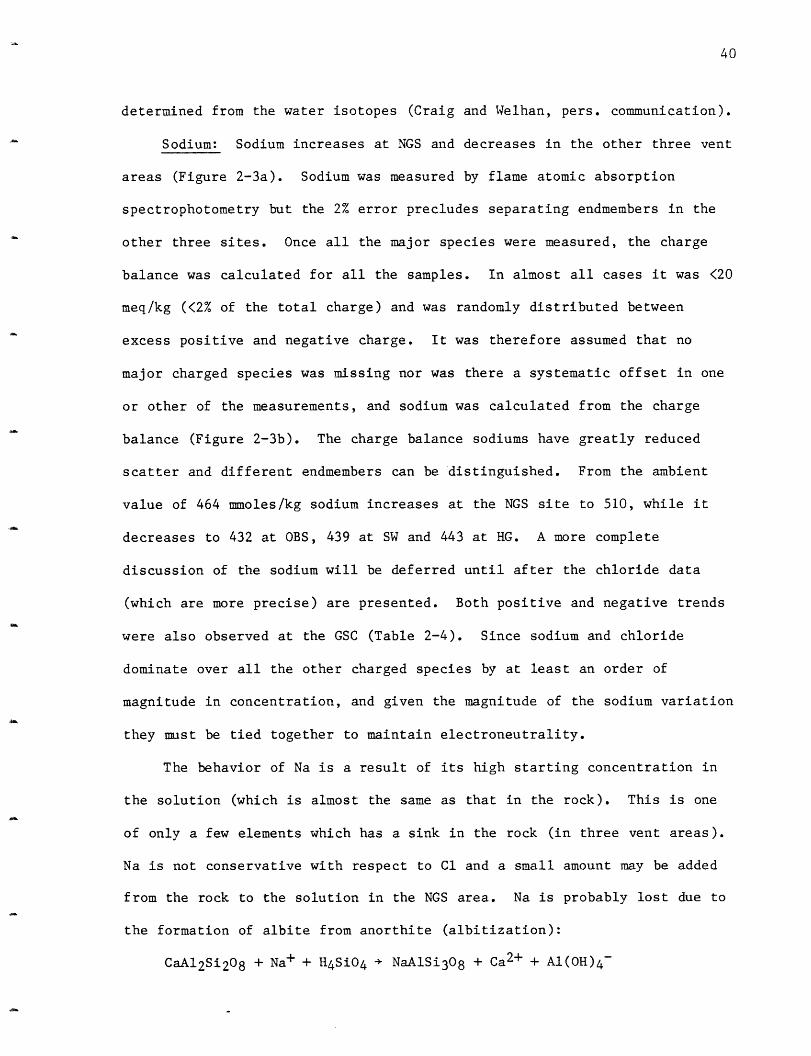
determined from the water isotopes (Craig and Welhan, pers. communication).
Sodium: Sodium increases at NGS and decreases in the other three vent
areas (Figure 2-3a). Sodium was measured by flame atomic absorption
spectrophotometry but the 2% error precludes separating endmembers in the
other three sites. Once all the major species were measured, the charge
balance was calculated for all the samples. In almost all cases it was <20
meq/kg (<2% of the total charge) and was randomly distributed between
excess positive and negative charge. It was therefore assumed that no
major charged species was missing nor was there a systematic offset in one
or other of the measurements, and sodium was calculated from the charge
balance (Figure 2-3b). The charge balance sodiums have greatly reduced
scatter and different endmembers can be distinguished. From the ambient
value of 464 mmoles/kg sodium increases at the NGS site to 510, while it
decreases to 432 at OBS, 439 at SW and 443 at HG. A more complete
discussion of the sodium will be deferred until after the chloride data
(which are more precise) are presented. Both positive and negative trends
were also observed at the GSC (Table 2-4). Since sodium and chloride
dominate over all the other charged species by at least an order of
magnitude in concentration, and given the magnitude of the sodium variation
they must be tied together to maintain electroneutrality.
The behavior of Na is a result of its high starting concentration in
the solution (which is almost the same as that in the rock). This is one
of only a few elements which has a sink in the rock (in three vent areas).
Na is not conservative with respect to C1 and a small amount may be added
from the rock to the solution in the NGS area. Na is probably lost due to
the formation of albite from anorthite (albitization):
CaA12Si208 + Na+ + H4SiO4 NaAlSi308 + Ca2+ + Ai(OH) 4 -

520
460
440
420
4000 5 10 15 20 25 30 35 40 45 50 55
Mg mmoles/kg
510
500
490
480
470
450
440
420
4100 5 10 15 20 25 30 35 40 45 50 55
Mg mmoles/kgFigure 2-3: Sodium versus magnesium at 210 N.
a. measured sodium.b. sodium calculated from the charge balance.
41
a)0E
coz
-10)
zo3Ea<3
, +~++
O °o+o
C> oo8 tt & A&0~~~~~~~~~~cO'e~~~~ a A:~
__

42
at depth in the system. This is a typical reaction of greenschist facies
metamorphism. (Greenschist facies metamorphism occurs at temperatures of
~250-450 ° C and moderate to low pressures. The assemblage typically
contains chlorite + albite + epidote + quartz.) The gain of sodium may be
due to the conversion of albite to chlorite, which is another mineral
typical of the greenschist facies.
NaAlSi30 8 + 3Mg2+ + 2Fe2+ + Al(OH) 4 - + 6H20
+ Mg3Fe2A12Si30 10 (OH)8 + Na+ + 8H+.
The reactions in this section are written for simplicity for the pure
endmembers of the albite and anorthite solid solution series. The
composition used for chlorite (which also has a range in composition) is
that found by Humphris (1977). Al is written as the Al(OH) 4- species which
is its dominant form in seawater. Based on thermodynamic modelling Al is
probably present as A(OH) 3 at the pH of the hydrothermal solutions. As
its speciation at the high temperature and pressure is unknown, although
probably still a hydroxy species, the equations are written with A(OH)4-.
A different speciation will change the proton balance but will not affect
any of the other conclusions.
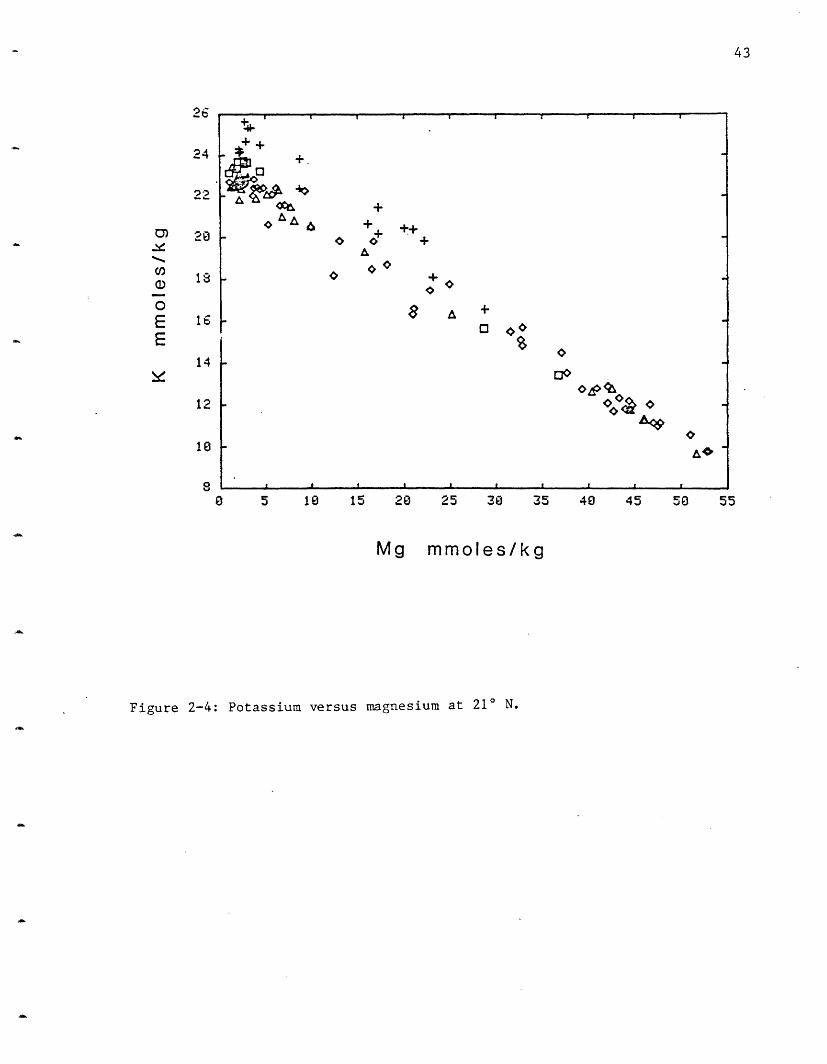
Potassium: Potassium exhibits a very limited variability between vent
fields (Figure 2-4). NGS, at 25.8 mmoles/kg, has the highest potassium
concentration while HG has 23.9 and is just barely resolvable from the OBS
and SW sites at 23.2. These values are significantly higher than the
18.7-18.8 mmoles/1 observed at the Galapagos (Table 2-4). The K values are
approximately 2.5 times the seawater value of 9.79 mmoles/kg. Potassium,
like Li, has a high extraction efficiency from the rock and its calculated
water/rock ratio (Table 2-3) is slightly higher than that of Craig and
Welhan. K is assumed to be leached from the rocks by a H+ for K+ exchange.
43
+ 4
0 &,& 4
o++
+
A
I _I I I I e I
0 5 10 15 20 25 30 35 40 45 50 55
Mg mmoles/kg
Figure 2-4: Potassium versus magnesium at 21 N.
26
24
0)
Cnd)
0EE
18
16
14
12
10
0
_ __ __
+ I I I I
%;a *o 0O,
_
44
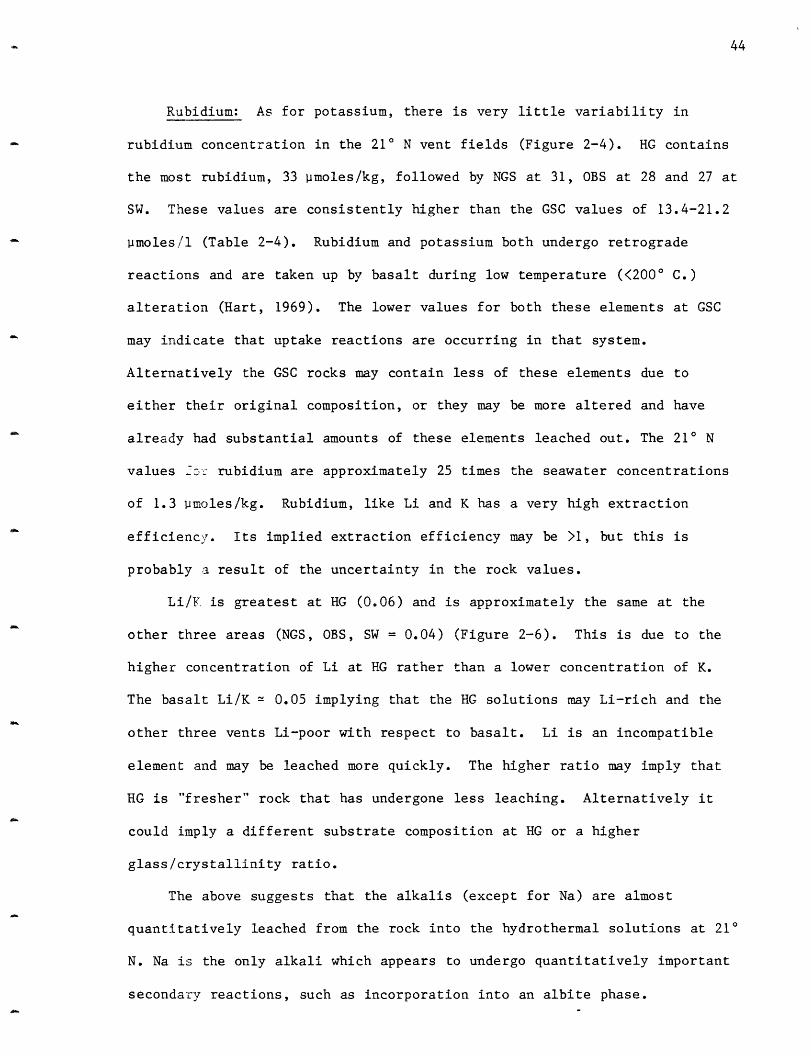
Rubidium: As for potassium, there is very little variability in
rubidium concentration in the 21° N vent fields (Figure 2-4). HG contains
the most rubidium, 33 imoles/kg, followed by NGS at 31, OBS at 28 and 27 at
SW. These values are consistently higher than the GSC values of 13.4-21.2
vmoles/l (Table 2-4). Rubidium and potassium both undergo retrograde
reactions and are taken up by basalt during low temperature (<2000 C.)
alteration (Hart, 1969). The lower values for both these elements at GSC
may indicate that uptake reactions are occurring in that system.
Alternatively the GSC rocks may contain less of these elements due to
either their original composition, or they may be more altered and have
already had substantial amounts of these elements leached out. The 21 N
values £o: rubidium are approximately 25 times the seawater concentrations
of 1.3 moles/kg. Rubidium, like Li and K has a very high extraction
efficiency . Its implied extraction efficiency may be >1, but this is
probably a result of the uncertainty in the rock values.
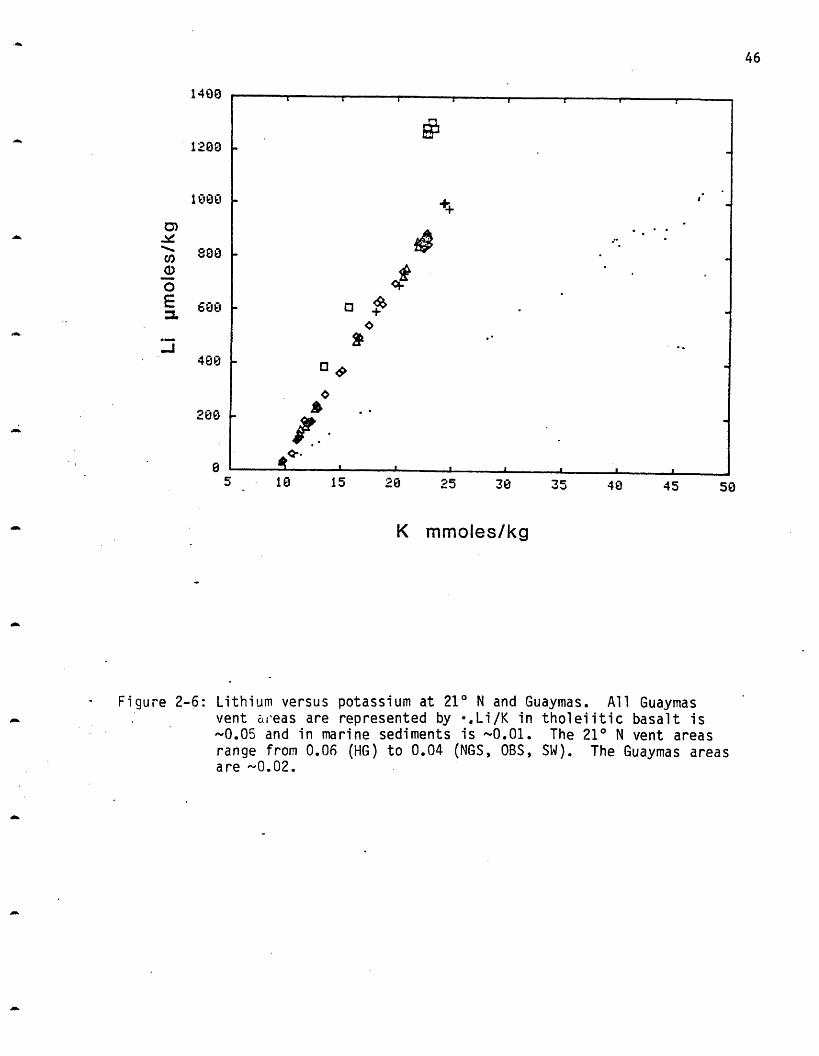
Li/K is greatest at HG (0.06) and is approximately the same at the
other three areas (NGS, OBS, SW = 0.04) (Figure 2-6). This is due to the
higher concentration of Li at HG rather than a lower concentration of K.
The basalt Li/K = 0.05 implying that the HG solutions may Li-rich and the
other three vents Li-poor with respect to basalt. Li is an incompatible
element and may be leached more quickly. The higher ratio may imply that
HG is "fresher" rock that has undergone less leaching. Alternatively it
could imply a different substrate composition at HG or a higher
glass/crystallinity ratio.
The above suggests that the alkalis (except for Na) are almost
quantitatively leached from the rock into the hydrothermal solutions at 210
N. Na is the only alkali which appears to undergo quantitatively important
secondary reactions, such as incorporation into an albite phase.

35
25
15
10
00 5 10 15 20 25 30 35 40 45 5 55
Mg mmoles/kg
Rubidium versus magnesium at 21 N.
45
-,
0E
c.
A +
-A$ +2 o ++
~~oo o
& o
43- *
I 1 _ _ _ · _ _ _ _
Figure 2-5:
1408
1200
1 Cle
C,
-3
E
800
480
0
5 10 1 5 20 25 30 35 40 45 51
K mmoles/kg
Figure 2-6: Lithium versus potassium at 210 N and Guaymas. All Guaymasvent areas are represented by .,Li/K in tholeiitic basalt is~0.05 and in marine sediments is -0.01. The 21 N vent areasrange from 0.06 (HG) to 0.04 (NGS, OBS, SW). The Guaymas areasare 0.02.
46
3

47
THE ALKALINE EARTHS
This group of elements (Be, Mg, Ca, Sr and Ba were measured) shows the
largest diversity of behavior. Beryllium, calcium and barium all increase
in the solutions while Mg decreases and strontium both increases and
decreases.
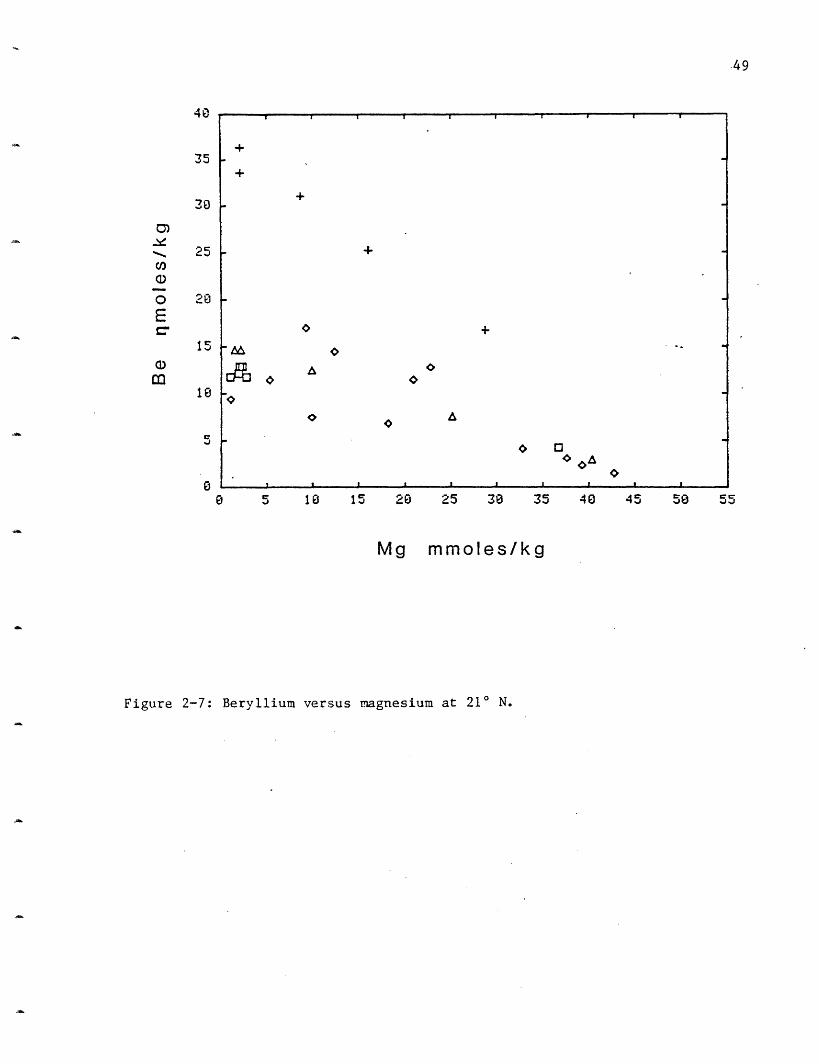
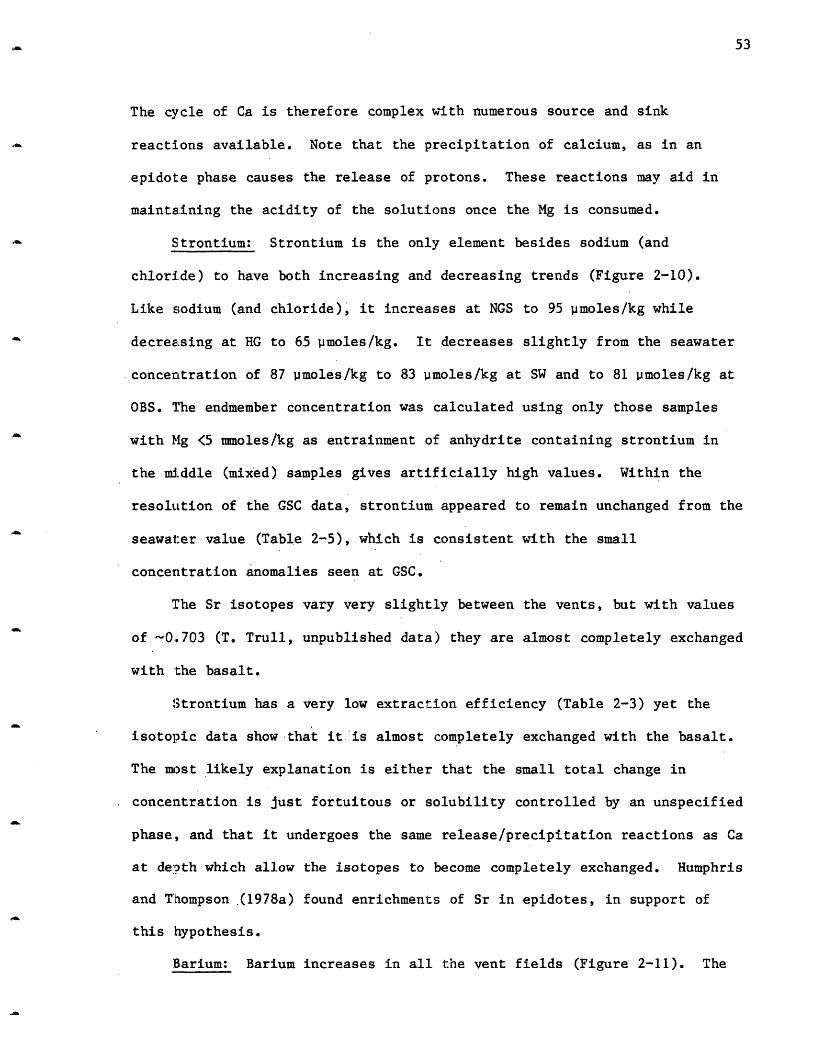
Beryllium: Beryllium in the 210 N vents is enriched more than a
thousandfold over the ambient seawater concentration of 20 pmoles/kg (Table
2-5). Although Be has a large enrichment in the hydrothermal solutions, it
is second only to Al in its low extraction efficiency from the rock (Table
2-3). NGS shows the largest increase to 37 nmoles/kg followed by OBS 15,
HG 13 and SW at 10 (Figure 2-7). The same range in concentration is
observed at the GSC. Several of the vents at SW were sealed (inactive)
until excavated by the submarine. These vents have higher beryllium
contents (up to 17 nmoles/kg); second only to NGS. These higher
concentrations may be due to the hot water sitting inside the chimney or
rock conduits and "cooking", causing additional leaching of Be into the
solutions. This hypothesis cannot at present be proven as too little is
known about the geochemistry of this element to postulate possible controls
on its solution chemistry.
Magnesium: Magnesium decreases in all the vent fields and is assumed
to reach zero in the hydrothermal endmember (Table 2-5) although this
cannot be directly proven. As discussed above, magnesium is used as an
indicator of mixing between the hydrothermal solutions and seawater.
Magnesium decreases to approximately 1 mmole/kg in all the fields except
for NGS where 2.1 mmoles/kg is the minimum value measured. The zero
magnesium endmember agrees with the Galapagos extrapolation of zero
magnesium at 3440 C. (Edmond et al., 1979a).
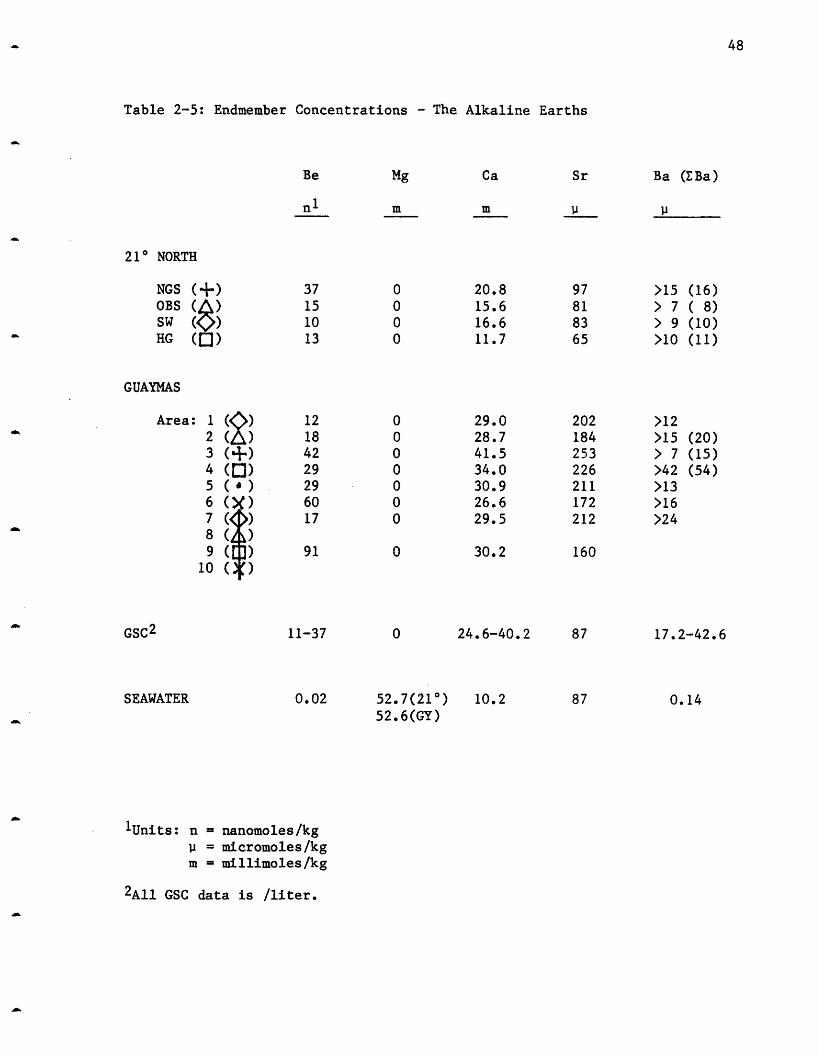
Table 2-5: Endmember Concentrations - The Alkaline Earths
Be Mg Ca Sr
n1 m m P
210 NORTH
NGS (+) 37 0 20.8 97OBS (I) 15 0 15.6 81SW (O) 10 0 16.6 83HG (I0) 13 0 11.7 65
GUAYMAS
Area: 1 () 12 0 29.0 202 ( ) 18 0 28.7 183 (+) 42 0 41.5 254 (Q) 29 0 34.0 2245 () 29 0 30.9 216 (X) 60 0 26.6 17
7 (<>) 17 0 29.5 21:
8 ( )9 ( ) 91 0 30.2 161
lO ( )
GSC2 11-37
SEAWATER 0.02
0
52.7(210)52.6(GY)
24.6-40.2
10.2
2
4
3
6
1
2
2
D
87
87
1Units: n = nanomoles/kg1 = micromoles/kgm = millimoles/kg
2All GSC data is /liter.
48
Ba (Ba)
11-
>15 (16)
> 7 ( 8)
> 9 (10)
>10 (11)
>12>15 (20)> 7 (15)
>42 (54)>13
>16>24
17.2-42.6
0.14
25
20
15
18
5
00 5 10 15 20 25 38 35 40 45 50 55
Mg mmoles/kg
Figure 2-7: Beryllium versus magnesium at 21 N.
40
.49
a)0EC.
m
O +
.T.!-
O .A
(13
. t J - ' -- I , ,

50
Calcium: Calcium increases by varying amounts in all the vent areas
(Figure 2-8). The HG area has the smallest increase to only 11.7 mmoles/kg
(seawater contains 10.2 mmoles/kg), while OBS reaches 15.6, SW 16.6 and
NGS 20.8. Once a correction is made for water loss due to hydration, HG
has only a 0.7 mmole/kg increase (see C1 discussion). These calcium
increases are considerably less than the 24.6-40.2 mmoles/l observed in the
GSC vents (Table 2-5). The scatter in the 210 N calcium is greatly reduced
when it is examined relative to the sulfate data (Figure 2-9). Apparently
anhydrite (CaSO4) particles from the chimneys were entrained in several of
the samples, especially those from the SW vent area, and its dissolution
caused anomalously high calcium and sulfate values.
The 210 N calcium concentrations are the lowest observed in any
submarine hydrothermal system and this low extraction efficiency (Table
2-5) is probably due to the secondary precipitation of Ca-silicates at
depth. Epidote is the most common Ca-silicate mineral found in greenschist
facies altered submarine rocks. Epidote was not formed in the experiments
(the reason for this is not clear but may be a nucleation p blem) but
other Ca phases were. For the purpose of simplicity Ca will be assumed to
enter an epidote phase. Ca may be leached into solution by a H+ exchange
or by albitization of anorthite:
Na+ + CaA12Si20 8 + H4SiO4 + NaAlSi3O8 + Ca2+ + A(OH) 4-.
It may be lost by the formation of epidote:
Ca2+ + CaA12Si20 8 + A(OH)4 + H4SiO4 + Ca2A13Si30 12(OH) + 3H20 + H+.
If alteration under the temperature and pressure conditions of greens-hist
facies metamorphism continues epidote may be converted to chlorite with a
resultant release of Ca:
Ca2A1 3Si30 1 2(OH) + 3Mg2+ + 2Fe2+ + 9H20
+ Mg3Fe2A12Si3010(OH) 8 + 2Ca2+ + A(OH)4- + 7H+.

20
18
16
, 14
12
100 5 10 15 20 25 30 35 40 45 50 55
Mg mmoles/kg
Calcium versus magnesium at 21 N.
51
(a
EE
0
4-
o o ++ + LO '++
'& A +
+
0 Zi
0 o
CZE . . .> .. _0 D 4p *ACh
_ __ __ __ r __ _1
I
Figure 2-8:

52
U 5 10 1 5 20 25 30 3
Mg mmoles/kg
40 45 50 55
Figure 2-9: (Calcium - sulfate) versus magnesium at 21 N.
1 t
15
Co
r1: 10
C.¢C)
0E:Ei e
-5
-15
1% M
53
The cycle of Ca is therefore complex with numerous source and sink
reactions available. Note that the precipitation of calcium, as in an
epidote phase causes the release of protons. These reactions may aid in
maintaining the acidity of the solutions once the Mg is consumed.
Strontium: Strontium is the only element besides sodium (and
chloride) to have both increasing and decreasing trends (Figure 2-10).
Like sodium (and chloride), it increases at NGS to 95 moles/kg while
decreasing at HG to 65 moles/kg. It decreases slightly from the seawater
concentration of 87 moles/kg to 83 moles/kg at SW and to 81 moles/kg at
OBS. The endmember concentration was calculated using only those samples
with Mg <5 mmoles/kg as entrainment of anhydrite containing strontium in
the middle (mixed) samples gives artificially high values. Within the
resolution of the GSC data, strontium appeared to remain unchanged from the
seawater value (Table 2-5), which is consistent with the small
concentration anomalies seen at GSC.
The Sr isotopes vary very slightly between the vents, but with values
of 0.703 (T. Trull, unpublished data) they are almost completely exchanged
with the basalt.
Strontium has a very low extraction efficiency (Table 2-3) yet the
isotopic data show that it. is almost completely exchanged with the basalt.
The most likely explanation is either that the small total change in
concentration is just fortuitous or solubility controlled by an unspecified
phase, and that it undergoes the same release/precipitation reactions as Ca
at depth which allow the isotopes to become completely exchanged. Humphris
and T'hompson .(1978a) found enrichments of Sr in epidotes, in support of
this hypothesis.
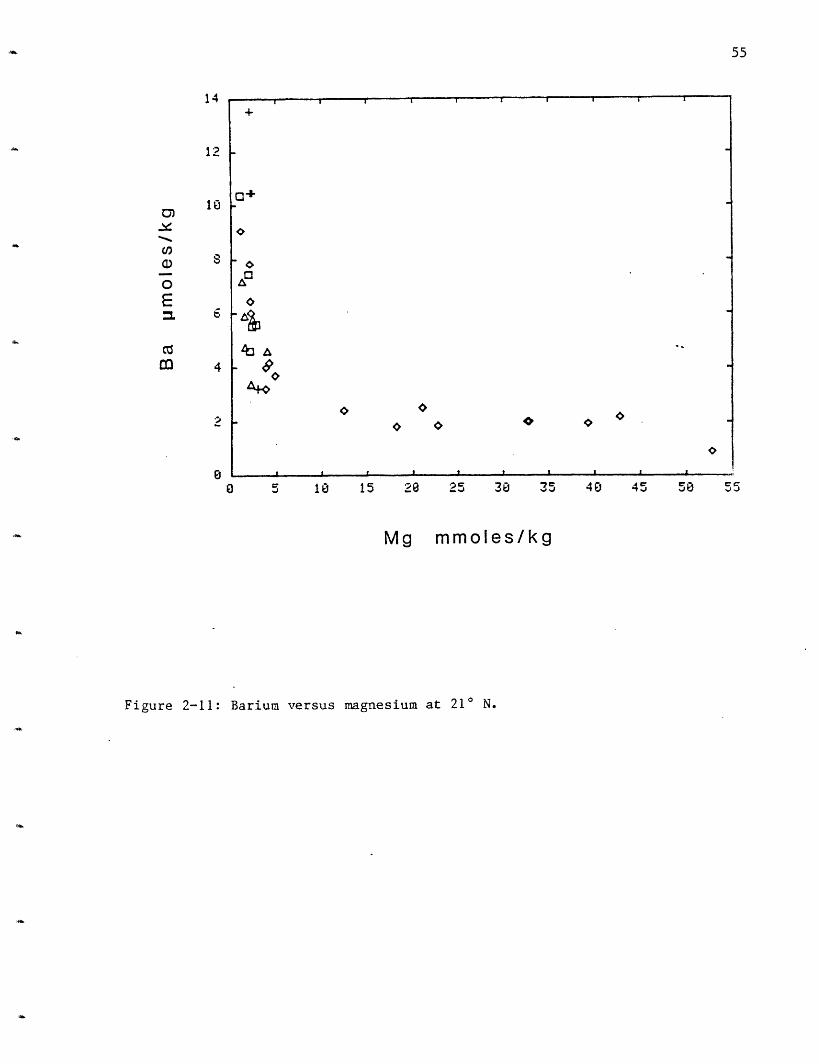
Barium: Barium increases in all the vent fields (Figure 2-11). The

110
105
CY
CD
0E
95
85
80
L.CO
70
65
0 5 10 15 20 25 30 35 40 45 50 55
Mg mmoles/kg
Figure 2-10: Strontium versus magnesium at 21 N.
54
~~~~~~~~~~ , JI I I I I
4~~-+++
o +
+ O ,-l+ + +
O. I A i
8 0o~ C13& ,~~~~
. h . .
14
12
C, 10
o) 3
o()
m 4
A
0a 10 15 2 25 30 35 40 45 50 55
Mg mmoles/kg
Figure 2-11: Barium versus magnesium at 21 N.
55
. , _

56
endmember concentration cannot be precisely determined because some sulfate
is always present in the samples and barite solubility is exceeded.
Approximately 4.4 moles/kg barite are soluble in water at 3000 C and 500
bars (Blount, 1977) therefore the smallest amount of sulfate will cause
precipitation. From the solution data the lower limits of 10 moles/kg at
HG, 9 at SW, 7 at OBS and 15 at NGS can be set (Table 2-5). The upper
limit can be set by the barium concentration in rocks, 150-210 moles/kg
(RISE Project Group, 1980). Particles filtered from the solutions
contained up to another 2 imoles/kg barium, raising the endmember
concentration to 16 moles/kg at NGS, 11 at HG, 10 at SW and 8 at OBS.
Since the chimneys are "leaky" to seawater (Goldfarb, 1982; Haymon, 1983)
which has caused barite deposition in their walls, these values may still
be an underestimate of the total barium in the solutions. The GSC
extrapolations for barium in the endmember are probably incorrect due to
the precipitation of barium sulfate at depth (McDuff and Edmond, 1982).
From the reconstruction of the solution composition (Table 2-5) an
extraction efficiency was calculated. Up to 20% of the Ba may be leached
from the rocks, making it second only to most of the alkalis for extraction
efficiency from the rock.
ALUMINUM
Aluminum: Aluminum increases in all the vent fields, ranging from 4.0
vmoles/kg in the NGS area to 5.2 moles/kg in the HG area (Table 2-6). No
figure is presented as only those samples with Mg <5 mmoles/kg were
analyzed. The scatter may be due to the poorer analytical precision of the
graphite furnace atomic absorption spectrophotometric (GFAAS) method
(+10%). This is a 500 fold increase over the 20 nmoles/kg found in
seawater.
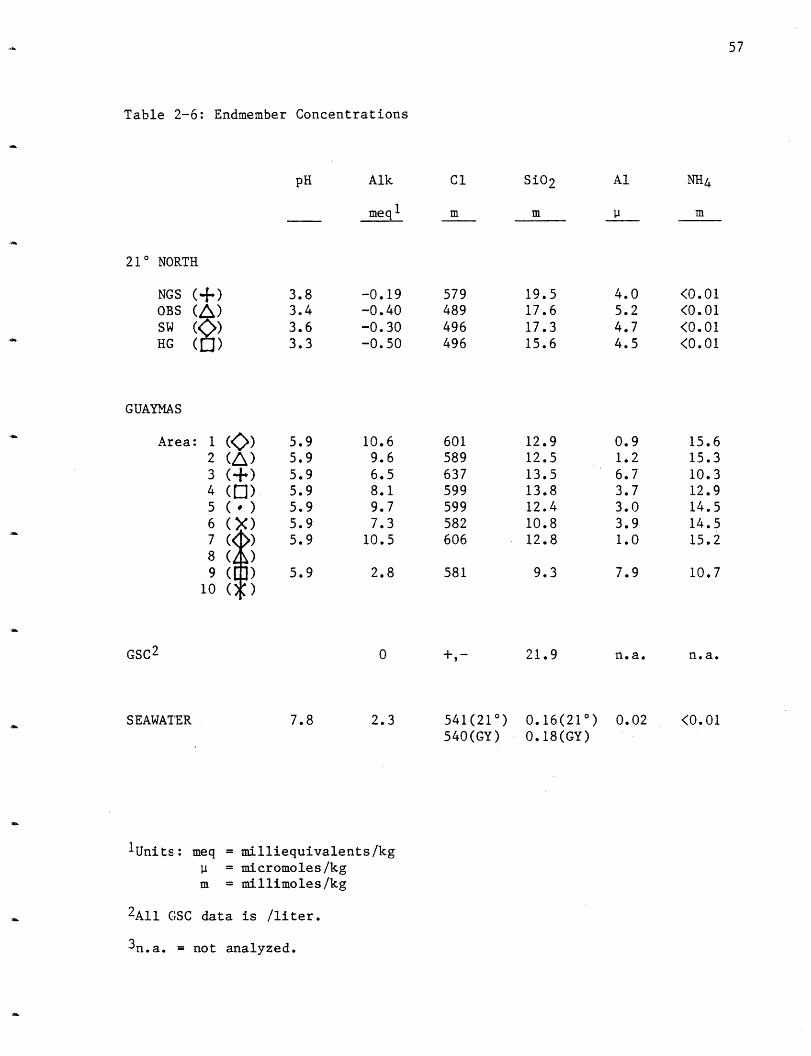
Table 2-6: Endmember Concentrations
pH Alk
meq1
210 NORTH
NGS (--) 3.8 -0.19OBS (4) 3.4 -0.40SW ( ) 3.6 -0.30HG ( ) 3.3 -0.50
GUAYMAS
Area: 1 (K>) 5.9 10.6
2 (I) 5.9 9.6
3 (-) 5.9 6.54 ( ) 5.9 8.1
5 ( ) 5.9 9.76 (X) 5.9 7.3
7 (< ) 5.9 10.5
8 )9 ( ) 5.9 2.8
10 ( )
GSC2 0
SEAWATER 7.8 2.3
1Units: meq = milliequivalents/kg
= micromoles/kgm = millimoles/kg
2All GSC data is /liter.
3n.a. = not analyzed.
57
C1
m
579
489
496
496
601
589
637
599
599
582
606
581
SiO2
m
19.517.617.315.6
12.9
12.5
13.513.812.4
10.812.8
9.3
21.9
0.16(210)0.18(GY)
Al
ii
4.05.2
4.7
4.5
0.91.2
6.7
3.7
3.03.9
1.0
7.9
n.a.
0.02
NH4
m
<0.01<0.01<0.01<0.01
15.615.3
10.312.9
14.5
14.515.2
10.7
n.a.
<0.01541(21°)540(GY)
58
Aluminium has the lowest extraction efficiency of any element
measured. This low number is probably indicative of secondary reactions
and precipitation, rather than low extraction efficiency from the rock.
Many of the reactions written in this section involve Al either as a
product: or as a reactant. This indicates that it is an important species in
the hydrothermal reactions occurring within the system, even if its final
concentration in the hydrothermal solutions is low.
SILICA
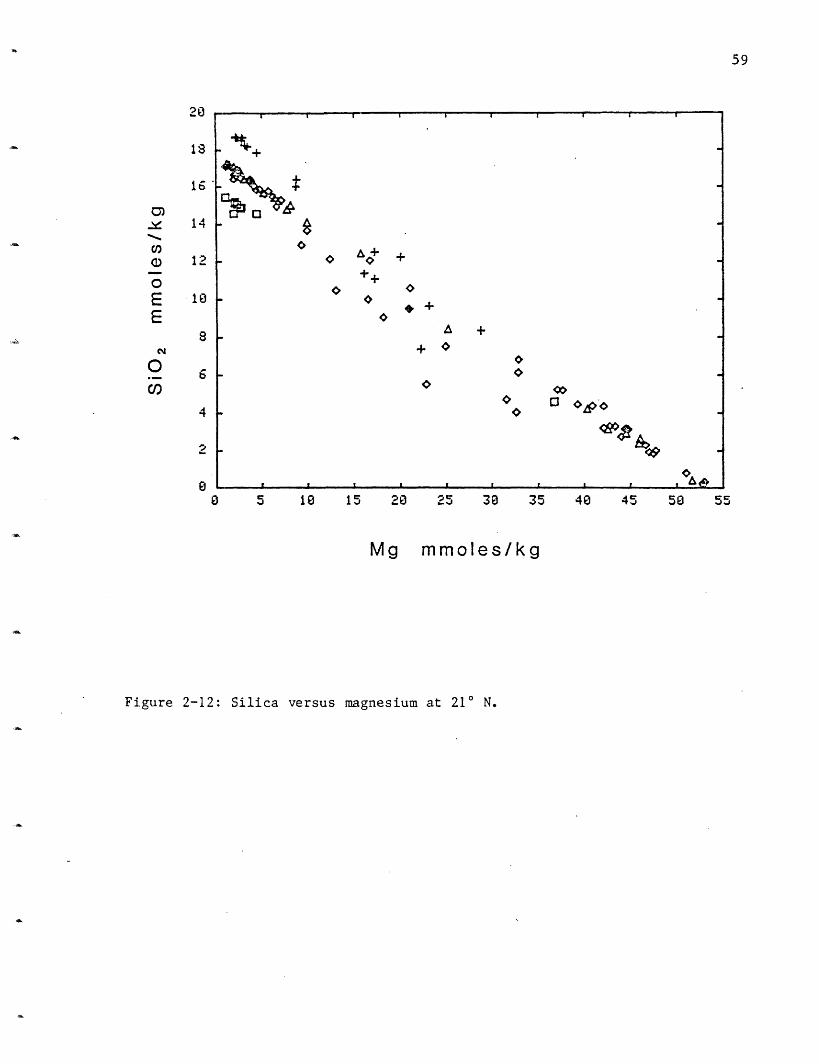
Silica: Silica varies in the 210 N vent fields from 15.6 mmoles/kg at
HG to 17.3 at SW, 17.6 at OBS and 19.5 at NGS (Figure 2-12). These values
are lower than the extrapolated Galapagos value of 21.9 mmoles/l (Table
2-5). Within the resolution of the data, all the GSC vent areas had the
same silica concentration. The endmember concentrations for silica were
calculated using only those samples with Mg <10 mmoles/kg due to the
scatter (due to polymerization/precipitation and entrainment) in the more
mixed samples.
Silica has a relatively low apparent extraction efficiency from the
rock. The silica concentration in solution is assumed to be controlled by
quartz solubility and this assumption is supported by the solubility
calculations (Bowers, Von Damm and Edmond, 1983). Quartz solubility is a
function of pressure and temperature and the silica content of the solution
may be used as a geobarometer. This will be discussed in section 2.4.
pH
pH: The pH values are from shipboard measurements at approximately
25 C and 1 atmosphere. There is less free hydrogen ion at higher
temperature and pressure therefore the in situ pH is 0.1 to 0.2 pH units
higher than the measured values reported here. There may be a small
20
18
1G
0)
-
0)
0EE
c'
0C,SO
14
12
10
8
6
4
2-
00 5 10e 15 20 25 30 35 40 45 50 55
Mg mmoles/kg
Silica versus magnesium at 21 N.
59
m i I I I I- I I I ~ I-~~ r l r c r r r
+-k t 0 00o~~~ Ao +o o0 e +o
4- +
oo
a ~ ~ moeS~* 0 a* AO,
<AO4&
Figure 2-12:
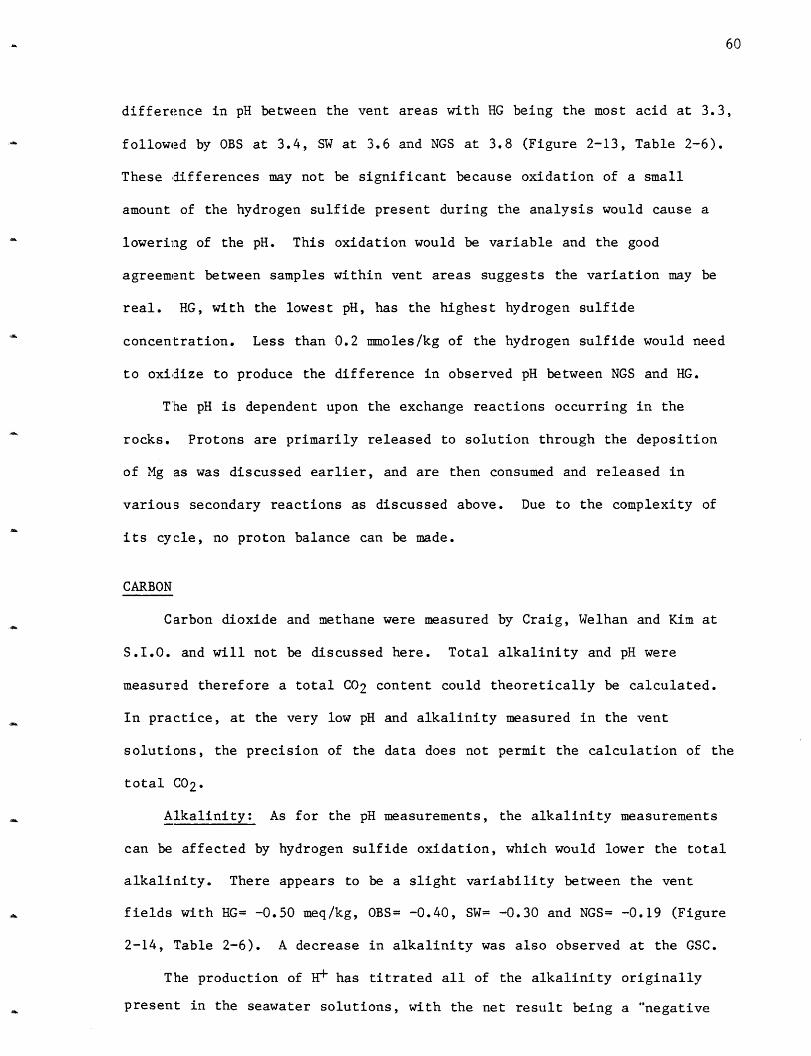
60
difference in pH between the vent areas with HG being the most acid at 3.3,
followed by OBS at 3.4, SW at 3.6 and NGS at 3.8 (Figure 2-13, Table 2-6).
These differences may not be significant because oxidation of a small
amount of the hydrogen sulfide present during the analysis would cause a
lowering of the pH. This oxidation would be variable and the good
agreement between samples within vent areas suggests the variation may be
real. HG, with the lowest pH, has the highest hydrogen sulfide
concentration. Less than 0.2 mmoles/kg of the hydrogen sulfide would need
to oxidize to produce the difference in observed pH between NGS and HG.
The pH is dependent upon the exchange reactions occurring in the
rocks. Protons are primarily released to solution through the deposition
of Mg as was discussed earlier, and are then consumed and released in
various secondary reactions as discussed above. Due to the complexity of
its cycle, no proton balance can be made.
CARBON
Carbon dioxide and methane were measured by Craig, Welhan and Kim at
S.I.O. and will not be discussed here. Total alkalinity and pH were
measured therefore a total CO2 content could theoretically be calculated.
In practice, at the very low pH and alkalinity measured in the vent
solutions, the precision of the data does not permit the calculation of the
total CO2.
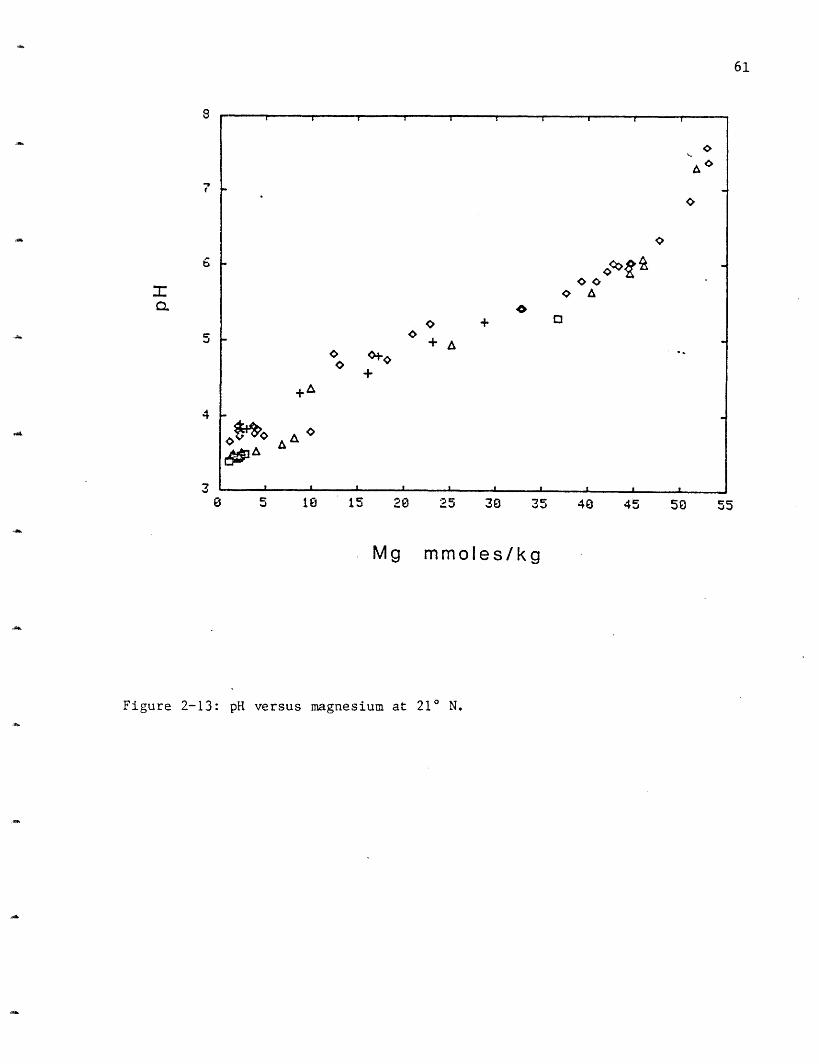
Alkalinity: As for the pH measurements, the alkalinity measurements
can be affected by hydrogen sulfide oxidation, which would lower the total
alkalinity. There appears to be a slight variability between the vent
fields with HG= -0.50 meq/kg, OBS= -0.40, SW= -0.30 and NGS= -0.19 (Figure
2-14, Table 2-6). A decrease in alkalinity was also observed at the GSC.
The production of H+ has titrated all of the alkalinity originally
present in the seawater solutions, with the net result being a "negative
61
o
I
6
0. 5
4
.7
0 5 10 15 20 25 30 35 40 45 50 55
Mg mmoles/kg
pH versus magnesium at 210 N.
- I I I , . I r -'
~A~A
OO -+
+A O
i o ,A O
. I I I I ! , I I
- ~ ~ ~ ~ ~ ~ ~ ~-
Figure 2-13:
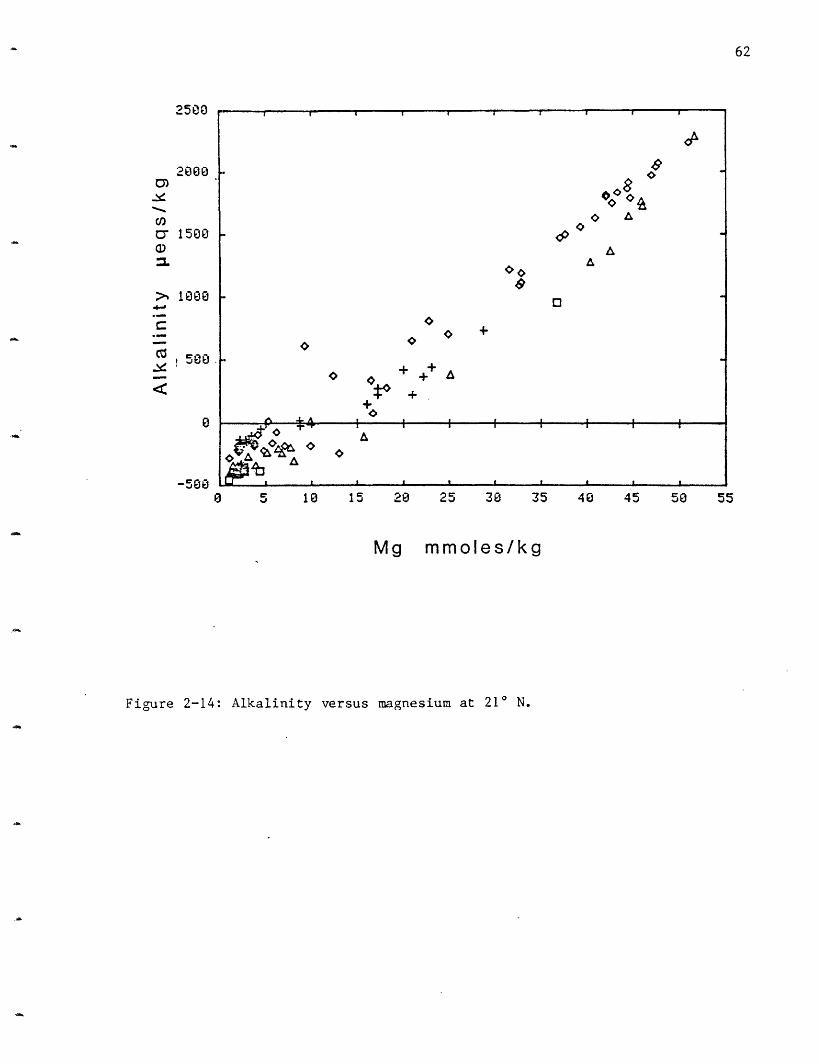
62
0 5 10 15 20 25 30 3'
Mg mmoles/kg
5 40 45 50 55
Alkalinity versus magnesium at 21 N.
2000
0)
C 1500a)
> 1000
C
I500
-500
Fiure 2-14:

63
alkalinity". There are no carbonate-bicarbonate species present and all of
the CO2 is present as the H2CO3 form.
AMMONIUM
Ammonium was determined in a few samples from all the vent areas at
210 N. It was above the detection limit in a few samples but in all cases
is <0.01 mmoles/kg.
PHOSPHATE
Phosphate was measured in a few samples from all the vent areas. It
decreases in concentration, but the quality of the data does not permit an
exact endmember value to be calculated. It is <1 mole/kg in all the vent
areas.
NITRITE
Nitrite was analyzed only on samples from dive 1149. It is <0.1
umoles/kg.
THE HALOGENS
Fluoride: Fluoride was not measured on the samples collected at 21 N
in 1981. Measurements on the samples collected there in 1979 implied that
fluoride went to zero in the hydrothermal solutions (Figure 2-15). This
agrees with the fluoride depletion found in the GSC solutions.
Fluoride presumably enters one of the hydrous clay minerals formed
where it can substitute for the OH- group. It may substitute in a similar
manner into amphibole phases if they are forming.
Chloride: Chloride, like sodium, increases from the ambient value of
541 mnoles/kg to 579 at NGS and decreases to 496 at HG and SW, and 489 at
OBS (Figure 2-16). The increased chloride at NGS can be interpreted as a

64
-, '-
60
50
C71
cn 401a)
E'. 38
LU-
20
10
0
0 5 10 15 20 _5 30 35 40 45 50 55
Mg mmoles/kg
Figure 2-15: Fluoride versus magnesium at 21 N.
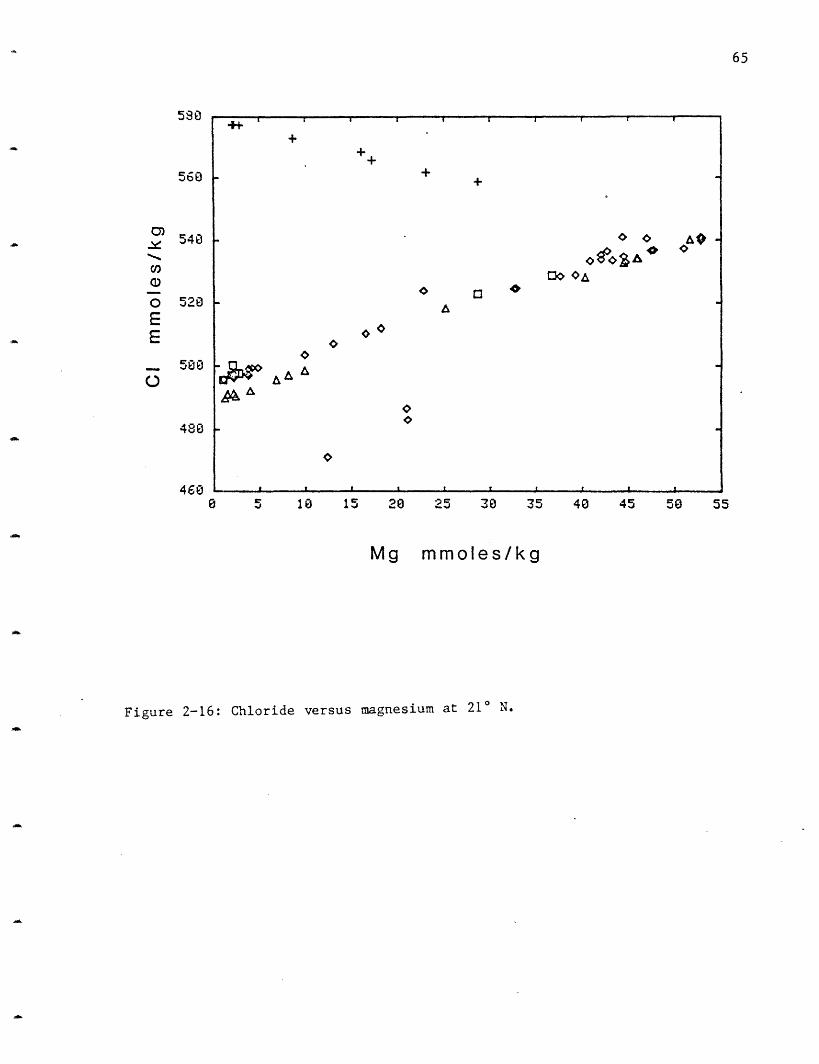
5590
560
0)-
CD
a)
0EE
0
540
520
5800
480
468,vv
0 5 10 15 20 25 30 35 40 45 50 55
Mg mmoles/kg
Chloride versus magnesium at 210 N.
65
I X ; I r I I II
+
-++
+f0X a O
0~~ o ~to "
0O 0
0AOa~r '6, ,&% 11
I _ _
Figure 2-16:

66
7% loss of water to rock hydration. The other areas have lost
approximately 10% of their chloride. If these areas are also hydrating,
like the NGS area, then they must have lost approximately 17% of their
chloride. The GSC vents also displayed this dichotomy, although the total
chloride losses were inferred to be much larger (Table 2-6). The three low
points (Figure 2-16) are from a chimney which was extinct until excavated
by the submarine. Loss of water due to hydration is consistent with the
water isotopes although the C1 indicates a smaller water loss than the
isotopes. A small amount of C1 may therefore be added to this solution but
this cannot be proven within the resolution of the data. The most likely
sink for C is, as for fluoride, substituting for a hydroxyl group. Cl is
present in amphiboles formed at temperatures of 400° C, while it is
excluded from the higher temperature, more crystalline forms of these
minerals (Deer et al., 1963; Honnorez, personal communication).
SODIUM versus CHLORIDE
As these are the two major charged species in the solutions,
addit:Lonal information may be obtained based on their relative behavior.
Table 2-7 gives the change in Na with respect to Cl in the four vent areas
at 21 N (Figure 2-17). Cl is preferentially lost with respect to Na in
the three areas which show a decrease in these species. There is a small
variability between the vent areas. When looking at the net loss of Na and
C1 it should be remembered that there is up to a 10% loss of water by
hydration, therefore the loss of C1 is ~20% and Na ~17%, rather than the
~10% or 7% the data itself indicates. The major Na sink is probably the
formation of albite as was discussed earlier. In the NGS area, Na is
gained preferentially to chloride. This indicates two possible processes
may be occurring: loss of Cl with no attendant loss of Na or preferential
gain of Na to the solutions. Na could be gained in a reaction shown

67
Table 2-7: Sodium versus Chloride - 21 N
Na ANa C1 AC ANa/ACl
NGS 510 +46 579 +38 1.21
OBS 432 -32 489 -52 0.62
SW 439 -25 496 -45 0.56
HG 443 -21 496 -45 0.47
SEAWATER 464 541
All concentrations are in millimoles/kg.

68
5ao
O 480
420400
400470 480 490 500 510 520 530 540 550 560 570 580
CI mmoles/kg.
Figure 2-17: Charge balance sodium versus chloride at 210 N. Note 1:1 line,

69
earlier when albite is converted to chlorite with a resultant release of
Na. It is not possible to choose between these two possible cases.
SULFUR
Sulfate: Sulfate decreases to a measured value of 0.61 mmoles/kg at
210 N. All the vent fields show sulfate decreasing to zero with the same
slope (Figure 2-18). The residual measured sulfate is probably a sampling
artifact as was discussed for magnesium. The scatter is due to the
presence of anhydrite as was discussed for calcium. Sulfate was also
inferred to go to zero at the GSC (Table 2-8).
Hydrogen Sulfide: Hydrogen sulfide is present in all the vent fields,
and at the observed pH should be present as the H2S form. HG has the
highest hydrogen sulfide concentration at 8.7 mmoles/kg, followed by SW at
7.6, OBS at 7.5 and NGS at 6.7 (Figure 2-19). Since no sulfate is present
in the endmember hydrothermal solutions, this implies a net loss of sulfur
as seawater passes through the hydrothermal system. Increased levels of
hydrogen sulfide were also observed at the GSC but no endmember value could
be inferred due to subsurface oxidation and precipitation (Table 2-8).
Total Sulfur: As a check that no sulfur species besides sulfate and
hydrogen sulfide were quantitatively important samples were taken in sealed
glass ampoules with bromine present to oxidize all the sulfur species to
sulfate (Appendix 2), and the sulfate measured. In three of the four vent
areas at 210 N the sum of the measured sulfate and hydrogen sulfide is
between 4 and 17% greater than the sulfate measured in the ampoule (Table
2-9). In the fourth area the ampoule has approximately 1% more sulfate,
and is within the analytical error for the methods. The H2S is most likely
not being quantitatively trapped as the sample is introduced in to the
ampouLes. The sum of the measured sulfate and sulfide is always greater
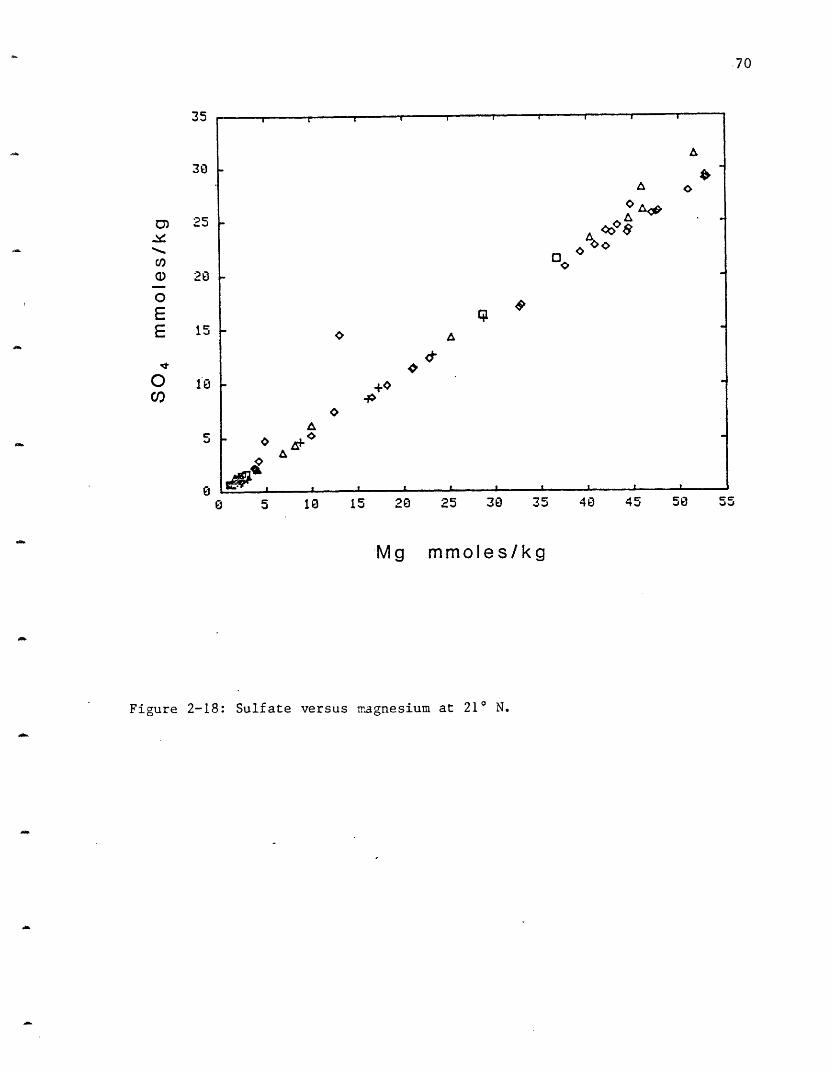
0 5 1e 15 20 25 30 35 40 45 50 55
.Mg mmoles/kg
Figure 2-18: Sulfate versus magnesium at 21 N.
35
30
70
25
20
15
1'0
a)0EE
O
A
A
,
A o~ ~ ~~~~0 ·Ano
" o
A ,kl , . .. I. , . I I ~. _C.to
----
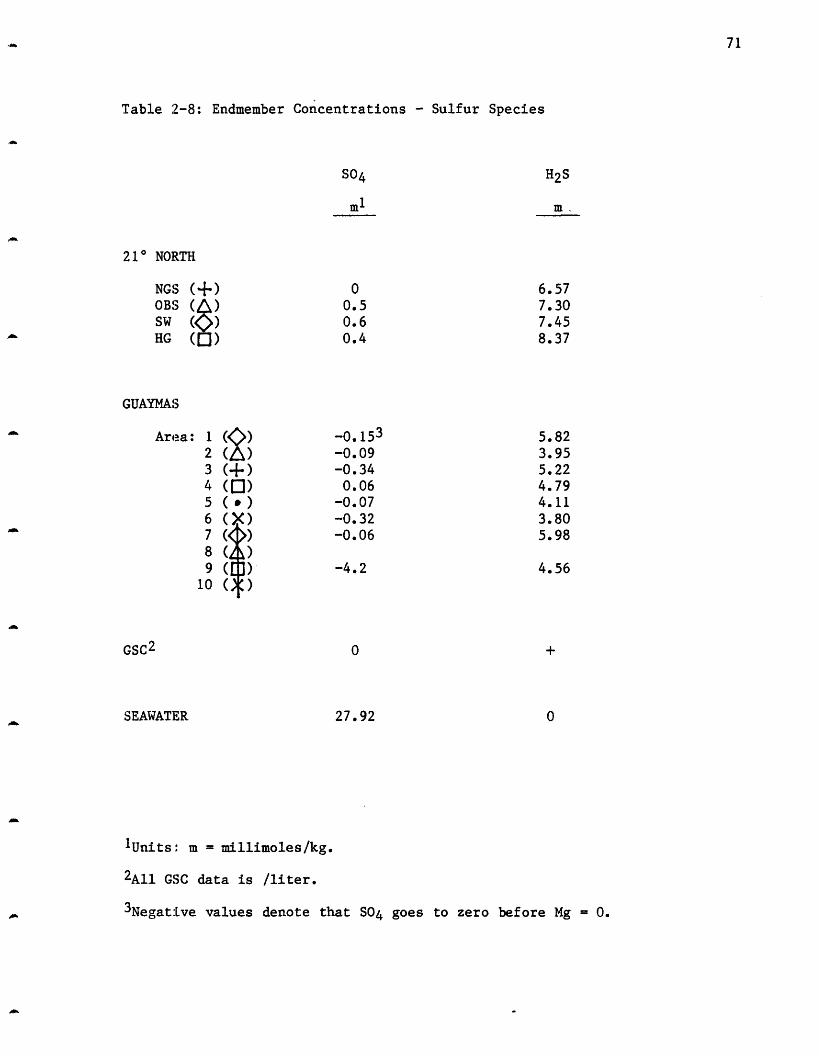
71
Table 2-8: Endmember Concentrations - Sulfur Species
S04 H2 S
m .
21 NORTH
NGS (+-)
OBS (A)SW (<>)HG (])
0
0.50.60.4
6.577.307.458.37
GUAYMAS
Area: 1 ( )2 ()
3 (+)4 ([)5 ( )6 (X)5()6 ( )8 ( )8( )
10GSC2
GSC2
SEAWATER
-0.153
-0.09-0.340.06-0.07-0.32-0.06
5.823.955.224.794.113.805.98
-4.2
0
27.92
4.56
+
0
1Units: m = millimoles/kg.
2All GSC data is /liter.
3Negative values denote that S04 goes to zero before Mg = 0.

0)
0EE
C)
9
81
6
5
4
3
1
0 5 10 15 20 25 30 35 40 45 50 55
Mg mmoles/kg
Figure 2-19: Hydrogen sulfide versus magnesium at 21 N.
72
U I I I
00
4 +,
'-,+ As Oo + oo
+_ O t+ + 0+++
AA
a A A*4,~ ~
· _ i i r

73
Table 2-9: Total Sulfur Concentration
Sample Mg S04 H2S S S(SO4+H2S) (ampoule)
m1 m m m m
210 NORTH
NGS (-)
OBS (A)SW ()HG (a)
AMBIENT
Area: 1 ( )2 ( )3 (+-)
4 ( ])5 ( )6 (X)7 ( )8 (r
9 ()10( )
1155-181158-111150-111160- 6
2.131.44
1.11
1.03
1153- 7 52.7
1176- 7
1173- 6
1175-161177-11
1.99
1.364.11
1.05
1173-16 1.44
1176-10 1.00
0.820.800.620.61
28.0
0.940.652.01
0.53
0.670.43
6.51
7.387.728.61
0
5.194.004.695.11
4.215.74
7.338.188.349.22
28.0
6.134.656.705.64
4.886.17
6.257.598.069.35
27.5
5.795.776.084.39
6.025.93
1Units: m = millimoles/kg
GUAYMAS

74
than or equal to the ampoule concentrations suggesting that at 210 N, no
intermediate sulfur species are quantitatively important.
Sulfur has a very complicated and very important cycle and section 2.3
is devoted to a detailed discussion of its behavior in the vents.
TRACE METALS
This section contains the, results for the transition metals Mn, Fe,
Co, Ni, Cu, Zn, Ag, Cd, Pb and Hg, most of which form insoluble sulfides,
as well as for the elements As and Se which can substitute for sulfur.
Most of these species are present in trace amounts (nanomolar quantities)
compared to those in the previous section but some, such as iron and
manganese are present at millimolar levels. The chemistry of these species
is more difficult to interpret as most are involved in precipitation
reactions with reduced sulfur species in the plume, in building the chimney
itself and probably in subsurface precipitation in the conduits. As many
of these elements precipitate when they mix with ambient seawater - in the
water column or in the samplers - only those samples with Mg <5 mmoles/kg
were easured for most of these elements in the 210 N data set. These
samples contain very little or no visible precipitate. (See Appendix 1 for
a complete discussion of the particle problem.) For all of the 21 N
results the endmember is calculated from the Mg <5 mmoles/kg samples (at
least four samples from each vent area), forced through the seawater value
and extrapolated to Mg = 0 mmoles/kg. Most of the elements in this section
(excepting M[n, Fe, Zn, Cu and Se) were analyzed by graphite furnace atomic
absorption spectrophotometry by the method of standard additions and hence
the analytical precision is worse (+10%) than for the major elements
(usually 1-2'%). In many cases the differences between vent fields are not
significant within the analytical uncertainty.

75
Manganese: Manganese is enriched by greater than 1000 times over
ambient: seawater at 210 N. NGS is the highest with 1002 moles/kg followed
by OBS at 960, HG at 878 and SW at 699 (Figure 2-20, Table 2-10). This is
within the range of values seen at GSC (360-1140 moles/l). Unlike most of
the other species discussed in this chapter manganese rarely forms a
sulfide and the GSC data are probably not affected by subsurface
precipitation. At 210 N it has a moderate to low extraction efficiency
from the rock which is most likely due to its incorporation into secondary
clay phases.
Iron: Iron reaches greater than millimolar concentrations in several
of the 210 N solutions and can hardly be considered a trace metal. The
highest levels found at HG are 2429 pmolef/kr followed by 1664 moles/kg at
OBS, 871 moles/kg at NGS and 750 moles/kg at SW (Figure 2-21, Table
2-10). Although iron increased at GSC no endmember concentrations could be
determined due to subsurface mixing and precipitation of metal sulfides
(Edmond et all., 1979b). Iron is present at igh concentrations in the
vents in comparison to the seawater levels (-0.5 nmoles/kg) but is present
at low levels in comparison to the amount of iron which is available from
the rocks. (Note low extraction efficiency in Table 2-3.) The variation
in iron between vent areas cannot be explained by solubility controls. Only
the NGS area at its measured 273 C temperature is saturated with respect
to pyr:ite (Bowers, Von Damm and Edmond, 1983).
Iron/Manganese: The iron/manganese (molar) ratio varies from 0.9 in
NGS to 2.9 in HG at 21 N (Figure 2-22, Table 2-10). This is much less
than the basalt ratio of 50-60, but is very close to three, the value
observed in metalliferous sediments (Dymond, 1981). Whether this
similarity in ratios is fortuitous is unknown, but it suggests that the
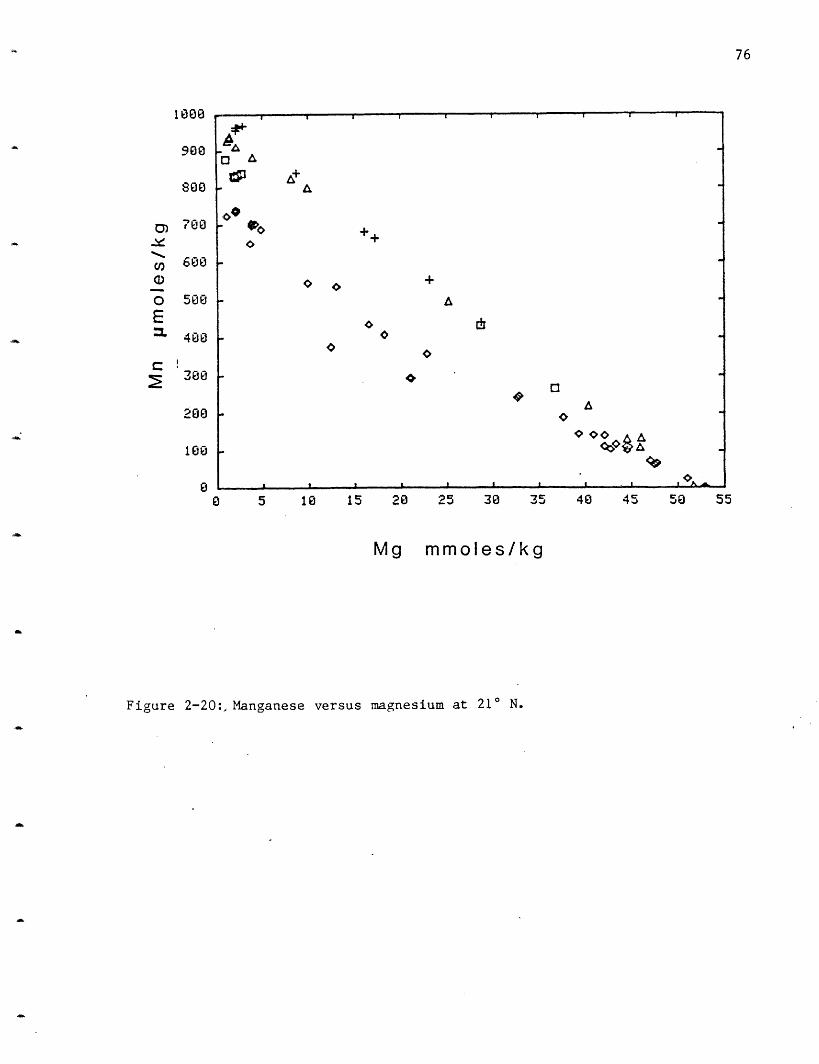
1000
900
800
0)
0E
700
600
500
400
200
100
0 5 1 15 20 25 30 35 40 45 50 55
Mg mmoles/kg
Figure 2-20:, Manganese versus magnesium at 210 N.
76
I I I I I - I I
44k
*1 A
A
,oo++
04 +O> C
4O~~~ 4 O4A
*4>1I I I _ _ _ _ _ _ _ ___ _

77
Table 2-10: Endmember Concentrations - Trace Metals
Mn Fe Fe/Mn Co Cu Zn Ag Cd Pb
1l I- n 11 n n n
21 NORTH
1002960699878
87116647502429
0.91.8
1.02.9
22
21366
227
<.0235
9.744
40106
89
104
<1 17
38 155
26 144
37 180
183
308194
359
Area: 1 (<)2 (LI)3 (+)4 ([])5 ( *.)
6(
9( )10 )
139
222236139
128
148
139
132
56
49
180
77
33
17
37
0.40.20.80.60.30.1
0.3
83 0.6
<5 4.21.840
1.1 19
0.1 2.20.1
2.2
230 265304
24 46 652
2 27 230
21
360-1140 + 0 n.a. n.a. O
<0.001 <0.001 0.03 0.007 C.01 0.02 1 0.01
1Units: n = nanomoles/kgp = micromoles/kgm = millimoles/kg
2All GSC data is /liter.
3n.a. = not analyzed.
NGS ()OBS ( )SW ( )HG ( )
GUAYMAI;
GSC 2
SEAWATER
n.a.

2500
2000
C)
a)
0E
1500
1000
a)LL
00 5 10 1 5 20 25 0 35 40 45 50 55
Mg mmoles/kg
Figure 2-21: Iron versus magnesium at 210 N.
78
r I I I I i
%
A A
O AA- * O O +a
oO
L LIon&

79
0 100 200 3880 400 5880 600
Mn pmoles/kg
700 '888 900 100880
Figure 2-22: Iron versus manganese at 210 N. Note 1:1 line.
.rA o
2200
20880
1800
, 1600
Cu 1400a,
o 1200E
1000ee
200
0

80
source of much of the iron and manganese in metalliferous sediments is high
temperature hydrothermal activity. The low ratio is presumably due to
secondary reactions of both metals, especially iron. Iron may be oxidized
to Fe3+ by sulfate, and either valence state may be incorporated into clay
minerals. The very low value at NGS is also due to the precipitation of
pyrite. The observed ratio at GSC was variable, but much lower than that
at 210 N.
The rest of the trace metals will be presented on an individual basis
but will be discussed as a group as, for most of them very little is known
about their thermodynamic properties at hydrothermal temperatures and
pressures.
Cobalt: Cobalt is low in two of the areas at 210 N - 22 nmoles/kg in
NGS and 66 nmoles/kg at SW - and is considerably higher in the other two
areas --213 nmoles/kg at OBS and 227 nmoles/kg at HG (Table 2-10). These
values are all considerably higher than the 30 pmoles/kg present in
seawater. Cobalt was not measured in the GSC solutions.
Nickel: Nickel was below the detection limit of 140 nmoles/kg at 210
N. It was below the ambient seawater value of 10 nmoles/kg at GSC.
Copper: Copper varies widely between the different vent areas at 21°
N. It reaches a maximum of 44 moles/kg in the HG area, 35 moles/kg at
OBS, 9.7 moles/kg at SW and is below the detection limit of 0.02 moles/kg
in the NGS solutions (Figure 2-23, Table 2-10). Several vents at SW with
exit temperatures below 2800 C did not contain measurable copper. The GSC
solutions contained less than the ambient seawater value (7 nmoles/kg) due
to subsurface mixing and precipitation of sulfides.
Zinc: Zinc is highly enriched in the 210 N solutions. The OBS and HG
areas are indistinguishable at 106 and 104 moles/kg respectively, while SW
contains 89 moles/kg and NGS 40 moles/kg (Figure 2-24, Table 2-10).

r
60
50
O
C 3E 30
0 20
10
A
0 5 10 15 20 25 30 35 40 45 50 55
Mg mmoles/kg
Figure 2-23: Copper versus magnesium at 210 N.
81
?C e
AA
A 0
a A
~00 A
-. . 1 _ A _ _ -.-- · 1 · N-L

82
These values are all much greater than the 10 nmoles/kg present in
seawater. Zinc was not determined in the GSC solutions.
Silver: Silver shows a distribution similar to zinc in the vents at
210 N. It is highest and indistinguishable at OBS'and HG at 38 and 37
nmoles/kg respectively, while SW contains 26 nmoles/kg and NGS contains
less than the detection limit of 1 nmole/kg (Table 2-10). There are
approximately 0.02 nmoles/kg silver in seawater. Silver was not measured in
the GSC solutions.
Cadmium: Cadmium increases in all the vent fields at 210 N to a
maximum of 180 nmoles/kg at HG, 155 nmoles/kg at OBS, 144 nmoles/kg at SW
and 17 nmoles/kg at NGS (Table 2-10). Cadmium decreased to below the
seawater value of ~1 nmole/kg in the GSC solutions.
Mercury: Mercury was determined by E. Crecelius of Battelle Northwest
Laboratories. The samples were found to contain several nmoles/kg mercury
and appear to be contaminated, probably from storage in polyethylene
bottles. Therefore at the present time no endmember mercury concentration
can be determined for 21 N.
Lead: Lead shows a pattern similar to that for Co, Zn and Ag in its
distribution between the vent fields at 210 N. It is highest in the HG
field at 359 nmoles/kg, 308 nmoles/kg at OBS, 194 nmoles/kg at SW and 183
nmoles/kg at NGS (Table 2-10). These concentration data were confirmed by
mass spectrometry at Caltech and were shown to have the same isotopic
composition as MORB (Chen et al., 1983). Lead is ~0.01 nmoles/l in
deep seawater. It was not measured in the GSC solutions.
Arsenic: Arsenic is enriched in the solutions at 210 N, the highest
concentration of 452 nmoles/kg occurring at the HG vent area. The OBS vent
contains 247 nmoles/kg, SW vent 214 nmoles/kg and NGS is below the
detection limit of 30 nmoles/kg (Table 2-11). Arsenic is ~27 nmoles/kg in

120
100
0)
Co()
0EmL
40
00 5 10 15 20 25 30 35 40 45 50 55
Mg mmoles/kg
Zinc versus magnesium at 21 N.
83
CN
O
Ome A
Al O
O O
0
O
-t + +
+ 8°O~ o + AO° o0 O
I If I. o. o o o oa _~~~~~ i-F 4. .... O..t
__ __
--
Figure 2-24:

Table 2-11: Endmember Concentrations - As and Se
AsSample
210 NORTH
NGS () <30 1155-11155-18
OBS (A) 247 1158-61158-11
SW (Ko) 214 1149-71150-11
HG (Qa) 452 1160-61160-16
GUAYMAS
Area: 1 ( )2 ( )3 (4)
4 (El)
5 ( )6 (X)7 ( >
8 ( )9 ()
10 ( )
GSC2
283732
1071
1074
516669711
1176-71173-61175-161177-61177-111177-13
Se
particlen
0.330.4362
64
36
60
52
58
61
38
72
88
1173-161176-10
Se
ampoulen
0.63
72
70
59, 61
82
87
15
103
49
92
577
n.a.
SEAWATER
0
27 2.5
1Units: n = nanomoles/kg.
2All GSC data is /liter.
3These values are indistinguishable from zero.
As values are extrapolated endmember concentrations. Se data are themeasured values. The particle and ampoule determinations are given forcomparison.
84

85
seawater. It was not measured in the GSC solutions.
Selenium: A selenium signal was only observed in a water sample from
HG, and is less than 190 pmoles/kg. Se was found in the particle fraction
filtered from the water samples in all the vent areas at 210 N except NGS.
Se was also determined in the sealed glass ampoules treated with Br2 which
were used for total S, as this method should also trap H2Se. In every case
the Se concentration in the ampoules is greater than or equal to the
particle value (Table 2-11). A large uncertainty (>10%) must be placed on
these values. At 21 N the values range from <1 nmole/kg at NGS to
approximately 70 nmoles/kg at the other three vent areas. In deep water
there are -2.5 nmoles/kg. Se decreased in the GSC solutions.
All of the metals follow the same relative distribution
pattern:
HG > OBS > SW > NGS
Co: 227 > 213 > 66 > 22 nmoles/kg
Cu: 44 > 35 > 9.7 > (<0.02) imoles/kg
Zn: 104 = 106 > 89 > 40 pmoles/kg
Ag: 37 = 38 > 26 > (<1) nmoles/kg
Cd: 180 > 155 > 144 > 17 nmoles/kg
Pb: 343 > 294 > 185 > 175 nmoles/kg
As: 452 > 247 > 214 > (<30) nmoles/kg
Se: -70 > 0 nmoles/kg.
The low values at NGS are presumably due to reduced solubilities of
these insoluble sulfide formers at 273 C versus the 350 C of the other
vents and their incorporation into pyrite. Where data exist, most of
these metals are complexed as C1 species at temperatures >300 C (sulfide
86
species complexes only become important below this temperature). The
strength of the C1 complexes and hence the solubilities of most of these
metals drops rapidly from 350-250° C. Crerar and Barnes (1976) have shown
this to be the case for Cu. Based on thermodynamic calculations (Bowers,
Von Damm and Edmond, 1983) the NGS solutions are saturated with respect to
pyrite but not chalcopyrite. Fe is present in much greater amounts than Cu
and presumably the Cu is being lost into the pyrite. Selenium often occurs
in pyrite, substituting for S. Ag is also found in pyrite. Oudin (1981,
1983) reports the presence of tennantite [(CuAg) 1 0 (Fe,Zn,Cu) 2 As4 S 13] in the
chimneys which contains Ag, As and Cu in addition to Fe. The precipitation
of pyrite may account for the quantitative (within the analytical
precision) loss of Cu and may account for similar losses of Ag, As and Se
with these elements being incorporated into the Fe-Cu phase. Co and Cd
which are still present in measurable amounts behave more like Zn, of which
a large amount is still present. Pb is also still present in large
amounts.
It is important to examine other arguments which could account for the
observed distributions. The first of these is to examine the extraction
efficiencies of these elements from the basalt (Table 2-3) . All of these
elements are far from being quantitatively removed from the rock. This
suggests that the rock composition is not, per se, controlling the solution
chemistry of these elements but that another factor such as formation of a
secondary phase is important. As all of these elements tend to form
sulfides, they may be the secondary phase.
Much work has been done on the observed zoning in ore deposits. Hence
even if the experimental work has not been done and the thermodynamic data
do not exist a good empirical understanding of the relative ease of metal

87
transport exists. From a composite of ore deposits (the entire sequence
does not exist in any one ore deposit) the decreasing order of metal
mobility is:
Hg > Pb > Zn > Cu > Sn > Ni > Fe > Co
and the relative strength of complex stability from the available
thermodynamic data is:
Hg > Cd > Pb > Cu > Zn > Sn > Ni > Fe > Co > Mn
(Barnes and Czamanske, 1967).
The relative extraction efficiency for the solutions at 210 N is:
Ag > Cd > Zn > Mn > Pb > Cu > Fe _ Co > Ni.
This is in reasonable agreement with the above sequences. This suggests
that these metals in the 210 N solutions are in part controlled by
transport and solubility (secondary processes) rather than by leaching from
the rock.
Nickel was below the detection limit of 140 nmoles/kg at 210 N. The
nickel concentration in deep water is 10 nmoles/kg while in rock it is 1-5
mmoles/kg (Kay and Hubbard, 1978). Therefore while it cannot be
definitively stated that it is not enriched in the solutions a limit can be
placed on its extraction efficiency. As and Se are omitted from most of
the above discussion because the thermodynamic and rck data for them is
virtually nonexistent.
Another possible explanation for the low values in some of the vent
areas is an aging phenomenon. If the rock is old and has been altered it
may be depleted in some of these elements and hence less is leached into
solution. The extraction efficiencies are so low that it is unlikely that
this can explain a total absence of an element in the solution. Lithium,

88
one of the most soluble elements, does not appear to be depleted from the
rocks prior to this alteration episode, although it shows variations
between the vent fields (not in exactly the same order as the sulfide
formers). Based on the higher Li/K ratio, HG may be "fresher" rock or
younger and this is consistent with all the trace metals being higher in
this vent.
2.3 Sulfur System
Sulfur plays a critical role in hydrothermal circulation, yet its
cycle is very complex, and as will be seen below, cannot be completely
constrained with the available data. Reduced sulfur may be important in
limiting the transport of metal species and is responsible for the
formation of mineral deposits at 210 N. Besides its importance in
inorganic reactions, reduced sulfur from the vents is the primary food
source for the chemosynthetic biological communities living around the
vents. It is difficult to balance the present day oceanic sulfur cycle and
hydrothermal circulation may provide a needed sink (see discussion in
McDuff and Edmond, 1982) as well as a mechanism for changing the sulfur
isotopic composition of seawater through time.
Seawater is the input fluid and before undergoing any reactions in the
hydrothermal system it contains 28 mmoles/kg sulfate and no reduced
sulfur. When the reacted seawater exits from the hydrothermal vent it
contains <9 mmoles/kg of hydrogen sulfide and no sulfate (Table 2-8). Thus
a net loss of sulfur occurs as seawater traverses the hydrothermal system.
Whether this is a permanent sink will be discussed below.
The first complication in the sulfur system is that there are two
possible sources: seawater sulfate and basaltic sulfur. The second

89
complication is that there are two possible sinks: deposition of seawater
sulfate as anhydrite (CaSO4) or reduction of seawater sulfate (with
possible admixture of basaltic sulfur) and precipitation at depth in the
system as pyrite or other metal sulfides. The sulfur content alone
provides no information on the relative importance of the various sources
and sinks. Other lines of evidence can provide additional constraints
- although these may also not be definitive. Sulfur has 4 naturally
occurring stable isotopes of which 32S (95.0%) and 34S (4.22%) are the most
abundant. Seawater sulfate is enriched in 34S (634S = 200/0o) at the
present time while basaltic sulfur (634S 00/oo) is more depleted. As the
two possible sulfur sources have distinctly different isotopic contents,
the isotopic composition of the exiting solution may provide information on
the source. A major drawback to this interpretation is the approximately
-20/oo fractionation that occurs when sulfate is reduced to sulfide at
350 C (Ohmoto and Rye, 1979). Thus the first sulfide formed from the
reduction of sulfate will have 634S 00/o; the same as the basalt value.
If all the sulfate is reduced the isotopic composition must be conserved
and the resulting sulfide will be +200/oo. If the sulfate is only
partially reduced, the resulting isotopic composition of the sulfide will
be in the range 0-20 /oo; the same range as would be achieved by mixing
basaltic sulfur with seawater sulfate. Sulfur isotopes by themselves are
therefore not completely diagnostic of source. Several models will be
presented below which address this question in more detail.
Additional constraints may be derived by examining other species which
may act as sulfur analogs. Arsenic and especially selenium can substitute
for sulfur. Both of these elements have low concentrations in seawater and
much higher concentrations in basalt. The total concentration of these
90
elements in the hydrothermal solution can be treated as wholly basalt
derived. If they truly behave like sulfur their extraction efficiencies
from basalt should be the same as for sulfur, and therefore the total input
of basaltic sulfur can be determined. There are several problems with this
approach. First the basalt content of Se and especially As is poorly
known, making calculation of an extraction efficiency difficult. Second,
As and Se and may behave differently than sulfur especially if metal
sulfides (selenides, arsenides) are being precipitated at depth. An
advantage of using As and Se is that if they both give the same results,
although they themselves are different elements, this will provide more
confidence that S behaves the same way. Se and As may therefore provide
some constraint on the sulfur system.
Additional limits are placed on the sulfur system based on the
chemical composition of the basalt. The basalt at 210 N contains -13
mmoles/kg sulfur (RISE Project Group, 1980), therefore this is the maximum
amount that can be leached into solution. If all the seawater sulfate is
deposited as anhydrite the basalt must contain enough Ca to do this and to
provide the remaining Ca to achieve the observed solution composition. The
rock contains a large amount of Ca (2.2 moles/kg) and this provides no
constraint. Similarly the Fe content of the rock provides a potential
constraint. Eight moles of Fe2+ must be oxidized to Fe3+ to reduce each
mole of sulfate (S6+) to sulfide (S2 -) but at the low water/rock ratio
observed in this system enough Fe is available for the reduction and it is
not a limiting factor.
Based on the above constraints and the available data several models
for the sulfur system will be examined. These models demonstrate that
while the processes cannot be uniquely quantified, certain constraints can

91
be made.
Case I: Everything is taken at face value. An average of 7.4
mmoles/kg of H2S (Table 2-8) with an isotopic composition of 634S 3.70/oo
(Kerridge et al., 1983) exits from the vents. Sulfate reduction is
assumed to have gone to completion with no resulting isotopic
fractionation.
x(+200/ o) + (l-x)(0 /oa) = 1(3.70/00o)
x = 0.185(l-x) = 0.815
where x = the fraction of sulfur derived from seawater sulfateand (l-x) = the fraction of sulfur derived from basaltic sulfur.
Approximately 20% of the H2S is from the reduction of seawater sulfate and
80% is from the basalt.
0.2(7.4) = 1.5 mmoles/kg from seawater sulfate0.8(7.4) = 5.9 mmoles/kg from basalt sulfur.
This implies several things:
a. no subsurface precipitation of sulfides has occurred.
b. the rest of the sulfate (27 mmoles/kg) was deposited as anhydrite
implying that >17 mmoles/kg Ca was leached from the rock.
c. the extraction efficiency of the S from basalt is 45%.
This case cannot, per se, eliminate precipitation of sulfides at depth.
For precipitation to occur it requires that the ratio of basaltic S to
seawater sulfate be maintained at 4:1, and that the reduction occurs
before sulfide precipitation. If precipitation is occurring, more basaltic
S and less Ca are being extracted. The above discussion assumes the
simplest kind of precipitation: the precipitates have the same sulfur
isotopic composition as the solutions. If precipitation were occurring in
equilibrium with the solutions at 350° C, the sulfides formed should be
0.30/oo lighter (Kerridge et al., 1983) than the solutions and this would
have a small affect on the isotopic composition of the solutions. In

92
practice, the sulfides in the chimneys appear to average +1.9%/oo (Kerridge
et al., 1983), 1.8/00oo lighter than the solutions. (Hekinian et al.,
(1980), Styrt et al., (1981) and Arnold and Sheppard (1981) found 634S
values in the sulfides of +1.4 + + 40/oo00.) Continued deposition of sulfides
with this isotopic content would result in the solution S becoming
progressively heavier. This would imply that less than 20% of the S is
seawater derived; resulting in a higher S (and Ca) extraction from basalt.
This case therefore implies a maximum of 20% seawater sulfate being in
the endmember. It is not constrained by the absolute amount of sulfate
reduced (and iron oxidized), the amount of anhydrite precipitated or the
amount of S and Ca leached from the rock.
Case II: The seawater sulfate is quantitatively reduced.
From Case I, the seawater sulfate must comprise <20% of the total
sulfur emanating from the hydrothermal vent to maintain the observed
isotopic composition. Since seawater contains 28 mmoles/kg of sulfate this
implies that >112 mmoles/kg must be leached from the basalt. Basalt
contains ~13 mmoles/kg of sulfur therefore this case can be eliminated in a
simple flow system. (This case cannot be eliminated in a more complex flow
system where it could be postulated that all the seawater sulfate is
reduced and 80% is deposited before the conditions are such that the
basaltic sulfur is leached into solution. Although this appears unlikely,
the Fe content of the basalts does not prohibit complete reduction of the
sulfate.)
Case III: The basaltic sulfur is quantitatively extracted.
From Case I the basaltic S is >80% of the total sulfur. Since basalt
contains ~13 mmoles/kg S this implies <3 moles/kg of seawater sulfate

93
must be reduced. This case requires:
a. deposition of 9 mmoles/kg of S as metal sulfides at depth.
b. deposition of >25 mmoles/kg anhydrite, implying that >15 mmoles/kgof Ca must be leached from the basalt.
This case does not contradict any of the arguments presented thus far.
However if the arguments presented in Case V are correct they suggest that
Case III is not be a likely scenario. Those arguments are not strong
enough to eliminate Case III based on present data.
Case IV: No basaltic sulfur is leached from the rock, therefore all
the sulfur is from the reduction of seawater sulfate.
It was noted earlier that the fractionation of sulfur reduced from
sulfate to sulfide at 3500 C is -200/oo (Ohmoto and Rye, 1979). If a
Rayleigh distillation is assumed (which is not necessary but gives the
lowest isotopic value) and the total amount of sulfur reduced is assumed to
be the total amount observed in solution (7.4 mmoles/kg implies 26% of the
seawater sulfate is reduced):
a = 34S + 1000r6,3 Sox + 1000
where Sr = reduced sulfur and So = oxidized sulfur.
= 0 + 1000
20 + 1000
a = 0.98
634Sox = [(634 S)init + 1000]f(a-1) - 1000
where (634S)init = the initial isotopic composition of the sulfurand f = the fraction of the oxidized (ox) species remaining.
= [20 + 1000](0.74-0 -0 2) - 1000
634Sox = 26
634Sr = a[(6 3 4 Sox) + 1000] - 1000
634Sr = 5.5
If 26% of the seawater sulfate is reduced the sulfide formed will have a
94
664S = +5.50/00. This is higher than the observed value of +3.7 /00. The
reduced sulfur exiting from the hot springs must therefore contain at least
some basaltic sulfur. However based on this calculation about two-thirds
of the sulfur could be derived from the reduction of seawater sulfate, if
the reduction process has not gone to completion.
Case V: Initially ignore the constraints from the isotopic
composition. Assume that As and Se are good sulfur analogs and that As, Se
and S have the same extraction efficiency from basalt.
Se has a maximum 2.3% and As a maximum 1.5% extraction efficiency from
the basalt (in three of the vent areas). If S is also assumed to have a
maximum 2.3% extraction efficiency this implies that 0.3 mmoles/kg S is
from the basalt and the rest (7.1 mmoles/kg) is from the reduction of
seawater sulfate. This implies that 25% of the seawater sulfate is
reduced. This reduces to essentially Case IV when the isotopes are
considered, as the seawater contribution has 634S = 5.30/oo (if Rayleigh
distillation is assumed which is not necessary but it gives the lower
isotopic value).
7.1 (5.3) + 0.3 (0) = 3.77.4 7.4
5.1 > 3.7
The sulfur extraction efficiency cannot be as low as that implied by the As
and Se data, or the sulfur isotopes would be higher. The apparently too
low extraction efficiencies may be due to unrealistically high
concentration values for the basalt, as these values are poorly known.
Case V provides no additional constraints beyond Case IV. The Se and As
however do imply that some basaltic S must be present.
From the above discussion it can be concluded that the sulfur in the
exiting hydrothermal solutions must be a mix of both basaltic S and
seawater sulfate. The relative proportions of each cannot be defined with

95
the present data. Unless a two stage model is invoked all the seawater
sulfate cannot be reduced and agreement maintained with the isotopic data.
This implies that some anhydrite must form and that some seawater sulfate
must be reduced. The relative proportion of each may be dependent on the
flow system (section 2-5). The experiments have shown that the reduction
of sulfate to sulfide is rapid (on the scale of days) if the fluid is at
>300 C (Shanks et al., 1981). The complication is that if seawater is
heated to >150 C it becomes supersaturated with anhydrite. If the flow
system is such that the water traverses the isotherms from 100-300 C
rapidly, minor sulfate will be lost as anhydrite and the rest can be
reduced. If the solution spends a long time at 100-200° C it will lose
much of its sulfate as anhydrite. The experimental work has shown that Ca
can be leached out of the rock at low (150° C) temperatures (Seyfried and
Bischoff, 1979) so the amount of anhydrite which can form is not limited by
this. Additional experiments have shown that it takes 175 hours with glass
and 600 hours with diabase (water/rock = 10) to remove half the sulfate at
150 C (Seyfried and Bischoff, 1979); and less than 24 hours with glass and
less than 86 hours with diabase (water/rock = 10) to remove all the sulfate
at 300° C (Seyfried and Bischoff, 1981). These experiments provide some
constraint on how fast the flow across the isotherms must be if sulfate is
to be deposited as anhydrite or reduced to sulfide. If major amounts of
anhydrite form, it must later be redissolved as it has only been observed
as veins in DSDP Hole 504B where it is interpreted as a late alteration
product in the oceanic crust (Anderson et al., 1982). Anhydrite would
provide therefore only a temporary sink for any sulfur deposited. If on
the other hand the sulfate is reduced and precipitated as a metal sulfide
hydrothermal circulation is a permanent sink for sulfur. Subsurface
96
precipitation of sulfides should be occurring at NGS based on the
calculated saturation of pyrite (Bowers, Von Damm and Edmond, 1983) and the
stockwork zone observed in ophiolites. Therefore hydrothermal circulation
is most likely an active S sink but its magnitude is less than the total 28
mmoles/kg which entered the system.
2.4 Silica Concentration and the Depth of Reaction
Extensive work on continental hydrothermal systems has shown that the
dissolved SiO2 concentration is often in equilibrium with quartz, present
in the solid phase. As quartz solubility is a function of both temperature
and pressure, if the SiO2 content of the solution and either temperature or
pressure is measured, the other parameter can be determined. A large
amount of experimental work has been done on the system SiO2-H20 over a
wide range of pressure and temperature conditions in order to apply it
accurately to continental hydrothermal systems (Fournier et al., 1982 and
references therein). An obvious extension is to apply it to submarine
hydrothermal systems where similar pressure and temperature conditions of
reaction occur.
At 210 N the SiO2 content and temperature of the exit solutions were
measured (Table 2-12). The pressure at which the solutions were last in
equilibrium with quartz can then be determined. The pressure can be
assumed to be hydrostatic (as it is an open fracture system) and the depth
of the overlying water column is known (2500 meters -- 250 bars). The
pressure can be calculated and converted to a depth within the oceanic
crust at which the reaction occurred. Several assumptions are inherent in
this approach:
1. The solutions reached equilibrium with quartz and are not inequilibrium with a different phase.

97
2. The solutions have not cooled, except adiabatically sinceachieving equilibrium.
3. The solutions have not precipitated quartz (due to cooling or adecrease in pressure) since they reached equilibrium.
There are essentially no checks, except for the consistency of the data on
the above assumptions.
Most of the work done on quartz solubility has been done in pure
water, not salt solutions. The 210 N solutions which contain ~0.6 M NaCl
are relatively dilute solutions when compared to the salinities observed or
inferred for most hydrothermal solutions. Fournier et al. (1982) recently
performed a series of experiments to see how the salt content of a solution
affects quartz solubility. Their experiments were done at 350° C,
pressures of 180-500 bars and 0, 2, 3 and 4 M NaCl solutions. Their data
do not cover the range of SiO2 concentrations observed at 210 N and the
temperature is too high for the Guaymas system. The major conclusion of
their work is that at the studied pressure and temperature conditions NaCl
increases the solubility of quartz. The experimental data of Kennedy
(1950), although in distilled water, covers the entire range of pressure
and temperature conditions and SiO2 concentrations observed at 210N and
Guaymas. The data of Kennedy (1950) are therefore used to find the
pressures at 210 N and Guaymas (Table 2-12), as the use of a single data
set will assure that the conclusions are internally consistent. The
pressures obtained from this data set should be treated as maximum values
as the presence of NaCl in the solutions will increase the solubility of
quartz (i.e. have the same effect as a higher pressure).
The four vent areas at 210 N display a variation in SiO2 content. The
highest value (19.5 mmoles/kg) is observed at NGS which is the most
northeasterly vent and the values decrease to the southwest. The OBS vent
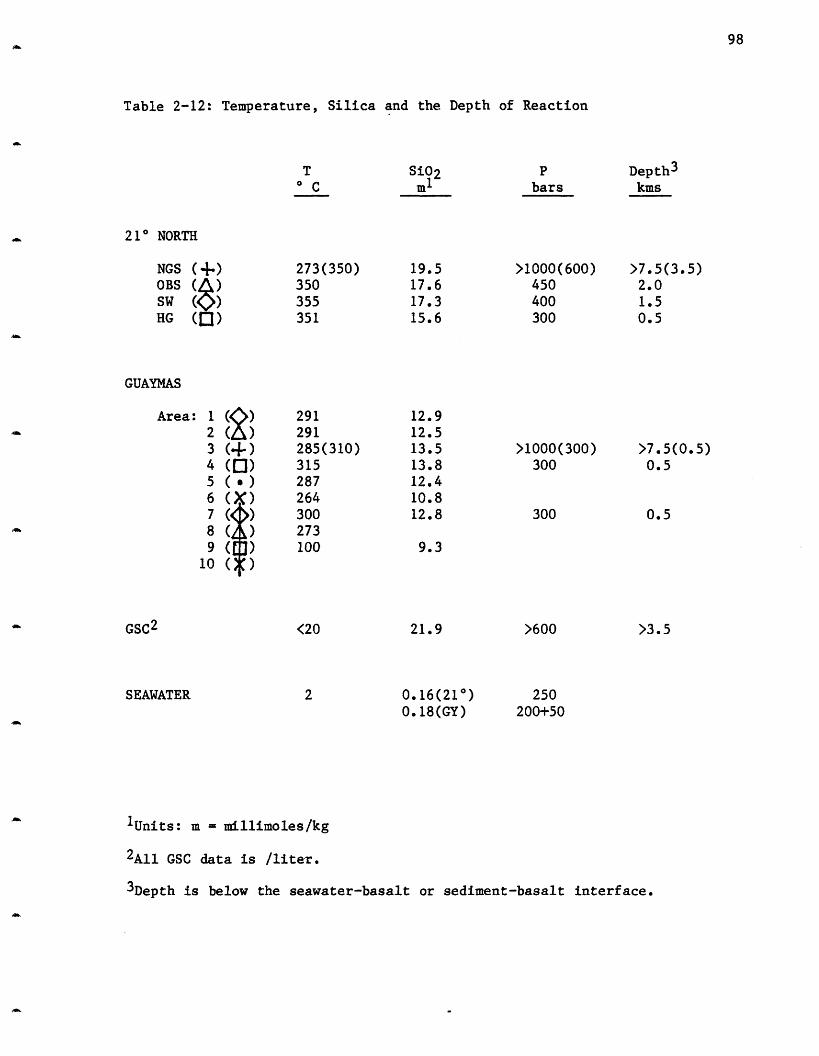
98
Table 2-12: Temperature, Silica and the Depth of Reaction
TC
SiO2ml
P
barsDepth3
kms
210 NORTH
Area: 1 ( )
2 ( )3 (+)4 (0)5 ( )
7 ( )
9()10 (
GSC2
SEAWATER
273(350)350355351
291291
285(310)315287264300273
100
<20
2
>1000(600)450400300
>1000(300)300
300
lUnits: m = millimoles/kg
2A11 GSC data is /liter.
3Depth is below the seawater-basalt or sediment-basalt interface.
NGS (+)OBS SW ()
HG (a)
19.517.617.315.6
GUAYMAS
>7.5(3.5)2.01.50.5
12.912.513.513.8
12.410.812.8
>7.5(0.5)0.5
0.5
9.3
21.9 >600 >3.5
0. 16(21°)0.18(GY)
250200+50

99
contains 17.6 mmoles/kg which is slightly greater than the SW area at 17.3
mmoles/kg which is significantly greater than the HG vent at 15.6
mmoles/kg. SiO2 is one of the few species which shows a geographically
consistent trend, decreasing from the northeast to the southwest. Ballard
and Francheteau (1982) have presented a model in which they propose that
the zone of most recent activity is the topographic high along a given
section of ridge crest. HG is closest to this high point and NGS is the
furthest away. If a magma chamber is present in this area the SiO2 content
of the solutions may indicate a gradual deepening of the isotherms or depth
to the top of the magmas chamber as more of its top surface has been cooled
due to longer times of hydrothermal circulation.
The temperature of the hydrothermal solutions was measured with a
thermocouple on Alvin at the time they were collected. Measuring the
temperature is not trivial as it is often difficult to insert the probe
into the chimney orifices long enough to achieve a stable reading. The
highest stable reading recorded is taken as the true temperature, The
vents at 210 N were all visited on several different dives over a twelve
day period and the same temperatures were recorded on different days,
placing additional confidence in the values.
Figure 2-25 is a plot of the data of Kennedy (1950) with the different
vent areas plotted from their measured temperature and SiO2 contents. From
the plot the following pressures can be determined: HG = 300 bars, SW =
400 bars, OBS = 450 bars and NGS >1000 bars. Once the pressure from the
overlying water column is removed (250 bars) the following pressures/depths
of reaction can be calculated: HG = 50 bars or ~0.5 kms below the seafloor
and into the ocean crust, SW - 150 bars or 1.5 kms, OBS = 200 bars or 2.0
kms and NGS >750 bars or >7.5 kms. On a physical basis it appears unlikely

100
Figure 2-25: Solubility of quartz as a function of temperature andpressure. Data are those of Kennedy (1950) in distilledwater. Pressures are in bars. The 210 N areas are plottedon the figure as follows:
N = NGSO = OBSS = SWH=HG.
The Guaymas areas are also shown and are designated by theirarea numbers.
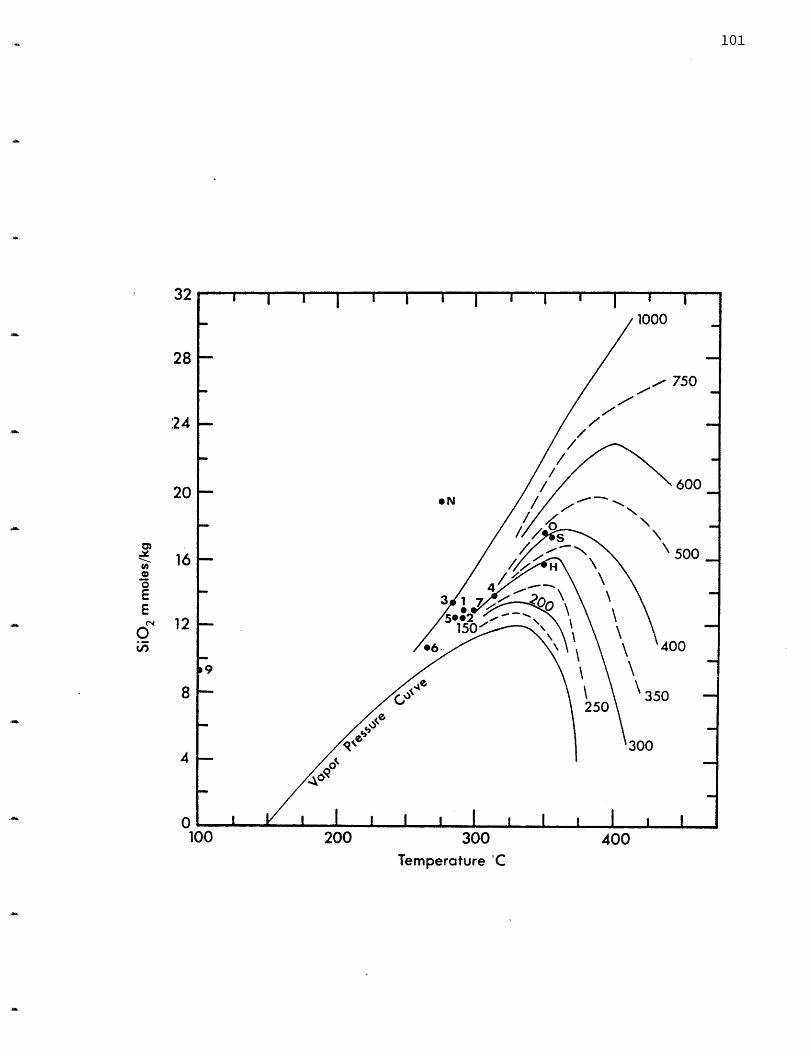
200 300 400Temperature 'C
101
32
28
:24
20
0
0E
E(N
gO. _
16
12
8
4
0100
102
that NS which is only 400 meters from OBS has a depth of reaction >5.5 kms
deeper. A more reasonable explanation is that NGS reacted at a higher
temperature but has conductively cooled since leaving the zone of reaction
(an explanation which is consistent with the pyrite saturation). If it is
assumed that NGS was 350° C, as are the other vents, its inferred pressure
becomes 600 bars or 3.5 kms into the basalt, a geologically more
reasonable value based on what is observed at the other vents.
Using the measured temperature and calculated pressure a temperature
at depth can be back calculated assuming adiabatic expansion over the depth
interval, and if necessary a new pressure based on the new temperature can
be calculated until the values converge. For this calculation it is
assumed that o conductive cooling occurs, as has already been shown to be
false or NGS, and enthalpy is conserved. In practice, as the net pressure
difference is small, so is the temperature difference and within all the
uncertainities the pressures calculated on the "first pass" do not change
in subsequent clculations. HG, with a measured temperature of 351 C
would have a temperature of 350-355 C (these temperatures are given as 50
ranges due to the uncertainities), SW measured at 355 C would increase to
360-36'5 C and OBS measured at 350 C would increase to 355-360 ° C. Thus
unless conductive cooling is invoked for all the vent areas, the
temperatures at depth are less than 10 C higher than the measured
temperatures. If conductive cooling is occurring the points on figure 2-25
would all move to the right. Because of the form of the isobars in the
figure, this would require very little increase in the depth of reaction
for temperatures of 350-400° C. (Based on the physical properties of water
it is unlikely that they are much hotter than 400 C at depth (Green,
1980)). If HG is actually in the temperature range 350-363 C at depth it

103
will have a :Lower pressure for the same silica content and hence a
shallower depth of reaction into the oceanic crust. Based on the 350 C
temperature, reaction at HG occurs 500 meters into the oceanic crust. This
reaction must occur below the seafloor (2500 m = 250 bars), therefore the
pressure determined by this method must be greater than 250 bars. The
temperatures at depth cannot be much higher based on the pressure
constraint. As noted earlier the pressures determined by this method are
maximum values because of the increased solubility of SiO2 in salt
soluitons. A summary of the calculated pressures and depths of reaction
are given in Table 2-12.
The data from the 1979 cruise implied that the endmember silica
concentration was 21.5 mmoles/kg. Sampling was poor on that cruise
(Appendix 1) and the endmember concentration is based on essentially one
sample (Mg = 7 mmoles/kg, 86% hydrothermal water). The 1979 value is
higher than the 1981 value for this area but this difference is attributed
to sampling problems.
Supporting evidence for these silica depths of reaction comes from
geophysical evidence. An array of ocean bottom seismographs were deployed
at the 21 N site in 1980 (Riedesel et al., 1982) including one within 300
meters of a black smoker. Most of the recorded events occur within
1.75-2.75 kms below the seafloor. The authors suggest that this may be the
depth of hydrothermal circulation. The seismographs were closest to the
OBS vent (hence its name) which gives a depth of reaction of 2.0 kms based
on SiO2; in excellent agreement with the geophysical data.
The depth of hydrothermal circulation inferred at 210 N varies between
vent areas from 0.5-3.5 kms. These are maximum depths of reaction because
the effect of salt on quartz solubility was not considered. The data for

104
three of the vent areas does not require them to be any hotter at depth as
suggested by Bischoff (1981) but one vent (NGS) appears to be undergoing
conductive cooling. If NGS is also assumed to be ~350 ° C at the time of
reaction its depth is consistent with that obtained for the other vents.
The depth of hydrothermal circulation inferred from the earthquake data
(Riedesel et al., 1982) is in agreement with that calculated by SiO2
geobarometry. The depth of circulation at 210 N appears to be shallower
than that inferred for the GSC (Edmond et al., 1979a) which was highly
uncertain.
2.5 21'' N Model
No rigorous model can be proposed to explain the differences in
solution chemistry between the vent fields at 21° N. Mechanisms which can
control individual elements have been previously discussed in this chapter.
The main difficulty in modelling the 21 N system is that the conditions
and reactions occuring at depth in the system are unknown and can only be
inferred from the solutinn chemistry. The chemistry at the four vent areas
differs; what is occurring at depth must also differ. NGS has lower exit
temperatures therefore some of its chemical differences can be attributed
to this. The other areP3 all have 350° C "smokers"; therefore, exit
temperature cannot be ised to explain their differences. Several
parameters imply that HG may be a "younger" vent reacting with "fresher"
basalt, This still leaves the SW and OBS vents with chemical differences
between them that cannot be explained. As discussed in section 2.2
equilibrium is not achieved between the water and the rock in these systems
and this accounts for the observed differences. Several general models
will be examined for t .r influence on solution chemistry. None of these
models alone can account for the observed differences in solution but

105
presumably some combination of these models is correct.
1. Aging Trend. If it is assumed that the hydrothermal activity is
moving to the southwest then NGS is the oldest vent and HG is the youngest.
The older vent should be flowing through more leached rocks and therefore
should have lower alkali concentrations. The channel walls would also be
armored from previous reactions, again resulting in a more dilute
concentration for many of the elements. Certain phases, such as the
pyroxenes appear to be more resistant to alteration, hence elements in
these phases (such as Ca) might have relatively higher concentrations in an
older vent. An immediate problem for this model is that NGS has the
highest K content of any vent area. As alteration increases so should the
observed water/rock ratio. As the water/rock ratio increases the mineral
assemblage within the greenschist facies should change. Mottl (1983) has
presented the following reaction sequence:
chlorite - albite - epidote - actinolite
chlorite - albite - epidote - actinolite - quartzwater/rock
4+ ratiochlorite - albite - quartz increases
chlorite - quartz +
Hence albite and epidote should be converted to chlorite as the "aging"
increases with a resultant release of Na and Ca to solution. Although
higher Na and Ca are seen at NGS the isotopic and chemical data give no
evidence of an increase in water/rock ratio compared to OBS and SW.
2. Pathlength. If the silica concentrations can be assumed to be due
to equilibrium with quartz, it can be used in conjunction with the measured
temperature to calculate a pressure (depth) of reaction. The silica
106
implies an increasing depth of reaction from HG to NGS. An increasing
depth of reaction may also imply an increase in the pathlength of the cell.
Williams (1974) in a study of cellular convection in the laboratory and in
the field (GSC) found the ratio of the two dimensions (horizontal:vertical)
of the flow cell to be approximately 1.6. This would imply that water
which has a deeper depth of reaction (vertical distance) also has a longer
recharge distance (horizontal distance). Green (1980), in a further study
at the GSC, found this ratio to be 40+10 but did not believe that he or
Williams had sufficient data to truly define this parameter. (Williams
data when combined with silica geobarometry on the solutions implies a
recharge zone 0.8-5.6 kms from the vents. Green's data implies a distance
of 15-175 kms.) While the relationship between the increase in horizontal
length to vertical depth in these cells remains an open question, it is
obvious that a greater depth of reaction requires a longer path length. A
longer pathlength may have implications for the chemistry of the solutions.
First, the solutions come in contact with more rock (givin a smaller
effective water/rock ratio). Second, if flow rates do not vary between
vent areas this means the water will spend more time in contact with the
rock. More time in contact with the rock presumably means more time for
leaching to occur from the rock to the solution and more of a chance that
equilibrium is reached (or more closely approached). More leaching would
imply increases in the concentration of some dissolved species while
equilibrium could imply either increases (from undersaturation) or
decreases (from supersaturation). A secondary effect of longer pathlength
may be longer time spent in the upflow zone. Longer time may permit
conductive cooling to occur and this may result in a temperature drop in
the solution. Attendant with a temperature drop may be the precipitation
107
of species which are now supersaturated in the solutions. This cooling and
loss of pyrite appears to be occurring in the NGS vent, which based on
Increased pathlength may be as important on the inflow (or downflow) limb
of the hydrothermal circulation as on the upflow. If the downflow limb is
long this may mean that the solutions cross the isotherms slowly, inferring
that they spend more time at intermediate temperatures. This may be
especially important for the sulfur chemistry of the springs and, as a
result, for their metal chemistry as well. Seawater becomes saturated with
respect: to anhydrite (CaS04) merely by heating to >1300 C at the pressure
conditions of the ridge crest (Haymon and Kastner, 1981). The experiments
have shown that Ca can be leached out of the rocks at this temperature
(Seyfried and Bischoff,1979). The experiments have also shown that it
takes a finite amount of time to precipitate this anhydrite (Seyfried and
Bischoff, 1979) i.e. it is not instantaneous. If the solution spends a
great deal of time at 100-2000 C it will probably lose most of its S04 as
anhydrite. If the pathlength is shorter and the solution traverses the
isotherms rapidly there is a greater potential for the S04 to reach the
>300 C zone where it can be reduced relatively rapidly to sulfide (Shanks
et al., 1981). The pathlength in the downflow zone may therefore be as
important as that for the upflow zone.
3. Residence Time. It cannot be presumed a priori that the flow rates
are the same in all the vent areas or even how they vary. Hence, the
residence time that the water spends in the fissures is not necessarily
directly proportional to the pathlength. An increased residence time does
not infer that the solution will come in contact with more rock as will
occur with an increase in pathlength. An increased residence time does
imply :hat more time is available for the solution to react with the rock,
hence :leaching may increase and equilibrium may be more closely approached.

108
It may also mean that the solution has time to conductively cool after it
has reacted, leading to precipitation. Many of the effects of increased
pathlength (d) and residence time () are the same and they are difficult
to separate. If flow rates (v) are the same in all vent areas these two
parameters are directly related:
v = d/T
and need not be separated. As mentioned for the pathlength the residence
time in the downflow zone may be as critical for the final solution
chemistry as that for the upflow zone. Lister (1982 and references
therein) has modelled hydrothermal circulation extensively and although his
models permit calculation of a residence time for the upflow zone he does
not believe that they are representative of real conditions.
4., Temperature. Experimental work (section 2.9) has shown that
temperature is an important parameter in leaching species from basalt into
solution. Higher temperatures result in increased leaching efficiency.
Variations in the temperature of the hot springs at depth would be nother
mechanism to explain differences in their observed chemistries. At 21 N
vents with temperatures of approximately 273 C at the seafloor contain no
copper, while those with temperatures of 350 C do. The 273 C ve-ts are
however, inferred to be -350 ° C at depth and to have conductively cooled
(section 2.4). The measured temperatures at 210 N range from 270 C to
355° C, Adiabatic expansion, over the depth calculated from the silica
data, would add less than 10 C to these temperatures. Bischoff (1980) has
suggest:ed that the hot springs are closer to 4000 C at depth. This would
require conductive cooling as well as cooling due to adiabatic expansion.
As three of the vent areas have exit temperatures of 350-355 C t' 3 would
require them to cool to the same temperature although they are sprpad over

109
almost 8 kms. This suggests that the 21 N solutions are all of similar
temperature and are not much hotter at depth. The maximum temperatures
recorded at 130 N are less than 350 C (Michard et al., 1983) and the
inferred temperature for GSC was 344 C (Edmond et al., 1979a). The
highest temperature recorded from continental hydrothermal systems is 370 °
C at Cerro Prieto and the Salton Sea (Barnes, 1979).
From the preceding discussion it can be seen that several factors such
as age, pathlength, residence time and temperature, and the changes which
they imply in other parameters, are important in fixing the solution
chemistry. These factors may imply different chemical reactions and
controls on the system but at present cannot be uniquely separated from the
observed net changes in solution chemisty.
2.6 Chimney Chemistry
The mineralogy and chemistry of the chimneys, associated smoke and
basal mounds at 210 N has been examined by several groups. Hekinian et al.
(1980) described samples collected on the Cyamex expedition in 1978 on
which only extinct chimneys were found. Haymon and Kastner (1979, 1981)
examined samples from active and extinct chimneys collected during the RISE
project in early 1979. Styrt et al. (1981) and Goldfarb (1982) examined a
suite of samples collected on the November 1979 cruise on which preliminary
water samples were taken. Oudin (1981, 1983) worked on samples collected
on RISE and the November 1979 expedition. The mineral assemblages found by
Hekinian et al. (1980) are different from those of the other workers
because they are from extinct chimneys and the sulfates dissolved prior to
sampling. Haymon and Kastner (1979, 1981) also noted differences between
active and inactive chimneys. The samples examined by Oudin (1981, 1983),

110
Styrt et al. (1981) and Goldfarb (1982) are especially valuable because
they can be correlated with water samples which were collected from some of
the chimneys. Hekinian et al. (1980) and Oudin (1981, 1983) examined
chimney samples for more trace metals than the other workers.
All of the workers note the large abundance of zinc sulfides (either
as wurtzite or sphalerite) in the chimneys. It is always present in much
greater abundance than the copper sulfides (principally chalcopyrite).
This agrees with the solution composition in which Zn:Cu is always >3:1.
Iron sulfides are also a major component. This is consistant with the
large amount of iron found in the solutions. In all of the solutions
dissolved sulfide predominates over dissolved Fe + Cu + Zn, etc. therefore
the deposition of the metals is not limited by the sulfur content.
The solutions contain no sulfate. Abundant anhydrite and minor barite
found in the active chimneys are formed when seawater sulfate mixes with
the hydrothermal solutions which contain elevated levels of Ca and Ba.
This has been substantiated by the sulfur isotopic value of the sulfates
(Styrt et al., 1981). Oudin (1981, 1983) also reports the presence of
PbSO4 ,,
Elemental sulfur is found associated primarily with worm tubes in the
chimneys and is probably a secondary or biological product, as there
appears to be no elemental sulfur in the hydrothermal solutions (Table
2-9).
Oxides and hydroxides are found as alteration products on the
exteriors of the chimneys. Amorphous silica is often found inside the
chimney.
The different workers analyzed for different suites of trace metals.
All of them found some lead as galena. Hekinian et al. (1980) also report
111
the presence of silver, cadmium and cobalt with lesser selenium, gold and
platinum. They found essentially no nickel. Nickel was not found in the
hydrothermal solutions but all of the other elements (except gold and
platinum which were not analyzed) were also found in the hydrothermal
solutions. Oudin (1981, 1983) reported the presence of the arsenic
minerals tennantite [(CuAg)1 0(Fe,Zn,Cu)2As4S1 3] and jordanite [Pbl4As6S 2 3]
and As was also found in the solutions. Goldfarb (1982) also analyzed for
Cr but did not detect any in the solids.
The coexistence of sulfates and sulfides in the chimneys suggests they
are disequilibrium assemblages which is not unexpected based on the
rapidity of the mixing process. This is verified as well by the sulfur
isotopes in the sulfides. If equilibrium is established the sulfide
isotopic fractionation between various pairs of sulfide minerals can be
used as geothermometers. Kerridge et al. (1983) has found that almost all
the temperatures determined in this manner are incompatible with the
observed temperatures inferring that the sulfide mineral assemblages are
not at equilibrium.
Many of the chimneys are banded suggesting that the conditions of
mineral deposition have changed with time. Styrt et al. (1981) suggest
that the difference between "zinc-rich" and "copper-rich" chimneys is that
the temperature of the hydrothermal solutions is less than or greater than
300 C respectively. Although this is a thermodynamically reasonable
hypothesis, the temperature data from the 1979 cruise on which these
samples were collected is not good enough to support this hypothesis. On
the 1981 cruise the hydrothermal solutions at two chimneys with exit
temperatures of 270-273 C (one at SW and the other at NGS) were found to
contain no measurable copper, while still containing large amounts of zinc.

112
Thus the mineralogical or chemical content of the chimneys may well reflect
changes occurring in the vent chemistry. This approach needs to be
explored further. In general the chemical agreement found between the
hydrothermal solutions and the chimneys they are forming is very good
although the mineral phases forming are not necessarily in equilibrium with
each other or the solutions.
2.7 Comparison to Ore Deposits
A major class of ore deposits are the volcanic-associated massive
sulfide deposits, a subclass of which are the ophiolite-hosted deposits.
Ophiolites are presumed to be sections of ancient oceanic lithosphere which
have been emplaced on the continents. The massive sulfide deposits they
contain are most likely formed by hydrothermal activity similar to that
observed at 21 N today. In fact these deposits were cited as evidence for
hydrothermal activity on the seafloor before it was actually observed. A
comparison can be made between these ancient deposits and the 21 N
solutions and deposits to better constrain whether the same processes are
occurring in both cases.
Recent comprehensive reviews of ophiolite deposits are given by
Coleman (1977) and Franklin et al. (1981) and the comparison given below
is based on these two works.
The physical setting of massive sulfide deposits and the hot springs
and their deposits at 210 N are similar. Massive sulfide deposits occur
primarily on top of or within the pillow terrain; the chimneys at 210 N
also occur on pillows, which may yet be covered (and preserved) by
subsequent lava flows. The deposits are usually located near faults as are
the 21° N hot springs. The ore bodies tend to be small yet several may

113
occur in a stratigraphic level. All the deposits found to date at 21 N
are too small to be considered ore deposits (based on their surface
expression) and the chimneys with associated deposits are often separated
by several kilometers. SW site, with its several active chimneys meters
apart and collapse pit which could provide a trap for some of the sulfides
may bei an early stage of an ore deposit in formation. Malahoff (1982)
found an ore deposit sized massive sulfide body on the GSC to the east of
the vents. Above the ore body itself is often found a sedimentary deposit
known as the umbers which are iron and manganese sediments, and the ochres
which are the product of iron sulfide oxidation. These deposits may also
contain some diatoms and chert which may be a late late stage product of
the hydrothermal circulation. The deposits often contain blocky pieces of
ore. At the OBS site there is a large mound of weathered sulfide with
blocks of fallen chimney on top. Below the massive ore body there is often
a basal siliceous ore. Although this has not been observed at 21° N it may
well be present as the solutions are extremely silica rich. Below the ore
itself is often found a stringer zone which may extend for hundreds of
meters below the deposit. Although we cannot see below the surface of the
210 N system, it is likely the circulation penetrates up to several
kilometers into the oceanic crust (section 2.4) and may well be depositing
sulfides at depth. DSDP Hole 504B (Anderson et al., 1982) penetrated for
the first time what appears to be a hydrothermal feeder zone in the oceanic
crust. In pillow basalts (911-929 m below the seafloor or 636.5-654.5 m
into the basalt) they found a stockwork with abundant veins of chlorite,
laumontite (a Ca-zeolite), quartz, minor talc, and the sulfides sphalerite,
chalcopyrite and pyrite.
The chemistry of ophiolite deposits is relatively constant with iron
114
(as pyrite) predominating, followed by copper (as chalcopyrite), then zinc
(as sphalerite) and sometimes with lead (as galena). Although much
emphasis has been placed on the high Cu content of these deposits Franklin
et al. (1981) point out that several actually have Zn>Cu or the two
elements present in subequal amounts. In the 210 N solutions Fe>Zn>Cu>Pb.
Au, Ag, As and Sn may also be found in these deposits (Coleman, 1977) and
Ag and As were found in the 21 N solutions (Au and Sn were not measured).
Franklin et al. (1981) note that the ore bodies contain high Co and low Ni,
again in agreement with the solutions. Franklin et al. (1981) also note
that the deposits are often underlain by Cu-rich vein and disseminated
sulfides and that the deposits are often zoned with a decrease upward
and/or outward in Cu/(Cu+Zn+Pb) ratio. This is in agreement with what is
occurring at the NGS site. In 1979 this vent was 350° C while in 1981 it
was only 2730 C. Preliminary data suggested that it contained Cu (15
umoles/kg) in 1979, but it contained <0.02 moles/kg in 1981. Presumably
Cu is depositing at depth (section 2.2) as a result of pyrite deposition
due to conductive cooling. As a vent system cooled or aged, a resultant
temperature drop could account for the observed decreasing Cu trend.
2.8 Comparison of Solution Chemistry to Observed Basalt Alteration
The 210 N hydrothermal solutions are seawater which has been modified
through reaction with basalt at elevated temperatures. Concomitantly the
chemistry of the basalt must change. Small differences in rock chemistry
are more difficult to see than in the solution. Basalt alteration occurs
at both high and low temperatures and at these different temperatures
reactions may occur in opposite directions. An example of this is the
alkalis which are leached from the rock during high temperature alteration

115
but are added to the rock at low temperature (Hart, 1969). It is difficult
to separate these two effects as samples collected will usually have an
unkown combination of the two processes. In an attempt to examine only the
high temperature effects and to avoid the overprint of low temperature
reactions, Humphris and Thompson (1978a,b) used rocks that were dredged
from the ridge crest on the assumption that they have spent minimal time
under the low temperature conditions. All comparisons will be made to this
study as it is one of the most complete, with both major and trace element
analyses and petrographic examination of the rocks.
Honnorez (1981) has argued that dredged rocks do not truly reflect the
alteration of the oceanic crust because they have been exposed to large
amounts of seawater for extended periods of time. Basalt drilled on
several DSDP' legs show different alteration assemblages from those seen in
dredged rocks, but the degree of alteration also varies widely between DSDP
sites. Drilled basalt samples are relatively rare and the studies do not
include as many species as were determined in the Humphris and Thompson
work (1977 a,b); thus the best comparison is still made to the latter
work.
In general the direction of reaction (loss or gain) Humphris and
Thompson observed in the rocks agrees well with the changes in solution
chemistry.
Silica - Humphris and Thompson note a loss of silica during alteration
to a maximum of 11 weight percent (1.7 moles/kg) which is more than
adequate to account for the maximum solution gain of 0.02 moles/kg.
Calcium - They observe a linear decrease with water gain up to a
maximum of 1].0 weight percent (2.4 moles/kg), again more than the observed
solution increase.
116
Magnesium - It increases in the rocks by up to a factor of 2, or
approximately 8 weight percent (3.3 moles/kg), which is much greater than
the solution loss.
Iron - A loss is observed from the rocks but it is difficult to
quantify due to localized pyrite precipitation. A gain occurs in solution
chemis try.
Sodium - The rocks show no consistent trend. The solutions show both
gains and losses but this is complicated by hydration reactions.
Potassium - The rocks show no consistent trend. Potassium shows a
large gain in the solutions but goes into basalt during low temperature
alteration.
Trace Elements
Boron - This is probably leached from the rocks but the value is close
to their detection limit. There is an increase in the 210 N solutions
(SpivaLck and Edmond, unpublished data).
Lithium - They found it to be mobilized in the rocks with a net loss
from the interior of the pillows and an increase on their surface. It is
greatly enriched in the 210 N solutions, but is known to go into rocks
during low temperature alteration.
Strontium - It is mobilized in the rocks, but shows both losses and
gains. The hydrothermal solutions show both small losses and gains.
Barium - Although it is mobilized in the rocks with the interiors
showing some enrichment they suggest it is not very mobile. This disagrees
with the solution data which suggest a large proportion of it is removed
from the rock.
Nickel - They found no major effect on this element and it does not
appear to be enriched in the hydrothermal solutions.

117
Cobalt - They found no major effect on this element although it is
enriched in the hydrothermal solutions, but has a low extraction efficiency
from the rock.
Copper - It was found to be leached from the rocks to a maximum of 1.6
mmoles/kg which is much greater than the elevated levels observed in the
solutions (maximum 0.04 mmoles/kg).
Manganese - They found it to be mobilized with a maximum loss from the
rock of 4.6 mmoles/kg which is greater than four times the observed amount
in the solutions.
The results of Humphris and Thompson agree very well in the direction
of change with the hydrothermal solutions themselves. The magnitudes of
change are, as would be expected, different. These differences are however
in the correct direction i.e. the value purportedly leached from the rocks
is greater than the enrichment appearing in the solution. Therefore in no
case does it appear that the system is "rock limited". Work by Hart et al.
(1974) on altered basalts included data for S and C1 which are not often
reported. Their rocks have undergone extensive low temperature alteration,
making it impossible to separate the high temperature effects. They report
loss of S (20 mmoles/kg) and gain of C1 (8 mmoles/kg) which are consistent
with the hydrothermal solution data.
2.9 Comparison to Experimental Work
As seawater-basalt reactions at elevated temperatures were inferred to
occur at oceanic spreading centers before they were actually discovered
several investigators reacted these components in the laboratory (Bischoff
and Dickson, 1975; Hajash, 1975; Seyfried and Bischoff, 1977; Seyfried and
Mottl, 1977; Mottl and Holland, 1978; Mottl, Holland and Corr, 1979;
118
Seyfried and Dibble, 1980). The aim of these studies was to see what
affect these reactions could have on seawater chemistry; if they could turn
seawater into the metal-rich solution needed to produce the massive sulfide
deposits seen in ophiolites and which could supply the metals seen in
metalliferous sediments; and to see if they could produce the mineral
alteration assemblages observed in submarine rocks. These experiments were
done at the temperature and pressure conditions presumed to be typical of
the in situ oceanic systems. An important variable in both the
experimental and actual systems is the water/rock mass ratio as this is a
strong determinant in fixing the final solution composition as well as the
alteration assemblage observed in the solid phase. An obvious difficulty
with the experimental work is that they are closed systems being used to
replicate open systems, with many attendant limitations. The experiments
were run at a variety of temperatures (70-500° C), pressures (1-1000 bars)
and water/rock ratios (1 to 125). Natural seawater as well as various
synthetic seawaters and brines were used as the reactant solution. Basalt
of varying crystallinity as well as other types of oceanic rock were used
as the starting substrate.
The experiments can be divided into two general groups, dependent on
the experimental method employed. The experiments done by Bischoff,
Dickson, Seyfried and co-workers were done in the "Dickson Apparatus".
This system allows water to be withdrawn from the apparatus during the
course of the experiment. The entire system could also be rocked, speeding
reaction. The disadvantage of this system is that a higher water/rock
ratio, often 10 was used as solution is withdrawn during the course of
the experiment. The high water/rock ratio allows more samples to be taken
over the time course of the experiment as there is a limit to how much the
119
reaction cell can deform as solution is withdrawn. This is a much higher
ratio than has been observed to date in the oceanic systems. The
experiments done by Hajash, and Mottl and co-workers were done in a
different kind of apparatus. It is a batch process, i.e. no solution can
be analyzed until the experiment is terminated. The problem arises because
there is no way to separate the solution from the solids during the quench.
Various back reactions have been shown to occur during this process (Hajash
and Archer, 1980) and they alter both the solution composition and the
observed mineral assemblage. Water/rock ratios as low as one (very close
to the observed ocean values) were used in these experiments. Thus when
comparing 210 N solutions to the experimental work they must be either
compared to solutions created at much higher water/rock ratios or to
solutions which have back reacted to an unknown extent with the solid
phase. The pressures used in the experiments (500 bars in many cases) are
close enough to the pressures in actual systems (still not exactly known)
and appear to have a relatively small affect in comparison to the other
variables.
Several limitations exist on which elements can provide useful data.
All the experiments done at temperatures >260 C necessitated the use of Au
(or Pt) sample cells. Cu and Pb were found to form an amalgam with the Au
and therefore no meaningful solution data can be obtained for these
elements. When seawater is heated above 130 C it precipitates anhydrite
(CaS04). This may slow the reduction of sulfate to sulfide. It causes the
mos~ serious problem in the quenched samples because it redissolves at low
temperatures. The precipitation and dissolution of anhydrite can affect
the Ca, Sr and S composition of the solutions and may affect the redox
state as well.
120
In order to be able to compare the experiments at higher water/rock
ratios the extraction efficiency of the species in solution was calculated
for both the experiments and the 210 N solutions. This approach can only
be used for water/rock ratios <50. At water/rock ratios >50 the system
becomes solution dominated and the reaction progress is quite different,
(there is always an excess of Mg which maintains the solution at a lower
pH). The formation of anhydrite, its metastable persistence throughout the
experiment and its redissolution in the quench prevent meaningful
comparisons of the Ca, Sr, Ba , S04 and reduced sulfur data. In some of
the experiments there are possible diffusion/leakage problems therefore C1
is assumed to be conservative (Bischoff and Dickson, 1975) while there is
an active C1 sink in at least 3 out of the 4 areas at 21° N. The sodium is
calculated on the basis of charge balance and often its changes are not
significant within the sum of the analytical errors. The species which can
best be compared between the experiments and the hot springs themselves are
in many cases reduced to pH, K, Fe and Mn. A problem arises in one of the
experiments (Bischoff and Dickson, 1975) because a low K basalt was not
used, therefore the K values cannot be compared. After all the above
limitations are considered the experiments which produced the solutions
most similar to those at 210 N are those of Mottl et al. (1978, 1979) at
4000 C, 700 bars, water/rock ratio = 1 using a crystalline basalt with
glass present (Table 2-13). The experiments were therefore able to predict
the solution composition reasonably well.
The experiments can provide insights into two aspects of the solutions
which we cannot deduce from the real system. The experiments in the
Dickson apparatus allow the progress of the reactions to be monitored.
They help to define the exchange process as well as the relative kinetics

121
Table 2-13: Comparison of 210 N to Experiments
Experiments210 N
891+ 1322
432+ 510
23.2+25.827+ 33
10+370
11.7+20.865+978+16
3.3+3.8-0.19+-0.50
489+579
15.6+19.5
4.0+5.2
<0.01
0
6.57+8.37
699+ 1002
750+242922+2270+44
40+ 106
<1+ 3817+ 180
183+ 359
= nanomoles/kg= micromoles/kg= millimoles/kg= milliequivalents/kg.
2Experimental data is from Mottl and Holland (1978) and Mottl et al.(1979). Both experiments were done at 400° C, 700 bars, water/rock massratio = 1, and lasted 272 days. Run 2B was done with a glassy basalt andrun 2C was done with a mix of glassy and crystalline basalt.
Element
Li I1Na mK mRb pi
2B
47029.6
0.452.072
740
3.9
27.7
<9.6
5.666.72
6702100<1400<0.8
<720
BeMgCaSrBa
pHAlkt
C1
S i02
Al
NH3
So4H 2S
MnFeCoCuZnAgCdPb
1Units:
2C
51429.3
0.338.1102
657
3.6
27.9
<9.6
5.537.74
10002000<1400<0.8
<720
nmm
meq
m
m
.P
m
mm
nnnn
n
mmeq

122
of the reaction. The kinetic information derived from the experiments can
help in defining the time scales of reactions occurring in the vents. The
second set of information we can obtain is on the solid alteration
assemblage. The 21° N system at depth has not been directly observed.
Based on the solution chemistry and studies of altered deep sea rocks from
dredging and DSDP drill cores the basalt-seawater reactions which must be
occurring are inferred. There are large differences between the
assemblages found in the dredged rocks and those in the drill cores
(Honncrez, 1981). The experiments provide detailed information on which
mineral assemblages form and how they can vary with water/rock ratio.
In general, the experimental solutions are in good agreement with the
210 N solutions but in particulars there are significant differences.
These mostly can be attributed to limitations in experimental design.
Another limitation is that certain elements of interest which may help in
elucidating processes were not measured in the experiments (e.g. Li, Rb,
As, Se); certain elements of interest cannot be determined due to reaction
with the gold capsule (Cu, Ag, Pb); and certain elements have never reached
the same levels as are found in the 210 N solutions for unknown reasons
(e.g. Zn).
2.10 Comparison to Metalliferous Sediments
Iron and manganese rich metalliferous sediments were first recovered
on the Challenger expedition in the 1870's but not until the 1960's
(Bostrom and Peterson, 1966) was the correlation of these sediments with
the crest of the East Pacific Rise established. Much work has now been done
on these sediments (Bostrom and Peterson, 1966; 1969; Bostrom et al., 1969;
Horowitz, 1970; Piper, 1973; Heath and Dymond, 1977; Dymond, 1981) which

123
are highly enriched in many of the transition metals. Volcanic and/or
hydrothermal exhalations on the ridge crest were postulated as a possible
source of these depositions, although a source from hydrogenous
precipitation from seawater could not be eliminated. Their strong areal
association with the ridge crest favored the former of these explanations.
An isotopic study by Bender et al. (1971) established that the U and Sr in
these sediments had a seawater source, while the Pb had a volcanogenic
source. Based on the high accumulation rates for Mn in these sediments
they determined that it must also have a volcanogenic input. Bostrom and
Peterson (1966), Bostrom and Fisher (1969), Fisher and Bostrom (1969) and
Horowitz (1970) reported enrichments of the elements Fe, Mn, Ni, Co, Cu,
T1, M, Ti, As, B, Zn, V, Cd, Pb, Hg, Ag and L in the sediments. The
source of most of these elements cannot be determined isotopically. The
composition of the 210 N hydrothermal solutions can be used to determine if
an element may have a hydrothermal source. This does not eliminate the
possibility of an element being present in the hdrothermal solutions but
precipitating near the vents with the later addition of this element from
seawater to the Fe and Mn oxides and hydroxides (which must have a
hydrothermal source). If an element is not present in the hydrothermal
solutions it: must be attributed to a hydrogenous source. Of the elements
listed above Fe, Mn, Ni, Cu, Zn, Co, Cd, Ag, Pb, As and B were determined
in the hydrothermal solutions. Field et al. (1981) presents data for these
elements in metalliferous sediments from the crest of the East Pacific
Rise. Table 2-14 presents this data as the ratio of these species to the
Fe content of the sediment, as well as the ratios of these elements to Fe
in the four vent areas at 210 N. In the case of Ni and Co the ratios are
lower in the hydrothermal solutions than in the metalliferous sediments,
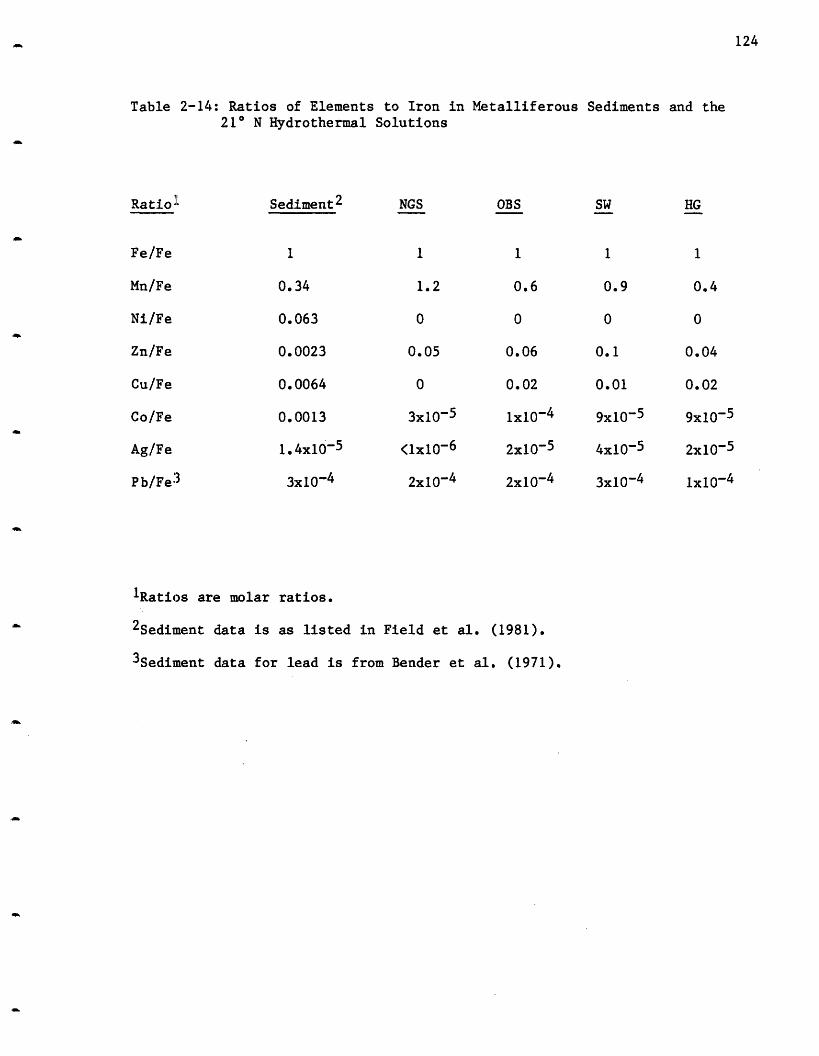
124
Table 2-14: Ratios of Elements to Iron in Metalliferous Sediments and the210 N Hydrothermal Solutions
Ratio ]1 Sediment2
Fe/Fe
Mn/Fe
Ni/Fe
Zn/Fe
Cu/Fe
Co/Fe
Ag/Fe
Pb/Fe3
1
0.34
0.063
0.0023
0.0064
0.0013
1.4x10⁻⁵
3x10⁻⁴
NGS
1
1.2
0
0.05
0
3x10⁻⁵
<lx10-6
2x10⁻⁴
OBS
1
0.6
0
0.06
0.02
1x10⁻⁴
2x10⁻⁵
2x10⁻⁴
SW
1
0.9
0
0.1
0.01
9x10⁻⁵
4x10⁻⁵
3x10⁻⁴
HG
1
0.4
0
0.04
0.02
9x10⁻⁵
2x10⁻⁵
1x10⁻⁴
lRatios are molar ratios.
2 Sediment data is as listed in Field et al. (1981).
3Sediinent data for lead is from Bender et al. (1971).

125
implying two possible mechanisms. In the first case additional iron is
added to these sediments after they leave the vents. In the second case,
additional amounts of the element of interest are scavenged onto the Fe-Mn
precipitates after they leave the vents. Nickel has an insignificant
hydrothermaL source and therefore must be completely hydrogenous. The
Pb/Fe ratio is very similar in the sediments and in the solutions. For Mn,
Zn, Cu and Ag the ratio in the hydrothermal solutions is greater than or
equal to the ratio in the sediments. A hydrothermal source may be the
major input of these elements to these sediments. A proportion of these
elements may be lost to seawater or additional iron may be gained. Many of
the elemental ratios in the metalliferous sediments are close to those in
the hydrothermal solutions at 210 N. Besides being due to losses or gain
occurring in the water column, the sedimentary variations may reflect
differing hydrothermal inputs.
2.11 Summary - Chapter 2
The solution chemistry at 210 N varies between the tour vent areas.
These variations cannot be explained by a simple model incorporating "age",
pathlength, residence time and temperature. The system has a low
water/rock ratio (-1) and hydration reactions appear to e active. The
hydrothermal circulation results in a net loss of sulfur. Only reduced
sulfur is present in the exit solutions and this sulfur is a mix of reduced
seawater sulfate and basaltic sulfur. The SiO2 contents of the solutions
imply depths of reaction ranging from 0.5 kms into the asalt at MTG to 3.5
kms al: NGS. The NGS vent solutions appear to be cooling conductively
before they reach the seafloor. The vent chemistry except for silica (and
pyrite at NGS) does not appear to be solubility control d.
The chemistry of the solutions is in good agreement with that of the

126
chimneys, ophiolite deposits, the alteration observed in seafloor basalts
and where comparable the experimental work on seawater-basalt reactions.
The solution chemistry also suggests that Ni in metalliferous sediments is
from a hydrogenous source while most of the other metal enrichments could
be explained by a hydrothermal source.
127
CHAPTER 3
Guaymas Basin - Results and Discussion
This chapter is a presentation and discussion of the chemistry of the
GuaymaLs Basin hydrothermal solutions. A model will be presented to explain
the solution composition. Results of thermodynamical modelling of the
solutions will also be presented. The observed chemistry will be compared
to that of related phenomenon such as ore deposits and the pore water
chemistry found in DSDP Holes 477 and 477A which were drilled in the
Guaymas Basin.
3.1 Sample Setting
The East Pacific Rise continues northward into the Gulf of California
where it is covered by sediment and forms a series of basins. The Guaymas
Basin appears to be the most hydrothermally active at the present time
based on 3He in the basin waters (Lupton, 1979) and heat flow (Lawver and
Williams, 1979). The Guaymas Basin is separated into a northern and
southern trough by a transform fault (Figure 3-1). All of the vents
sampled occur in the southern trough of the basin. Bad weather precluded
diving on the northern trough as planned. Lonsdale et al. (1980) had
collected hydrothermal deposits there on a previous Seacliff dive and
Williams et al. (1979) had also measured elevated heat flow in the northern
trough - although not as high as they observed in the southern trough. Ten
vents were sampled over approximately 8 km (Figure 3-2), lying between
27°00' and 27003' N latitude and 111022' and 111025' W longitude. All but
one of the sampled hydrothermal areas lies in the deepest part of the
basin; the vents sampled on dive 1175 lie on the inward facing faults on
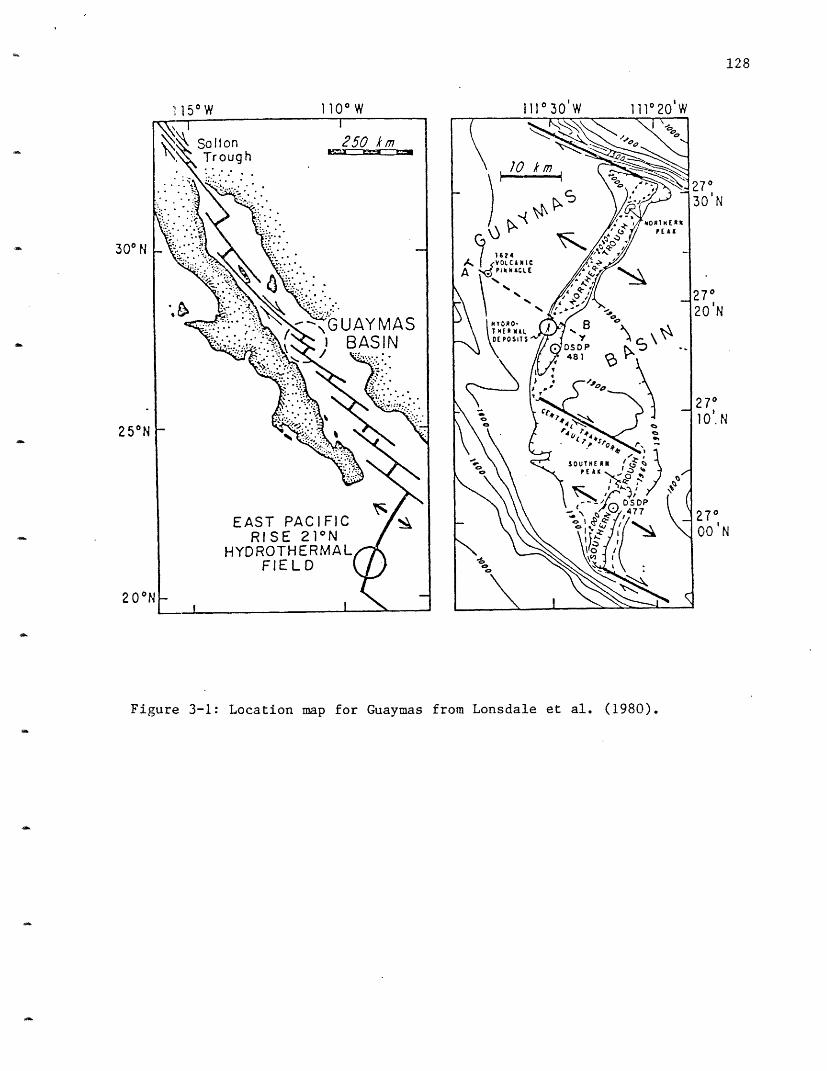
30 N
25"N
200°
',1 15 W 1100 W 111°30 W 111°20'W
Figure 3-1: Location map for Guaymas from Lonsdale et al.
128
27030'N
27°
20'N
27010'. N
270
0 'N
(1980).
129
Figure 3-2: Dive and vent locations at Guaymas. From Simoneit and Kawka
(1983). DSDP sites 477 and 477A are also noted. >; denotesfault traces and ~ denotes hills. Dive 1177 visited the
same hydrothermal sites as dive 1171 but is not labelled due tolack of space on the figure. No water samples were taken on
dives 1170, 1171 or 1174.
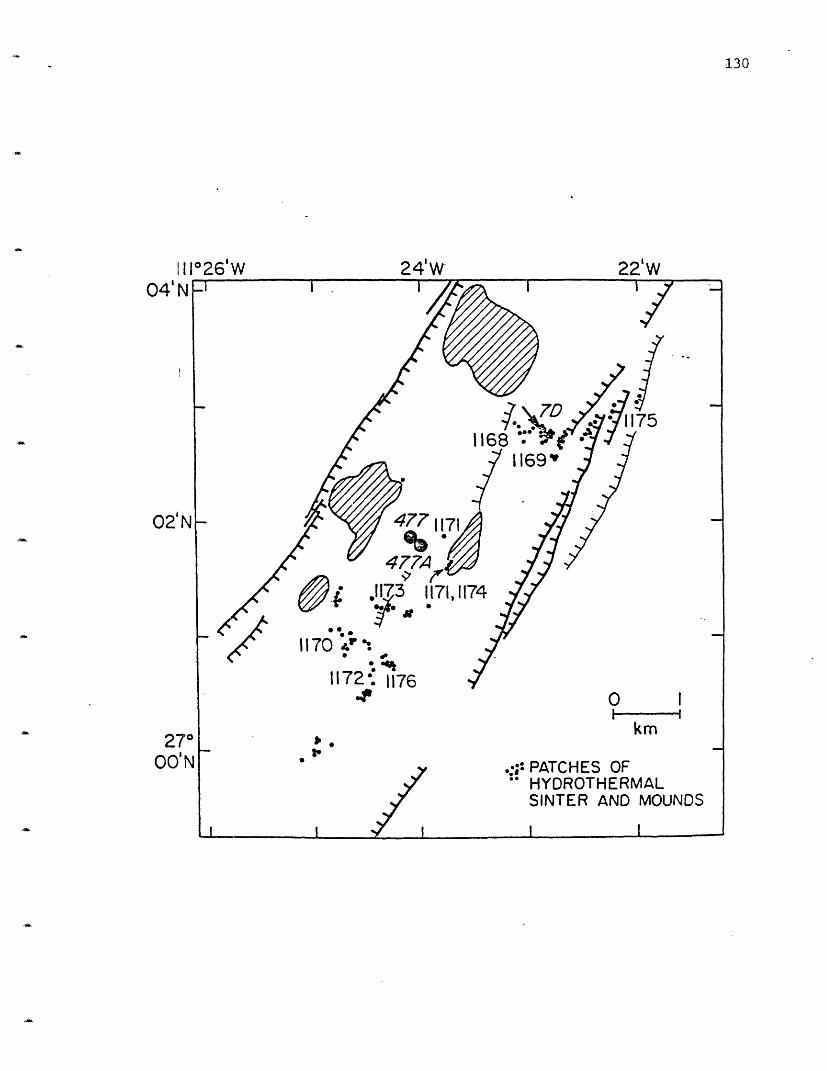
130
111026'W 24'W 22'W04'N
02'N
27'00'N

131
the eastern edge of the basin.
The unique aspect of the Guaymas hydrothermal system is that the
solutions must pass through approximately 0.5 km (Lawver et al., 1975) of
sediment before they exit on the seafloor. Since a wedge of sediment fills
the basin, the solutions from the dive 1175 site, lying off on the flank
probably pass through less sediment than the other areas. Most of the
solutions exit from large constructional features on the seafloor but some
exit from holes in the sediment. As seen on figure 3-2, dives 1171 and
1177 are extremely close to DSDP holes 477 and 477A.
The sedimentation at Guaymas is extremely rapid (>1 m/1000y) (van
Andel, 1964; Calvert, 1966) due mainly to the high productivity of the
overlying waters. Kastner (1982) gives the sediment composition as
follows:
30-50 % diatoms, with some radiolarians and silicoflagellates
30-45 % detrital clay minerals
10-15 % calcareous nannofossils with some foraminifers
4-15 % feldspars
3-10 % quartz
1-2 % heavy minerals.
The sediments also contain 2-4 % organic carbon (van Andel, 1964).
3.2 Solution Chemistry
As at 210 N the solution chemisty is due to the reaction of seawater
with basalt at elevated temperatures. These reactions may or may not have
reached equilibrium (see section 2.2). The solution chemistry at Guaymas
is complicated by additional reactions occurring between the basalt-derived
hydrothermal solutions and the sediments, which may not have reached
equilibrium. The solutions can be described simplistically as:

132
x seawater + y basalt + [hydrothermal] + [alteration] + ...+ [solution ]i [products ]i +
+ [hydrothermal] + [alteration]+ [solution ]n [products ]n
a [hydrothermal] + b sediments + [hydrothermal] + [altered I +[solution ]n + [solution ]m [sediment]m +
+ [hydrothermal] + [altered + [solution ]0 [sediment].
The hydrothermal solutions at Guaymas are therefore the results of two sets
of reactions.
The possibility exists that the solutions at Guaymas could be due to
reactions occurring only in the sediment, with the heat being added
conductively from basaltic sills intruded at greater depth in the sediment
column:
a seawater + b sediment + [hydrothermal] + [altered ] +
+ [solution Ii [sediment]i
+ [hydrothermal] + [altered ]
+ [solution ]f [sediment]f.
Kastner (1982) found that some of the hydrothermal systems seen in the pore
waters and altered sediments from DSDP Leg 64 Sites 477 and 477A which were
drilled in the Guaymas Basin are from sill driven systems and do not
represent reaction with the "basement" basalt. The chemistry of the
hydrothermal solutions reported here appear to be from reaction with the
basement based on: (1.) the pressure (depth) of reaction inferred from the
silica content of the solutions, (2.) the high reduced sulfur content of
the solutions, (3.) the apparent complete absence of Mg and S04 from
solution, (4.) the high 3He content of the solutions (Lupton, unpublished
data), (5.) the high temperatures of the solutions.
Kastner (1982) has found the water/rock ratio in this system to be
2-3:1 based on the oxygen isotopes in coexisting mineral phases and pore

133
solutions. A water/rock ratio based principally on the alkali content of
the solutions cannot be calculated as was done for 210 N due to the
addition of these elements from the sediment column (discussed below). The
oxygen isotopic data which could provide information on the water/rock
ratio are not yet available for these solutions.
A model is developed in which the solution chemistry at Guaymas is
treated as a 21 N solution chemistry which is altered by further reaction
in the sediment column. Various overprinting reactions are postulated for
the observed chemistries. A distinct advantage to the Guaymas system is
that we have direct information on what is occurring at depth. DSDP Holes
477 and 477A are located within meters of several of the vents (Figure 3-2)
and drilled approximately half way through the sediment column. The
proposed alteration reactions with their predicted mineral products can
therefore be tested against the observed mineral assemblage.
A limitation to this model is that the solution chemistry as it exits
from the basalt is assumed to be the same as that observed at 210 N. The
maximum temperatures observed at the two sites (3550 C at 210 N and 315 C
at Guaymas) are similar and therefore what is leached from the basalts
should not be different due to temperature effects. The metals Fe, Mn, Cu,
Zn etc. can be leached from the rock at temperatures of 300 C and it is
unlikely that their extraction efficiencies vary very much for a 40 C
temperature difference in the 300-400° C range. If the solutions react
with the sediment during the downward limb of the convection cell this may
affect the reactions which occur in the basalt. For example, if much of
the Mg is lost in reaction in the sediment cover it may lower the acidity
of the solutions reacting with the basalt, resulting in a smaller degree of
reaction than is observed at 210 N. Alternatively, the overlying sediment

134
cover may make it more difficult for the solutions to exit from the basalt,
increasing their residence time in the rock and thereby increasing the
extent of reaction. This may explain the 3He data. The observed 3He/heat
ratio at 210 N and GSC is the same (Jenkins et al., 1978; Welhan and Craig,
1983). This may be merely fortuitous or may be due to the mechanisms
responsible for extracting He from the rock. The ratio at Guaymas is lower
than that observed at 21 N (Lupton, personal communication). A possible
explanation for this is that the solutions extract He and heat from the
rock at Guaymas in the same ratio as at 210 N and GSC but then "sit" in the
rock because they cannot escape. The solutions may continue to heat
conductively due to this but have no source from which to gain additional
He. A mechanism such as this could alter the 3He/heat ratio. If
sedimentary derived hydrothermal solutions (with no 3He) are mixed with the
basaltic ones, they could dilute the 3He signal from the basalt and lower
this ratio. The 21° N solutions are very similar to those at GSC, except
for the sulfide or sulfate forming elements. Preliminary results from 13°
N show these solutions to have a slightly different chemistry (Michard et
al., 1982). We cannot sample the Guaymas solutions after their reaction
with basalt but prior to that with the sediment and the DSDP holes did not
reach basement. As the 210 N results are the only ones currently available
for "simple" high temperature solutions (versus GSC where subsurface mixing
with cold seawater and precipitation occurs) we assume that the Guaymas
solutions have the 210 N solution chemistry prior to their reaction with
the sediments. As ranges exist in the vent compositions at both these
sites, the differences between them is taken as a range. Although evidence
exists that there may be differences in water/rock ratios between these two
areas (Kastner, 1982), this will not be taken into account in the following
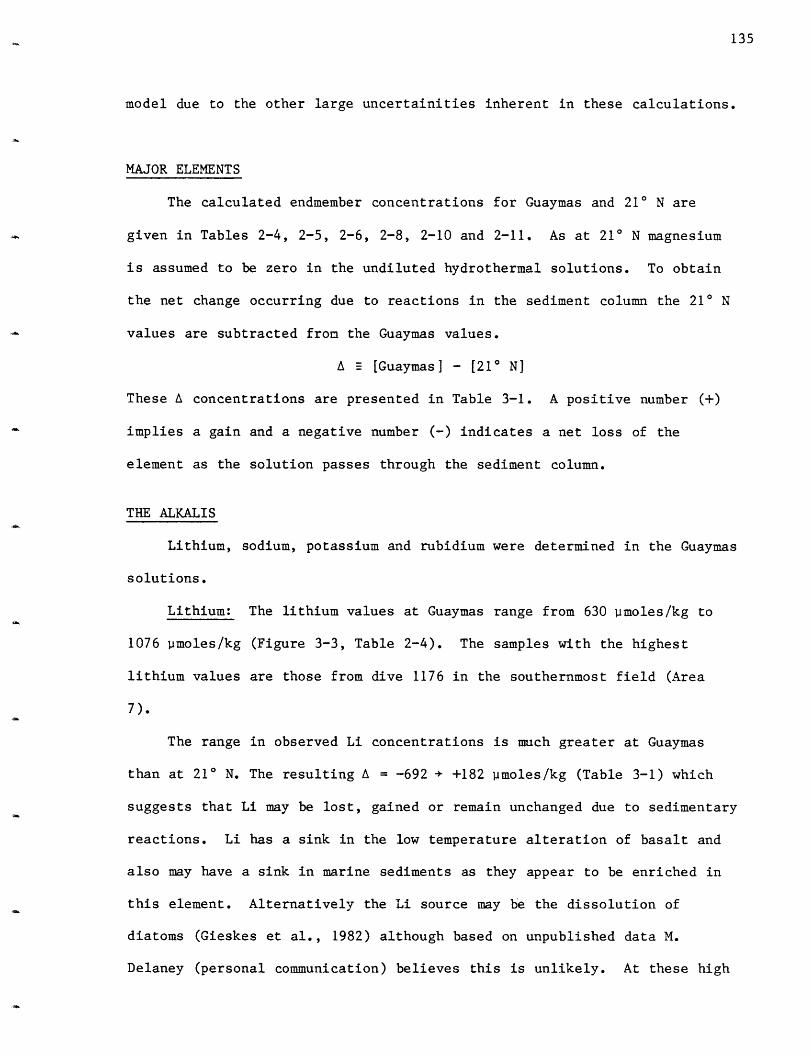
135
model due to the other large uncertainities inherent in these calculations.
MAJOR ELEMENTS
The calculated endmember concentrations for Guaymas and 21° N are
given in Tables 2-4, 2-5, 2-6, 2-8, 2-10 and 2-11. As at 21° N magnesium
is assumed to be zero in the undiluted hydrothermal solutions. To obtain
the net change occurring due to reactions in the sediment column the 21 N
values are subtracted from the Guaymas values.
A [Guaymas] - [21 N]
These A concentrations are presented in Table 3-1. A positive number (+)
implies a gain and a negative number (-) indicates a net loss of the
element as the solution passes through the sediment column.
THE ALKALIS
Lithium, sodium, potassium and rubidium were determined in the Guaymas
solutions.
Lithium: The lithium values at Guaymas range from 630 moles/kg to
1076 moles/kg (Figure 3-3, Table 2-4). The samples with the highest
lithium values are those from dive 1176 in the southernmost field (Area
7).
The range in observed Li concentrations is much greater at Guaymas
than at 210 N. The resulting A = -692 + +182 moles/kg (Table 3-1) which
suggests that Li may be lost, gained or remain unchanged due to sedimentary
reactions. Li has a sink in the low temperature alteration of basalt and
also may have a sink in marine sediments as they appear to be enriched in
this element. Alternatively the Li source may be the dissolution of
diatoms (Gieskes et al., 1982) although based on unpublished data M.
Delaney (personal communication) believes this is unlikely. At these high
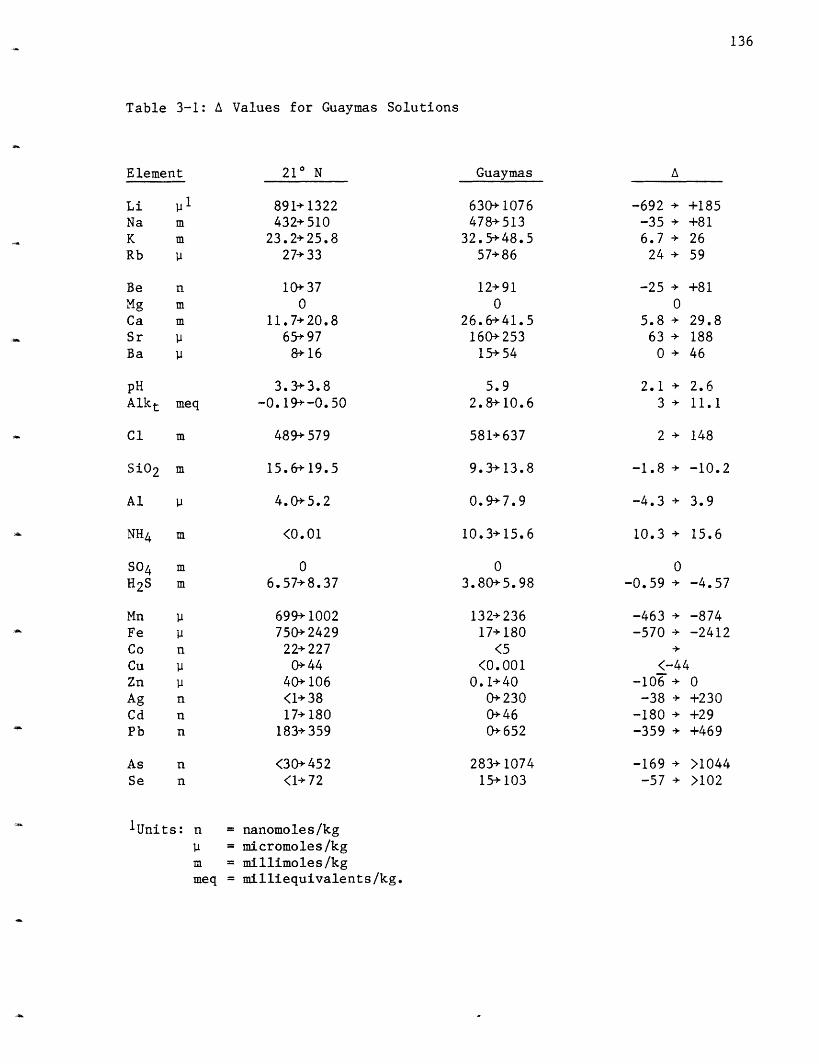
136
Table 3-1: A Values for Guaymas Solutions
Element 210 N Guaymas A
891+ 1322
432+ 510
23.2+ 25. 827+ 33
10+370
11. 7+ 20.8
65+ 97
8+16
3.3+3.8-0.19+-0.50
489+ 579
15.6+ 19.5
630+1076478+ 513
32.5+ 48.557+ 86
12+ 91
0
26.6+41.5160+ 253
15+54
5.9
2.8+10.6
581+ 637
9.3+ 13.8
-692 +-35 +6.7 +24 +
-25 +0
5.8 +63 +0+
+185+81
26
59
+81
29.8188
46
2.1 + 2.6
3 + 11.1
2 + 148
-1.8 + -10.2
0. 9+7.9
10.3+ 15.6
0
3. 80+ 5. 98
-4.3 + 3.9
10.3 + 15.6
0
-0.59 +
132+ 236
17+ 180
<5
<0.00 1
0.1+400+2300+460+652
283+ 1074
15+103
-463 + -570 + <-44
-106 +-38 + -180 +-359 + -169 + >1044-57 + >102
n = nanomoles/kg'P = micromoles/kg
m = millimoles/kgmeq = milliequivalents/kg.
Li IINa mK mRb V
BeMgCaSrBa
nmm
pH
Alkt meq
C1 m
SiO2 m
Al P
NH4
SO4H2S
m
m
m
Mn P
Fe 1
Co n
Cu PZn 1i
Ag nCd nPb n
4.0+5.2
<0.01
0
6.57+8.37
699+ 1002
750+242922+ 227
0+4440+ 106
<1+ 38
17+ 180
183+ 359
<30+ 452
<1+ 72
AsSe
nn
-4.57
-874-2412
0
+230+29
+469
1Units:

1200
1000
c)(-.0E
_1
800
600
400
200
0 5 18 15 20 25 30 35 40 45 50
Mg mmoles/kg
Figure 3-3: Lithium versus magnesium at Guaymas. The plot symbolsdistinguish the areas sampled and are as follows for this andall subsequent Guaymas data plots:
O = Area
4
= Area= Area= Area= Area= Area= Area= Area= Area= Area
1: Dive
Dive2: Dive
3: Dive
4: Dive
5: Dive
6: Dive
7: Dive
8: Dive
9: Dive
10: Dive
1172,1176,1173,1175,1177,1173,1173,1176,1169,1177,1168,
bottlesbottlesbottlesbottlesbottlesbottlesbottlesbottlesbottlesbottlesbottles
1, 2, 7, 10
3, 5, 7, 14
3, 5, 6, 14
5, 9, 15, 16
5, 6, 11, 13
11, 13
12, 16
6, 10, 11, 1312, 16
9, 15
11, 13.
137
- l
+
+ A
e I t * I .. .. L I, *
55
138
temperatures the Li may be leached from the clays and into solution, and
the high NH4+ in the solutions may be exchanging for it. Thus potential
sources and sinks exist that can explain the observed Li concentration
although their relative importance cannot be assessed.
Sodium: Unlike 210 N sodium increases in all the vent fields at
Guaymas (Table 2-4). Again, the analytical precision is not sufficient to
distinguish between vent fields (Figure 3-4a) but when sodium is
calculated from the difference in charge balance among the other major
species a more detailed picture emerges (Figure 3-4b). The endmember
sodium ranges from 475 mmoles/kg to 513 mmoles/kg, an increase of 3-11%
above the ambient value of 463 mmoles/kg. The samples from dive 1175 (Area
3) have the highest sodium concentration.
Sodium shows a loss and gain (A -35 + +81 mmoles/kg) with respect to
the 21 N data. This is because the data for 210 N show both an increase
and a decrease. The Na (and C1) story is complicated by hydration
reactions which are assumed to occur in both areas. The Na and C1 data
should not be treated by the A method with respect to 210 N but should be
analyzed with respect to each other at Guaymas. Na at Guaymas shows only a
net increase with respect to the seawater composition. A discussion of
whether only hydration is active will be deferred until after the C1 data
are presented.
Potassium: The potassium concentrations at Guaymas are the highest
yet observed in submarine hot springs; this is most likely due to the hot
waters leaching additional potassium out of the sediments. The values
range from 32.5 mmoles/kg in the 100 C samples from dive 1177 (Area 9) to
49.2 mmoles/kg in the dive 1176 samples (Area 3) (Figure 3-5, Table 2-4).
As potassium is always present at higher concentration levels in the

510
580
490
480
470
490
480
470
460
0 5 10 15 20 25 30 35 40 45 50 55
Mg mmoles/kg
8 5 18 15 28 25 30 35 48 45 50 55
Mg mmoles/kgFigure 3-4: Sodium versus magnesium at Guaymas.
a. measured sodium.b. sodium calculated from the charge balance.
139
0)
li,a)
0EE
+
+o ++.
o
A, Ao + 4
A + 4
I o
.. . . , .. . . . .,
z
450
440
510
580
0)
oa)
0E
Z<3
A

140
45
40
5), 35
a 30
0E 25
E 20
15
10
0 5 18 15 20 25 30 35 40 45 50 55
Mg mmoles/kg
Potassium versus magnesium at Guaymas.Figure 3-5:

141
Guaymas solutions than the 21 N solutions it has a positive A (+6.7 +
+26.0 mmoles/kg) (Table 3-1). Hence K appears to be added from the
sediment cover. Its source is presumably detrital clays and it may be
released by a NH4+ for K+ exchange. In her work on the solid material from
the DSDP cores at Sites 477 and 477A Kastner (1982) found hydrothermal
K-feldspar which indicates more K may be mobilized than we see in the
solutions and that a sink may also be active.
Rubidium: As for potassium the rubidium concentrations observed at
Guaymas are higher than at either 21° N or GSC (Table 2-4). The values
range from a low of 57 moles/kg in the samples from dive 1175 and the 1000
C samples from dive 1177 (Areas 3 and 9) to 86 moles/kg in the dive 1176
samples (Area 7) (Figure 3-6, Table 2-4). As rubidium is always higher in
the Guaymas solutions than those at 210 N the A = +24 + +59 jimoles/kg
(Table 3-1). This addition is presumably due to reactions occurring with
the clay fraction of the sediment such as an NH4+ exchange for rubidium as
was also suggested for K.
The Li/K ratio observed in the Guaymas solutions is further evidence
for the K being sediment derived rather than basalt derived. The Li/K
ratio in the Guaymas solutions (0.02) is distinctly different from that in
the basalts (0.05) or the 210 N solutions (0.04-0.06) and is closer to the
value seen for marine sediments (0.01) (Heier and Adams, 1964). All of
the Guaymas solutions are similar in this respect as is shown in Figure
2-6.
THE ALKALINE EARTHS
The elements beryllium, magnesium, calcium, strontium and barium were
determined and as at 21 N they show a wide diversity of behavior.
Beryllium: The range in beryllium at Guaymas includes that found at
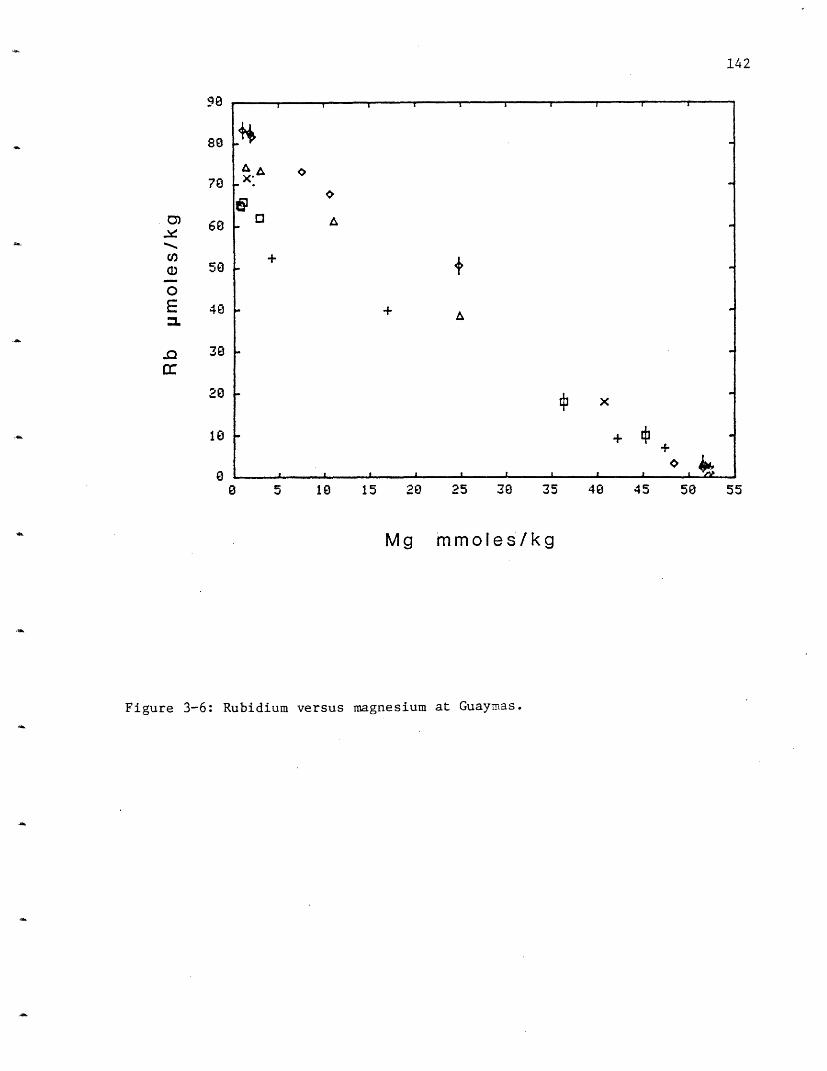
142
0)
I-(
Q
E
.0cc
Wu
78
60
50
20
10
00 5 10 15 20 25 30 35 40 45 50 55
Mg mmoles/kg
Figure 3-6: Rubidium versus magnesium at Guaymas.
+4xA.. °
+ +
+
I 0 ..... . .~~ I
an
30
143
21 N and extends to much higher values; up to 91 moles/kg (Figure 3-7,
Table 2-5). The highest values are from the lowest temperature (100 C)
vent on dive 1177 (Area 9). Be shows both a net increase and decrease
after the sedimentary reactions (A = -25 + +81 mmoles/kg). As mentioned
above the largest increase occurs in Area 9 where the water has apparently
conductively cooled (based on silica - section 3.4) due to a long residence
time in the sediments. This long contact time with the sediments is
responsible for the large increase in solution. Too little is known about
the geochemical cycle of Be to identify sources and sinks.
Magnesium: Magnesium decreases in all fields and as mentioned in
Chapter 2 it is assumed to be zero in the hydrothermal solutions. This is
the basis on which the endmember compositions for all the elements are
calculated. Mg concentrations as low as 0.60 mmoles/kg were measured in
some of the Guaymas solutions, therefore this assumption is assumed to be
valid for all the vent areas. The poor sampling at some of the vents
precludes this hypothesis from being proven at the present time. The
Mg/SO 4 ratio is close to the seawater value and the amount of these two
ions present is assumed to be a sampling artifact. The extremely low
measured magnesium implies that the solutions have not mixed with unreacted
seawater in the sediment column. (As mentioned earlier the solutions must
have a source in the basalt, not just in the sediment.) As no Mg is seen in
the hydrothermal solutions, if any fraction of these solutions is sediment
derived, there must be an active Mg sink in the sediments. This would be
chlorite which has been observed in the sediments (Kastner, 1982).
Calcium: Calcium increases in all the vent areas at Guaymas from 26.6
mmoles/kg to 41.5 mmoles/kg (Figure 3-8, Table 2-5). The highest
concentration is found in the samples from dive 1175 (Area 3) while the

144
90
70
c,
co
E
680
50
40
a)m
20
10
00 5 10 15 20 25 30 35 40 45 50 55
Mg mmoles/kg
Figure 3-7: Beryllium versus magnesium at Guaymas.
I ' I I l ' I I I I I
x
+
4.t ~ +
Ah~A xIv IA XI+
+I. . .I I I , .
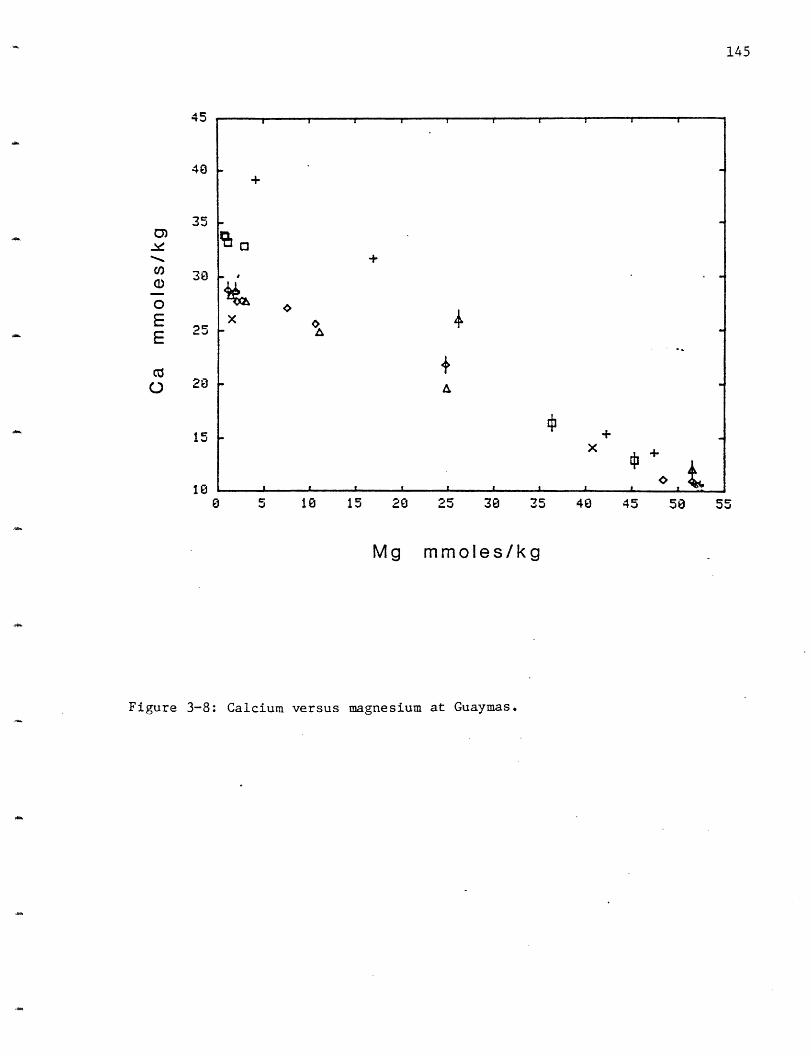
145
40
35
U) 30a)0
E 25
0 28
15
180 5 1 0 15 20 25 30 35 40 45 50 55
Mg mmoles/kg
Figure 3-8: Calcium versus magnesium at Guaymas.
A
x +
I I I , I I , , ,
,,:1 -
i
i
I
I
i
I

146
lowest is from some of the dive 1173 samples (Area 6). Calcium is greatly
enriched in the Guaymas solutions compared to those at 21 N (A = +6 +
+30.5 mmoles/kg). The net input from the sediments may be smaller than
this A implies as the Ca values in the 210 N solutions are lower than those
observed in the GSC (Edmond et al., 1979a) and 13 N solutions (Michard et
al., 1982). Calcium has two potential sources in the sediment: from
dissolution of CaCO3 tests and conversion of anorthite (Ca-plagioclase) to
albite. If Ca is from the dissolution of CaC03 there should be an
attendant increase in the alkalinity. As there are other sources for the
alkalinity (see discussion for that species) and Ca sinks may be active in
the sediment column it is not possible to make a stoichiometric balance for
these species. The sediment is up to 15% CaCO3 (Kastner, 1982) therefore a
source is available. Epidote, anhydrite, gypsum and sphene are all
possible sinks for calcium from the solutions which have been identified in
the Guaymas drill cores.
Solubility calculations (Bowers, Von Damm and Edmond, 1983) have shown
that the calcium concentrations in the Guaymas solutions may be solubility
controlled. Areas 1, 2, 3, 5 and 7 are saturated with respect to calcite
and aragonite (CaC03), wollastonite (CaSiO3), andradite (Ca3Fe2Si3012), and
hedenbergite (CaFe(SiO3)2). Areas 4 and 7 are saturated with respect to
all of the above phases except for hedenbergite and Area 6 with all except
wollastonite. Areas 3 and 6 are also supersaturated with respect to
Ca-nontronite (Ca.16 5Fe 2(A1.3 3Si3 .6 70 10)(OH)2). The solutions in Area 9
are not saturated with respect to the above minerals (except the CaCO3
ones) but are saturated with respect to other calcium silicates. Most of
these phases have not been identified in the drill cores. This may be due
to several reasons: (1.) due to kinetic reasons they may not actually form,

147
(2.) they may have formed deeper in the section than was drilled, (3.) they
may have formed in such small quantities that the cannot be identified.
The solubility programs do not treat solid solutions. The saturation of
several Ca-silicate minerals suggests that calcium is solubility
controlled, however due to the presence of solid solutions in nature,
phases not considered here may be the ones actually forming.
Strontium: Strontium increases by a factor of 2-3 over the ambient
seawater value in all the Guaymas solutions. The strontium concentration
ranges from 160 moles/kg in the 100 C samples of dive 1177 (Area 9) to
253 moles/kg in the dive 1175 samples (Area 3) (Figure 3-9, Table 2-5).
Strontium, like Ca, displays only an increase in the Guaymas solutions
with respect to the 210 N solutions (A = +63 + +188 moles/kg). Strontium
may have two sources in the sediment: CaCO3 tests or clays. Two lines of
evidence support the hypothesis that some of the Sr comes from the clay.
Gieskes et al. (1982) found a depletion in the Sr content of the solids
with depth. Sr is the first element examined which has an isotopic
signature which is distinct in the basalt from the sediments. Basalt is
0.703 while the hydrothermal solutions are ~0.705 (T. Trull, unpublished
data), indicating that either the solutions have not completely exchanged
with the basalt or a more radiogenic source of Sr is added to the solutions
from the sediments. Sr has essentially the same sinks as Ca and may be
incorporated into the epidote, etc. found in the sediments.
Barium: Barium increases in all the vent fields. The barium in the
samples is controlled by barite solubility which is approximately 4.4
Umoles/kg in distilled water at 300 C and 500 bars (Blount, 1977). Some
seawater and hence some sulfate is entrained during sampling and in fact
the constructional chimneys are probably leaky as well. The highest barium

148
own If _
240
220
200
m 180
oE 16
.. 140C)
120
100
pin
a 5 10 15 20 25 30 35 40 45 50 55
Mg mmoles/kg
Figure 3-9: Strontium versus magnesium at Guaymas.
+
- +
A- A
x +X +I
t { , ! ! _ , ! i J
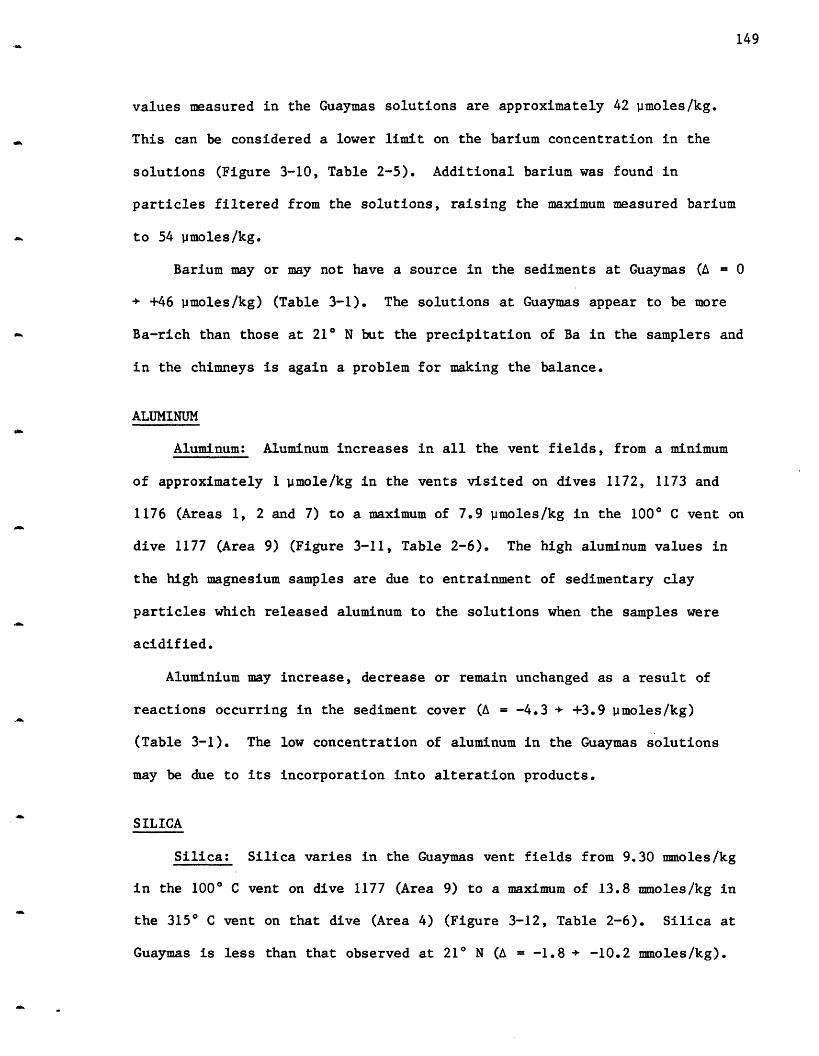
149
values measured in the Guaymas solutions are approximately 42 moles/kg.
This can be considered a lower limit on the barium concentration in the
solutions (Figure 3-10, Table 2-5). Additional barium was found in
particles filtered from the solutions, raising the maximum measured barium
to 54 moles/kg.
Barium may or may not have a source in the sediments at Guaymas (A = 0
+ +46 moles/kg) (Table 3-1). The solutions at Guaymas appear to be more
Ba-rich than those at 210 N but the precipitation of Ba in the samplers and
in the chimneys is again a problem for making the balance.
ALUMINUM
Aluminum: Aluminum increases in all the vent fields, from a minimum
of approximately 1 mole/kg in the vents visited on dives 1172, 1173 and
1176 (Areas 1, 2 and 7) to a maximum of 7.9 moles/kg in the 100 C vent on
dive 1177 (Area 9) (Figure 3-11, Table 2-6). The high aluminum values in
the high magnesium samples are due to entrainment of sedimentary clay
particles which released aluminum to the solutions when the samples were
acidified.
Aluminium may increase, decrease or remain unchanged as a result of
reactions occurring in the sediment cover (A = -4.3 + +3.9 moles/kg)
(Table 3-1). The low concentration of aluminum in the Guaymas solutions
may be due to its incorporation into alteration products.
SILICA
Silica: Silica varies in the Guaymas vent fields from 9.30 mmoles/kg
in the 100 C vent on dive 1177 (Area 9) to a maximum of 13.8 mmoles/kg in
the 315 C vent on that dive (Area 4) (Figure 3-12, Table 2-6). Silica at
Guaymas is less than that observed at 210 N ( = -1.8 + -10.2 mmoles/kg).

150
45
40
-35
C)
0E
25
20
15
10
0 5 10 15 28 25 30 35 40 45 50 55
Mg mmoles/kg
Figure 3-10: Barium versus magnesium at Guaymas.
r0
I;
..
i+- hi + +
I I 4 XI. I.+ t +o 4

14
12
10
8
6
4
2
0
0 5 19 15 20 25 30 35 40 45 50 55
Mg mmoles/kg
Figure 3-11: Aluminum versus magnesium at Guaymas.
151
u0a)
0E=L
A +
.^~bL +
152
12
19O~ 10
U,
a, 80EE bE !
CO
2AT
0 5 10 15 20 25 30 35 40 45 50 55
Mg mmoles/kg
Figure 3-12: Silica versus magnesium at Guaymas.
6o +X oil,
+A
tE . I
1 1 _. _ _ ....
153
The SiO2 content is assumed to be controlled by quartz solubility and the
solubility calculations (Bowers, Von Damm and Edmond, 1983) support this
hypothesis. The lower concentrations at Guaymas than at 210 N are due to a
lower pressure and/or temperature of reaction. Silica is the subject of
section 3.4.
pH
pH: The pH values are from shipboard measurements at approximately
250 C and 1 atmosphere (Figure 3-13, Table 2-6). Within the precision of
the measurement the pH at Guaymas is constant in all the vent fields and is
significantly higher than was observed at 21° N (A = +2.1 + + 2.6) (Table
3-1). The high pH is a result of buffering by the carbonate (and ammonium)
as evidenced by the high alkalinity. Under the in situ conditions the pH
is ~6.5 and the solutions are alkaline, due to the change in the
dissociation constant of water at high pressure and temperature.
CARBON
The solutions at Guaymas are extremely carbon rich as evidenced by the
presence of yellow "oil" globules in samples from dive 1172 (Area 1) and
the strong "diesel" smell of many of the water and rock samples. The
composition of this organic matter is being determined by B. Simoneit
(Simoneit, 1982).
Alkalinity: Alkalinity increases in all the vent areas at Guaymas
(Figure 3-14, Table 2-6) in contrast to the decrease observed at 21 N (A =
3.0 + 11.1 meqs/kg) (Table 3-1). The increase is due to the dissolution of
CaCO3 and thermal degradation and oxidation of organic matter occurring in
the sediment column:
Alkalinity _ [HCO3-] + 2[C032-] + [OH-] -[H+]
CaCO3 = Ca2+ + C032-

154
Q.
6
5
0 5 10 15 20 25 38 35 40 45 50 55
Mg mmoles/kg
pH versus magnesium at Guaymas.
*I &~~ I T4~~ 'I I 'I
o
4i~~~4
. I t . . . . . . .++w a AI I I I I I I
Figure 3-13:
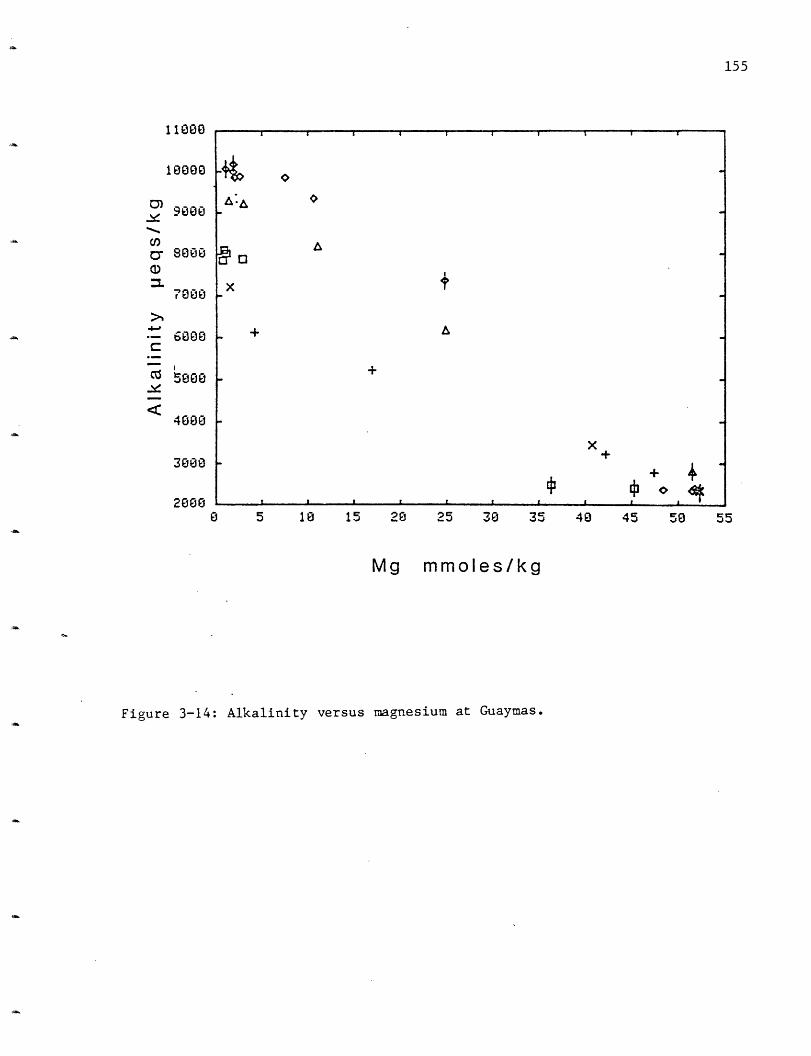
155
11000
4-crm
<
8000
6000
40800
20000 5 10 15 28 25 30 35 40 45 50s 55
Mg mmoles/kg
Figure 3-14: Alkalinity versus magnesium at Guaymas.
a I I I I I I
~IoA: A
- x +
+ A
x
I~ I, I, ~ I,~~ ,I, ,
156
C032- + H+ = HC03 -
HC03 - + H+ = H2C03
NH3 + H+ = NH4+
[C1 0 6H2 6 30 11 0N1 6P1] + 10702 + 14H+ = 106 C02 + 16NH4+ + HP04
2 - + 108H20
(Stumm and Morgan, 1981)
CO2 + H20 = H 2C03
H2C03 = H+ + HC03 -
The highest alkalinity (10.6 meq/kg) is found in the vents visited on dives
1172 and 1176 (Area 1). This high alkalinity buffers the pH to the
relatively high values discussed above.
AMMONIUM
Ammonium: There is a large increase in the ammonium content of the
solutions at Guaymas, to a maximum of 15.6 mmoles/kg in the solutions from
dives 1172 and 1176 (Area 1) (Figure 3-15, Table 2-6). While ammonium is
present in high concentrations at Guaymas only a trace was present in the
210 N solutions (A = +10.3 + +15.6 mmoles/kg) (Table 3-1) . It is a major
species in the Guaymas solutions. NH4+ is produced either by the
incomplete oxidation:
[C10EH263010N16P1] + 10702 + 14H+ = 106 CO2 + 16NH4+ + HP042 - + 108H20
(Stumm and Morgan, 1981);
or the~ thermolytic degradation of organic matter:
[C10E6H2630110ON16P1] + nH+ = 16NH4+ + HP042 - + shorter chain hydrocarbons.
Cooper and Raabe (1982) have found aureoles of NH4+ around a basalt dike
which was intruded into a shale, suggesting that heating of organic rich
sediment is a viable method of NH4+ production. The NH4+ may be responsible
for the large increase in alkalinity through the consumption of protons.
The ionic radius of NH4+ (1.43 A) is similar to that of K (1.33 A) and Rb

e 5 10 15 28 25 30 35 48 45 50 55
Mg mmoles/kg
Ammonium versus magnesium at Guaymas.
157
16
14
12
10
0
4
2
0
',o0EE
IZ
o
Aa
n o·~~~~~~~
L ·
- ---
Figure 3-15:

158
(1.47 A) and it can probably replace both of these alkalis in clays,
resulting in the very high concentrations of these two elements in
solution. Sterne et al. (1982), Cooper and Abedin (1981) and Cooper and
Evans (1983) have found that NH4+ replaces K+ in shales. The NH4+-illites
described by Sterne et al. (1982) are found in a black shale, surrounding a
metal deposit similar to the type believed to be forming at Guaymas.
THE HALOGENS
Chloride: Chloride, like sodium, increases in all the vent areas at
Guaymas from the ambient value of 540 mmoles/kg (Figure 3-16, Table 2-6).
The values range from 582 mmoles/kg to 637 mmoles/kg, or 8-18% above the
seawater value. This is presumably due to hydration. No areas at Guaymas
show a C1 sink relative to seawater values. It cannot be stated with
certainty that no C1 sink is active. If a C1 sink is active (as was
observed at 21° N) then the amount of water loss due to hydration would be
higher. The differences in C1 may be due to differing amounts of hydration
in the various vents or the same amount of hydration at all the vents but
varying amounts going into a C1 sink (as at 210 N). Until the
water isotopic data are available the relative importance of these two
possibilities cannot be determined.
SODIUM versus CHLORIDE
As at 210 N, Na and C1 are the charged species present in the greatest
abundance and additional information can be gained by examining their
relationship to each other (Figure 3-17). Table 3-2 presents the net
changes observed in Na and C1 and the amount of change of Na with respect
to C1, These two species do not behave conservatively and in every case
the gain in Na is not sufficient to balance the gain in C1. As the gain in

5 18 15 20 25 30 35 40 45 58 55
Mg mmoles/kg
Figure 3-16: Chloride versus magnesium t Guaymas.
159
0D
CI,U)C2)
E:
E:
0
640
620
600
580
560
540
520
I i I I i a i
! o0 +
+
x
_ I I I I I ! ! I
_ __
__ __
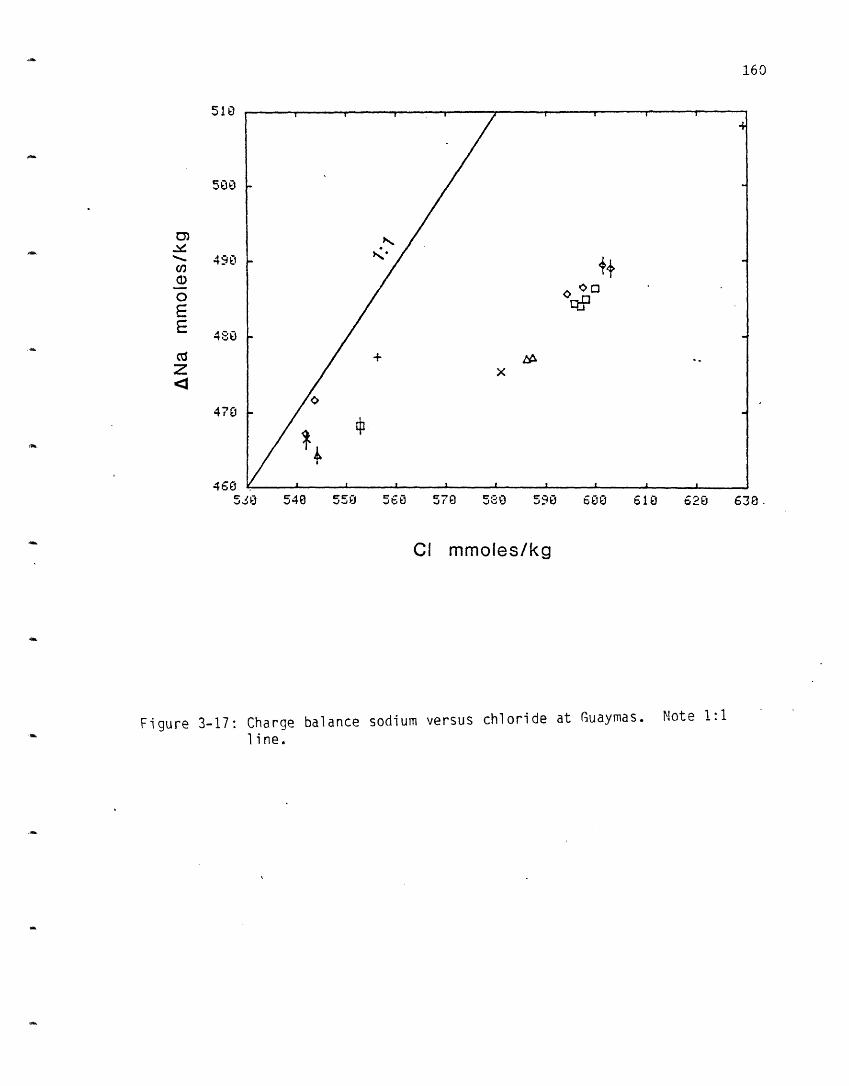
160
5480 50 560 570 5 0 590 600 610 620 630
CI mmoles/kg
Figure 3-17: Charge balance sodium versus chloride at uaymas.line.
510
500
490o-
C
EE
z3470
4605,0
Note 1:1

161
Table 3-2: Sodium versus Chloride - Guaymas
Na ANa C1 AC1 ANa/ACl
AREA:1 489 26 601 61 0.43
2: 478 15 589 49 0.31
3 513 50 637 97 0.52
4 485 22 599 59 0.37
5 488 25 599 59 0.42
6 475 12 582 42 0.29
7 490 27 606 66 0.41
9 480 17 581 41 0.41
L0 - - - -
SEAWATER 463 540
All units are millimoles/kg.
162
C1 is presumably due to hydration this implies a net loss of Na. The
probable sink is albite which is found throughout the DSDP cores.
SULFUR
Sulfate: Sulfate decreases to a measured value of 0.35 mmoles/kg in
Area 4 at Guaymas and, within the analytical uncertainty, appears to go to
zero with magnesium in the endmember (Figure 3-18, Table 2-8).
Hydrogen sulfide: Hydrogen sulfide increases in all the vent areas to
a maximum of 6.0 mmoles/kg in the vent sampled on dive 1176 (Figure 3-19,
Table 2-8). The lowest value observed was 3.8 mmoles/kg on dive 1173. The
hydrogen sulfide at Guaymas is lower than at 210 N and (A = -0.59 + -4.57
mmoles/kg) (Table 3-1) also represents a net loss of sulfur as seawater
passes through the hydrothermal system.
Total Sulfur: As at 210 N, samples were taken in ampoules with
bromine present and total sulfate determined. In four of the six areas the
sum of the sulfate and hydrogen sulfide is 4-29% greater than the sulfate
measured in the ampoule (Table 2-9) and this suggests that any
organo-sulfur or intermediate sulfur species are quantitatively
unimportant. In samples from the two vent areas visited on dive 1173 the
ampoule sulfate is 23-24% greater than the other total. There were some
difficulties in analyzing hydrogen sulfide from that dive shipboard and as
a result those values may be low, causing the sulfur sum to be lower than
that from the ampoule. A second possibility is that some other sulfur
species are quantitatively important in these vent waters. At present
there is no way to distinguish between these two possibilities. A more
detailed discussion of sulfur is presented in section 3.3.

0 5 10 15 20 25 38 35 40 45 58 55
Mg mmoles/kg
Sulfate versus magnesium at Guaymas.
30
163
Co)
-
o
EE
To
o S~"4
+
x
+'AI
o
15
10
0
__ · __ · 1
Figure 3-18:
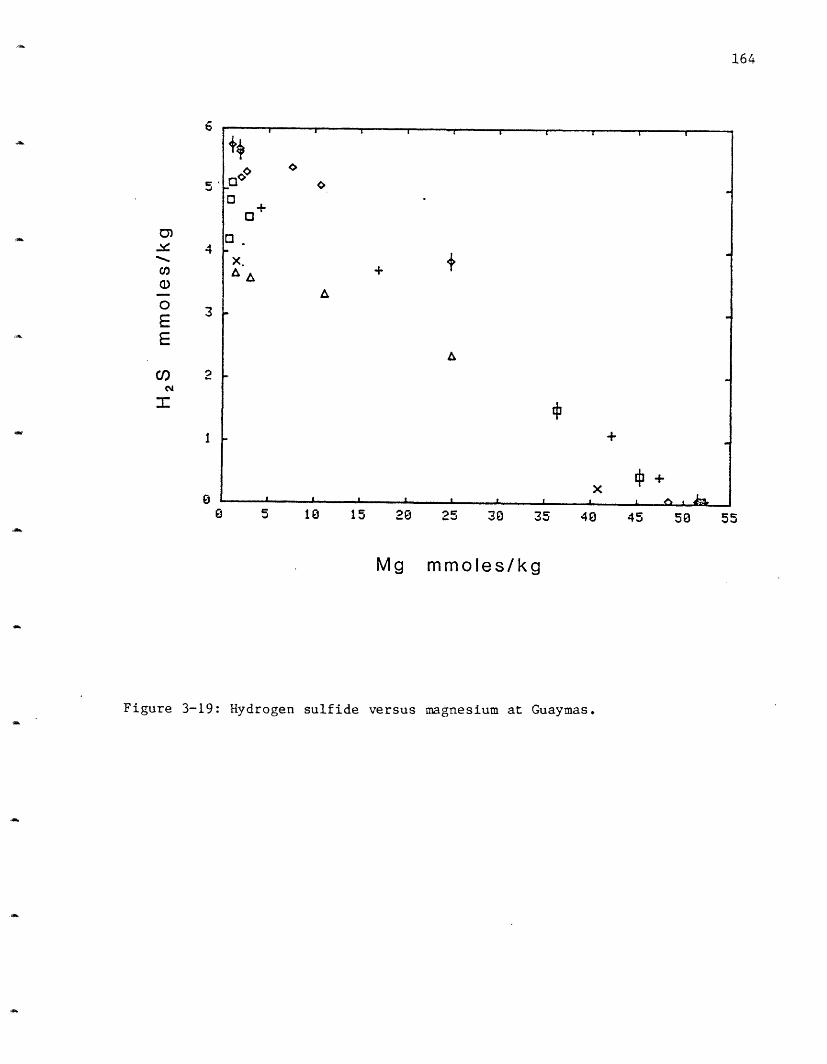
164
0
5'
Cn
a1)g ,
oE 3
E
C) 2
Iin
0 5 10 15 280 25 30 35 40 45 50 55
Mg mmoles/kg
Figure 3-19: Hydrogen sulfide versus magnesium at Guaymas.
I I , - I I
+
,.
x.AL, +
A
A
I
X +I ,I -I I I I i ^ . L

165
TRACE METALS
As at 21° N the metals Mn, Fe, Co, Ni, Cu, Zn, Ag, Cd, Pb and Hg which
from insoluble sulfides and As and Se which can substitute for sulfur were
determined in the Guaymas solutions. Cobalt and nickel were below the
detection limit (5 nmoles/kg and 140 nmoles/kg respectively) in all of the
solutions. Hg, as was also the case at 210 N, was found to be contaminated
in these samples, prohibiting a determination of the endmember.
At 21 N only those samples with Mg <5 mmoles/kg were used to
determine the endmember concentrations of these elements. Precipitation of
sulfides or entrainment of particles during sampling which occurs in the
more ixed samples can cause either deficiencies or enrichments of these
elements. Unfortunately there are too few samples at Guaymas to use only
those samples with Mg <5 mmoles/kg and still determine an endmember for
many of the vent areas. The Guaymas endmembers therefore have a greater
uncertainty than those at 210 N as they are more likely to be affected by
precipitation reactions or by entrainment of sediment, chimney or smoke
particles. The endmembers for Guaymas are determined by fitting a line to
all of the data points for a given vent area, forcing the line through the
seawater value and extrapolating to Mg = 0 mmoles/kg. The extrapolation for
Area 3 is based primarily on one sample.. This area appears to have
considerably higher concentrations for several of the metals. The
possibility that this sample has been contaminated cannot be eliminated
with the present data set. The fact that no other sample appears to be
contaminated suggests that the results for Area 3 are correct, but the
possibility of contamination cannot be ignored.
The major difference which occurs between the 210 N solutions and the
Guaymas solutions are the much lower trace metal concentrations found in

166
the Guaymas solutions. This is presumably due to the high alkalinity and
high pH of the Guaymas solutions which results in reduced metal
solubilities. The metals are postulated to be leached into solution
through reaction with the basalt but are then deposited as the pH and
alkalinity of the solutions rise during their ascent through the sediment
column. Other possible explanations must also be examined. The first of
these is that the solutions are not derived from the basalt but only from
the sediments and thus never acquire the metals. Arguments have already
been presented as to why these solutions must have reacted with the basalt.
Additional evidence comes from the Pb isotopes (Chen et al., 1983) which
show that the solutions are more radiogenic than MORB but not as radiogenic
as would be expected from a purely sedimentary source. Pb is a mix of both
basaltic and sedimentary components. A second argument is that these
solutions were not hot enough to leach metals at the 210 N levels from the
rocks. The temperature difference between these two areas is not very
great (3150 versus 350° C). The experiments have shown that metals can be
leached at 260 C (Seyfried and Bischoff, 1977) and based on the isotopic
evidence Pb is leached from the rock. It is unlikely that due to
temperature effects the solutions never contained these metals. Based on
the low extraction efficiencies from the basalt seen for the metals in the
210 N solutions it is also unlikely that the rocks were too altered to
supply the metals. The preferred explanation for the low metal
concentrations is that they are lost in the sediment column. A discussion
on an element by element basis follows.
Manganese: The Guaymas solutions contain about five times less
manganese than those at 210 N. The range of 128-236 pmoles/kg observed at
Guaymas (Figure 3-20, Table 2-10) is still over a factor of 100 above the
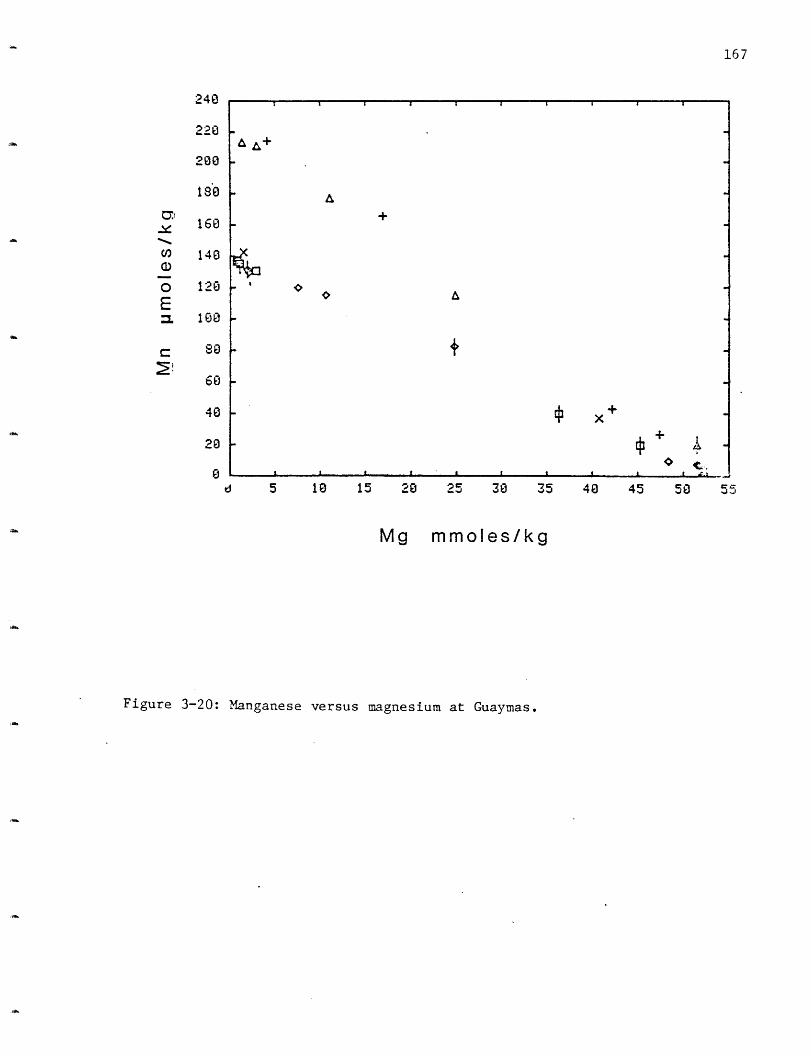
240
220
200
180
160
140
120
100
60
40
20
0d 5 10 15 20 25 38 35 40 45 50 55
Mg mmoles/kg
Figure 3-20: Manganese versus magnesium at Guaymas.
167
C:
V)
EM
I I I I I I i I
A
14-
a ,:+
O h
_ +O i.,
I I . . I I I r I i
_

168
seawater levels. Equilibrium calculations show that all the vent areas
except for 9 at Guaymas are saturated with respect to alabandite (MnS)
(Bowers, Von Damm and Edmond, 1983). The concentration of manganese
therefore appears to be solubility controlled.
Iron: The Guaymas solutions contain about an order of magnitude less
iron than 210 N, ranging from 17-180 moles/kg (Figure 3-21, Table 2-10).
This is still nmch higher than the seawater value of -0.5 nmoles/kg. The
solutions are saturated with respect to pyrite in Areas 1, 3, 5, 6 and 9
and are saturated with respect to pyrrhotite in Areas 3, 6 and 9 (Bowers,
Von Damm and Edmond, 1983). Iron is also a constituent of several of the
calcium silicates (andradite, hedenbergite and Ca-nontronite) which are
saturated in many of the vent areas. Areas 3 and 6 are also saturated or
supersaturated with respect to the iron silicates minnesotaite
(Fe3Si4010(OH)2), ferrosilite (FeSiO3), fayalite (Fe2SiO4), greenalite
(Fe3Si205(OH)4 - Area 6 only) and the iron oxides magnetite and hematite.
The iron concentrations in most of the Guaymas vents therefore appear to be
solubility controlled.
Iron/Manganese: At Guaymas these values are all less than unity, i.e.
the concentration of manganese is always greater than the concentration of
iron (Figure 3-22, Table 2-10). As mentioned above both of these metals
appear to be solubility controlled.
Copper: Vent Area 3 at Guaymas contained 1.1 moles/kg copper and the
only ther samples which contained some copper, about 0.1 moles/kg were
from Aea 4 (Table 2-10). The particles filtered from the solutions in
Area 4 contained additional copper and the total value for this area may be
as high as 6 mole/kg (Table Al-1). Only Area 9 is saturated with respect
to a copper phase.

169
4 rL U
160
140
120
0a) 108
ToLL
20
A
0 5s 10 15 20 25 30 35 40 45 50 55
Mg mmoles/kg
Figure 3-21: Iron versus magnesium at Guaymas.
.. I , , , i I ,- i I i i
+
a + +AP 4
x
I I I, t , t' I t f
-- ~ ~ ~ ~ ~ ~ ~ ~ ~ ~ ~ ~ ~ ~ ~

IUK
160
140
0 120
-o 100E s0
20a) B
0 20 40 60 80 100 120 140 160 180 200 228
Mn ipmoles/kg
Iron versus manganese at Guaymas.
170
· n _
Note 1:1 line.Figure 3-22:

171
Zinc: At Guaymas the zinc concentration ranges from 0.2 (Area 6) to
40 moles/kg (Area 3) (Figure 3-23, Table 2-10). Areas 1, 3, 4, 5 and 9
are saturated with respect to sphalerite and the other three areas,
although undersaturated, are not far from saturation (Bowers, Von Damm and
Edmond, 1983). Zinc in these solutions therefore appears to be solubility
controlled in almost every case.
Silver: Only a few samples at Guaymas contained detectable amounts of
silver giving the following endmember concentrations: Area 1 has 230
nmoles/kg, Area 3 has 24 nmoles/kg and Area 4 has 2 nmoles/kg (Table 2-10).
Cadmium: Again only a few samples at Guaymas contained greater than
the detection limit of 10 nmoles/kg giving an endmember concentration of 46
nmoles/kg for Area 3 and 27 nmoles/kg for Area 4 (Table 2-10).
Lead: The lead values for Guaymas are about the same level (230-304
nmoles/kg) although Area 3 is considerably higher at 652 nmoles/kg (if the
sample is not contaminated) (Table 2-10). The isotopic data do not lie
within the MORB field (Chen et al., 1983), but imply that some lead has
been added from the sediments. Areas 1, 2 and 3 are saturated with respect
to galena (PbS) and Area 4 is close to saturation (Bowers, Von Damm and
Edmond, 1983). These are the only areas at Guaymas in which lead was
detected. Lead in solution is therefore also controlled by mineral
solubility at Guaymas.
Arsenic: The Guaymas vents contain higher concentrations of arsenic
than were found at 210 N; ranging from 283-1074 nmoles/kg (Table 2-11).
These elevated levels suggest that additional arsenic is added to the
solutions from the sediments (A = -169 + >1044 mmoles/kg) (Table 3-1).
Selenium: As for 210 N no selenium was found in the water samples
from 210 N. Se was found in the particle fraction in the 6 areas measured

172
'%
35
30
-' 25
co0 2
20
E
N 1i10
05 10 15 20 25 30 35 40 45 50 55
Mg mmoles/kg
Zinc versus magnesium at Guaymas.
+
+ _
' I I A -- I , i
Figure 3-23:
173
at Guaymas (Table 2-11). Selenium was also measured in the ampoule
subsamples. The measured values ranged from 15 (Area 3) to 103 nmoles/kg
(Area 4), suggesting that the levels are comparable to those found at 21 N
(A = --57 + >102 nmoles/kg) (Table 3-1).
3.3 Sulfur System
Many of the same arguments as were presented for the 210 N system are
valid for Guaymas and will not be presented here again. Sulfur isotopic
data are not yet available for the Guaymas solutions and chimneys, hence
there are fewer constraints on the sulfur system. Bischoff et al. (1981)
found lower H2S values in reactions with seawater and graywacke than are
observed in the Guaymas solutions, suggesting that some, if not all of the
sulfur comes from the basalt or basaltic reduction of seawater S04 with
Fe2+. Most, if not all, of the sulfur in the Guaymas solutions is present
as H2 S (Table 2-5) and the H2S values are significantly lower than those at
210 N (Table 2-4). The difference in H2S between the two areas is balanced
by the loss of Fe, suggesting that an Fe (or other metal) sulfide phase may
be precipitating at depth.
The As concentrations are higher at Guaymas than at 210 N suggesting
either an additional basaltic source (which might imply a higher basaltic
sulfur input or a sedimentary input. Bischoff et al. (1981) found very
high levels of As (8 umoles/kg) to be derived from the graywacke. Arsenic
is enriched in marine sediments compared to basalt (Wedepohl, 1969). Se is
both higher and lower in the Guaymas solutions than those at 210 N. Little
data exists but it suggests that Se is enriched in marine sediments
compared to basalts and that its concentration correlates with that of
organic C (Wedepohl, 1969). The Guaymas sediments contain 2-4% organic
matter. As organic matter always contains some sulfur, it could also have

174
a source in the sediments. SO4 in the seawater pore water could also be
biologically reduced to sulfide and then added to the hydrothermal
solutions. Isotopic data could help to define this source as sulfur
produced by biological reduction is lighter than even the basaltic sulfur.
The source of the sulfur in the Guaymas solutions cannot at present be
identified. The amount present is not incompatible with a purely basaltic
source or a mixed source from basalt, seawater and sedimentary organic
matter.
3.4 Silica Concentration and the Depth of Reaction
A full description of quartz geobarometry and the limitations inherent
in the calculations was given in section 2.4. More uncertainty exists in
the calculations for the Guaymas Basin as the temperature data are not as
good. Due to bad weather with loss of Alvin dives and the reconnaissance
nature of the cruise most vents were visited only once. Therefore the
temperatures were not verified over several days and may be treated as
minimum values as stable readings were not always obtained. As the samples
contained more entrained seawater than those used to calculate the
endmember concentrations at 210 N, greater extrapolations to the endmember
are sometimes involved. For several of the vents, the sampling was so poor
that no endmember can be reliably estimated. A potential problem arises
from the presence of diatoms in the sediments. If the solutions are in
equilibrium with these, which are amorphous silica, the SiO2 content of the
solution will be higher than if it were in equilibrium with quartz. However
Kastner (1982) has found all the SiO2 present in the hydrothermally altered
sediment to be present as quartz, therefore the assumption of equilibrium
with respect: to this phase is probably justified.
At Guaymas the depth of the overlying water column is ~2000 meters

175
(200 bars) and the sediments overlying the basalt basement are probably
-500 imeters thick (50 bars). To calculate a depth of reaction into basalt,
-250 bars should be subtracted from the calculated pressures. If a
negative value results, it implies that the source of the hydrothermal
solution is with in the sediment cover and is probably due to a sill driven
system (Kastner, 1982).
As at 210 N a variey of SiO2 concentrations are observed for the vents
at Guaymas (Table 2-12). A larger temperature range is observed for the
Guaymas vents. Based on their measured temperature and SiO2 contents the
Guaymas vents are plotted onto the data of Kennedy (1950) in figure 2-25.
Unfortunately most of the points fall in the area where the isobars
converge, making it difficult to assign pressures to most of the areas.
Area 4, the 315 C vent sampled on dive 1177 falls on the 300 bar line.
This infers that the depth of reaction is 0.5 kms into the basalt. This
depth agrees with that found for the HG vent at 21° N, and this helps to
support the validity of this calculation. If the measured temperature of
this vent is too low (or if it is hotter at depth) the pressure must
decrease, if the same SiO2 content is to be maintained. The pressure
cannot be decreased below 250 bars or the solution would have its source in
the sediment cover. The high 3He content of the solution (Lupton, personal
communication) argues against a purely sedimentary source. The 315 C
measured temperature must therefore be within ~10° C of the temperature at
depth. Area 7 with a measured temperature of 300 C also falls on the 300
bar isobar suggesting a similar depth of reaction and a correct measured
temperature. For areas 1, 2, 5 and 6 no pressure (depth) can be
calculated. Area 3 falls on the 1000 bar isobar inferring a depth of
reaction >7.5 kms into the basalt. This great depth appears unlikely based

176
on the shallow depth calculated for areas 4 and 7 which are at most 4 kms
away. Also none of the 21° N areas appear to circulate this deep.
Although this area is out of the most central depression and overlies a
fault scarp it seems unlikely that its hydrologic regime is so different.
This suggests that either the measure temperature (2850 C) is too low or
that, as at NGS, the solution has conductively cooled. An exit temperature
of 310° C would bring this area onto the 300 bar line. Area 9 had a
measured temperature of only 1000 C and, based on its position on the
figure has probably cooled and possibly precipitated quartz during its
passage through the sediment column. (At this temperature it should be in
equilibrium with amorphous silica, not quartz.) Other chemical parameters
for this area also suggest a longer residence time in the sediment or
basalt..
The same problems as were noted for the use of the quartz geobarometer
at 210 N apply at Guaymas. The quality of the temperature data at Guaymas
is worse, adding another uncertainty to these calculations. No geophysical
data which could help in confirming the depth of hydrothermal circulation
are available for Guaymas. The agreement between the depth of reaction for
one of the 210 N areas and two of the Guaymas areas increases the
confidence placed in these calculations and suggests that hydrothermal
circulation may at times occur at very shallow depths (0.5 kms) in the
oceanic crust.
3.5 Gu.aymas Model
A.s stated earlier (section 3.2) Guaymas is modelled as a 21 N system
(seawater + basalt) with additional reactions occurring in the sediment
cover. Kastner (1982) demonstrated the existence of two types of
hydrothermal systems at Guaymas: the first with the solutions derived from

177
the underlying basalt and the second with the solutions derived from sill-
driven hydrothermal systems in the sediments. Although an input from a
sill-driven system to the Guaymas hydrothermal solutions cannot be
completely ruled out the data (high silica, high 3He, high sulfur and high
iron, manganese and zinc concentrations) suggest the source of most of the
solutions is from a deeper system and that the proposed model is a valid
one.
3.6 Comparison to DSDP Leg 64
Prior to the discovery of actual discharging hot springs on the floor
of the southern trough of Guaymas Basin, DSDP had drilled (Leg 64, Sites
477 and 477A) and found evidence of hydrothermal systems. Evidence from
the solids and pore waters suggested that two types of hydrothermal systems
exist at Guaymas: one driven by sills intruding into the sediments and a
second driven by a shallow magma chamber below the sediment cover (Kastner,
1982). The solids which were influenced by the deep hydrothermal system
were altered to a greenschist facies assemblage (Kastner, 1982). The pore
waters displayed a chemistry which was unique and appeared similar to that
found at GSC and 21 N (Gieskes et al., 1982). In both of these sites
sills were encountered but they appeared to be "old" as they showed no
temperature anomaly and most of the chemical anomalies which they had
induced in the pore waters had previously decayed away by diffusion. The
sills also appeared to act as a cap with hydrothermally altered pore waters
and sediments below them and unaltered pore waters and sediments above
(beyond a 20 meter sill cooked margin). As the DSDP cores penetrated
approximately half of the sediment column, we must infer what is occurring
deeper in the section.
The maximum concentrations observed in the pore water solutions and in

178
Table 3-3: Comparison of Guaymas Hydrothermal Solutions and Pore Waters
Element
Li Ip
Na mK mRb p
Be nMg mCa mSr pBa 1i
8 7 Sr/8 6 Sr
pH
Alkt meq
C1 m
SiO2 m
Al p
NH3 m
SO4 m
H2 S m
Mn pFe pCo nCu i
Zn pi
Ag nCd nPb n
Hydrothermal
630+ 1076
478+51332.5+48.5
57+86
12+91
0
26.6+41.5160+25315+54
0.7053
5.92.8+10.6
581+ 637
9.3+ 13.8
0.9+7.9
10.3+15.6
0
3.80+5.98
132+23617+180<5
<0.0010.1+400+2300+460+652
Pore Waters 2
927
92
61
0
53.3312
0.7049
6.009.58+(60.1)4
629
4.87
12.2
0?
277
1Units: n = nanomoles/kgp = micromoles/kgm = millimoles/kgmeq = milliequivalents/kg.
2Data from Gieskes et al. (1982) and is the maximum (or mimimum) valueobserved in Sites 477 and 477A. Mg is assumed to be 0 below 155 m.
3T. Trull (1983) unpublished data.
4 The high value is from the top, unaltered section of the core.

179
the hydrothermal solutions are given in Table 3-3. The values are in good
agreement with the hydrothermal solutions generally having a slightly
higher concentration. The greatest discrepancy occurs in the case of
silica, which is not unexpected. The hydrothermal solutions are presumably
in equilibrium with quartz at their elevated temperatures and pressures
while the pore waters are considerably cooler, resulting in supersaturation
and precipitation of quartz. This is supported by the presence of quartz
throughout the sediment cores. If the pore water profiles themselves are
examined (Gieskes et al., 1982) it is apparent that many of the pore water
values continue to increase with depth and probably reach their maximum
values deeper in the sediment column. The pore waters therefore appear to
be hydrothermal waters which have infiltrated the sediment column and
cooled, while maintaining most of their chemical signature.
The chemistry of the solids is also important to consider as the
hydrothermal solutions are inferred to react with the sediments before they
exit on the seafloor. Gieskes et al. (1982) found essentially quantitative
removal of K from the solid phase at depth, which agrees with the high K
observed in the solutions and was assumed to be partially derived from the
sediments. Kastner (1982) found the assemblage quartz-albite-chlorite-
epidote with pyrite and some pyrrhotite in the bottom 83 meters of site
477. This agrees with the loss of Si, Na, Mg, Fe and S from solution. The
presence of chlorite may indicate that the hydrothermal solutions contain
some Mg due to incomplete reaction with the basalt or that they may be in
contact with unaltered seawater present in the sediment column. The
Fe-sulfides appear to contain some Zn (Kastner, 1982) and some Mn (Kelts,
1982). Unfortunately Cu, which shows a large deficit in the solutions with
respect to 21 N (Table 2-10) was not analyzed in the sulfide phases but

180
may have already been deposited deeper in the section as at 173 m below the
seafloor the pH of the pore water solutions is >6 (Gieskes et al., 1982).
Analysis of the bulk solids shows an increase of Cu in the 230 and 239 m
intervals in site 477A, which were the deepest samples measured (Niemitz,
1982). The presence of some MnS in the Fe-sulfides agrees with the
thermodynamic calculations which show MnS to be saturated in the
hydrothermal solutions. The sulfur isotopic data suggest that both
bacterial and hydrothermal reduction of seawater sulfate and basaltic
sulfur may be the source of sulfur (Shanks and Niemitz, 1982) in the
sulfides, while anhydrite is formed from seawater sulfate. The coexistence
of pyrite and pyrrhotite indicates temperatures of approximately 300 C for
the deeper part of this site in good agreement with the observed solution
temperature of 315 C.
The pore water and solid chemistry from DSDP sites 477 and 477A is in
excellent agreement with the chemistry of the sampled hydrothermal
solutions and inferred sedimentary reactions. The hydrothermal solutions
sampled appear to be from a deep not sill driven system.
3.7 Comparison to Chimney Chemistry
The chimneys at Guaymas are different in their mineralogy from those
at 210 N. Pyrrhotite is the most common sulfide with lesser ZnS and rare
chalcopyrite (S.D. Scott, personal communication). Some galena is also
found in the chimneys. This agrees with the solution chemisty at Guaymas
where Fe > Zn > Pb with Cu often being absent from the solutions or present
at very low concentrations. Scott (personal communication) also estimates
the ratio of (sulfate + carbonate)/sulfide to be 10-100 at Guaymas versus
1-10 a.t 210 N. This is also in agreement with the solution chemistry as
Ca, Sr and Ba (all sulfate formers) are much more concentrated in the

181
Guaymas solutions, as are the carbonate species while the sulfide formers
Fe, Zn, Cu and sulfide itself are lower in concentration. The differences
in mineralogy are therefore in excellent agreement with the differences in
solution chemistries observed for the two areas.
In 1977 Lonsdale et al. (1980) found a hydrothermal deposit in the
northern trough of the Guaymas Basin. The deposit they found was composed
primarily of talc and pyrrhotite. The sulfide phase contained Cu, Zn
and Cc, but only Cu was present at levels significantly greater than the
surrounding sediment. The 6lUO value of the talc indicated a temperature
of formation of 280 C and the presence of anhydrite also suggested a high
temperature of formation. The deposit was also coated with Fe and Mn
oxides. The presence of talc and iron sulfides and the inferred
temperature of formation is in good agreement with the observed
temperature, reduced nature and high SiO2 and Fe contents of the solutions
observed in the southern trough.
3.8 Comparison to Ore Deposits
The environment in which the Guaymas hydrothermal system occurs is
more suggestive of the terrain in which Besshi-type deposits are found,
rather than ophiolite-type deposits. Franklin et al. (1981) give a concise
description of Besshi-type deposits on which much of the following
discussion is based. These deposits are named for their type locality in
Japan and are sediment-hosted deposits. Within the sediments (or shales or
schists to which they have been metamorphosed) are always found basaltic
bodies (often metamorphosed to greenschist facies). These deposits also
appear to be found near a tectonic boundary such as a continent-ocean crust
transition as is observed in the Gulf of California. The schists that the

182
Besshi deposits are found in are black which is indicative of a high
organic matter content, consistent with the sediments found at Guaymas.
Some of the ore bodies are found in carbonaceous rocks, again consistent
with the Guaymas sediments.
The ores found in these deposits typically contain chalcopyrite and
pyrite with lesser sphalerite, as well as Pb and Co. The ore bodies may be
massive or banded and are in general very thin (several meters) while they
may be hundreds of meters wide and long. The massive ore contains pyrite,
chalcopyrite, sphalerite and bornite with minor magnetite, and quartz and
calcite as the gangue minerals. The banded ore contains pyrite, with minor
chalcopyrite and sphalerite in a gangue of quartz, carbonate, albite,
chlorite and minor epidote, amphiboles and tourmaline (Franklin et al.,
(1981).
The composition and habit of the Besshi ores and gangue minerals are
consistent with what one would expect to find forming subsurface at
Guaymas. DSDP Holes 477 and 477A penetrated only half the sediment column
and although they did find some sulfides they did not drill into an "ore
deposit" which may occur deeper in the section. Based on the model
presented in section 3.2 the Guaymas solutions have lost much of the Fe,
all of the Cu, some of the Zn, all of the Co and possibly some of the Ag,
Cd and. Pb they contain at depth in the system. These elements are
presumably deposited as sulfides, as sulfur also shows a net loss. These
predictions are in good agreement with the observed metal content of the
deposits. Presumably this deposition at depth occurs for two reasons.
First, the solubility of these metals is temperature dependent and a drop
in temperature, caused by conductive cooling in a low flow system, may
cause their deposition. A second cause of deposition could be due to a

183
change in pH. Crerar and Barnes (1976) have shown how large changes in
solubility are due to temperature decreases and pH increases. The Guaymas
solutions have a pH which is approximately two units higher than the 21 N
solutions and this may be the controlling factor on metal solubilities.
The Guaymas solutions gain alkalinity and hence increase their pH due to
reactions, many of which involve organic matter, which can occur in the
sediment column (section 3.2). The large amount of hydrocarbons found in
these solutions (Simoneit and Lonsdale, 1982) suggests that the supply of
organic matter is not limiting the progress of these reactions in the
Guaymas case. The very thin ore bodies of the Besshi-type deposits
suggests that they have encountered some kind of a front. Presumably a
drop in temperature would be a more gradual process, suggesting it is a
chemical front which they have encountered. The rise in alkalinity
accompanied by a rise in pH due to organic matter degradation and carbonate
dissolution is therefore suggested as the primary mechanism of deposition
for these deposits.
Although the literature references to it are scant, there is other
evidence that the chemical reactions are important. Another product of the
above reactions is NH4+, which is present at millimolar levels in the
hydrothermal solutions (Table 2-3). Sterne et al. (1982) recently noted
the large amounts of NH4+-illite found in the black shales surrounding the
ore bearing strata in Lik and Competition Creek stratiform Zn-Pb-Ag base
metal deposits in the Delong Mountains, northern Alaska. They could
propose no explanation for this observation. The deposits in northern
Alaska such as they and Nokleberg and Winkler (1982) have described are
presumed to have formed on the seafloor. If they formed in a method
analagous to the deposits we believe to be forming today at Guaymas the
184
explanation for the high NH4+-illite is obvious. These Alaskan deposits
may have also formed due to the degradation of organic matter as they occur
with black shales and dark cherts. The type ore deposit is also consistent
with the Guaymas deposits. The Guaymas solutions appear to lose some of
their Zn, they are saturated with galena (some of the Pb is sediment
derived, based on the isotopes) and contain variable amounts of Ag.
It therefore appears likely that a Besshi or sediment-hosted type
stratiform deposit is forming at depth at Guaymas. The cause of deposition
is most likely increased alkalinity and pH due to organic matter
degradation (possibly due to heating) and CaCO3 dissolution. Guaymas is an
extremely productive area of the ocean which results in the high
sedimentation rates with high organic matter and CaC0O3 content. In general
a hydrothermal system covered by sediment without these components may not
result in a deposit. The overlying water column chemistry and physics
(upwelling leading to high nutrients and high productivity) may therefore
play a controlling role in this type of deposit formation on the seafloor.
3.9 Comparison to Experimental Work
Very few of the experiments are comparable to the Guaymas system as
most were done with basalt or andesite, not sediments, as the solid and
seawater. The most directly applicable is that of Bischoff et al. (1981)
in which graywacke was reacted with seawater at temperatures of 200° and
350 ° C, pressures of 500 bars and a water/rock ratio of 10:1. Graywackes
are sedimentary rocks and as a first approximation may be considered as
analogues to the sedimented Guaymas system. Two shortcomings exist with
this approach: 1) the sediments at Guaymas are extremely organic rich which
may have a profound effect on the net solution chemistry and 2) the Guaymas
solutions undergo prior reaction with the basalt. This second point, which

185
is a disadvantage for reproducing the solution chemistry is actually an
advantage when trying to separate the basalt from sediment reactions.
Bischoff et al. (1981) observed a net gain of Ca, K and Fe and a net
loss of S04, C1, Na and Mg in their seawater solutions. The changes of Fe
and C1 are very small and may not be significant. Anhydrite, albite and
smectite-chlorite were found to be the alteration products. Anhydrite is
an artifact in these experiments as was discussed in section 2.9. The
species which are gained or lost, respectively, in the experiments show the
same direction of change in the inferred sedimentary reactions at Guaymas.
The alteration products are those found in the DSDP cores. The H2S is much
lower in the experiment, presumably due to the lack of either basaltic
sulfur or the basaltic reduction of seawater sulfate in the solutions. Fe,
Mn, Cu, Zn and Pb are present at levels comparable to those in the Guaymas
solutions. The solubility of these elements is pH dependent and the
experimental solutions are more acid than the Guaymas solutions (4.8 versus
5.9) and this may be important in maintaining the slightly higher metal
levels. Ba, As, Ca and K have a source in the graywacke and a sedimentary
source was inferred for them at Guaymas. Cd is leached from the graywacke
into seawater and is present at levels higher than those found in the
Guaymas solutions. The Cd concentration of the Guaymas solutions again may
be controlled by the solubility of a sulfide phase. The experiment also
demonstrates that Mg can be consumed in sedimentary reactions alone.
While this experiment is not a complete analog for the Guaymas system
the chemical changes seen in the solutions and solids are consistent with
those inferred for the sedimentary reactions at Guaymas. Where differences
do exist they can be explained in terms of the missing basalt and organic
matter components.

186
3.10 Comparison to Metalliferous Sediments
Metalliferous sediments were discussed with respect to the 210 N
hydrothermal system in section 2.10. At that time it was noted that the
Fe/Mn ratio in these sediments is 3:1 which is indicative of a high
temperature source (based on the much lower ratios observed at the GSC).
This ratio coupled with the large amounts present indicates hydrothermal
activity as the primary source of iron and manganese in these sediments.
The Fe/Mn ratio at Guaymas is always <1. This suggests that Guaymas-type
heavily sedimented hydrothermal systems are not quantitatively important
for the formation of metalliferous sediments. The lower content of the
other metals (Cu, Zn, etc.) in these solutions lends further support to
this hypothesis.
3.11 Summary - Chapter 3
The Guaymas solutions are a result of reactions occurring between
seawater and basalt with an overprint of sedimentary reactions. A model
has been presented which attempts to separate these two sets of reactions.
The major difference between the Guaymas and 210 N solutions is the high
pH, alkalinity and ammonium present in the Guaymas solutions. This may be
responsible for the much lower concentrations of the sulfide-forming
elements in the solutions. As at 210 N a net loss of sulfur occurs in the
solutions and the source of the reduced sulfur in the exit solutions cannot
be determined unambiguously. Quartz geobarometry can only be applied to a
few areas but these areas indicate a 0.5 kms depth of reaction into the
basalt (below the sediment) in good agreement with the HG area at 21 N.
The agreement of the solution chemistry with the pore water chemistry
in DSDP Sites 477 and 477A is amazingly good. The chimneys are different
compositionally from those at 21° N and these differences are in good

187
agreement with the changes in solution chemistry. The Guaymas system
appears to be analagous to a Besshi-type ore deposit in formation. An
experiment done with graywacke at 3500 C is the most comparable to the
Guaymas system and the resulting solution chemistry shows some of the same
enrichments. Sediment covered ydrothermal systems are probably not
quantitatively important for the formation of metalliferous sediments.

188
CHAPTER 4
Conclusions
This chapter consists of three sections. The first section summarizes
the results of the studies of the 210 N and Guaymas Basin solution
chemistries and includes a comparison of these two systems. The second
section is a discussion of hydrothermal fluxes to the ocean and is an
attempt to evaluate the importance of this source term. The final section
contains suggestions for further work.
4.1 Comparison of 21° N and Guaymas
The 210 N and Guaymas Basin hydrothermal systems both occur on the
East Pacific Rise, at areas with similar spreading rates of approximately 6
cm/yr. Both solutions originate from the reaction of seawater with basalt
at elevated temperatures and pressures. The major difference between the
210 N and Guaymas hydrothermal systems is that the Guaymas solutions pass
through and react with 500 meters of sediment before reaching the
seafloor. The 210 N solutions exit from constructional features,
"chimneys", which they have formed through cooling and mixing with seawater
on top of the pillow basalts. They do not react with sediments. The
Guaymas solutions have also formed constructional features, on top of the
sediment, which have a different mineralogy than those at 210 N due to
differences in solution chemistry. The maximum measured temperature of the
solutions at 21° N was 355 C and at Guaymas was 3150 C. The pressures for
the two systems are also similar as the hot springs at 210 N occur under
2500 meters of water and those at Guaymas occur under 2000 meters of water
but the zone of reaction with the basalt is at least 500 meters greater,
beneath the sediment cover.
189
The chemistry of the hot springs at 210 N is not determined by
equilibrium solubility controls except for quartz. The amount of a given
species in solution must therefore be due to either the limited amount of
it present in the seawater-basalt system or kinetic factors. The low
calculated extraction efficiency for many of the elements suggests that
kinetic factors are more important. The NGS vent is saturated with respect
to pyrite at its measured 273 C exit temperature. Based on the silica
content of the solutions (section 2.4) this vent is assumed to have cooled
conductively from ~350° C. At 350° C this vent is not saturated with
pyrite, suggesting that this saturation is a result of cooling and not an
original control on the solution chemistry.
The Guaymas solutions have a different chemistry than those at 21 N
due to reactions which occur in the sediment cover. Table 3-1 is a
comparison of their chemistries. In the absence of direct information on
the composition of the Guaymas hydrothermal solutions as they leave the
basalt and before they react with the sediment it is assumed that they have
the same composition as the 210 N solutions. Table 3-1 also gives the net
difference (A) between the two sets of solutions. Note the large gain of
K, Rb, Ca, Sr, NH4, pH and alkalinity in the Guaymas solutions with respect
to 210 N and the loss of most of the "trace" metals which form insoluble
sulfides such as Mn, Fe, Co, Cu and Zn. Although there is some variation
between vent fields most of the Guaymas solutions are saturated with
respect to alabandite (MnS), sphalerite (ZnS), galena (PbS) and pyrite
(FeS2) or pyrrhotite (FeS). The decreased solubility of these phases (and
resulting lower solution concentrations) are due to the higher pH of these
solutions. The high pH is a result of the dissolution of CaCO3 and
decomposition of organic matter; both of which cause increases in

190
alkalinity and pH. The Guaymas solutions are also saturated with respect
to CaCO3 and several calcium and iron silicates. If the Guaymas Basin was
not under a highly productive area of the ocean which results in the
sediments being 2-4% organic matter and 10-15% CaC03, the solution
chemistry would be more similar to that observed at 21 N.
In summary the 21 N solution composition must be either rock-limited
or kinetically controlled while the Guaymas solutions are solubility
controlled by CaC03, calcium and iron silicates, and the metal sulfides.
The metal sulfides which are saturated are those found in sediment-hosted
deposits (especially lead and zinc). The Guaymas solutions may be thought
of as "spent" solutions. Although epidote is abundant throughout the DSDP
cores the olutions are not saturated with respect to this phase. This is
due to the low aluminum in the solutions, which is probably due to the
precipitation of epidote and other aluminum containing phases at depth.
Both the 210 N and Guaymas solutions are saturated with respect to quartz;
a necessary condition for the application of quartz geobarometry.
4.2 Hydrothermal Fluxes
The reaction of seawater with basalt at elevated temperatures in the
oceanic crust has been shown to greatly modify the chemistry of seawater.
The resulting hydrothermal solutions are injected back into the oceanic
water column and may play an important role in determining the chemistry of
seawater. This requires the evaluation of the net hydrothermal input; a
calculation fraught with difficulties. Seawater composition is also
strongly dependent on the riverine input. Unfortunately great
uncertainties also exist for the net river input of many elements.
After the analysis of the first oceanic ridge crest hydrothermal
solutions from the GSC Edmond et al. (1979a,b) calculated a net
191
hydrothermal input based on the ratio of 3He to heat observed in the
waters. They assumed that the oceanic 3He flux came from axial
hydrothermal solutions with the same ratio to heat as was observed at GSC.
The fluxes in Table 4-1 were calculated using the same assumptions as
Edmond et al. (1979a,b). Several authors have suggested that these values
are too high. Hart and Staudigel (1982) have pointed out that the annual
potassium flux, based on these calculations, is larger than the amount of
potassium present in newly intruded basalts. The conductive heat flow
anomaly extends tens of kilometers away from the ridge axis and the above
calculation assumes that all the heat is lost via axial hot springs. Based
on thermal modelling Sleep and Wolery (1978) and Sleep et al. (1983)
believe that these axial springs remove heat from only a few kilometers off
axis and account for perhaps 10% of the conductive heat flow anomaly. The
above calculation also assumes that all of the oceanic 3He input is at the
ridge axis while some may also be input at convergent margins or oceanic
islands which are the result of mantle plumes (Craig and Lupton, 1981;
Kurz, 1982). While several authors have suggested that these values may be
too high, none have suggested that they are too low. The values in Table
4-1 may be viewed as the maximum hydrothermal input; this can still provide
a useful comparison to the river flux and between systems.
The major differences which occur between the 21° N and Guaymas
systems are the much lower inputs of Mn, Fe, Co, Cu and somewhat lower
inputs of Zn and Cd from the Guaymas system. For these elements the
Guaymas system is similar to the GSC system where these elements are lost
subsurface as sulfides. The input of Sr and NH4 from Guaymas is at least
an order of magnitude larger than that from 210 N (or GSC in the case of
Sr). Guaymas also has a larger input of K and Rb than the other areas.
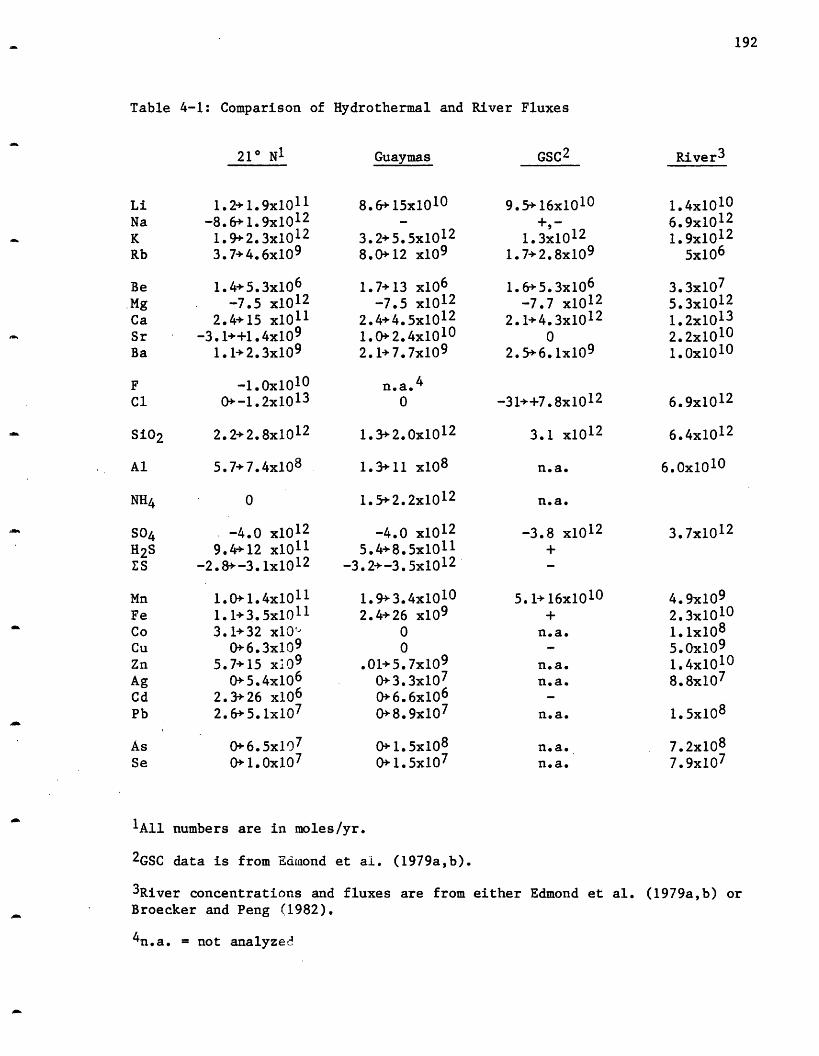
192
Table 4-1: Comparison of Hydrothermal and River Fluxes
21 N1 Guaymas GSC 2 River3
1.2+1.9x10 11
-8.6+1.9x10121.9+2.3x10123.7+4.6x10⁹
1.4+5.3x10⁶
-7.5 x101 2
2.4+15 x1011
-3.1++1.4x10⁹
1.1+2.3x10⁹
8.6+15x1010
3.2+5.5x10¹²
8.0+12 x109
1.7+13 x106
-7.5 x10122.4+4.5x10121.0+2.4x10102.1+7.7x10⁹
9.5+16x1010
1.3x10¹²
1.7+2.8x10⁹
1.6+5.3x10⁶
-7.7 x10¹²
2.1+4.3x10120
2.5+6.1x10⁹
-1. 0x101 0
0+-1.2x101 3n.a.4
0 -31++7.8x101 2
2.2+2.8x10¹² 1.3+2.0x101 2 3.1 x10¹²
5.7+7.4x10⁸
0
1.3+ 11 x108
1.5+2.2x10¹²
-4.0 x10¹²
9.4+12 x10 11
-2.8+-3.1x101 2
1.0+1.4x10 111.1+3.5x10 11
3.1+32 x10'0+6.3x10⁹
5.7+15 xi09
0+5.4x10⁶
2.3+26 x106
2.6+5.1x10⁷
0+6.5x10⁷
0+ 1.0x10 7
-4.0 x101 2
5.4+8.5x101 1
-3.2+-3.5x10¹²
1.9+3.4x10¹⁰
2.4+26 x1090
0.01+5.7x10⁹
0+3.3x10⁷
0+6.6x10⁶
0+8.9x10⁷
0+ 1. 5x10 8
0+ 1.5x10 7
-3.8 x101 2
5.1+16x1010
n.a.
n.a.na.
n.a.
n.a.n.a.
1All numbers are in moles/yr.
2GSC data is from Edmlond et ai. (1979a,b).
3River concentrations and fluxes are from either Edmond et al. (1979a,b) orBroecker and Peng (1982).
4n.a. = not analyzed
LiNaKRb
BeMgCaSrBa
F
C1
1.4x10106.9x10121.9x1012
5x10⁶
3.3x10⁷
5.3x101 2
1.2x101 3
2.2x101 0
1.0x101 0
Al
NH4
6.9x10 12
n.a.
6.4x101 2
n.a.
6.0x101
S04H2SES
MnFeCoCuZnAgCdPb
AsSe
3.7x10¹²
4.9x10⁹
2.3x10101. 1x10 8
5.0x10⁹
1.4x101 0
8.8x10⁷
1. 5x10 8
7.2x10⁸
7.9x10⁷
SiO2
193
Except for the species noted above the fluxes calculated for the three
areas are very similar. The major difference occurs for those elements
which form insoluble sulfides as these can have either a large input term
(as at 210 N), a removal term (as at GSC) or be somewhere inbetween (as at
Guaymas). Whether a hydrothermal system is leaky, tight or sediment
covered (Figure 1-2) will have a major influence on the amounts of these
species added to the oceanic water column.
The fluxes calculated for the sulfide formers are difficult to
evaluate on another basis as well. These fluxes are calculated from the
dissolved solution concentrations. Some of the metal load of the solutions
may have already been lost to form the chimneys. An unknown proportion of
the dissolved load is incorporated into (or onto) a solid phase (the "black
smoke")and an unknown proportion of the solid phase is redissolved in the
oxic environment of the water column and seafloor. The flux calculations
for these elements therefore have additional inherent uncertainties.
Table 4-1 also contains data for the river flux of these elements.
These numbers are also poorly defined because many rivers have not been
measured, and those which have may only have been sampled once, making no
allowance for the variation in concentration which accompanies variation in
flow. The values for the transition metals are especially uncertain as
they have been measured in very few rivers and have very complicated
estuarine chemistries, which often result in their removal from solution.
The quoted values for their fluxes may be too high by several orders of
magnitude (Shiller, personal communication). The most important point is
that the hydrothermal input is the major source of lithium and rubidium to
the ocean. This remains the case even if the hydrothermal input is only
10% of what is assumed here. For many of the other elements the ridge

194
crest source may be comparable to or significantly less than the river
flux, depending on the assumptions made regarding the hydrothermal fluxes.
4.3 Further Work
The hot springs at 210 N were the first undiluted high temperature
submarine hot springs to be sampled. Their chemistry agrees very well with
that inferred from the diluted GSC hot springs. Workers in France have
recently observed and sampled hot springs at 130 N on the East Pacific
Rise. Preliminary reports of their chemistry (Michard et al., 1982) show
them to be somewhat different than those at 21° N. A detailed comparison
between these two systems may help to explain differences between systems
as well as differences between vents. The study of additional axial vents
will define their range in composition which is impora-.t for flux
considerations.
The Guaymas system, with its sediment cover provides a somewhat
different input to the ocean. Further work on this system will help in
elucidating the formation of sediment hosted ore deposits.
Although all of the above solutions meet the criteria of "ore forming"
solutions they have chlorinities very similar to seawater. Based on
studies of fluid inclusions from ore deposits, many "ore forming" solutions
have much higher chlorinities. The recent report of warm water (<150 C
above ambient) flowing downhill on Larson's seamounts (Lonsdale et al.,
1982) suggests that these high chlorinity solutions may also be present on
the seafloor. Seamounts may, in some cases, be the location of another
type of hydrothermal activity on the seafloor and may be forming another
class of mineral deposits, known broadly as "caldera-hosted". Future work
will hopefully elucidate the processes occurring at seamounts and establish
if this type of activity is widespread over the seafloor.

195
All of the hot springs sampled to date are on moderate spreading rate
ridges (6-9 cm/yr). As a large proportion of the oceanic ridge crest
system is slow spreading, and some is much faster spreading, it is
important to establish if the same type of hydrothermal activity exists on
these other sections of the ridge system.

196
REFERENCES
Anderson, R.N., J. Honnorez, K. Becker, A.C. Adamson, J.C. Alt,R. Emmermann, P.D. Kempton, H. Kinoskita, C. Laverne, M.J. Mottl,R.L. Newmark, DSDP Hole 504B, The first reference section over 1 kmthrough layer 2 of the oceanic crust, Nature 300 (1982) 589-594.
Ballard, R.D. and J. Francheteau, The relationship between active sulfidedeposition and the axial processes of the mid-ocean ridge, MarineTechnology Society Journal 16 (1982) 8-22.
Ballard, R.D., J. Francheteau, T. Juteau, C. Rangin, W. Normark, EastPacific Rise at 210N: the volcanic, tectonic, and hydrothermalprocesses of the central axis, Earth Planet. Sci. Lett. 55 (1981)1-10.
Barnes, H.L. (editor), Geochemistry of Hydrothermal Ore Deposits, 2nd ed.,John Wiley and Sons, New York (1979) 798pp.
Barnes, H.L. and G.K. Czamanske, Solubilities and transport of ore minerals,in Geochemistry of Hydrothermal Ore Deposits, 1st ed., ed. by H.L.Barnes, Holt Rinehart and Winston, New York, (1967) 334-381.
Bender, M., W. Broecker, V. Gornitz, U. Middel, R. Kay, S. Sun, P. Biscaye,Geochemistry of three cores from the East Pacific Rise, EarthPlanet. Sci. Lett. 12 (1971) 425-433.
Bischoff, J.L., Geothermal system at 210N, East Pacific Rise: physicallimits on geothermal fluid and role of adiabatic expansion, Science207 (1980) 1465-1469.
Bischoff, J.L. and F.W. Dickson, Sea water basalt interaction at 200°C and500 bars: implications for origin of seafloor heavy metal depositsand regulation of sea water chemistry, Earth Planet. Sci. Lett. 25(1975) 385-397.
Bischoff, J.L., A.S. Radtke, R.J. Rosenbauer, Hydrothermal alte-ation ofgraywacke by brine and seawater: roles of alteration and chloridecomplexing on metal solubilization at 200°C and 350°C, con. Geol.76 (1981) 659-676.
Blount, C.W., Barite solubilities and thermodynamic quantities up to 300°Cand 1400 bars, American Mineralogist 62 (1977) 942-957.
Bonatti, E., Metallogenesis at oceanic spreading centers, in Ar.zual Revi-wof Earth and Planetary Sciences, ed. by F.A. Donath 3 (1975) 401-432.
Bostrom, K. and M.N.A. Peterson, Precipitates from hydrothermal exhalationson the East Pacific Rise, Econ. Geol. 61 (1966) 1258-1265.
Bostrom, K. and M.N.A. Peterson, The origin of aluminum-poor fc romangan: ansediments in areas of high heat flow on the East Pacific Rise, Mar.Geol. 7 (1969) 427-447.

197
Bostrom, K., M.N.A. Peterson, O. Joensuu and D.E. Fisher, Aluminum-poorferromanganoan sediments on active oceanic ridges, Journal ofGeophysical Res. 74 (1969) 3261-3270.
Bowers, T.S., K.L. Von Damm and J.M. Edmond, The chemical evolution ofridge crest hot springs (1983) manuscript in preparation.
Brewer, P.G. and D.W. Spencer, Colorimetric determination of manganese inanoxic waters, Limnol. Ocean. 16 (1971) 107-110.
Broecker, W.S. and T.H. Peng, Tracers in the Sea, Lamont-Doherty GeologicalObservatory, Columbia University, Palisades, NY (1982) 690p.
Calvert, S.E., Accumulation of diatomaceous silica in the sediments of theGulf of California, Geol. Soc. Am. Bull. 77 (1966) 569-596.
Chen, J., G. Wasserburg, K.L. Von Damm, J.M. Edmond, Lead, uranium andthorium in hot springs on the EPR at 210 N and Guaymas Basin, Gulfof California (1983) manuscript in preparation.
Cline, Joel D., Spectrophotometric determination of hydrogen sulfide innatural waters, Limnol. Ocean. 14 (1969) 454-458.
Coleman, R.G., Ophiolites - ancient oceanic lithosphere?, Springer-Verlag,New York, (1977) 229 pp.
Cooper, J.E. and K.Z. Abedin, The relationship between fixed ammonium-nitrogen and potassium in clays from a deep well on the Texas GulfCoast, Texas Journal of Science 33 (1981) 103-111.
Cooper, J.E. and W.S. Evans, Ammonfium - Nitrogen in Green River formationoil shale, Science 219 (1983) 492-493.
Cooper, J.E. and B.A. Raabe, The effect of thermal gradient on thedistribution of nitrogen in shale, Texas Journal of Science 34(1982) 175-182.
Corliss, J., The origin of metal-bearing submarine hydrothermal solution,Journal of Geophysical Res. 76 (1971) 8128-8138.
Corliss, J.B., J. Dymond, L.I. Gordon, J.M. Edmond, R.P. von Herzen,R.D. Ballard, K. Green, D. Wiiliams, A. Bainbridge, K. Crane,Tj. H. van Andel, Submarine Thermal springs on the Galapagos Rift,Science 203 (1979) 1073-1083.
Craig, H. and J. Lupton, Helium-3 and mantle volatiles in the ocean and theoceanic crust in The Sea, vol. 7, ed. by C. Emiliani, John Wiley andSons, New York (1981) 391-428.
Crerar, D.A. and H.L. Barnes, Ore solution chemistry V. Solubilities ofchalcopyrite and chalcocite assemblages in hydrothermal solutions at2000 to 350C, Econ. Geol, 71 (1976) 772-794.

198
Curray, J.R., D.G. Moore et. al., Init. Repts. DSDP, 64: Washington (U.S.Govt. Printing Office) 1982.
CYAMEX SCIENTIFIC TEAM: J. Francheteau, H.D. Needham, P. Choukroune, T.Juteau, M. Seguret, R.D. Ballard, P.J. Fox, W.R. Normark,A. Carranza, D. Cordoba, J. Guerrero, C. Rangin, First mannedsubmersible dives on the East Pacific Rise at 210N (Project Rita):General Results, Mar. Geophysical Researches 4 (1981) 345-379.
Deer, W.A., R.A. Howie, and J. Zussman, Rock-forming Minerals, Vol. 2Chain Silicates, Longmans, Green and Co. Ltd., London (1963) 3 7 9pp.
Delaney, J.R., D.W. Mogk and M.J. Mottl, Quartz-cemented, sulfide-bearinggreenstone breccias from the mid-Atlantic ridge-samples of ahigh-temperature hydrothermal upflow zone, Science (1983) in press.
Dymond, J., Geochemistry of Nazca plate surface sediments: An evaluation ofhydrothermal, biogenic, detrital and hydrogenous sources, in GSAMemoir 154, Nazca Plate: Crustal Formation and Andean Convergence,ed. by L.D. Kulm, J. Dymond, E. Dasch, D. Hussong (1981) 824 pp.
Edmond, J.M., C. Measures, R.E. McDuff, L. Chan, R. Collier, B. Grant,L.I. Gordon and J. Corliss, Ridge crest hydrothermal activity andthe balances of the major and minor elements in the ocean: theGalapagos data, Earth Planet. Sci. Lett. 46 (1979a) 1-18.
Edmond, J.M., C. Measures, B. Mangum, B. Grant, F.R. Sclater, R. Collier,A. Hudson, L.I. Gordon and J. Corliss, On the formation ofmetal-rich deposits at ridge crests, Earth Planet. Sci. Lett. 46(1979b) 19-30.
Elder, J., Physical processes in geothermal areas in Terrestrial Heat Flow,ed. by W.H.K. Lee, AGU Geophysical Monography 8 (1965) 211-239.
Field, C.W., D.G. Wetherell and E.J. Dasch, Economic appraisal of nazcaplate metalliferous sediments, in GSA Memoir 154, Nazca Plate:Crustal Formation and Andean Convergence, ed. by L.D. Kulm, J.Dymond, E. Dasch, D. Hussong (1981) 315-320.
Fournier, R.O., R.J. Rosenbauer, J.L. Bischoff, The solubility of quartzin aqueous sodium chloride solution at 350°C and 180 to 500 bars,Geochim. Cosmochim. Acta 46 (1982) 1975-1978.
Franklin, J.M., J.W. Lydon, and D.R. Sangster, Volcanic-associated massivesulfide deposits, Econ. Geol., 75th Anniversary Vol. (1981) 485-627.
Green, K.E., Geothermal processeses at the Galapagos Spreading Center,M.I.T.-W.H.O.I. unpublished Ph.D. thesis (1980) 226pp.
Goldfarb, M.S., Hydrothermal sulfide deposits on the East Pacific Rise,210 N, M.I.T. unpublished Ph.D. dissertation (1982) 336 pp.
Hajash, A., Hydrothermal processes along mid-ocean ridges: an experimentalinvestigation, Contrib. Min. Petrol 53 (1975) 205-226.
199
Hajash, A. and P. Archer, Experimental seawater/basalt interactions:effects of cooling, Contrib. Mineral. Petrol. 75 (1980) 1-13.
Hart, S.R., K, Rb, Cs contents and K/Rb, K/Cs ratios of fresh and alteredsubmarine basalts, Earth Planet. Sci. Lett. 6 (1969) 295-303.
Hart, S.R. and H. Staudigel, The control of alkalies and uranium inseawater by ocean crust alteration., Earth Planet. Sci. Lett. 58(1982) 202-212.
Hart, S.R., A.J. Erlank and E.J.D. Kable, Sea floor basalt alteration:some chemical and Sr isotopic effects, Contr. Mineral. and Petrol.44 (1977) 219-230.
Haymon, R.R., Growth history of hydrothermal black smoker chimneys, Nature301 (1983) 695-698.
Haymon, R.M. and M. Kastner, Descriptive catalog of RISE sulfide samplesfrom the East Pacific Rise, 210N, Univ. of California, SIOReference 19-28 (1979).
Haymon, R.M. and M. Kastner, Hot spring deposits on the East Pacific Riseat 210N: preliminary description of mineralogy and genesis, EarthPlanet. Sci. Lett. 53 (1981) 363-381.
Heath, G.R. and J. Dymond, Genesis and transformation of metalliferoussediments from the East Pacific Rise, Bauer Deep, and Central Basin,northwest Nazca plate, Geol. Soc. Am. Bull. 88 (1977) 723-733.
Heier, K.S. and J.A.S. Adams, The geochemistry of the alkali metals, Phys.Chem. Earth 5 (1964) 253-381.
Hekinian, R., M. Fevrier, J.L. Bischoff, P. Picot and W.C. Shanks, Sulfidedeposits from the East Pacific Rise near 210N, Science 207 (1980)1433-1444.
Honnorez, Jose', The aging of the oceanic crust at low temperature, inThe Sea, vol. 7 ed. by C. Emiliani, John Wiley and Sons, New York(1981) 525-588.
Horowitz, A., The distribution of Pb, Ag, Sn, T1 and Zn in sediments onactive oceanic ridges, Mar. Geol. 9 (1970) 241-259.
Hudson, Andrew G., The chemistry of iron and manganese in submarinehydrothermal systems, M.I.T. unpublished M.S. thesis (1980) 80pp.
Humphris, S.E., The hydrothermal alteration of oceanic basalts by seawater,M.I.T.-W.H.O.I. unpublished Ph.D. thesis (1977) 248pp.
Humphris, S.E. and G. Thompson, Hydrothermal alteration of oceanic basaltsby seawater, Geochim. Cosmochim. Acta 42 (1978a) 107-125.

200
Humphris, S.E. and G. Thompson, Trace element mobility during hydrothermalalteration of oceanic basalts, Geochim. Cosmochim. Acta 42 (1978b)127-136.
Jenkins, W., J. Edmond and J. Corliss, Excess 3He and 4He in Galapagossubmarine hydrothermal waters, Nature 272 (1978) 156-158.
Juteau, T., J.P. Eissen, J. Francheteau, D. Needham, P. Choukroune, C.Rangin, M. Seguret, R.D. Ballard, P.J. Fox, W.R. Normark, A.Carranza, D. Cordoba, J. Guerrero (CYAMEX Scientific Team)Homogeneous basalts from the East Pacific Rise at 210N: steady statemagma reservoirs at moderately fast spreading centers, Oceanol.Acta 3 (1980) 487-503.
Kastner, M., Evidence for two distinct hydrothermal systems in the GuaymasBasin. In Curray, J.R., Moore, D.G. et. al., Init. Repts. DSDP 64Pt. 2: Washington (U.S. Gov't Printing Office), 1143-1157.
Kay, R.W. and N. Hubbard, Trace elements in ocean ridge basalts, EarthPlanet. Sci. Lett. 38 (1978) 95-116.
Kelts, K.R., (1982) Petrology of hydrothermally metamorphosed sediments atDeep Sea Drilling Site 477, southern Guaymas Basin rift, Gulf ofCalifornia. In Curray, J.R., Moore, D.G., et. al., Init. Repts.DSDP 64, Pt. 2: Washington (U.S. Govt. Printing Office) 1123-1136.
Kennedy, G.C., A portion of the system silica-water, Econ. Geol. 45 (1950)629-653.
Kerridge, J., R.M. Haymon and M. Kastner, Sulfur isotope systematics at the210 N site, East Pacific Rise (1983) submitted EPSL.
Klinkhammer, G., M. Bender and R. Weiss, Hydrothermal Mn in the GalapagosRift, Nature 269 (1977) 319-320.
Kurz, M.D., Helium isotope geochemistry of oceanic volcanic rocks:implications for mantle heterogeneity and degassing, M.I.T.-W.H.O.I.unpublished Ph.D. thesis (1982) 290pp.
Larson, R.L., Near-bottom geologic studies of the East Pacific Rise crest,Geol. Soc. Am. Bull. 82 (1971) 823-841.
Lawver, L.A., D.L. Williams and R.P. Von Herzen, A major geothermal anomalyin the Gulf of California, Nature 257 (1975) 23-28.
Lawver, L.A. and D.L. Williams, Heat flow in the central Gulf ofCalifornia, Journal Geophysical Res. 84 (1979) 3465-3478.
Lebel, J. and A. Poisson, Potentiometric determination of Ca and Mg inseawater, Mar. Chem. 4 (1976) 321-332.
Liberti, A. and M. Mascini, Anion Determination with ion selectiveelectrodes using Gran's plot: application to fluoride, AnalyticalChemistry 41 (1969) 676-678.
201
Lister, C.R.B., "Active" and "passive" hydrothermal systems in the oceaniccrust: predicted physical conditions, in The DynamicEnvironment of the Ocean Floor, ed. by K.A. Fanning and F.T.Manheim, Lexington Books, Lexington, Mass. (1982) 441-470.
Lonsdale, P., R. Batiza and T. Simkin, Metallogenesis at seamounts on theEast Pacific Rise, Marine Technology Society Journal 16 (1982)54-61.
Lonsdale, P.F., J.L. Bischoff, V.M. Burns, M. Kastner and R.E. Sweeney, Ahigh-temperature hydrothermal deposit on the seabed at a Gulf of
California Spreading Center, Earth Planet. Sci. Lett. 49 (1980)8-20.
Lupton, J.E., Helium-3 in the Guaymas Basin: evidence for injection ofmantle volatiles in the Gulf of California, Journal GeophysicalResearch 84 (1979) 7446-7452.
Lupton, J. and H. Craig, A major helium-3 source at 150 S on the EastPacific Rise, Science 214 (1981) 13-18.
McDufE, R.E. and J.M. Edmond, On the fate of sulfate during hydrothermalcirculation at mid-ocean ridges, Earth Planet. Sci. Lett. 57 (1982)117-132.
Makrides, A.C., M.J. Turner, W.W. Harvey, J. Slaughter, S.B. Brunner,P.O.D. Offenhartz, G.F. Pearson, Study of silica scaling fromgeothermal brines, Final Report for 15 Nov. 74 - 30 Apr. 74EIC Corp., prepared for U.S. Dept. of Energy cob-2607-5,January 1978, 72pp.
Malahoff, A., A comparison of the massive submarine polymetallic sulfidesof the Galapagos Rift with some continental deposits, MarineTechnology Society Journal 16 (1982) 39-45.
Measures, C.I. and J.D. Burton, Gas chromatographic method for thedetermination of selenite and total selenium in seawater, AnalyticaChimica Acta 120 (1980) 177-186.
Measures, C.I. and J.M. Edmond, Beryllium in the water column of thecentral North Pacific, Nature 297 (1982) 51-53.
Measures, C.I. and J.M. Edmond, The geochemical cycle of beryllium-9: areconnaissance, Earth Planet. Sci. Lett. (1983) in press.
Michard, G., A. Michard, F. Albarede, J.F. Minster and J.L. Charlou, Thechemistry and 87Sr/8 6 Sr ratios of the hydrothermal vent waters at130N (East Pacific Rise) EOS 63 (1982) 1014.
Michard, A., F. Albarede, G. Michard, J.F. Minster and J.L. Charlou, REEand U in high temperature solutions from the EPR 13°N hydrothermalvent field, Nature 303 (1983) 795-797.

202
Moore, J.G., W.R. Normark, G.R. Hess and C.E. Meyer, Petrology of basaltfrom the East Pacific Rise near 210 north latitude, J. Res. U.S.Geol. Survey 5 (1977) 753-759.
Mottl, M., Metabasalts, axial hot springs, and the structure ofhydrothermal systems at mid-ocean ridges, Geol. Soc. Am. Bull. 94(1983) 161-180.
Mottl, M. and H. Holland, Chemical exchange during hydrothermal alterationof basalt by seawater - I. Experimental results for major and minorcomponents of seawater, Geochim. Cosmochim. Acta 42 (1978) 1103-1115.
Mottl, M., H. Holland, and R. Corr, Chemical exchange during hydrothermalalteration of basalt by seawater - II. Experimental results forFe, Mn and sulfur species, Geochim. Cosmochim. Acta 43 (1979)869-884.
Niemitz, J., Geochemistry of sediments, Leg 64, Gulf of California. InCurray, J.R., Moore, D.G. et. al., Init. Repts. DSDP 64 Pt. 2:Washington (U.S. Gov't Printing Office), 695-716.
Nokleberg, W.J. and G.R. Winkler, Stratiform zinc-lead deposits in theDrenchwater Creek area, Howard Pass quadrangle, northwestern BrooksRange, Alaska, USGS Professional Paper 1209 (U.S. Gov't PrintingOffice) 1982, 22pp.
Normark, W.R., J.E. Lupton, J.W. Murray, R.A. Koski, D.A. Clague, J.L.Morton, J.R. Delaney, H.P. Johnson, Polymetallic sulfide depositsand water-column tracers of active hydrothermal vents on thesouthern Juan de Fuca ridge, Marine Technology Society Journal 16(1982) 46-53.
Ohmoto, H. and R.O. Rye, Hydrogen and oxygen isotopic compositions of fluidinclusions in the Kuroko deposits, Japan, Econ. Geol. 69 (1974)947-953.
Oudin, E., Etudes mineralogique et geochimique des depots sulfuressous-marins actuels de la ride est - pacifique (21°N) Documents duBRGM #25 (1981) 241 pp.
Oudin, E., Hydrothermal sulfide deposits of the East Pacific Rise (210N)part I: descriptive mineralogy, Marine Mining 4 (1983) 39-72.
Piper, D.Z., Origin of metalliferous sediments from the East Pacific Rise,Earth Planet. Sci. Lett. 19 (1973) 75-82.
Quinb:y-Hunt, M.S. and K.K. Turekian, Distribution of elements in sea water,EOS 16 (1983) 130-131.
Riedesel, M., J.A. Orcutt, K.C. Macdonald, J.S. McClain, Microearthquakesin the black smoker hydrothermal field, East Pacific Rise at 210N,Journal of Geophysical Research 87 (1982) 10613-10623.

203
Riley, J.P. and G. Skirrow (editors) Chemical Oceanography, vol. 1,Academic Press, New York (1965) 712 pp.
RISE Project Group, East Pacific Rise: Hot springs and geophysicalexperiments, Science 207 (1980) 1421-1433.
Seyfried, W. and J. Bischoff, Hydrothermal transport of heavy metals byseawater: the role of seawater/basalt ratio, Earth Planet. Sci.Lett. 34 (1977) 71-77.
SeyfrLed, W. and W. Dibble, Seawater-peridotite interaction at 3000C and500 bars: implications for the origin of oceanic serpentinites,Geochim. Cosmochim. Acta 44 (1980) 309-321.
Seyfried, W. and M. Mottl, Origin of submarine metal-rich hydrothermalsolutions: experimental basalt-seawater interaction in a seawaterdominated system at 3000 C 500 bars in Proceedings of the SecondInternational Symposium on Water-Rock Interaction, ed. by Paquet andTardy, Strasbourg, France (1977) IV 173-IV 180.
Seyfried, W. and M. Mottl, Hydrothermal alteration of basalt by seawaterunder seawater-dominated conditions, Geochim. Cosmochim. Acta 46(1982) 985-1002.
Shanks, W.C. III, J.L. Bischoff and R.J. Rosenbauer, Seawater sulfatereduction and sulfur isotope fractionation in basaltic systems:interaction of seawater with fayalite and magnetite at 200-3500C,Geochim. Cosmochim. Acta 45 (1981) 1977-1995.
Shanks, W.C. and J. Niemitz, 1982, Sulfur isotope studies of hydrothermalanhydrite and pyrite, Deep Sea Drilling Project Leg 64, GuaymasBasin, Gulf of California. In Curray, J.R. Moore, D.G., et.al.,Init. Repts. DSDP 64, Pt. 2: Washington (U.S. Gov't PrintingOffice), 1137-1142.
Simoneit, B.R.T., Hydrothermal petroleum sampled by DSRV Alvin in Gulf ofCalifornia, EOS 63 (1982) 1015.
Simoneit, B.R.T. and O.E. Kawka, Hydrothermal petroleum from diatomites inthe Gulf of California, in Marine Petroleum Source Rock Conference,the Royal Society, London (1983) in press.
Simoneit, B.R.T. and P.F. Lonsdale, Hydrothermal petroleum in mineralizedmounds at the seabed of Guaymas Basin, Nature 295 (1982) 198-202.
Sleep, N.H., J.L. Morton, L.E. Burns and T.J. Wolery, Geophysicalconstraints on the volume of hydrothermal flow at ridge axes, inNATO-ARI volume Hydrothermal Processes at Seafloor SpreadingCenters, ed. by P.A. Rona, Plenum Press (1983) in press.
Sleep, N.H. and T.J. Wolery, Egress of hot water from midocean ridgehydrothermal systems: some thermal constraints, J. Geophys. Res. 83(1978) 5913-5922.

204
Solorzano, L., Determination of ammonia in natural waters by thephenolhypochlorite method, Limnol. Ocean. 14 (1969) 799-801.
Stein, V.B., E. Canelli and A.H. Richards, Determination of arsenic inpotable, fresh and estuarine water by flameless atomic absorption,Atomic Spectroscopy, 1 (1980) 133-137.
Stookey, L.L., Ferrozine: A new spectrophotometric reagent for iron,Analytical Chemistry 42 (1970) 779-781.
Strickland, J.D.H. and T.R. Parsons, A Practical Handbook of SeawaterAnalysis, Fisheries Research Board of Canada, Bulletin 167,Ottawa (1968) 311pp.
Styrt, M.M., A.J. Brackmann, H.D. Holland, B.C. Clark, V. Pisutha-Arnond,C.S. Eldridge and H. Ohmoto, The mineralogy and the isotopiccomposition of sulfur in hydrothermal sulfide/sulfate depositson the East Pacific Rise, 210N latitude, Earth Planet. Sci. Lett.53 (1981) 382-390.
Uchida, H., Y. Shimoishi and K. Toei, Gas chromatographic determination ofselenium (-II,O), -(IV), and -(VI) in natural waters, Environ. Sci.Technol. 14 (1980) 541-544.
van Andel, Tj.H., Recent marine sediments of Gulf of California, in MarineGeology of the Gulf of California, ed. by Tj.H. van Andel and G.G.Shorr, Am. Assoc. Pet. Geol. Mem. 3 (1964) 216-310.
Warner, T.B., Electrode determination of fluoride in ill-characterizednatural waters, Water Research 5 (1971) 459-465.
Wedepohl, K.H., Handbook of Geochemistry, Springer-Verlag, New York, 1969.
Weiss, R.F., Hydrothermal manganese in the deep sea: scavenging residencetime and Mn/3He relationahips, Earth Planet. Sci. Lett. 37 (1977)257-262.
Welhan, J.A. and H. Craig, Methane, hydrogen and helium in hydrothermalfluids at 210 N on the East Pacific Rise in NATO-ARI volume,Hydrothermal Processes at Seafloor Spreading Centers, ed. by P.A.Rona, Plenum Press (1983) in press.
Williams, D.L., Heat loss and hydrothermal circulation due to sea-floorspreading, M.I.T.-W.H.O.I. unpublished Ph.D. thesis (1974) 139 pp.
Williams, D.L., K. Becker, L.A. Lawver and R.P. Von Herzen, Heat flow atthe spreading centers of the Guaymas Basin, Gulf of California,Journal of Geophysical Research 84 (1979) 6757-6769.
Wolery, T. and N. Sleep, Hydrothermal circulation and geochemical flux atmid-ocean ridges, Journal of Geophysical Research 84 (1976) 249-275.

205
APPENDIX 1 - Sample Collection and Treatment
Sample Collection
The samples discussed in this thesis were collected primarily on two
cruises: Pluto IV in November 1981 on the R/V Melville with the DSR/V
Alvin / R/V Lulu to 210 N and Pluto VI in December 1981-January 1982 on the
R/V E.B. Scripps with the DSR/V Alvin / R/V Lulu to Guaymas Basin.
Occasional reference is made to samples collected in November 1979 on the
R/V Gilliss with the DSR/V Alvin / R/V Lulu to 21 N.
The 1979 cruise utilized samplers developed by J. Archuleta for the
Los Alamos Hot Dry Rock project. These were stainless steel bottles of
approximately 750 ml capacity which had been gold plated on the inside.
They were evacuated prior to deployment and had to be rigidly mounted on
the basket of the submersible. Therefore the entire submersible had to be
manuevered to position their small (1/4") inlet valves into the hot water,
making sampling extremely difficult. In a series of five dives fourteen
samples were collected all of which were mixtures of ambient seawater and
hydrothermal solution with only two of the samples containing greater than
50% hydrothermal solution.
Based on the sampling experience gained in the 1979 dives new samplers
were developed for the 1981 dives at 210 N and were used again at Guaymas.
The samplers were designed by Barrie Walden of the Alvin Group at Woods
Hole. The sampler is basically of a syringe type. The piston is held
forward in the bottle by a spring and held in place by a pin. There is an
actuator on the hydraulic arm which when activated from inside the
submarine presses on the inlet valve assembly, releasing the pin and
allowing a second spring to pull the piston back, allowing the sampler to
206
fill. The inlet valve assembly is designed so that it and the snorkel may
be flushed with hydrothermal solution before the valve to the sampling
chamber is opened. There are vent holes on the top of the inlet valve
assembly and hydrothermal fluid could be seen venting from these, assuring
that the snorkel and valve were indeed flushed. Venting was allowed to
continue for 1-2 minutes before the actuator was activated, opening the
bottle. The bottles themselves took approximately one minute to fill and
were closed once the piston stem and outside spring were observed to have
stopped moving. The samplers consist of two titanium bottles each of 755
ml volume joined by a T-handle so they can be picked up and placed in the
vents by Alvin's hydraulic arm. This made sampling considerably easier as
the whole submarine did not have to be navigated so close to the vent; only
the arm with the attached sampler needed to be manuevered into the vent.
Once sampling was completed the sampler was returned to the basket on the
front of Alvin and the arm was free to perform other tasks. A long
titanium "snorkel" was placed on the inlet valves to the bottles so that
the sample could be taken from within the vent orifice before it mixed with
ambient seawater. Figure Al-I is a picture of the sampler.
The tandem sampler was designed to avoid the problems encountered in
the 1979 samples. On that cruise water from individual samplers was
divided between investigators from M.I.T., S.I.O. and O.S.U. The samples
also contained particles which had a large proportion of the iron and
copper in them. When it came time to reconstruct the solution composition
the particles caused severe budgetary problems as it was not known whether
to calculate them on the total volume of the sampler or just from the
volume remaining after the S.I.O. and O.S.U. splits were removed. Some of
the particles seemed to be completely extraneous and looked like pieces of

207
a
41.e -1
b
. .
Figure Al-l: The titanium water sampler. The barrel is 6 inches long.
a. with snorkel.b. side view.
i - -Y..
208
chimney which had been cored during sampling. The tandem design used in
1981 all1owed one sampler to go to the M.I.T. group and one sampler to go to
the S.I.O. group.
The snorkel consisted of two 1/2" titanium tubes -one leading to each
bottle - hose clamped together so that they could be placed into the vent
as a nit; the hope being that they would take identical samples. In
practice there was still some difficulty in getting the snorkel into the
chimney orifice, which is on the scale of centimeters in diameter. The
snorkels sometimes cored the chimney resulting in pieces of chimney, up to
several millimeters, being found inside the sample bottles and inlet valves
when they were disassembled for cleaning. In general, when the snorkel
could be well placed into the chimney both samples contain very little
seawater and, compositionally, are very close to each other. When the
snorkel was not well placed, one sample often contains a much larger
proportion of seawater than the other resulting in different compositions.
The bottles were not evacuated and have a 3.8 ml (0.05%) dead volume.
This dead volume had to be filled with water to prevent air from being
included in the sample and to prevent the breakout force between the front
of the piston and inner front plate of the bottle from becoming too great.
Surface seawater was used to fill this dead volume for a variety of reasons
and also was readily available in large amounts. Due to the dead volume
every hydrothermal sample contains at least 3.8 mls of seawater. It should
be noted that if the piston was not correctly seated, due to its large
surface area, an increase of 1 mm in its distance from the front plate
would increase the dead volume by 7.9 mls.
The materials for the sampler construction were of major concern since
they must be able to withstand 350 C temperatures and the corrosiveness of

209
pH=3.5 solutions, as well as be rugged enough to withstand the trip in the
submarine basket. Since a primary interest was to measure the metals iron,
copper and zinc the material also needed to be relatively clean; stainless
steel was not acceptable. The material used was titanium, which to-date
has not caused any measurable contamination. Another difficult problem was
what material to use for the seals. A seal was needed on the piston to
prevent solution from leaking behind it but this material also needed to
deform enough to slide and withstand high temperatures. A teflon omniring
was employed here and in one location on the inlet valve (where there is
another metal-metal seal as well). We thought, and later found to be true,
that because the sampler was immersed in 2 C ambient seawater it would
cool rapidly and the seals would not be heated to a full 3500 C. The
teflon seals, rated to below 300° C, showed no heat damage even after
repeated use. A red silicon o-ring (rated to below 200° C) inside the
front plate also showed no visible heat damage.
A problem was encountered with the samplers when the Guaymas solutions
were sampled. These solutions contain a large amount of gas which
apparently exsolved from the solutions as the pressure decreased during the
ascent: of the submarine. This pressure increase in the bottle apparently
forced the inlet valve open causing solution and gas to leak from the
samplers. When the samplers were opened on ship, they did not contain the
full volume of water (one sampler contained only approximately 80 mls out
of a possible 755). This loss of water and gas should not be a problem for
the species reported here (except possibly H2S), as the water in the
samplers should be well mixed. It is however a serious problem for
determining the gas concentrations.

210
Sample Treatment
Due to the length of a dive and the time involved in the recovery of
the submersible, the transfer of samplers and personnel to the escort ship
and the time actually needed to process the samplers, our samples may have
sat for a maximum of twelve hours in the sampling bottles. Our actual
"sample draw" was relatively quick, requiring only fifteen minutes per
sampler. The gas extraction of the S.I.O. samplers was somewhat slower and
our subsamples from these may have sat in the samplers for up to 18 hours.
The sample itself was divided into several aliquots shipboard at the
time of the draw. A major consideration was to keep the shipboard draw
small - <10% of the total volume to go into splits and the remainder to go
into a one liter bottle. This was to avoid the budgetary problems
encountered in the 1979 samples. If less than 10% were drawn then any
particles which might form in these fractions should also be less than or
equal to 10% of the total. Since many of the elements which might be in
the precipitates are analyzed by GFAAS, with an analytical precision of
around. 10%, the loss of these particles would be on the order of the
measurement precision and would not be important in the budgetary
calculations.
The shipboard draw proceeded as follows:
1. 100-200 mls of the sample were drawn into the one liter bottle to
flush out the tygon tubing and valves used to draw the sample.
This was to purge any oxygen out of the line as it can affect the
measurements done on the next few aliquots.
2. 3 mls were drawn into a cutoff N2 purged testtube which was capped
with no headspace (to prevent H2S oxidation) for the pH

211
measurement.
3. 30 mls were drawn into a N2 purged 25 ml erlenmeyer flask which was
capped with no headspace for the alkalinity determination.
4. 6 mls were drawn into a N2 purged weighing vial and capped with a
ground glass stopper (again with no headspace) for the H2S
determination.
5. 10 mls were drawn into a N2 purged ampoule which contained bromine
for a total sulfur measurement.
6. 15-20 mls were drawn into a 20 ml glass scintillation vial and
acidified with 100 1i 6 N IC1l for nutrient analyses.
7. The remainder of the sample was then drawn into the one liter
bottle.
At the end of the draw it was noted whether a gas phase seemed to be
present. At 210 N in most cases it was estimated to be just a few
milliliters. It was confirmed that the gas phase (if any) was
quantitatively small by adding together the volumes of the different
aliquots and comparing to the sampler volume. As mentioned above, at
Guaymas a gas phase often comprised a significant proportion of the
sample.
The pH, alkalinity and H2S were measured shipboard as soon as
possible. Extra water remaining from the pH or alkalinity measurements was
used for the silica analysis. The nutrient vials were stirred under an N2
atmosphere to expel H2S which interferes with the nutrient analyses, and
then capped.
The one liter bottles were acidified immediately with double distilled
6 N HC1. The samples which contained very little admixed seawater (<5%)
were colorless to slightly yellow. Samples which contained more seawater

212
were grey in color due to the presence of extremely fine precipitate. When
these samples were acidified, the precipitate redissolved and the solutions
became colorless to very light grey in color. The solutions were acidified
at the rate of 1 ml of acid to 250 mls of sample, resulting in a final pH
1.6.
Upon their return to the lab the bulk samples were filtered to remove
any particles which had not dissolved. All of the analyses were then done
on the filtered samples. The particles from this filtration were then
digested in 8 N HN03 and bromine.
Particles
Particles present a major problem in these hydrothermal solutions.
The particles may be either a precipitate from the solutions in the
samplers or may be from the chimney or "sediment" which was "cored" by the
snorkel during sampling. I believe the second is the source of most of the
particles found in the samplers for several reasons. First, often the
particles are several millimeters in diameter, the largest of which would
fit through the inlet valve. (The presence of a Pompeii worm in one of the
samples is evidence that material of this size can pass through the inlet
valve.) Particles of this large size seem unlikely to have precipitated
inside the sampler. In several samplers large particles were also found
inside the inlet valve assembly when the samplers were disassembled for
cleaning. Secondly, many of the very good samples (>95% hydrothermal
solution) were colorless and contained no visible particles. The samplers
which contain more entrained seawater, implying that they were difficult to
deploy and may well have cored into the chimney, contain more particles.
A potential problem comes from the immediate acidification of the one
213
liter bottle. In addition to preventing precipitation and causing
redissolution of (presumably) fresh precipitates (as evidenced by the color
change from dark to light grey or colorless), it may have caused the
dissolution of entrained particles that do not belong in the solution. The
best argument against this comes from the solution chemistry. Entrainment
of particles would be a random process, and if these particles were
quantitatively important this should be reflected by a large scatter in the
solution composition for these elements. The very mixed samples do not
fall along a mixing line (often scattering high), indicating that
entrainment of particles may be important. For those samples with Mg <5
mmoles/kg the agreement between samples within vent areas is quite good,
indicating that "foreign" particle dissolution is not a significant
problem. That any remaining resistant particles are quantitatively
unimportant was verified by measuring the digestions of the particles
filtered from solution (Table Al-1). The amount of, for example iron,
found in these particles was insignificant compared to that in the
solution.
A second group of particles is those which were found in the bottom
of the, sampler once it was disassembled for cleaning. These particles were
found in scme, but not all of the samplers. They tended to be large,
several millimeters in size and are believed to be the result of coring as
discussed earlier. This group of particles was not analyzed.

214
Table Al-I: Particle Digestion Analyses
ConcArea Element Wt Part Part
Soln(g) Soln(jM)Fe 42.34 0.06Cu 0Zn 0.05
Amb
SW
SW
NGS
NGS
OBS
OBS
Fe
CuZnFeCuZnFeCuZn
Fe
CuZnFe
CuZn
Fe
CuZnFe
CuZn
56.61
60.11
49.38
48.26
48.97
3.80
i.0
43
11
29
71
26
114
25
12
58
29
13
87
44.38 11568
125
50.41 11979
112
NormalizedPart Conc
(iM/kg)0.0040
0.003
0.30
0.073.40.92.3
4.61.7
7.5
1.6
0.83.71.9
0.95.6
6.74.07.3
8.05.27.4
51.53 11667
186
55.19 15479
100
52.80 5612
1.2
50.54 26221
50
48.35 4125
5.247.26 29
0.5
8.04.6
13
11
5.77.3
7.21.5
0.1527
2.25.1
10
6.1
1.3
9.0
0.16
2452 246036 40
99239746
107
50
0
1.0173
1.1
3679
0.1
19
79
0.219
112
240852
114
57
1.51.1
2003.3
41
89
6.220
88
19
Sample
CDW Blank
210 NORTH1153-7
1149-7
1150-11
1155-1
1155-18
1158-11
1158-16
SolnComp
(uM/kg)0
0
0
0
0
0.4736
7.7
74
76011
99
8540
40856
0
39
1679
44
112
1697
43
114
f Part
+ Soln(pM/kg)
0
0
0
0.30
0.5739
8.676
76513
106
8560.8
44
8580.9
45
168648
119
170548
121
1160-6
1160-16
GUAYMAS1173-6
1175-16
1177-6
1177-13
HG
HG
2
3
4
4
Fe
CuZnFe
CuZn
Fe
CuZnFe
CuZnFe
CuZnFeCuZn
__

215
APPENDIX 2 - Analytical Methods
The measured species are listed in Table A2-1 along with the method
used for the determination. This appendix is organized according to the
method used: potentiometry, colorimetry, ion chromatography, gas
chromatography, flame atomic absorption spectrophotometry or graphite
furnace atomic absorption spectrophotometry. Shipboard analyses are
specifically noted.
Potentiometric
The species H+ (as pH), chloride, and fluoride and calcium-magnesium
(in the 1979 samples) were determined by a vriety of potentiometric and
titration methods.
pH: pH was determined using a Corning Model 130 pH Meter with an
Altex (Beckman) Futura glass combination pH electrode. All pH
measurements were done shipboard at room temperature. The electrode was
calibrated with pH=4, 7 and 10 buffers before, and usually after, the pH in
the samples was measured. (All measurements were taken in millivolts.)
The pH measurements were made immediately. It was one of the first
aliquots taken during the draw and was often measured while the draw
continued. As the samples contain millimolar levels of H2S, the oxidation
of which will lower the pH, it was important to keep air out of the sample.
It was drawn into a nitrogen purged cut off testtube (volume 3 mls)
containing a small magnetic stir bar and capped by displacing some of the
solution (i.e. no headspace). A Nalgene hollow plastic stopper with the
bottom cut out was slipped over the electrode and provided a tight seal
when the electrode was placed in the solution. The electrode occupied a
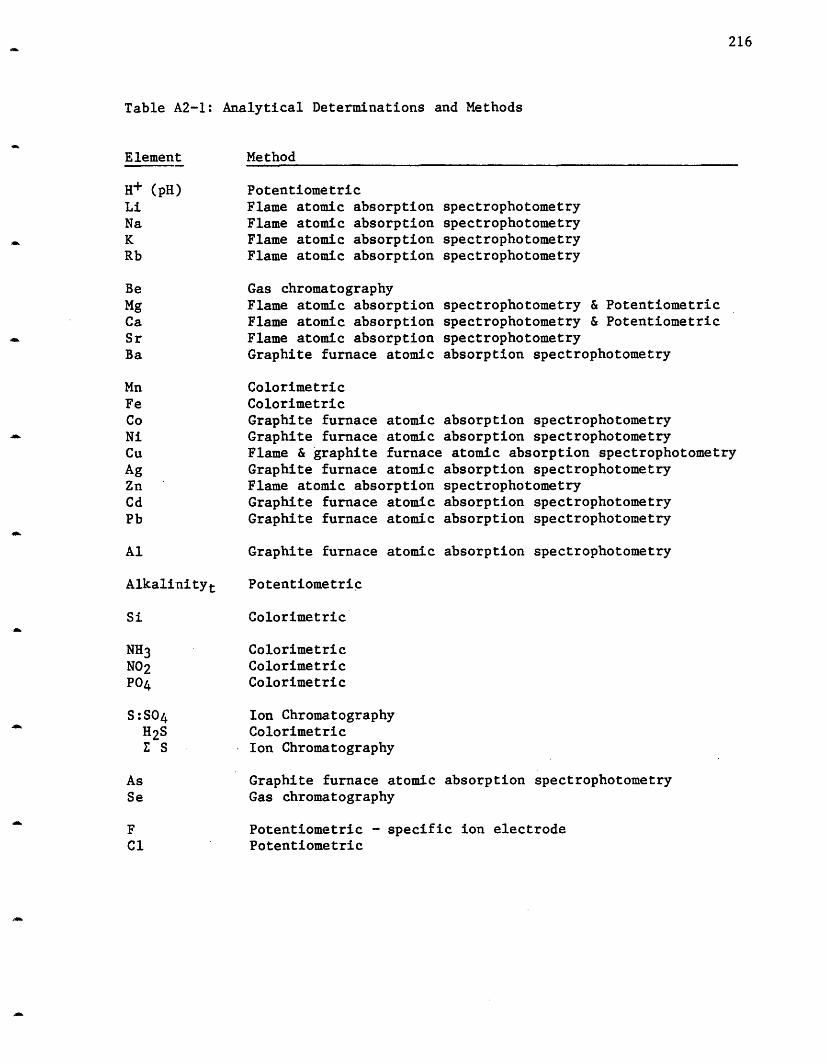
216
Table A2-1: Analytical Determinations and Methods
Element Method
H+ (pH) PotentiometricLi Flame atomic absorption spectrophotometryNa Flame atomic absorption spectrophotometryK Flame atomic absorption spectrophotometryRb Flame atomic absorption spectrophotometry
Be Gas chromatographyMg Flame atomic absorption spectrophotometry & PotentiometricCa Flame atomic absorption spectrophotometry & PotentiometricSr Flame atomic absorption spectrophotometryBa Graphite furnace atomic absorption spectrophotometry
Mn ColorimetricFe ColorimetricCo Graphite furnace atomic absorption spectrophotometryNi Graphite furnace atomic absorption spectrophotometryCu Flame & graphite furnace atomic absorption spectrophotometryAg Graphite furnace atomic absorption spectrophotometryZn Flame atomic absorption spectrophotometryCd Graphite furnace atomic absorption spectrophotometry
Pb Graphite furnace atomic absorption spectrophotometry
Al Graphite furnace atomic absorption spectrophotometry
Alkalinity t Potentiometric
Si Colorimetric
NH3 ColorimetricN02 ColorimetricP04 Colorimetric
S:S04 Ion ChromatographyH2S Colorimetric
S Ion Chromatography
As Graphite furnace atomic absorption spectrophotometrySe Gas chromatography
F Potentiometric - specific ion electrodeC1 Potentiometric

217
large volume of the tube, thus solution was displaced and no headspace was
present. The solution was stirred until a stable reading was achieved (at
most a few minutes). On a few samples where air was entrained a rapid drop
in the pH was observed.
Alkalinity: Alkalinity was determined shipboard using the same
electrode and pH meter as above. A Gilmont 2.5 ml total volume
microburette with a metal body and a glass plunger was used to add the
acid. The measurement was done on a 20 ml aliquot (dispensed from a glass
pipet) under a nitrogen atmosphere to prevent H2S oxidation which would
lower the alkalinity. For the Guaymas samples the acid was nominally 1 N
HC1 while for 21° N the concentration was nominally 0.1 N. A Gran plot
method was used to determine the endpoint. All alkalinities measured are
total alkalinities. The error on the 21° N alkalinities is, except in a
very few cases better than +10 ueq/liter. For very low alkalinities this
results in a precision of +5% while for the higher alkalinities the error
is a few tenths of a percent. The precision for the Guaymas samples is
better than +0.4 %.
Chloride: Chloride was determined using a potentiometric method based
on the silver nitrate titration and is the method used by Gieskes (personal
communication). Essentially the method makes use of a bucking potential
created by a 1.5 V battery and a potentiometer. A silver wire is implanted
in a ncroburette containing the AgNO3 solution. Another silver wire is
placed. in the beaker containing the sample solution and silver ions
therefore creating a Ag(s)lAg+[ (titrant)-Cl-(soln) I Ag '(titrant)l Ag(s)
cell and the potentiometer is used to match the potential in the cell. A
series of additions of AgNO3 is made and the endpoint is the largest jump
in potential which occurs for a given addition size. _~PSO seawater is

218
used to standardize the AgNO3 titrant. 0.5 ml of sample are needed per
determination and the precision is +0.05%.
F:luoride: Fluoride was determined only on the samples collected in
1979. The 'pH meter mentioned above was used in conjunction with an Orion
specific ion electrode and single reference electrode. The method of
Warner (1971) was used, but was modified so that the Gran plot method could
be used (Liberti and Mascini, 1969). Analytical precision is +5%.
Calcium-Magnesium: In the 1979 samples calcium and magnesium were
determined by titration with EDTA and EGTA (Lebel and Poisson, 1976). The
sum of Mg+Ca+Sr present is measured by the EDTA titration, using a
potent:ometric endpoint. Calcium alone is determined by the EGTA titration
using GHA (Gloxal-bis (2-hydroxyanil)) as the indicator for a colorimetric
endpoint. Analytical precision is +0.2%.
Colorimetric
Manganese, iron, silica, hydrogen sulfide, ammonium, phosphate and
nitrite were determined colorimetrically. A Perkin Elmer Model 55
Spectrophotometer was used in conjunction with either a 1 cm flow cell and
"sipper system" or a 4 cm (-3 ml volume) cell (both cells are quartz). The
Guaymas H2S analyses were analyzed on a Gilford spectrophotometer
with a 1 cm flow cell and sipper system.
Manganese: Manganese was determined by the formaldoxime method
(Brewer and Spencer, 1971) which is specific for Mn2+, the form in which it
should be present in these samples. The level of iron interference found
by Hudson (1980) in similar solutions would be <1% of the manganese signal
at the dilutions at which these samples were analyzed. No correction was
made for an iron interference at this level. Those samples with Mn >100
219
imoles/kg were measured in a 1 cm cell with an analytical precision 0.5 %
and a detection limit of -20 moles/kg. Samples with Mn <100 moles/kg
were measured in a 4 cm cell with an analytical precision 2% and a
detection limit 1 Pmole/kg.
Iron: Iron was determined by the ferrozine method (Stookey, 1970)
which is specific for Fe2+. The method was used with the modification of
Hudson (1980) where the hydroxylamine hydrochloride reduction of Fe(III) to
Fe(II) is done by heating in a 60 C oven rather than boiling. The method
was further modified by heating the samples for at least one hour and often
longer (no difference was noted with increased time) in capped vials.
Since everything was done volumetrically with Eppendorf or Finn pipets and
a repipet and the vials capped, the final volumes did not have to be
adjusted for variable loss during heating. Samples with Fe >50 moles/kg
were measured in a 1 cm cell with an analytical precision of <1% and a
detection limit of -20 moles/kg. Samples with Fe <50 moles/kg were
measured in a 4 cm cell with an analytical precision =2 % and a detection
limit of 3 moles/kg.
Silica: Silica was measured by the silicomolybdate method (Strickland
and Parsons, 1968). At 21 N all of the samples were diluted to <66
pmoles/kg (to keep the absorbance below 0.75 absorbance units). The
samples were also acidified with distilled 6 N HC1 to pH-1.6 to slow the
polymerization of silica as this method will measure only the monomeric and
dimeric forms. At 210 N the measurements were made shipboard. At Guaymas
lack of time precluded measuring SiO2 shipboard. From the 1979 and 1981
210 N cruises we found that polymerization of silica to longer than the
dimeric form was very slow in our alkalinity aliquots, which we had
titrated shipboard and then brought home stored in plastic. The alkalinity

220
samples are acidified to pH-3, which is the pH at which polymerization is
the slowest (Makrides et al., 1978). The Guaymas alkalinities were
measured for silica very shortly after the cruise. Analytical precision is
around +1%.
Hydrogen Sulfide: Hydrogen sulfide was determined by the method of
Cline (1969), modified so that it could be used at millimolar levels. The
standards were prepared from Na2S'9H20 dissolved in Corning distilled water
which had been boiled and bubbled with N2. They were usually kept in glass
volumetrics or bottles that were close to full (small headspace) filled
with nitrogen and sealed with greased glass stoppers. Under these
conditions the standards were stable for at least one week and they were
standardized almost daily iodometrically. A more concentrated reagent
(maintaining the same diamine:ferric ratio) was prepared to extend the
workable range up to 10 mmoles/kg. This is a colorimetric method which can
be diluted after the color develops. The samples were diluted with
nitrogen bubbled surface seawater to bring the absorbances into the linear
range. Some of the samples were analyzed in duplicate but most were done
in triplicate. The agreement between replicates is in most cases better
than 5%. A 1 cm cell was used resulting in a detection limit of 3
Pmoles/kg. All of these analyses were done shipboard.
Ammonium: Ammonium was analyzed by the method of Solozano (1979), as
modified by Gieskes (personal communication). The best reproducibility and
lowest: blank was achieved by adding all three reagents to each sample in
quick succession, before proceeding to the next sample. The presence of
H2S prevents color development. This problem was avoided by acidifying and
stirring the samples under a N2 atmosphere before analysis. An additional
problem arises from the elevated levels of calcium present in the

221
hydrothermal solutions, which due to the high pH of the reaction causes the
precipitation of Ca(OH)2. To avoid this problem all samples were diluted
by at least a factor of two, bringing the calcium level down to the
seawater level in all cases. For the reaction to proceed a pH=9.8 is
needed and for the 210 N samples this required neutralization with sodium
hydroxide. The 210 N samples were run shipboard. The Guaymas samples were
run in the lab 1 year after collection. During that time they were stored
acidified in glass, tightly capped vials. They contained high levels of
ammonia requiring a large dilution factor (-200 times), obviating the need
for neutralization. The Guaymas samples have a precision of better than
+3%. A signal was barely discernible in the 21 N samples. The blank,
seawater, which had been treated exactly as the samples (acidified, stirred
and stored) gave the same absorbance as the reagent blank. The detection
limit was -3 moles/kg.
Phosphate: Phosphate was analyzed shipboard on only a few of the 21 N
samples according to the method of Strickland and Parsons (1968). It was
not analyzed on the Guaymas samples.
Nitrite: Nitrite was analyzed shipboard on only a few of the 21 N
samples according to the method of Strickland and Parsons (1968). It was
not analyzed on the Guaymas samples.
Ion Chromatography
Sulfate (and total sulfur as sulfate) was the only species measured by
ion chromatography. A Wescan Model 262 ion analyzer with 269-001 anion
column and a 100 pl sample injection loop was used for the analysis. The
eluant solution was 4 mM potassium phthlate adjusted to pH=4.5 with KOH.
The analyses were done on 100 fold dilutions in the case of the sulfates
and 250 times dilutions in the case of total sulfur as sulfate. The larger

222
dilution was used to keep the amount of bromine passing through the machine
to a minimum because these solutions came from the bromine containing
ampoules. For the sulfates the peak height was measured by hand while for
the total sulfur an Hewlett-Packard Model 3390A integrator was used. IAPSO
seawater was also analyzed and the samples were normalized to this, based
on the salinity of an ambient sample. Analytical precision is better than
+1%.
Gas Chromatography
Beryllium and selenium were measured by gas chromatographic methods.
Beryllium: Beryllium was analyzed by the method of Measures and
Edmond (1982,1983). This method is based on the electron capture detection
of the volatile trifluoroacetylacetonate complex of beryllium. Analytical
precision is approximately +5%.
Selenium: Selenium was determined by the electron capture detection
of the 5-nitropiazselenol complex (Measures and Burton, 1980). Less than
0.2 nmoles/kg of Se were present in the solutions. It was however present
in the particles filtered from the acidified samples, presumably as Se°.
As this method is specific for Se4+, the Se was oxidized to this form by
using a Br2/Br-redox couple (Uchida et al., 1980). Excess Br2 was then
reduced with hydroxylamine hydrochloride before proceeding with the
analysis. The detection limit is 1 nmole/kg and the precision +10%. Se
was also determined in the ampoules treated with Br2 which were used for
total S.
Flame Atomic Absorption Spectrophotometry
The elements lithium, sodium, potassium, rubidium, magnesium, calcium,
strontium, copper and zinc were analyzed by flame atomic absorption

223
spectrophotometry using a Perkin Elmer Model 403 spectrophotometer. All of
the above were run using an air-acetylene flame - oxidizing or reducing
depending on the recommendation in the Perkin Elmer handbook on analytical
conditions.
Lithium: The samples were diluted ten times with Corning distilled
water. To match the matrix, the standards were prepared in 50 mM NaC1.
The precision is +1% and the detection limit was 1 mole/kg absolute or 10
umoles/kg as the samples were diluted.
Sodium: The samples were diluted -20000 times with corning distilled
water to bring them into the linear range for sodium by flame a.a.s. This
dilution was done in two steps; first a hundredfold dilution (which was
used as a starting solution for many of the flame analyses) and then a two
hundredfold dilution. Potassium (in the form of KC1) was added as an
ionization suppressant to both the samples and standards, achieving a final
concentration of 25 mM in these solutions. IAPSO seawater was analyzed
with the samples to provide a check on the absolute concentration of sodium
in both samples and standards. The analytical precision is +2%.
Potassium: The samples were diluted 600 times to bring them into the
linear range for flame a.a.s. analysis. This was a 100 times followed by a
6 times dilution. The samples and standards were made 20 mM in sodium (as
NaCl) to prevent variable ionization effects. IAPSO seawater was again
analyzed with the samples. The analytical precision is slightly better
than +1%.
Rubidium: The samples were diluted 6.7 times to prevent salt from
becoming a problem in the nebulizer and burner while still assuring a good
rubidium signal. The standards were prepared with NaC1 to match the sodium
concentrations in the sample to prevent ionization effects. As these

224
dilutions were also used for strontium a lanthanum solution was added to
the samples as well. The lanthanum helps prevent interference effects from
silicon, aluminum, phosphate and sulfate in the determination of the
alkaline earths. The final concentration of lanthanum in the samples and
standards was 72 mM. An electrodeless discharge lamp was used and the
analytical precision is 3%.
Magnesium: The magnesium analyses were done on 4000 times dilutions
of the original sample. Lanthanum was added to the samples in the same
proportions as noted above. Due to the low levels of magnesium present in
some of the samples and the high dilution factor, all of the samples with
Mg <2.5 mmoles/kg were rerun at a 400 times dilution to increase the
absorbances. No significant differences were found between the two runs.
IAPSO was analyzed in both cases. Analytical precision is better than +1%.
Calcium: Calcium was analyzed on a 300 times dilution of the sample.
Lanthanum, as above, was added to the solutions. IAPSO seawater was
analyzed along with the samples. Analytical precision is better than +1%.
Strontium: Strontium was analyzed on the 6.7 times dilution used above
for rubidium. Lanthanum had been added to these solutions. Analytical
precision is +1%.
Copper: Copper was determined on the same dilution used for rubidium
and strontium and, as a result, the solutions also contained lanthanum.
The standards were prepared to match the lanthanum, salt and acid
composition of the samples. The detection limit was 2 moles/kg and the
precision was +2%. The NGS and Guaymas samples were below the detection
limits for flame a.a.s. and were analyzed by graphite furnace a.a.s. (as
were the particle solutions).
Ziac: Zinc was determined on the ten times dilutions used for the

225
lithium determinations. The standards were prepared to match the 50 mM
NaCl content of the samples. Analytical precision is 5% and the detection
limit is 0.05 moles/kg.
Graphite Furnace Atomic Absorption Spectrophotometry
The elements silver, aluminum, arsenic, barium, cadmium, cobalt,
copper, nickel and lead were analyzed by graphite furnace atomic absorption
spectrophotometry. (Most of the copper analyses were done by flame a.a.s.,
only those with Cu <1 M were analyzed using the graphite furnace.) Barium
and copper in the solutions were analyzed on a Perkin Elmer Model 5000
Spectrophotometer with an HGA 400 furnace and AS-1 autosampler. All of the
other elements as well as barium and copper in the particle digests were
analyzed on a Perkin Elmer Zeeman Model 5000 Spectrophotometer with an HGA
500 furnace and AS-40 autosampler. Hollow cathode lamps were used as the
light source for silver, aluminum, barium, cobalt, copper and nickel.
Electrodeless discharge lamps were used for arsenic, cadmium and lead. Two
injections were done from each cup and the results averaged. The
spectrophotometers were run in concentration mode usually with a ten times
expansion factor. The wavelength was peaked manually. Injection sizes
ranging from 10 to 30 p1 were used on the AS-40 and either 10 or 20
injections were used on the AS-1.
The Zeeman-5000 was equipped with a Perkin Elmer Model 3600 data
station which was used during methods development to graphically watch the
peaks during atomization. This simplified optimization of parameters such
as char and atomization temperatures and times. No coprecipitation or
separation methods were used therefore seasalt was present in all samples.
Optimization of conditions and detection limit therefore became a trade-off
226
between how much the sample could be diluted and still give a signal and
how much seasalt the machine could handle. Several elements were attempted
directly, others were diluted a minimum of four times. The preferred
dilution was at least ten times, if a signal could be resolved.
Two matrix modifiers were used to aid in reducing the salt
interference. Ascorbic acid, prepared fresh almost daily, was added to the
samples to have a final concentration of 1% by weight as the sample was
injected into the graphite tube. Ascorbic acid was not found to have a
significant blank for any of the analyzed elements except cadmium. It was
not used in the cadmium determinations. Ascorbic acid aids atomization by
changing the wetting properties of the sample, causing it to spread out
more inside the graphite tube. It therefore aids in keeping the size of
any salt crystals which form small, resulting in a more even char and
atomization. NH4N03 was the second modifier used and has a chemical
effect. The amount added to the solution was enough to insure that an
excess of ammonia with respect to chloride was present as the sample was
injected into the tube. The ammonia combines with the chloride resulting
in loss of this salt during the char step, leaving an excess of nitrate
behind. Nitrate salts are stable to higher temperatures than are
chlorides, and the purpose is to have the element of interest form the
nitrate salt and which will not be lost during the char but will remain
stable until a higher atomization temperature is reached. This would allow
separation of the element of interest from the salt matrix if the char can
be raised to 14000 C. Neither the ascorbic acid nor the ammonium nitrate
works ideally but the use of one or both of these modifiers will often
significantly improve the results. All of the samples were diluted with a
dilute HN03 matrix, to increase the amount of available nitrate. The

227
concentration of the dilueant was either 0.05% or 0.2% HNO3 (w/w).
On the Perkin Elmer 5000 a deuterium arc lamp was used to provide
background correction in the ultraviolet region and a tungsten halide lamp
was used in the visible region (for barium). On the Zeeman-5000, the
Zeeman effect, created by a strong magnetic field during atomization was
used for background correction. For both instruments argon was used as the
purge gas.
For all analyses (unless otherwise noted) a Perkin Elmer pre-pyrolized
tube (PE 290-1821), which is a style only recently introduced was used.
These tubes were found to have greater stability and longer life than
either "home" pyrolized tubes or the older style of Perkin Elmer
pre-pyrolized tubes.
The hydrothermal samples are rather unique compositionally and it was
difficult to match the matrix of the standards to that of the samples.
Other species besides those usually present in seawater were important was
shown by preparing standard additions in surface seawater and in the
samples. In the case of many elements, the slopes did not agree. The data
station provided further proof of differences in speciation between the
matrices. Observation of absorbance changes during atomization of the peak
of interest often had a different characteristic shape or came off at a
slightly different time with the same machine parameters. Since the
matrices could not be matched, the method of standard additions was used
for many of the samples. Two additions (10 pl and 20 1) were made on each
sample resulting in a three point curve. As the sample size was 1000 1i
the size of the addition was within the precision of the measurement. The
aim (not always achieved) was to have a 45° slope from the additions which
would give the greatest resolution in calculating the composition of the

228
unknown. Since standard additions had to be used for most of the GFAAS
analyses, the precision is worse (> +10%) than for the other analyses. All
of the standard addition analyses were run at least in duplicate.
Silver: Silver was analyzed on a 12 times dilution with the addition
of ascorbic acid. The method of standard additions was used. Silver was
charred at 800 C and atomized at 27500 C with a 0 second ramp time
(maximum power heating = MPH) using a 25 p1 injection. For the Guaymas
samples and some of the lower concentration 210 N samples the dilution
factor was reduced to 4.4 or 6.5 times. The dilutant was 0.05% HN03.
Samples were run until the results of the standard additions agreed within
+10%.
Aluminum: Aluminum was analyzed on either an 11, 22 or 46 times
dilution depending on the sample concentration. Standard additions were
not used because adding surface seawater to the standards was sufficient to
match the matrices, based on standard additions to both. A monitor was run
every fourth sample and a full standard curve at the beginning and end of
every tray of 30 samples so that the run could be drift corrected. The
conditions were a 1500 C char and 2700 C MPH atomization and a 25 I
injection. Ascorbic acid was added to all samples which were diluted with
0.05% HN03. Duplicates within a run agreed to +3% while duplicates between
runs agreed within +10%.
Arsenic: Arsenic was analyzed by the method of standard additions
with the addition of ascorbic acid. Nickel was also added to the solutions
as recommended by Stein et al. (1980). The addition of nickel stabilizes
the arsenic and allowed the char temperature to be raised to 1400 C,
removing the seasalt. Arsenic was atomized at 27000 C MPH with a 30 i
injection size. The samples were made 450 M in nickel as opposed to the

229
8.5 mM levels recommended by Stein et al. (1980). Increasing the nickel
over the levels used gave no noticeable improvement in the results. 0.05%
HN03 was used as the dilueant. Replicates were rerun until at least three
agreed within +10%.
Barium: Barium in the solutions was analyzed on the Perkin Elmer
Model 5000 Spectrophotometer. Ascorbic acid was used with a 10 1
injection size. Standard additions were not needed. The char was at 15000
C and the atomization was at 28000 C MPH. Analytical precision is 10%.
Barium in the particle digest solutions was analyzed on the Zeeman-5000
with no matrix modification due to the very low seasalt present in the
particle fraction and the high dilutions (500 times) used. Analytical
precision was +10%.
Cadmium: Cadmium was analyzed by the method of standard additions with
NH4NO 3 added as a matrix modifier. It was run at either a 21 or 41 times
dilution with 0.2% HN03 as the dilutant. The program included a char at
600 C and atomization at 25000 C MPH. The analytical precision is +5%.
Cobalt: Cobalt was analyzed by the method of standard additions with
both H4NO3 and ascorbic acid added as matrix modifiers. A 25 1 injection
was used with a char of 14000 C and atomization at 27000 C MPH. 0.2% HN03
was used as the dilueant and the dilution factor was either 4.5 or 12
times. The samples were rerun until replicates agreed within +10%.
Copper: Only those samples with copper <1 mole/kg were analyzed with
the 5000. Copper in the particle digests were analyzed on the Zeeman-5000.
The other samples were analyzed by flame a.a.s. For the solutions a 40
fold dilution factor was used and ascorbic acid was added to the solutions.
The analytical precision was +5%. For the particle digests copper was
diluted 1000 times and no matrix modifiers were used. Analytical precision
230
is +1C%.
Nickel: Nickel was analyzed on the Zeeman-5000 using the 3600 data
station to observe the peaks. Both ascorbic acid and NH4NO3 were used as
matrix modifiers. A char of 11000 C and atomization of 2700 C MPH with an
injection size of 20 pl were used. Several dilutions were used and the
samples were finally injected directly. No signal above the background was
observed.
Lead: Lead was analyzed on a 20 1 injection with an 800 C char and
26000 C MPH atomization, using the method of standard additions. Ascorbic
acid and NH4NO3 were used as matrix modifiers. 0.2% HN03 was used as the
dilutant and the dilution factors were 12, 23 and 45 times. The
reproducibility between samples was not good and each sample was rerun
until the agreement between replicates was at least +20%.
Selenium: An attempt was made to measure selenium on the Zeeman-5000
with an EDL light source but no signal was observed. The selenium
concentration in the samples is <1 mole/kg.
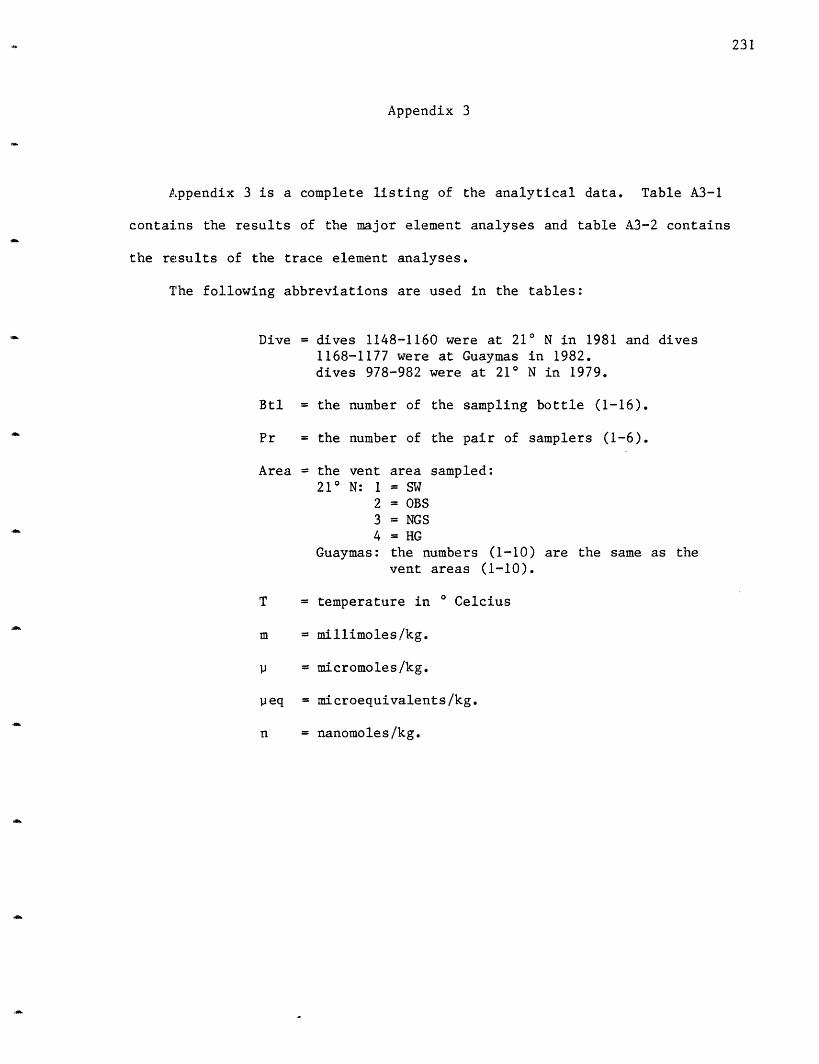
231
Appendix 3
Appendix 3 is a complete listing of the analytical data. Table A3-1
contains the results of the major element analyses and table A3-2 contains
the results of the trace element analyses.
The following abbreviations are used in the tables:
Dive = dives 1148-1160 were at 21° N in 1981 and dives1168-1177 were at Guaymas in 1982.dives 978-982 were at 210 N in 1979.
Btl = the number of the sampling bottle (1-16).
Pr = the number of the pair of samplers (1-6).
Area = the vent area sampled:210 N: 1 = SW
2 = OBS
3 = NGS4 HG
Guaymas: the numbers (1-10) are the same as the
vent areas (1-10).
T = temperature in Celcius
m = millimoles/kg.
= micromoles/kg.
peq = microequivalents/kg.
n = nanomoles/kg.

232
TABLE A3-1
NaDive Btl Pr Are t Mg S102 Li eas calc K Rb Be Ca Sr B pH Alkt C1 S04 H2S Nl4 002 P04
.C u n u a a u a u u ' eq a s U S u
1149 1 0 1 2.13 16.651149 2 0 1 1.92 16.401149 3 1 1 353 1.461149 4 I 1 353 51.04 0.771149 6 5 1 3.74 16.211149 7 2 1 346 4.76 15.871149 8 2 1 346 7.05 15.291149 9 3 1 346 4.09 16.061149 11 4 1 355 2.01 16.651149 12 4 1 355 2.29 16.701149 13 5 1 5.67 15.77
1150 1 0 1 350 2.07 16.601150 2 0 1 350 4.33 15.831150 3 4 1 350 2.68 16.451150 6 1 1 350 43.35 3.281150 6 5 1 350 3.74 16.401150 7 2 1 350 44.73 3.121150 9 3 1 350 13.00 10.471150 10 2 1 3501150 11 4 1 350 1.03 17.091150 13 5 1 350 6.55 14.951150 15 3 1 350 24.93 7.501150 17 1 1 350 46.65 2.29
1151 4 1 3 273 8.68 16.011151 5 2 3 273 20.02 12.271151 6 3 3 273 2.90 18.691151 14 2 3 273 17.21 12.511151 15 3 3 273 3.12 18.281151 17 1 3 273 8.73 16.40
1152 1 0 2 351 8.05 15.001152 2 0 2 351 7.70 14.801152 3 2 2 351 5.11 15.681152 5 3 2 351 42.55 3.141152 7 5 2 351 2.08 16.891152 9 3 2 351 45.94 2.381152 10 1 2 351 2.27 16.791152 11 1 2 351 1.44 17.231152 12 4 2 3511152 13 5 2 351 3.10 16.401152 16 2 2 351 6.75 15.241152 18 4 2 351 9.85 14.12
865 437426
61 459843 433828 443
435836 439870 437
435426
873 438439436
183 462853 443172 462698 442
885 436433457462
438 22.8 2722.5
464 10.6 1438 22.8 25439 22.4 25
21.6440 22.4 26439 22.7 27
22.522.1
438 22.8 2722.322.6
464 12.3 6439 22.4 26463 12.0 6448 19.8 21
15.6 82 6.0 3.7317.4 3.86
10.6 86 6.8515.4 81 4.0 3.7617.5 92 3.7 3.7317.116.2 85 4.2 3.8115.9 83 7.8 3.8016.015.4
15.815.915.911.615.812.720.2
437 22.7 27 9.4 16.021.5 15.717.8 17.512.0 12.6
864 500 503 22.4 26 31.1498 20.4
974 507 506 24.7 29690 491 495 20.2 21
513 25.4506 23.9
754 433 436 20.8 25435 21.5435 22.1463 12.8
853 433 433 21.8 26135 462 465 11.3 3
434 22.9861 433 432 22.5 28
18.817.319.917.220.119.2
14.414.514.912.9
14.7 15.412.815.5
14.7 15.5
435 23.0 15.2771 435 439 21.0 14.4724 436 437 20.6 21 12.5 15.1
-218 496 1.2-21020512241 537 27.9-185 497 2.0-218 499 4.7-184-90 499 2.9
-179 498 1.1-186-159
82 6.4 3.72 -232 497 1.1
848290
108
5.99 1837 534 24.73.2 3.84 -166 499 2.2
6.03 1792 533 26.54.67 -245 507 14.5
82 9.1 3.65 -282 496
707
92
8989
4.30 22 573423
3.2 3.82 -150 5774.79 277 566
-136-20
78 3.70 -303 497-195-2371368
81 3.4 3.45 -405 49180 6.08 1763 534
-32683 4.8 3.47 -405 491
1883
7.38 0.0 0.1 1.04
0.430.385.147.464.056.536.726.585.33
0.0 0.1 3.070.0 0.2 1.000.0 0.2 1.66
0.0 0.0 1.330.0 0.2 1.00
7.93 0.07.057.782.09 0.07.33 0.01.40 0.05.88 0.0
0.6 7.72 0.07.33
0.66
4.6 5.424.18
1.2 6.929.7 4.61
5.756.38
4.3 5.906.157.231.09
1.4 6.4528.2 0.62
6.381.3 7.29
1.35
2.582.112.571.94
1.87
-267 6.613.61 -238 496 3.6 6.384.36 15 499 6.1 6.23
352 6.13 15.48270 12.36 12.14 625
2 52.83 0.16 28352 3.60 16.35 848274274 16.49 10.02 636270 21.04 10.60 496352 16.71 12.07352 9.85 13.68 742270 5.23 15.63
2270 20.91 9.52 500
442 22.4 16.3416 416 18.2 20 14.4 13.3460 9.8 1 10.3433 438 22.0 26 16.1
442 448 18.5 20424 16.6 16449 19.8435 42 20.5 22412 20.6
13.712.713.9
7.5 14.711.4 14.0
424 427 16.3 16 11.4 12.6
-72 7.5772 2.4 4.82 376 471 7.4 5.0684 0.9 540 29.382 3.86 -145 497 2.2 7.68
7875
78
2.5
74
4.81 339 510483
783.78 -185 504
15
8.7 5.4911.5
5.995.2 6.62
6.45
5.08 652 87 11.3 4.25
1154 2 2 2 151154 3 5 3 273 20.98 9.501154 4 4 3 273 16.04 11.391154 5 4 3 273 17.24 11.091154 6 5 3 273 28.75 8.351154 12 I 3 273 22.21 7.351154 14 2 2 15 51.67 0.391154 16 1 3 273 23.08 9.65
499 20.4734 496 497 20.7 22
507 21.4482 477 487 16.6 14
499 19.829 459 473 9.7 2
592 472 490 18.1
1153 5 3 11153 6 0 11153 7 5 11153 9 3 11153 10 I 11153 11 1 I1153 12 4 11153 13 2 11153 14 2 11153 15 0 11153 17 5 11153 18 4 1
17.025.2 17.4
17.716.7 14.9
16.810.616.1
90
88
8588
2274.56 150 569
2245.24 732 559
3707.30 2294 5404.98 440 562
3.82b.6 4.31
4.2016.0 2.56
3.8031.4L2.6 3.66

233
NDive tl Pr Area T Mg SiO2 tl mas cac K Rb Be Ca Sr Ba pi Alkt Cl 504 H25 94 N02 P04
C ua * u a * H n a u u peLq a .u M _
1155 1 0 3 273 2.10 18.691155 3 2 3 273 4.43 17.871155 10 1 3 273 3.40 18.211155 14 2 3 273 2.27 18.691155 15 0 3 273 2.78 18.541155 18 1 3 273 2.13 18.74
1156 3 1 21156 6 2 21156 9 3 21156 11 4 21156 12 2 21156 13 3 21156 16 1 21156 17 4 2
999 497 508 24.3 30501 24.5505 25.4
993 504 508 24.2 30519 25.7
996 491 507 24.1 31
44.55 2.91 162 45746.06 2.62 151 45625.16 8.43 479 644
15.71 12.46 44140.37 4.21 229 4536.34 15.43 436
36.4 20.219.620.120.020.5
33.6 20.1
463 11.8 5 11.4 85462 11.3 6 12.3 90452 16.3 15 7.6 13.3 82
19.3 14.2460 12.7 7 2.9 11.7
22.3 15.283
96 13.5 3.88 -130 578 0.8 6.06-44 5.94
-101 5.8397 10.5 3.78 -163 578 0.9 6.40
-134 6.0497 10.5 3.77 -164 577 0.8 6.51
5.90 1646 533 25.3 0.646.00 1728 534 26.1 1.674.94 385 518 14.3 3.40
514-110
5.64 1279 528 23.5 0.77-205 6.23
1157 2 0 1 150 32.851157 4 5 1 150 39.311157 5 5 1 150 42.741157 6 3 I 275 40.921157 7 0 1 150 18.161157 9 2 1 52 42.111157 10 4 1 52 9.211157 13 2 1 52 31.531157 14 1 1 182 44.561157 15 3 1 275 37.061157 17 1 1 182 47.761157 18 4 1 146 22.79
6.804.443.274.369.054.35
12.904.713.165.211.985.51
1158 2 5 2 1.95 17.091158 3 I 2 1.33 17.181158 6 2 2 2.31 16.941158 10 0 2 2.11 16.891158 11 0 2 1.39 17.231158 13 2 2 2.59 16.891158 14 5 2 3.91 16.351158 16 1 2 1.14 17.28
1159 1 3 1 32.63 4.031159 3 1 1 47.02 1.911159 4 4 1 44.43 3.121159 5 5 11159 7 0 1 52.98 0.291159 9 5 1 52.81 0.201159 10 0 11159 12 3 1 44.00 2.741159 15 2 1 42.08 3.191159 16 1 1 32.83 6.131159 17 * 1 47.47 1.831159 18 2 1 37.65 5.18
462 15.7 4.1 12.924 452 461 12.8 9 2.3 11.8185 456 468 11.7 5 1.5 11.4235 453 464 12.8 7 11.7619 49 447 18.7 19 6.8 14.5229 455 462 12.9 7 12.2
455 22.3 17.0 16.1460 15.5 13.1
174 459 464 11.8 6 11.3463 14.5 11.7
115 457 465 11.1 4 10.9540 451 458 17.5 16 12.8 14.2
435 22.9437 23.5
854 426 435 22.4437 23.1
879 426 432 22.5 28435 22.8
835 430 432 21.9 27869 427 431 22.5 29
371 450 457 15.1 12124 458 469 11.2 5179 448 469 12.2 6
34 45029 455
461178 451361 456110 458283 452
1160 1 3 4 241 2.25 15.04 12621160 2 2 4 350 1.96 15.141160 3 1 4 350 4.35 14.561160 5 5 4 224 2.941160 6 5 4 224 0.95 15.43 13051160 7 0 4 224 2.69 14.90 12581160 10 0 4 224 2.63 14.851160 11 2 4 350 2.00 15.19 12841160 12 3 4 241 2.60 14.901160 13 4 4 241 28.66 6081160 14 4 4 241 36.72 4.57 3851160 16 1 4 350 1.84 14.56 1281
15.315.415.215.315.315.214.815.2
1189 2.9884 1.9 5.79 1560 529 22.2 1.5791 2.2 6.02 1751 537 24.092 5.79 1629 533 22.8 1.5683 1.8 4.74 280 512 9.9 5.5485 5.92 1814 535 22.6 1.58
613 5.811220 5337 2.65
83 6.03 1917 524 24.3 1.211474 1.93
83 6.34 2073 26.082 1.8 5.22 806 12.3 4.15
80 5.8 3.51
81 5.9 3.49
79 4.6 3.5280 7.2 3.46
-343 7.70-391 7.38-352 490 1.2 7.78-353 7.15-340 491 0.8 7.38-341 5.94-338 492 2.1 6.38-390 490 0.6 7.78
11.7 79 2.0 5.42 1091 525 17.1 2.9410.8 84 1974 541 25.811.1 82 5.96 1867 541 24.0 1.28
9.8 1 10.4 85 7.37 541 29.1 0.009.8 2 10.3 86 7.58 541 29.0 0.00
11.8467 12.1 6457 14.9 13465 11.0 3460 13.5 9
438 443 22.6 32458 23.7452 23.2453 23.7432 441 23.1 33432 443 22.8 32451 23.6436 446 22.7 32450 23.8450 15.6 15451 464 13.4 9439 442 23.4 30
10.911.311.910.7
3.1 11.8
12.8 11.611.611.711.7
11.7 11.611.7 11.6
11.812.8 11.6
11.710.8
4.3 10.712.1 11.6
83 1801 534 24.180 2.0 5.42 1119 525 17.3 2.8284 2041 537 25.983 5.63 1500 528 20.8 2.20
66 5.5 3.46 -386 498 1.4 7.59-392 8.65-386 7.12
7.2165 10.4 3.38 -458 ;96 0.6 8.6165 5.6 3.48 -391 498 1.6 7.86
-353 7.4066 4.6 3.43 -391 500 1.1 8.59
-385 8.8975 523 16.4 3.1677 5.29 955 529 21.6 2.0665 7.4 3.42 -417 497 1.0 8.35
1.233.33
0.32
0.49
2.56
3.05
1.02
0.501.11
0.65
2.300.64
1.01
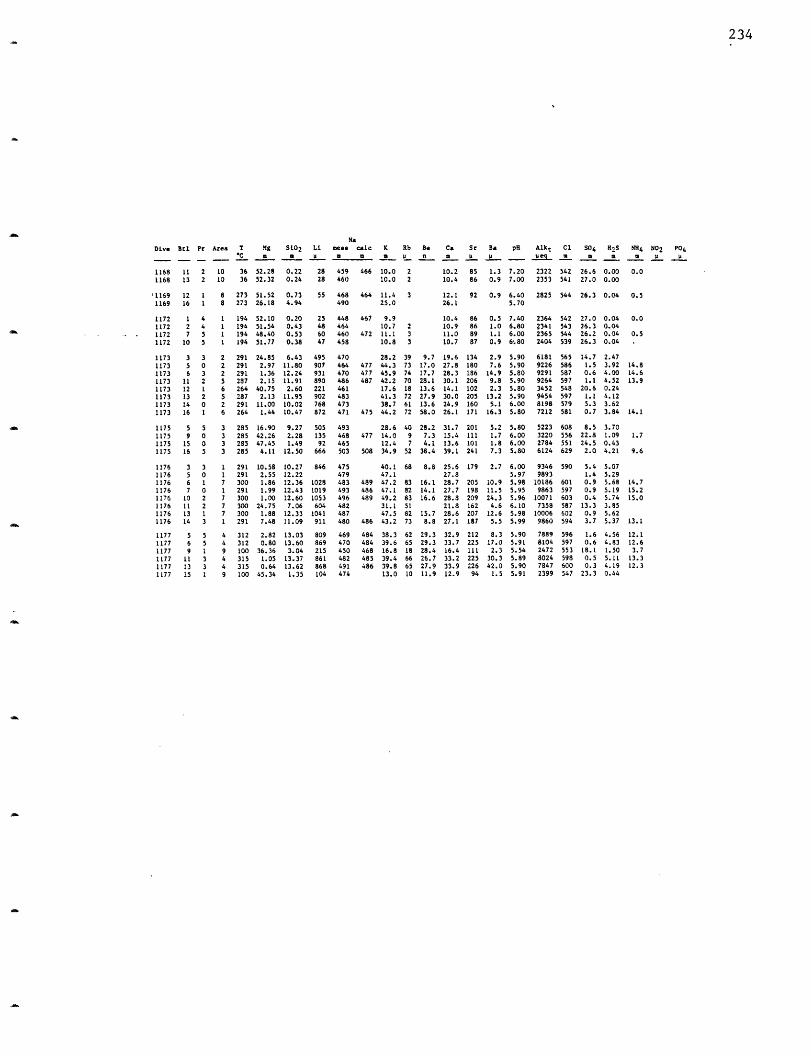
234
NaDive tl Pr Area T Mg StO 2 Li meas caIc K Rb Be Ca Sr 8 pR Alkt C1 S04 H2 S NH4 N 2 P0 4
*C Ua N U 'm I U n u ueq I U U u
1168 11 2 10 36 52.28 0.221168 13 2 10 36 52.32 0.24
!1169 12 1 8 273 51.52 0.731169 16 1 8 273 26.18 4.94
2828
55
1172 1 4 1 194 52.10 0.20 251172 2 4 1 194 51.54 0.43 481172 7 5 1 194 48.40 0.53 601172 10 5 1 194 51.77 0.38 47
1173 3 3 2 291 24.85 6.43 4951173 5 0 2 291 2.97 11.80 9071173 6 3 2 291 1.36 12.24 9311173 11 2 5 287 2.15 11.91 8901173 12 1 6 264 40.75 2.60 2211173 13 2 5 287 2.13 11.95 9021173 14 0 2 291 11.00 10.02 7681173 16 1 6 264 1.44 10.47 872
459 466 10.0 2460 10.0 2
468 464 11.4 3490 25.0
448 467 9.9464 10.7 2460 472 11.1 3458 10.8 3
470 28.2 39464 477 44.3 73470 477 45.9 74486 487 42.2 70461 17.6 18483 41.3 72473 38.7 61471 475 44.2 72
10.2 85 1.3 7.20 2322 542 26.6 0.00 0.010.4 86 0.9 7.00 2353 541 27.0 0.00
12.1 92 0.9 6.40 2825 544 26.3 0.04 0.526.1 5.70
10.4 86 0.5 7.40 2364 542 27.0 0.04 0.010.9 86 1.0 6.80 2341 543 26.3 0.0411.0 89 1.1 6.00 2365 544 26.2 0.04 0.510.7 87 0.9 6.80 2404 539 26.3 0.04
9.7 19.6 134 2.9 5.90 6181 565 14.7 2.4717.0 27.8 180 7.6 5.90 9226 586 1.5 3.9217.7 28.3 186 14.9 5.80 9291 587 0.6 4.0028.1 30.1 206 9.8 5.90 9264 597 1.1 4.5213.6 14.1 102 2.3 5.80 3452 548 20.6 0.2427.9 30.0 205 13.2 5.90 9454 597 1.1 4.1213.6 24.9 160 5.1 6.00 8198 579 5.3 3.6258.0 26.1 171 16.3 5.80 7212 581 0.7 3.84
14.814.613.9
14.1
1175 5 5 3 285 16.90 9.27 505 493 28.6 40 28.2 31.7 201 5.2 5.80 5223 608 8.5 3.701175 9 0 3 285 42.26 2.28 135 468 477 14.0 9 7.3 15.4 111 1.7 6.00 3220 556 22.8 1.09 1.71175 15 0 3 285 47.45 1.49 92 465 12.4 7 4.1 13.6 101 1.8 6.00 2784 551 24.5 0.431175 16 5 3 285 4.11 12.50 666 503 508 34.9 52 38.4 39.1 241 7.3 5.80 6124 629 2.0 4.21 9.6
1176 3 3 1 291 10.58 10.27 846 475 40.1 68 8.8 25.6 179 2.7 6.00 9346 590 5.4 5.071176 5 0 1 291 2.55 12.22 479 47.1 27.8 5.97 9893 1.4 5.291176 6 1 7 300 1.86 12.36 1028 483 489 47.2 83 16.1 28.7 205 10.9 5.98 10186 601 0.9 5.68 14.71176 7 0 1 291 1.99 12.43 1019 493 486 47.1 82 14.1 27.7 198 11.5 5.95 9863 597 0.9 5.19 15.21176 10 2 7 300 1.00 12.60 1053 496 489 49.2 83 16.6 28.8 209 24.3 5.96 10071 603 0.4 5.74 15.01176 11 2 7 300 24.75 7.06 604 482 31.1 51 21.8 162 4.6 6.10 7358 587 13.3 3.851176 13 1 7 300 1.88 12.33 1041 487 47.5 82 15.7 28.6 207 12.6 5.98 10006 602 0.9 5.621176 14 3 1 291 7.48 11.09 911 480 486 43.2 73 8.8 27.1 187 5.5 5.99 9860 594 3.7 5.37 13.1
1177 5 5 4 312 2.82 13.03 809 469 484 38.3 62 29.3 32.9 212 8.3 5.90 7889 596 1.6 4.56 12.11177 6 5 4 312 0.80 13.60 869 470 484 39.6 65 29.3 33.7 225 17.0 5.91 8104 597 0.6 4.83 12.61177 9 1 9 100 36.36 3.04 215 450 468 16.8 18 28.4 16.4 111 2.3 5.54 2472 553 18.1 1.50 3.71177 11 3 4 315 1.05 13.37 861 482 485 39.4 66 26.7 33.2 225 30.3 5.89 8024 598 0.5 5.11 13.31177 13 3 4 315 0.64 13.62 868 491 486 39.8 65 27.9 33.9 226 42.0 5.90 7847 600 0.3 4.19 12.31177 15 1 9 100 45.34 1.35 104 474 13.0 10 11.9 12.9 94 1.5 5.91 2399 547 23.3 0.44

235
SeDive Btl Pr Area T Mg H2S Mn Fe Co Cu Zn Ag Cd Pb As part amp Al
C- m m ~ u n u 1 n n n n n n p
978 Bag 3 4.5 52.44 0 5 - -978 5/6 3 220 24.24 0.65 - 1349 62 308978 7/8 3 120 46.67 - 227 293 - -
979 1/2 2 120 52.47 0.33 40 - 26 <30979 3/4 2 170 29.83 1.43 319 364 27 43979 11/12 2 100 52.84 0.06 13 49 24 <30
980 5/6 1 30 48.59 0.34 65 331 11 82980 7/8 1 84 45.90 0.93 66 168 289 <30980 9/10 1 112 34.52 1.50 157 - - <30
981 1/2 1 - 53.03 0.11 22 101 15 <30981 3/4 1 - 44.31 1.18 102 160 31 <30981 11/12 1 - 50.35 0.12 33 109 34 59
982 5/6 3 225 32.75 0 53 - - -982 7/8 3 290 7.02 5.71 892 1292 105 347

236
TABLE A3-2
Dive Btl Pr Area TfC
SeMg H2S Mn Fe Co Cu Zn Ag Cd Pb As part amp Alm m u I n u I n n n n n n J
1149 1 0 1 2.13 7.381149 2 0 1 1.921149 3 1 i 353 0.431149 4 1 1 353 51.04 0.381149 6 5 I 3.74 5.141149 7 2 1 346 4.76 7.461149 8 2 1 346 7.05 4.051149 9 3 1 346 4.09 6.531149 11 4 1 355 2.01 6.721149 12 4 1 355 2.29 6.581149 13 5 1 5.67 5.33
1150 I 0 1 350 2.07 7.931150 2 0 1 350 4.33 7.051150 3 4 1 350 2.68 7.781150 4 1 1 350 43.35 2.091150 6 5 1 350 3.74 7.331150 7 2 1 350 44.73 1.401150 9 3 1 350 13.00 5.881150 10 2 1 3501150 11 4 1 350 1.03 7.721150 13 5 1 350 6.55 7.331150 15 3 1 350 24.931150 17 1 350 46.65 0.66
1151 4 1 3 273 8.68 5.421151 5 2 3 273 20.02 4.181151 6 3 3 273 2.90 6.921151 14 2 3 273 17.21 4.611151 15 3 3 273 3.12 5.751151 17 1 3 273 8.73 6.38
1152 1 0 2 351 8.05 5.901152 2 0 2 351 7.70 6.151152 3 2 2 351 5.11 7.231152 5 3 2 351 42.55 1.091152 7 5 2 351 2.08 6.451152 9 3 2 351 45.94 0.621152 10 1 2 351 2.27 6.381152 11 1 2 351 1.44 7.291152 12 4 2 3511152 13 5 2 351 3.10 6.611152 16 2 2 351 6.75 6.381152 18 4 2 351 9.85 6.23
737 722 58 11.0 95 30 173 185 249 4.144 132
23 20 0.0 5703 684 44 8.3 73 21 132 150 172 4.3688 646 78 8.2 45 19 76 113 79 36.0 12.6
702 692 54 7.1 82 15 121 175 173 4.3735 720 57 7.6 73 18 112 185 160 4.5
741 735 79 11.5 113 42 180 340 288 4.9
116 108 0.0 27697 711 76 8.3 87 20 142 156 215 11.0108 92 4.0 22535 514 5.9 48
723 742 74 10.7 97 27 155 152 278 60.0 70 4.7
840 707 0.0 39
971 823 28 0.0 39 0 19 142 <30 3.6663 488 0.0 38
824 13491531
42.5 95
913 1539 189 38.8 88 28 128 174 231108 113 11.6 13
941 1618 210 41.7 102 37 168 286 231
854 1418800 1371
5.0
4.8
39.1 8134.8 93
5 3 1 352 6.13 7.576 0 1 270 12.36 5.067 5 1 2 52.839 3 1 352 3.60 7.68
10 1 1 27411 1 1 274 16.49 5.4912 4 1 270 21.0413 2 1 352 16.71 5.9914 2 1 352 9.85 6.6215 0 1 270 5.23 6.4517 5 1 218 4 1 270 20.91 4.25
2 2 2 153 5 3 273 20.98 3.824 4 3 273 16.04 4.315 4 3 273 17.24 4.206 5 3 273 28.75 2.56
12 1 3 273 22.21 3.8014 2 2 15 51.6716 1 3 273 23.08 3.66
115311531153115311531153115311531153115311531153
11541154115411541154115411541154
00
0.0 260.0 09.8 91
0.0 210.0 33
8.3 74
375 1990
651 706
435 254292 125
545 509
293 125
681 549
440 376
5 28553 442
0.0 31
0.0 30
0.0 27
0.0 40.0 1

237
SeDive Btl Pr Area T Mg H2S Mn Fe Co Cu Zn Ag Cd Pb As part amp Al
eC m m u 11 n u n n n n n n u
3 273 2.10 6.06 966 8353 273 4.43 5.943 273 3.40 5.833 273 2.27 6.40 967 8353 273 2.78 6.043 273 2.13 6.51 959 837
22 44.55 0.64 131 1462 46.06 1.67 133 1482 25.16 3.40 496 86822 15.712 40.37 0.77 218 2742 6.34 6.23
1 150 32.85 2.981 150 39.31 1.57 143 361 150 42.74 103 231 275 40.92 1.56 141 521 150 18.16 5.43 408 2511 52 42.11 1.58 140 461 52 9.21 5.811 52 31.53 2.651 182 44.56 1.21 100 371 275 37.06 1.931 182 47.76 65 261 146 22.79 4.15 357 168
20 0.0 39
20 0.0 37
17 0.0 39
0 16 189 <30 0.3
0 14 182 <30
0 17 183 <30 0.4
4.0
3.7
1 3.9
9.7 1732.3 1860.0 75
22.4 29
0.0 40.0 40.0 50.0 240.0 12
0.0 2
0.0 20.0 12
2 1.95 7.702 1.33 7.382 2.31 7.78 933 1647 230 40.8 1082 2.11 7.152 1.39 7.38 937 1641 204 43.2 1102 2.59 5.942 3.91 6.38 884 1547 37.4 962 1.14 7.78 929 1659 196 42.4 112
1 32.63 2.94 240 1031 47.02 71 341 44.43 1.28 108 61
0.0 130.0 50.0 9
00
0
0
40 153 328 237 62.0 5.0
42 166 323 240 64.0 72 5.2
10438 172 376 257 5.2
0
1 52.98 0.00 0 0 0.0 01 52.81 0.00 0 0 0.0 1
1 44.001 42.08 110 781 32.83 2.82 245 1451 47.47 63 321 37.65 2.20 188 124
0.0 220.0 170.0 120.0 22
4 241 2.25 7.59 835 2318 198 44.2 954 350 1.96 8.654 350 4.35 7.124 224 2.94 7.214 224 0.95 8.61 878 2397 210 35.1 974 224 2.69 7.86 840 2289 238 37.6 1024 224 2.63 7.404 350 2.00 8.59 829 2347 222 48.9 1024 241 2.60 8.894 241 28.66 3.16 432 1152 41.8 864 241 36.72 2.06 264 644 21.2 544 350 1.84 8.35 832 2343 222 45.0 105
0
40 161 399 380 4.2
28 160 320 430 52.0 60 4.434 189 357 450 4.1
31 173 316 467 4.5
44 183 335 452 68.0 4.5
115511551155115511551155
11561156115611561156115611561156
115711571157115711571157115711571157115711571157
11581158115811581158115811581158
115911591159115911591159115911591159115911591159
116011601160116011601160116011601160116011601160
1 03 2
10 114 215 018 1
3 16 29 3
11 412 213 316 117 4
2 04 55 56 37 09 2
10 413 214 115 317 118 4
2 53 16 2
10 011 013 214 516 1
1 33 14 45 57 09 5
10 012 315 216 117 418 2
1 32 23 15 56 57 0
10 011 212 313 414 416 1
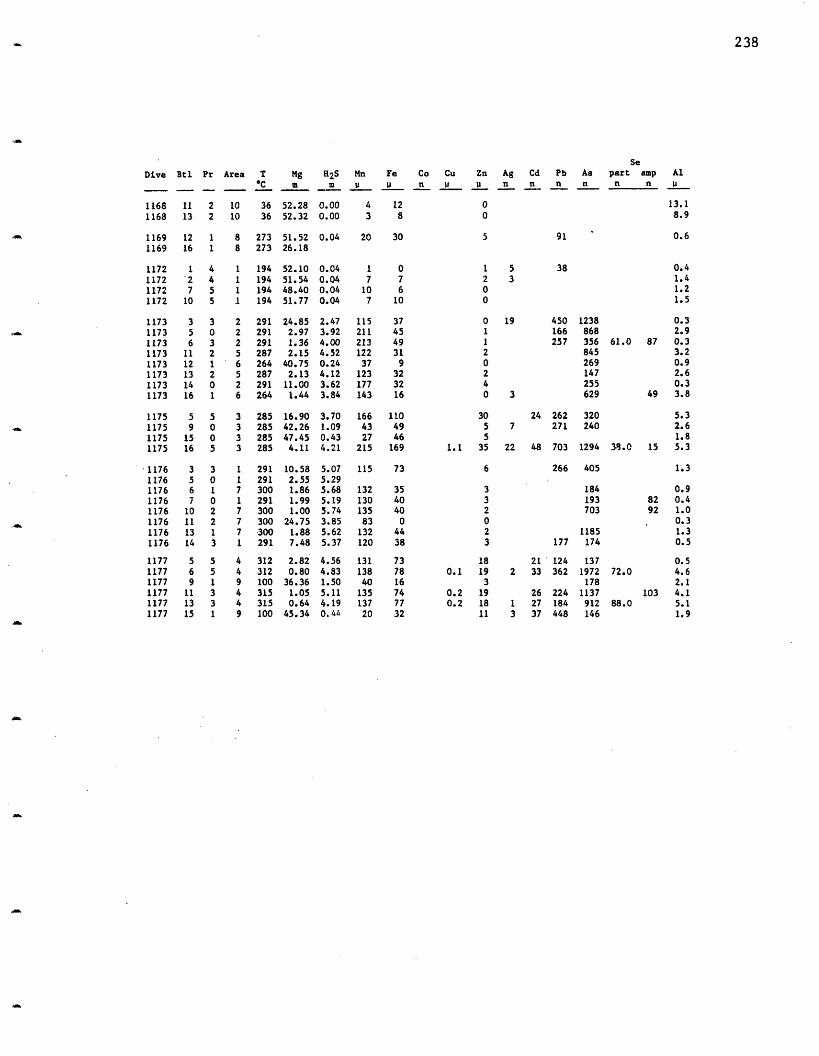
238
SeDive Btl Pr Area T Mg H2S Mn Fe Co Cu Zn Ag Cd Pb As part amp Al
°C m m u U n u n n n n n n
1168 11 2 10 36 52.28 0.00 4 12 0 13.11168 13 2 10 36 52.32 0.00 3 8 0 8.9
1169 12 1 8 273 51.52 0.04 201169 16 1 8 273 26.18
1172 1 4 1 194 52.10 0.04 11172 *2 4 1 194 51.54 0.04 71172 7 5 1 194 48.40 0.04 101172 10 5 1 194 51.77 0.04 7
1173 3 3 2 291 24.85 2.47 1151173 5 0 2 291 2.97 3.92 2111173 6 3 2 291 1.36 4.00 2131173 11 2 5 287 2.15 4.52 1221173 12 1 6 264 40.75 0.24 371173 13 2 5 287 2.13 4.12 1231173 14 0 2 291 11.00 3.62 1771173 16 1 6 264 1.44 3.84 143
1175 5 51175 9 01175 15 01175 16 5
'1176 3 31176 5 01176 6 11176 7 01176 10 21176 11 21176 13 11176 14 3
1177 5 51177 6 51177 9 11177 11 31177 13 31177 15 1
3 285 16.90 3.70 1663 285 42.26 1.09 433 285 47.45 0.43 273 285 4.11 4.21 215
1 291 10.58 5.07 1151 291 2.55 5.297 300 1.86 5.68 1321 291 1.99 5.19 1307 300 1.00 5.74 1357 300 24.75 3.85 837 300 1.88 5.62 1321 291 7.48 5.37 120
4 312 2.82 4.56 1314 312 0.80 4.83 1389 100 36.36 1.50 404 315 1.05 5.11 1354 315 0.64 4.19 1379 100 45.34 0,4O 20
30 5
1 52 300
0 191120240 3
076
10
374549319
323216
1104946
169
73
354040
04438
737816747732
91
38
0.6
0.41.41.21.5
450 1238 0.3166 868 2.9257 356 61.0 87 0.3
845 3.2269 0.9147 2.6255 0.3629 49 3.8
30 24 262 320 5.35 7 271 240 2.65 1.8
1.1 35 22 48 703 1294 38.0 15 5.3
6
332023
266 405
184193703
1185177 174
18 21 124 1370.1 19 2 33 362 1972 72.0
3 1780.2 19 26 224 11370.2 18 1 27 184 912 88.0
11 3 37 448 146
1.3
0.982 0.492 1.0
0.31.30.5
0.54.62.1
103 4.15.11.9
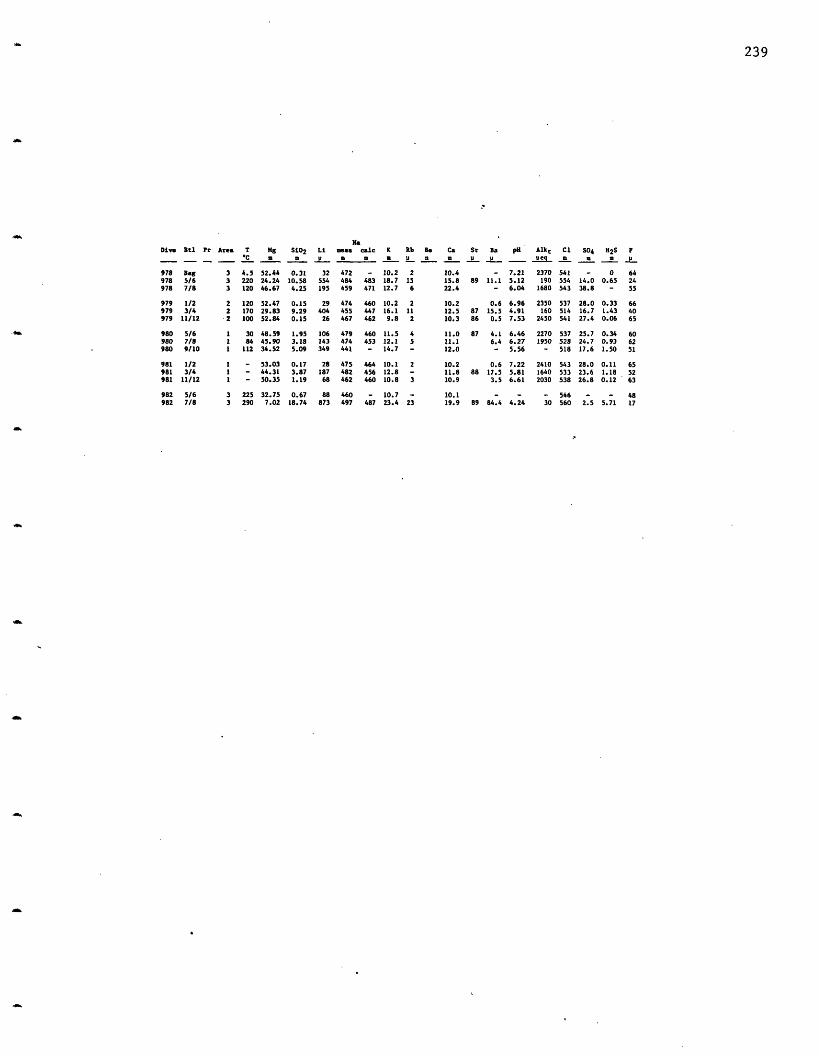
239
NaDive Btl Pr Area T Mg SiO 2 Li -ea" cale K Rb Be Ca Sr Ba pH Alkt C1 S04 H2S F
C a p a P n m P peq m m
978 Bag 3 4.5 52.44 0.31 32 472 - 10.2 2 10.4 - 7.21 2370 541 - 0 64978 5/6 3 220 24.24 10.58 554 484 483 18.7 15 15.8 89 11.1 5.12 190 554 14.0 0.65 24978 7/8 3 120 46.67 4.25 195 459 471 12.7 6 22.4 - 6.04 1680 543 38.8 - 55
979 1/2 2 120 52.47 0.15 29 474 460 10.2 2 10.2 0.6 6.96 2350 537 28.0 0.33 66979 3/4 2 170 29.83 9.29 404 455 447 16.1 11 12.5 87 15.5 4.91 160 514 16.7 1.43 40979 11/12 2 100 52.84 0.15 26 467 462 9.8 2 10.3 86 0.5 7.53 2450 541 27.4 0.06 65
980 5/6 1 30 48.59 1.95 106 479 460 11.5 4 11.0 87 4.1 6.46 2270 537 25.7 0.34 60980 7/8 1 84 45.90 3.18 143 474 453 12.1 5 11.1 6.4 6.27 1950 528 24.7 0.93 62980 9/10 1 112 34.52 5.09 349 441 - 14.7 - 12.0 - 5.56 - 518 17.6 1.50 51
981 1/2 1 - 53.03 0.17 28 475 464 10.1 2 10.2 0.6 7.22 2410 543 28.0 0.11 65981 3/4 1 - 44.31 3.87 187 482 456 12.8 - 11.8 88 17.5 5.81 1640 533 23.6 1.18 52981 11/12 1 - 50.35 1.19 68 462 460 10.8 3 10.9 3.5 6.61 2030 538 26.8 0.12 63
982 5/6 3 225 32.75 0.67 88 460 - 10.7 - 10.1 - - - 546 - - 48982 7/8 3 290 7.02 18.74 873 497 487 23.4 23 19.9 89 84.4 4.24 30 560 2.5 5.71 17
4_
*r
240
BIOGRAPHICAL NOTE
The author was born on February 7, 1955 in Astoria, New York where shelived until entering college. She was graduated from the Stuyvesant HighSchool in June 1973 and entered Yale University that fall. At Yale she hadher first introduction to the earth sciences and graduated in May 1977 witha B.S. degree in Geology and Geophysics with a concentration ingeochemistry. She spent the following year as a research assistant ingeochemistry at Yale. In July 1978 the author entered the M.I.T.-W.H.O.I.Joint Program in Oceanography as a candidate for the degree of Doctor ofPhilosophy. Besides this thesis the author has been involved with researchin natural radionuclides, especially the uranium series, in both fresh andmarine waters and lake sediments, as well as the chemistry of evaporativelakes.
Publications:
Von Damm, K.L., L.K. Benninger & K.K. Turekian, The Lead-210chronology of a core from Mirror Lake, New Hampshire, Limnol. & Ocean. 24,434-439, 1979.
Krishnaswami, S., L.K. Benninger, R.C. Aller & K.L. Von Damm,Atmospherically-derived radionuclides as tracers of sediment mixing andaccumulation in nearshore marine and lake sediments: evidence from Be-7,Pb-210 and Pu-239,240, Earth & Planet. Sci. Lett. 47, 307-318, 1980.
Nozaki, Y., K.K. Turekian & K.L. Von Damm, Pb-210 in GEOSECS waterprofiles from the North Pacific, Earth & Planet. Sci. Lett. 49, 393-400,1980.
Edmond, J.M., K.L. Von Damm, R.E. McDuff & C.I. Measures, Chemistry ofhot springs on the East Pacific Rise and their effluent dispersal, Nature297, 187-191, 1982.
Von Damm, K.L., B. Grant & J.M. Edmond, Preliminary report on thechemistry of hydrothermal solutions at 210 north, East Pacific Rise, inNATO ARI volume "Hydrothermal Processes at Seafloor Spreading Centers,"P.A.Rona ed., Plenum Press, in press, 1983.
Von Damm, K.L. & J.M. Edmond, Reverse weathering in the closed basinlakes of the Ethiopian Rift and in Lake Turkana (Kenya), Amer. J. of Sci.,submitted 1983.
Edmond, J.M. & K.L. Von Damm, Hot springs on the ocean floor,Scientific American 248, 78-93, 1983.