mhhhhhhhhhhii ehhhhhhhhhhhhi eisms hhhhi
TRANSCRIPT

,RD-R125.878 MOLECULAR BEAM CHEMISTRY: REACTIONS OF OXYGEN ATOMS /WITH HALOGEN MOLECULES(U) HARVARD COLL CAMBRIDGE MASS
DPARRISH ET AL. 15 OCT 92 AFOL-TR-82-0313
UNCLAtSIFIED F19628-78-C-BiOO F/G 7/4 N
mhhhhhhhhhhiIEhhhhhhhhhhhhI
EIsms hhhhI

I .0 LIw "2 2.5ILI I132IL - IjjL .2
1111L1 I. I 2
111111.25 IIi~
MICROCOPY RESOLUTION TEST CHARTNATIONAL BUREAU OF STANDARDS-1963-A
ADA 125870
", AFGL-TR-82-0313
MOLECULAR BEAM CHEMISTRY: REACTIONSOF OXYGEN ATOMS WITH HALOGENMOLECULES
D. ) Parrish1). A. I)ixon
1).R. Herschbach
Harvard CollegeHolyoke Center, Box 4581350 Massachusetts AvenueCambridge, Massachusetts 02138
Final Report1 April 1978 - 30 March 1981
15 October 1982
L Approved for public release; distribution unlimited DTICENELECTEBMMAR 2 11983
AIR FORCE GEOPHYSICS LABORATORY SAIR FORCE SYSTEMS COMMAND DUNITED STATES AIR FORCE1HANSCOM AFB, MASSACHUSETTS 01731
U3 03 21 017.

*oil
4,.
* Qualified requestors may obtain additional copies from theDefense Technical Information Center. All others shouldapply to the National Technical Information Service.

UnclassifiedSECURITY CLASSIFICATION OF THIS PAGE (ten DatEntered),
REPORT DOCUMENTA.TION PAGE READ INSTRUCTIONSREPOT D #AETA.TON AGEBEFORE COMPLETING FORM
1. REPORT NUMBER 2. GOVT ACCESSION NO. 3. RECIPIENT'S CATALOG NUMBER
AFGL-TR-82-03134. TITLE (and Subtitle) S. TYPE OF REPORT & PERIOD COVERED
MOLECULAR BEAM CHEMISTRY: REACTIONS Final ReportOF OXYGEN ATOMS WITH HALOGEN 1 April 1978 - 30 March 81
SMOLECULES . PERFORMING OG. REPORT NUMBER
7. AUTHOR(s) 8. CONTRACT OR GRANT NUMBER(s)
D. D. ParrishD.A. Dixon F19628-78-C-0100D.R. Herschbach
9. PERFORMING ORGANIZATION NAME AND ADDRESS 10. PROGRAM ELEMENT. PROJECT, TASK
Harvard College AREA & WORK UNIT NUMBERS
Holyoke Center, Box 458 61102F1350 Massachu etts AvenueCambridge, Massachusetts 02138 2303G2AA
I I. CONTROLLING OFFICE NAME AND ADDRESS 12. REPORT DATE
Air Force Geophysics Laboratory 15 October 1981Hanscom AFB, Massachusetts 01731 13. NUMBER OF PAGES
Monitor/Alfred Rahbee/OPR 7214. MONITORING AGENCY NAME & ADDRESS(if different from Controlling Office) IS. SECURITY CLASS. (of this report)
UnclassifiedISa. DECLASSIFICATION/OOWNGRADING
SCHEDULE
16. DISTRIBUTION STATEMENT (of this Report)
Approved for public release; distribution unlimited
17. DISTRIBUTION STATEMENT (of the abstract entered in Block 20, if different from Report)
IS. SUPPLEMENTARY NOTES
19. KEY WORDS (Continue on reverse side if necessary nd identify by block number)
molecular beams; oxygen atom reactions; electronic structure of reactionintermediates
20YBSTRACT (Continue on reverse side if necessary and identify by block number)
Molecular beam experiments show that reactions of oxygen atoms with Br2 , 12tICI, and IBr proceed via long-lived collision complexes. In the mixedhalogen case, a large yield of 10 was found, but no CIO or BrO. Theseresults suggest the intermediate complexes are unsymmetrical species,0-Br-Br, 0-I-CI, which are probably stable by greater than 20 kcal/mol andin triplet spin states.
)ORM
DD , JAN 73 1473 EDITION OF I NOV 65 IS OBSOLETE Unclassified
SECURITY CLASSIFICATION OF THIS PAGE ("len Data Entered)
" , . - - * o . - . - ° 'i ° °. °° ', -' - '' ' "°'. " "' . nr r n ." , -'° , °. '. "
. -'
-o .
MOLECULAR BEAM CHEMISTRY: REACTIONS OF OXYGEN ATOMS WITH HALOGEN MOLECULES
D. D. Parrisht D. A. Dixon,* and D. R. Herschbach*
Department of Chemistry, Harvard UniversityCambridge, Massachusetts 02138
Molecular beam experiments show that the reaction 0 + Br2 4 BrO + Br
proceeds via formation and decomposition of a collision complex which persists
for many vibrational periods and at least a few rotational periods, or• '" 0 12
>5 x 10 sec. The angle and translational energy distributions agree closely
with those predicted by approximate statistical complex models akin to the RRKM
theory of unimolecular decay. The analogous reactions of 12, ICI and 13r
were also found to proceed via long-lived complexes. For ICl and IBr a large
yield of 10 was found, but no ClO or BrO, despite a more favorable reaction
exoergicity for these latter products. These results suggest the intermediate
complexes are unsymmetrical species, O-Br-Br or O-I-Cl, which are probably
stable by >20 kcal/mole and in triplet spin states. The reaction 0.+ C12 is
found to proceed most likely via an osculating complex. The reactive surface
does not sample the well corresponding to C2v OX2 in its ground singlet state.
The complex is predicted to be a linear or slightly bent asymmetric triplet
1 *3 *3 1OXX with an electron configuration of either .. (c *) (,*) or .-. (*)(* ) (
i Present address: Metropolitan State College, Denver, Colorado
*Present address: Chemistry pepartment, University of Minnesota, Minneapolis, M14.
-F--
-4 0 _4 :S0 V0
ac A.
a i I " A a
r-1
INTRODUCTION
The electronic structure of reactant and product molecules and transition
states governs reaction kinetics. While much has been inferred from macrosco-
plc experiments, only single collision studies can hope to examine the actual
molecular dynamics. Even such studies may not be able to abstract detailed
information about the potential surface. 2 However, significant qualitative
electronic structure information about transition states or reaction interme-
diates can often be obtained. In favorable cases, it is possible to synthesize
intermediates.3 For reactions that proceed through a long-lived complex, even
qualitative dynamics can yield information about the stability of these systems
that is not presently available from bulk experiments or from electronic
structure calculations.
4This paper reports a study of several reactions of oxygen atoms with
halogen molecules,
0(3P ) + XY( Iz+ ) OX(21) + X(2p ), (Ri)
with XY = C12, Br2 , I2, ICZ, and IBr. Some of these reactions have been ex-
amined by classical kinetic methods using flow tubes5 and diffusion flames, 6
and concurrent molecular beam experiments have been pursued in other labora-
tories.7 '8 We find that at collision energies of 2-3 kcal/mol these reactions
proceed via a long-lived collision complex, except for the C 2 case which
proceeds via a osculating complex. At higher collision energies there is now
evidence that the other 0 + XY complexes likewise become osculating.7 Since
the ratio of the reduced mass of the reactants to that of the products is
rather small, the 0 + XY reactive scattering proves to be particularly suita-
ble for comparison with simple statistical models. These treat the complex
mechanism by phase space9 and transtion state1 0 models patterned after the
RRKM theory of unimolecular decomposition."
r r -.- "°'
-2-
The analogous reactions of hydrogen atoms, methyl radicals, alkali atoms,
alkali dimers, alkaline earth atoms, halogen atoms, and mercury atoms with
12halogen molecules have also been studied in molecular beams. This family
of reactions scans the full panoply of reaction dynamics, from extremely im-
pulsive processes akin to photodissociation in the H + XY case 13 to statis-
tical behavior akin to unimolecular decomposition via a well defined interme-
diates in the Hg + XY case.14 The 0 atom reactions have a special place in
this family because. only they offer the possibility of transitions between
triplet and singlet potential energy surfaces. In (RI), the reactants approach
on a triplet surface, whereas the products can depart on either a singlet or
4triplet surface. In accord with qualitative electronic structure arguments,
the reactive scattering indicates that these reactions go predominantly via a
triplet O-X-Y surface without transition to the singlet X-O-Y srfrce ccrrc--
ponding to the ground electronics state of the known halogen oxide molecules.
- This result, interpreted in terms of orbital correlations and electronegativity
differences, led to the prediction4 that the 0 + F2 reaction would require a
* relatively large activation energy even though more exoergic than the other
0 + XY reactions. This was subsequently confirmed in a flow tube study6 , which
, found Eact 12 kcal/mol for the 0 + F2 case, in contrast to Eact 2 and zero
kcal/moi for the Cl2 and Br2 systems.
EXPERIMENTAL
The apparatus is schematically depicted in Fig. 1. Only key features and9.17
recent modifications will be described here; more details are given elsewhere
The two reactant beams cross at an angle of 900 in a large scattering chamber. A
4200 1/sec oil diffusion pump and a large liquid nitrogen cooled shield pump non-
condensible and condensible gases, respectively, in this chamber. Reaction products
formed in the collision zone are detected by a mass spectrometer mounted on the
lid of the scattering chamber. This lid is rotatable allowing the detector to

. . . - .. - ", '. ,. ." - -w-. -'- -. '...-.-... . . .. . . ."- . ,,::,, ,: -~~~~~~~.-. .. ,..-..... ...... .. .... . .......... .,......
3-A
be moved in the plane of the beams to scan the angular distribution of the
scattered reaction products. The detector is comprised of an electron-bombard-
3 ment ionizer, quadrupole massfilter, scintillation ion counter, and two gated
scalars synchronized with the modulation of the halogen molecule beam. In
the velocity analysis experiments, a slotted disk chopper is attached to the lid
between the collision zone and the detector. A PDP 8/L computer is used both
as a multiscalar to record the time of flight (TOF) spectrum of the products
V and for immediate, approximate extraction of the velocity distribution from
the recorded spectrum.
To reduce the residual partial pressure of background product molecules
in the ionization region of the detector to a low level (M1 torr) the
ionizer is nested in three chambers differentially pumped by 50 1/sec ion pumps.
The ionizer is surrounded by liquid nitrogen cooled surfaces and the design
allows unionized product molecules (09.9% of the total) to "fly through" the
ionizer. A new pump element which is a 46 cm x 2.5 cm x 0.32 cm gold plated
copper strip cooled to ',15K by an Air Products and Chemicals Inc., Displex
Model CS-202 closed cycle, displacer/expanded helium refrigerator has been
added. The 150K element is completely surrounded by".77"K radiation shields
cooled by the refrigerator's first stage. The refrigerator is mounted at the
throat of the ionizer chamber ion pump and the pumping element extends down this
chamber to within 13 cm of the ionizer. This refrigerator has given more than
6000 hours of maintenance free operation.
Beam Sources. The oxygen atom beam is produced by a low pressure (l00
microns Matheson Extra Dry oxygen) microwave discharge. The source shown in
Fig. 2a is similar to that used previously for deuterium atoms and chlorine
atoms18 . The discharge cavity is essentially the foreshortened 1/4 wave coaxial
cavity described by Broida and coworkers1 . However, for convenience of mounting
and vacuum connections, a wave guide has been added by lengthening the inner and
I

-|- 4r -
.- 4-
outer electrodes of the cavity by four wavelengths. The discharge occurs in a
quartz tube which is sealed into the gold plated copper waveguide with epoxy
resin to provide a vacuum tight seal. Water cooling coils protect the epoxy
from pyrolysis while air cooling prevents melting the quartz tube. Two
pimportant requirements for satisfactory operation have been identified: the
quartz tube must be coated with freshly prepared, syrupy phosphoric acid before
each run, and the dimension indicated by A in Fig. 2a must be held as small as
possible. The microwave frequency is 2450 MHz and is operated at '000 watts
power. The beam exit slit (I mm x 10 m) is located Q cm from the center ofthe cavity. Since the beam is taken from the region of active discharge it
could be expected to contain significant amounts of 02 (IA) and 0(ID) metastablespecies in addition to ground state 0(3P) atoms. The 0 (A) is unreactive at
the experimental collision energy with the halogens as all reactions are at
least 16 kcal/mole endoergic. The O(ID) is, however, generally quite reactive
and would, if present, possibly interfere with the observation of the products
of ground state 0 atom reactions. However, the 1D state is efficiently collision-
ally quenched20 by 02 and is thus not expected to be a significant component of
the beam; indeed, we have seen no evidence for reactions of this excited species
as is discussed later. Velocity analysis of the beam indicate that it is
transIdtioally hot (1000' to 12000K) with a full Maxwellian velocity distribution.
The fluxes of 0 and 02 are approximately equal under our optimum discharge
conditions.
The halogen molecule source shown in Fig. 2b is a high pressure (150 to
900 torr) supersonic nozzle21. The nozzle is fabricated from a 6.2 mm O.D quartz
tube pulled down to form a short closed tip. This tip is ground back until a 0.10
to 0.17 mm dia orifice is produced. A heating mantle around the quartz tube allows
tne nozzle to be operated from 3000 to 10000K. The nozzle is moveable along the
beam axis and is mounted at an optimum value of -.7 mm behind a 1.5 mm skimmer.

The nozzle beam chamber is pumped by a large liquid nitrogen cooled shield and
a 2400 1/sec oil diffusion pump to achieve the very high pumping speeds required.
The resolution of the velocity analyzer is insufficient to verify the very
narrow velocity distributions expected for this beam. The velocity analysis is
consistent with high Mach numbers (>10) and nearly complete relaxation of the
rotational degrees of freedom of the halogen molecules.
Both beam sources are mounted in chambers differentially pumped by 1200 I/sec
oil diffusion pumps. Collimating slits (1.25 mm x 10 mn) lead to the scattering
chamber. The measured angular widths of the resulting beams are 50 (full width
* at half-peak intensity). Detailed calculations indicate this is the maximum
size consistent with a scattering region cross-section small enough to be
1completely viewed by the detector. A rotating paddle modulates the halogen beam
at 70 Hz and a beam flag is used to interrupt the oxygen atom beam. The beam
modulator and the beam flag are located in the respective differentially pumped
chambers.
Experimental Procedures. The angular distributions are obtained (with the
*TOF chopper removed) by counting at each laboratory scattering angle, for a period
of 20 to 200 sec with the beam flag open and then immediately for the same period
with the beam flag on the 0 atom source closed. The modulated signal (difference
between "on" and "off" scalars) with the beam flag closed is subtracted from the
open beam flag modulated signal to obtain the reactive scattering intensity. In
the studies reported here the closed beam flag signals were typically 0 to 30%
of the beam flag open signals and were angular dependent, increasing to a maximum
near the chopped halogen beam; these beam flag closed signals can be attributed to
the reaction of the halogen molecules with background oxygen atoms in the scatter-
ing chamber. The backgrounds ("off" scalar) were 1 to 20 times larger than the
reactive signals. To obtain the angular distributions four separate scans through
the complete angular range were made in varying angle sequence. Since each data
-.. -* '.. - . - - .-
-6-
point was relatively noisy, the time variation in the signal at each angle was
included in the procedure developed to time normalize for beam intensity or
detector sensitivity variations during the experiment. This method is described
in the Appendix. It gives significantly better data than the traditional method
of using the time variation of the signal at a single, relatively noise-free
angle for normalization. The time normalized signals were averaged over the four
angle scans to obtain the data points. Simple error propagation techniques are
described in the Appendix which allowed the systematic derivation of confidence
limits and error bars.
The TOF velocity analysis data are collected in the manner described pre-
9viously. A slightly narrower chopper disk slit width (0.15 cm) yielded a
shutter function of 0.067 TC (full width at half maximum) with a chopper period
TC of 860 Psec and channel width of 24 psec. Some improvements have been made in
the procedure9 for converting the TOF spectrum to the velocity distribution. At
low velocities (long flight times), the velocity resolution (Av/v with Av
the FWHM at nominal velocity v) is determined primarily by the ratio of ionizer
length (2.5 cm) to length of flight path (13.5 cm) and is relatively unaffected
by the TOF channel width. Hence, two or more consecutive channels at the end of
the TOF spectrum can be combined by adding the counts in each; the analysis with
the resultirg lcnger channel width gives improved signal-to-noise ratios with
only a small decay in velocity resolution. In practice, the data were analyzed
by beginning with the last channel and combining with preceding channels sequen-
tially until the product of the velocity resolution and the noise-to-signal ratio
was minimized. This process wah then repeated with each channel. Error propagation
techniques again allowed assignment of systematic error bars. The low velocity
data exhibit less scatter than would be expected from the magnitude of the error
bars. This phenomenon arises because consecutive points come from overlapping
- - . - -- _ _
-7-7
- time periods and hence include much of the same data. The error bars do, however,
- indicate the random errors in the data.
RESULTS
Table I gives the important parameters that varied between experimental runs.
p- For a given reactant system, identical conditions were maintained as closely as
possible for the angular velocity distribution runs. The measured product angularI...
distributions are shown in Figs. 3 and 4 along with curves calculated from the..
statistical complex models discussed later. In all cases the angular distribution
* peaks near the direction of the nominal centroid vector.
The 0 + Cl2 distribution, however, does
exhibit a slight shift toward the 0 atom beam. These experimental angular
distributions exhibit no clear indication of the bimodal structure
generally associated with a collision complex mechanism. This lack of
structure is due to the inability of the experiments to resolve the two peaks
which, for these systems, are very close together in angular range. As discussed
below this behavior is clearly understood and, indeed, is directly predicted by
the collision complex model.
Careful searches were made for the other possible product (CIO from 0 + ICl
and BrO from 0 + IBr) from the mixed halogen reactions, but no indications of these
products were found. Energetic considerations (Table II) do not prohibit the
formation of these alternative products and statistical phase space theory predicts
that ClO should be the dominant product of the 0 + ICl reaction. Figure 5 indicates
the sensitivity of the detector for the C1O product and shows that the signal fromW
this product must be at least one order of magnitude less intense than expected
from the statistical complex model assuming a distribution of products from phase
space theory. The low intensity of the signal from the 0 + IMr reaction prevented
a definitive search for the BrO product from this reaction.
• 4

-8-
* The measured product velocity spectra are shown in Figs. 6-8 along with
curves calculated from the statistical complex models for the reactions 0 + Cl2,
0 + Br2 and 0 + ICI. Signals were so small for the 0 + Cl2 reaction (the single
velocity distribution required 3 hr.) that only one velocity distribution near
the peak of the angular distribution was measured. For the 0 + Br2 and 0 + ICl
reactions each Gf the independently measured velocity distributions are normalized
to a common intensity scale by requiring that the integral of the velocity
distribution, when converted to number densities, equals the scattering intensity
at the corresponding angle in the angular distribution measurements.
A small amount of background halogen molecules effuses from the differentially
pumped halogen source and is, thus, modulated. This background is very much smaller
than the beam intensity but the reaction of 0 atoms with this background can
dominate the detected product signal at some ranges of laboratory angles and
velocities. This effect is evident at low laboratory velocities and angles wide
with respect to the centroid (0 = 1020 and 250) for the 0 + Br2 reaction. This
accounts for the wide deviations from the model calculations at these angles;
the low velocity peak at 0 = 250 could be attributed to this reaction with back-
ground molecules. Another possible explanation is due to the presence of V-,n der
Waals dimers in the halogen nozzle beam. Some dimers are expected due to the
high source pressures.
The reaction
0 4 (X2)2 - OXX + X2
could occur and the OX2 could fragment in the ionizer due to electron bom-
bardment or could decay to OX+X before being detected. This could also account
for the low velocity peak at 0 = 250.
-• ,.. . . . .. . . . .. . . m.:..,,.'L . -... .--...--.."T - ."'- - --"
- - -" - -" '
In all cases the velocity distributions peak at velocities that correspond
. closely to forward (00) or backward (1800) scattering in the center of mass
system and fall off gradually toward the energy conservation limits. Poor
velocity resolution of the products as well as energy and angular spreads in the
parent beams account for the intensity in energetically excluded regions. If
the parent 0 atom beam had a significant proportion of metastable 0O(D) atoms which
produced interfering products, the excess energy would allow scattering at
higher laboratory velocities. The lack of such scattering and the reasonably
good agreement of the loose transition - state model which assumes only ground
state 0 atoms with the data at high velocities preclude a significant contribution
of products from 0(1D) reactions.
Kinematic Analysis. The transformation of the flux density ILAB in the
Ulaboratory (LAB) system to the flux density 1CM in the center-of-mass (CM) system
is given by
.- ICM(Oeu) = (u2/v2) ILAB( v)
where u and 0 are the velocity and angle in the CM system and v and C the
respective values in the LAB system. This direct transformation with no averaging
holds true only for monoenergetic beams. For the 0 + Br2 reaction the kinematics
Oare favorable enough and the data are complete enough to allow this transformation
to be made with reasonable accuracy if the spread in the reactant beam velocities
is ignored. This is accomplished by assigning each beam its most probable velocity.0
Figure 9 shows the results of this nominal transformation of the data for 0 + Br2from Fig. 7 with some smoothing of the contours. Elementary considerations of the
S

-10-
collision process dictate that the scattering must be cylindrically symmetric
about the relative velocity (the 00 - 1800 axis) and the data showed thiswithin experimental uncertainty. The data before smoothing showed a slightly
0 Qgreater intensity in the CM angular range 90 to 180D which was within
* 22experimental uncertainty. A reaction which proceeds through a complex whose
lifetime is less than several rotational periods would be expected to yield
an angular distribution with some asymmetry about e = 90P, but in such a casethe 0° to 90° quadrant would have higher scattering intensity, just opposite to
the apparent asymmetry we observed. For our map, we assumed symmetry about
the 0 = 00 and 1800 line and about 0 = 900. These data, combined with smoothing,
energy conservation considerations, and the fact that the contours must be
perpendicular where they cross the 0 - 180° axis and the 90 ray give the map
shown in Fig. 9. The bimodal structure of the scattering intensity is clearly
apparent with the most intense scattering distributed approximately symmetrically
forwara and backward with respect to the initial 0 atom direction.
The CM ar.gular distribution for the 0 + Br2 reaction mUy be obtained from
Fig. 9 by integratirg the scattering at each angle over the product velocity.
This result is presented in Fig. 10(a). The CM velocity distribution at any
*I angle may be obtainea by taking a cut through the contour plot of Fig. 9 at
the chosen angle. At all angles the results are very nearly identical. Figure
10(b) shows the CM velocity distribution that best fits all angles; Fig. 10(c)
11 gives the product translational energy distribution that corresponds to this
veloci-ty dist,-ibution.
Ttal Reartion Cross Sections. The total reactive cross section could be
*1 easily derived if it were possible to measure the absolute beam densities and
the volume of the beam intersection region. However, this determination is not
possible here nor has it been in any crossed molecular beam study. Thus indirect
11 methods are usually employed; the most common is comparison of measured small

- 11 -
angle elastic scattering with theoretical predictions to normalize the
experimental intensity scale to absolute values.23 For these studies, however,
such a comparison is not possible. Elastic scattering of 0 atoms cannot be
separated from the mass 16 detector background and mass 16 contributions from
* the elastic scattering of the 02 component of the 0 atom beam. The elastic
scattering of the halogen molecules may be measured, but the scattering comes from
the 02 as well as 0 in the 0 atom beam, and the kinematics for interpreting
*tthis scattering is particularly poor.
A crude estimate of the total cross section may be obtained from comparing
the relative reactive and elastic signal intensities for these reactions with~18
the halogen atom-halogen molecule exchange reactions. This comparison indicates
the cross sections are the same order of magnitude for the two reaction families,02
roughly about 10 A
STATISTICAL COMPLEX MODELS
A center of mass angular distribution which is symmetric about 6 = 900
is suggestive of a reaction which proceeds through a collision complex, but is
not a sufficient condition. If a complex persists for several rotational periods
and many vibrational periods, all "memory" of the initial conditions of complex
formation are lost. Only total energy and total angular momentum are conserved.
This situation permits simple statistical models to be substituted for detailed
studies of collision dynamics. Many statistical approaches have been developed
24 * 13.22including phase space models and transition state models. These models
are descendants of the transition state (RRKM) treatment of unimolecular decom-
position14 and the compound nucieus treatment of nuclear fission.25 Approximate
transition state models will be briefly discussed and applied to the reaction
systems under study here.

. . . . T
- 12-
Approximate Product Velocity Distribution. The total energy available to
the reaction products is
Ett E + W + ADO =E' + W' (2)
where E and W denote the initial relative translational energy and internal
excitation of the reactants, E' and W' are the corresponding quantities for
the products and ADo is the reaction exoergicity. The role of the statistical
models is to partition this total energy, weighted by the density of energy
levels or states, among the degrees of freedom of the dissociating complex.
According to the simplest transition state model13, the translational energy
distribution is given by
P(E') = A(E')N+(E - E') (3)tot
The N+ factor is the energy level density of "active" vibrations and rotations
at the critical configuration of the complex. The A factor takes into account
the centrifugal effects associated with complex formation and decomposition.
The classical approximation,
N (Etot - E) = (Etot - E')n (4)
is appropriate here because the zero point energies are small and similar for
reactants, complex, and products. The exponent n is given by n = s + r - 2,
where s and r, respectively, denote the number of vibrational modes and active
rotations at the transition state. lhe number of modes assigned to s and r
depends on the geometry and bonding assumed for the transition state. For a
"tight" (all atoms bond in a single "molecule") three atom complex, a linear
structure has s = 4, r = 0, and n z 2; a nonlinear one has s = 3, r = 1, and
n = 3/2. In the "loose" complex the bending modes go over to free rotation of
the product diatomit molecule; thus s = 1, r = 2, and n = 1.
In general the calculation of the A factor is quite complex because the
details of the angular momentum coupling must be analysed. The magnitude and

- 13 -
direction of the total angular momentum is conserved in the collision;
L + J - J L' + j (5)
where L and L' are the angular momenta associated with centrifugal motion of
the reactants and products (L = Pvb where v is the reduced mass, v is the velocity
and b is the impact parameter) and J and ' the rotational momenta of the reactant
and product molecules, respectively. To avoid consideration of the convolution
13* of the unknown component momenta distributions, the simplest approach is to
assume that the centrifugal angular momentum dominates:
I-L: %, -, L' (6)
* As discussed later, this is at least valid for the entrance channel. If the
transition states for formation and decomposition of the complex are taken
as the centrifugal barriers in the entrance and exit channels, respectively,
and if these barriers lie sufficiently far out to be governed by the r-6 van der
Waals attraction, then
A(E') (E'/Bm')21 3, E'<Bm , (7)
I E'>Bm '
The parameter Bm is the maximum exit centrifugal barrier and can be calculated
if C and C', the van der Waals force constants in the entrance and exit channels
are known,
BM = (i/u') 3/ 2 (C/C') Et. (8)
Here V and U' are the reduced masses of the reactants and products. In Eq. (4)
n has been set equal to 2 corresponding to tight linear complexes. The dotted curve
in Figure 12(c) compares this result for the 0 + Br2 reaction with the
experimentally derived distribution; Figure 12(b) compares the corresponding
product velocity distributions.
Product Angular Distribution. In the angular momentum limit given by

-7 7
-14-
Eq. (6), the CM angular distribution is given by the simple expression
f(E)= 2w2sinO (9)
The curve given by Eq. (9) is compared with experiment in Fig. 10a; it is
clearly much too strongly peaked even with allowance for the imperfect
experimental angular resolution. The less sharply peaked experimental curve
must result from the failure of Eq. (6) at least in the exit channel. In the
entrance channel (complex formation) the centrifugal angular momentum must indeed
dominate because the rotational excitation of the reactant halogen molecule
is very small due to the rotational "cooling" which takes place in the expansion
of the nozzle beam. Detailed consideration of the energetics and angular
momentum conservation in the product channel, hc,oever, indicate that the
rotational angular momentum of the diatomic product cannot be neglected.
Equation (6) must be replaced with
L- J =L' + J' (10)
As a result the final relative velocity of the products is not constrained to
be perpendicular to J. The peaking predicted by Eq. (9) must then'be rounded
off.
A transition state treatment has been developed22'26 to provide a simple
* algorithm for calculating the shape of the angular distribution. Three para-
meters are required: Lm, the maximum orbital angular momentum with which the
complex car be formed (at the given collision energy); Mo, the root-mean-square
* projection of the total angular momentum on the initial relative velocity vector;
and M ', the correspondina prjection on the final relative velocity vector. If
ite ratios Lm/M o' and M0/ 0o' are specified, the angular distribution can be read
* from reduced plots prepared by Miller.27 Application of this model for the angular
distribution to these chemical systems is inconsistent, however, since equation (101
- 15 -
dictates that M. 0 and Mo' 0 0. The tight linear complex assumed In
calculating the product velocity distribution also Implies that No' must
equal zero. Thus, applying this traditional transition state model would be
essentially an empirical fit of the model to the experimental data. This is
the approach that was followed in the initial communication of this work. The
0 + Br2 angular distribution was nicely fit by the model when the ratio L
was set at approximately 2.4 Another inconsistency is that in order to calculate
Lm and the A factor in the product translational energy distribution it was
assumed that the formation and decomposition of the complex is governed by the
centrifugal barrier associated with the r-6 van der Waals attraction. This
means that at the transition state the complex must correspond to an atom and
a diatomic molecule interacting only through weak, non-directional forces. Clearly
. this corresponds to a "loose" complex rather,than the "tight" linear complex
assumed in deriving the product velocity distribution.
Loose Transition State Model. To avoid the problems discussed in the
preceding'section, the simple models assuming a tight complex have been
abandoned. A model for a three atom "loose" complex constrained only by Eq. (10)
can be used to obtain both the product velocity and angular distributions. This
model still assumes that the critical configurations are the centrifugal barriers
but considers in detail the conservation of both energy and angular momentum.
The final result is a classical analog of the quantum phase space theory; every
state of the complex at the critical configuration that conserves energy and
angular momentum is weighted equally. If the van der Waal's force constants can
be obtained and if the structural parameters of the reactant and product diatomics
are known, the model contains no adjustable parameters. All observable properties
*l of the reaction may be predicted including product velocity and angular dis-
tributions, total reaction cross sections, and branching ratios of complex de-
composition to reactant channel and product channel(s).28 This model will be
described fully elsewhere. 16

- 16-
Table 11 contains the parameters used in the model calculations. The
van der Waals force constants for the r 6 interaction, C, are obtained from the
Slater-Kirkwood approximation.29 The effective number of electrons were taken
to be 6 for the 0 atom, 14 for halogen molecules, 7 for halogen atoms, and
13 for halogen monoxide diatomic molecules. The polarizability values were
chosen to be consistent with literature values and atomic additivity. 30 The
polarizabilities (in A ) were taken as 0.77 for the oxygen atom and 2.3, 3.1,
and 5.2 respectively for the Cl, Br, and I atoms.30 The value for each diatomic
molecule was obtained by summing the polarizability of each substituent atom.
The induction terms were calculated using dipole moments (in D) of 1.24 for
* IC1 32 , 0.9 for 1Br 3 3 , and 1.26, 1.61, and 2.45 respectively for CIO, BrO, and
S10. 34 The reactant internal excitation W was calculated from the beam temperatures
in Table I assuming classical rotation and that in the nozzle expansion no
vibrational relaxation occurs, but that 80% of the rotational energy is con-
verted to translational energy. (This assumption is consistent with the measured
velocity distributions of the reactant beam.) The bond energy D0 for each
molecule was taken from standard references 35 '36 with the exception of 10 which
will be discussed in a later section. The diatomic spectroscopic vibrational
constants we and rotational constants Be were taken from Ref. 36.
As shown in Fig. lOa, the angular distribution calculated at a nominal
collision energy of 2.11 kcal/mole gives excellent agreement with the CM angular
distribution obtained by the nominal transformation of the experimental data.
The anisotropy ratio 6 (equal to the ratio of intensity at 0 = 00 or 1800 to
tnat at 0 = 900) predicted by the model is 2.6 as compared to 2.3 obtained from
the norinal LAB - CM transformat'ion. The angular distribution obtained in
another study 7at a lower reactant translational energy (0.8 kcal/mole) indicated
a smaller value for 6. This is in qualitative accord with the model which
predicts 8 = 1.9 at 0.75 kcal/mole.

- 17 -
In contrast to the good agreement found for the angular distribution,
however, Figs. 10(b) and 10(c) indicate that the predicted product velocity
distribution is in poor agreement with experiment. The loose transition-state
model predicts too large a fraction of the total available energy entering
product translational energy.
Comparison With Laboratory Data. Comparison of the model predictions with
the curves derived from the nominal CM to LAB transformation may, however, be
misleading. The models are formulated in the center of mass system for a
complex of given total energy formed in a collision with specific relative
translational energy. The experiments, however, were run in crossed molecular
beams and the 0 atom beam was not velocity selected so a wide range of initialN
translational energies was present in the experiment. Of less importance is
the range of the total energy of the complex with respect to separated products
caused by this spread in translational energies as well as a small range of
internal excitation in the reactant diatomic molecule. Since no method presently
exists to deconvolute the angular and energy distributions from the energy
spreads and to unambiguously transform the data to the CM system, a different
approach will be taken. The model predictions will be averaged over the initial
conditions and then transformed to the LAB reference frame to be compared directly
with experiment. Formally, this transformation may be expressed as
I LAB(eXY) 5dvl 5dv2 n,(v, ) n 2(v2) (v /u).V.V(V) ICM(O,u;V) (11)0 0
Here ILAB (0,v) is the flux of the observed product of laboratory angle
and velocity v. 'cm (0,u;V) is.the center of mass product flux predicted at
CM angle e and velocity u. This CM flux is a function of the relative velocity
of reactant approach V = (v 2 + v22 ) when angular divergence of the beams is
neglected. The velocity number distributions in the beam are given by nl(v l )

-18-
2and ni (v2). The Jacobian for the CM to LAB transformation is simply v/u
Finally, V(V) gives the dependence of the total cross-section for complex
formation Qc on the relative velocity.
The function I(qu;V) may be calculated from the loose transition-state
- model. Here for convenience an approximation is made. The assumption
I(e,u;V) "(E ;V) U (u;V) (12)
is made that the CM velocity distribution is independent of scatteringangle as given by (12). Except at the limit of L = J = L' this cannot be
rigorously true, but it is expected to be a good approximation for these studies.
This expectation is strengthened by inspection of Fig. 10(a) where this
separability appears to hold within the uncertainty of the data. It has also
been assumed that I(e,u;V) is independent of internal state of the reactant
diatomic molecule over the small range present in the experiment. Average values
for the internal vibrational and rotational energies can then be assigned.
The dependence of Qc on relative velocity is a direct consequence of the
loose transition-state model. The total cross section is determined by the
largest impact parameter that still allows the colliding species to surmount
the centrfugal barrier; thus
* 0 = 3/2 fT (2C /E)1/ 3 (13)
fbr the assumed van der Waals interaction which gives
v(v) V v-21 3 (14)a
to sub,.titute into Eq. (,I).
Th*. hiocen beam produced from the nozzle expansion has a very narrow velocity
cistributinn; therefore averaginkj over the velocity distribution of this beam isnot nececs,3ry. Finilly, no attempt is made to calculate the absolute magnitude
of the lahoratory scattering. The final calculation will be normalizea to the
a

- 19 -
laboratory data. With these approximations Eq. (11) simplifies to
ILAB(O.V) $dvI nl(v 1 ) (v2/u2 ) V1'/ 3 1(;V) U(u;V) (15)0
The calculation is accomplished by selecting nine velocities, equally spaced over
-' the velocity range of the oxygen atom beam.38 At each of these velocities
I(e;V) and (u;V) are calculated.ILAB(e,v) is then calculated for all desired product
laboratory angles and velocities and then summed over the nine reactant beam
velocities. The results for the loose transition-state model are given for
the angular distributing by the solid curves in Figs. 3and 4, and for the velocity
distributions by the solid curves in Figs. 6-8. It should be emphasized again
that, except for the single normalization constant, no adjustable parameters
are included in the calculations.
Figure 11(a) compares the angular distributions predicted by the model for
the five reaction systems. These distributions are for the oxygen atom velocity
which gave the greatest contribution to the total reactive scattering in the
integration over the oxygen atom velocity. The corresponding collision energies
were 3.92, 2.11, 2.44, 2.43, and 2.41 kcal/mole for the 0 + Cl2, Br2, and 12, ICl
and IBr reactions, respectively. The anisotropy ratios calculated for the 0 + 12
and IC reactions are 1.9 and 2.8 respectively, which are in good agreement with
the respective empirical values of 1.7 and 2.5 obtained in Ref. 7. The values
of Grice et al7 are lower for two reasons: those experiments were run at lower
collision energies where the anisotropy ratio is expected to be lower and the
convenient mathematical function used in Ref. 7 was a two term Legendre polynomial
expansion which rounds the CM #ngular distribution at 0 = 00 and 1800 and thus
underestimates the anisotropy ratio.
The CM to LAB calculations were repeatec using the same angular distributions
from the loose transition-state model but using the velocity distributions corres-
ponding to the energy distributions from Eq. (3) for a tight complex (n = 2).

-20-
Figure 11(b) compares these energy distributions for the five reaction systems.
The results of these calculations are shown by the dashed curves in Figs. 3, 4
and 6-8.
DISCUSSION: DYNAMICS
0 + Br2 and 0 + T2 Reactions. The laboratory angular distributions
calculated from the statistical complex models are in at least qualitative
agreement with the data for these two reactions. The angular distributions
appear in the correct angular range and have shapes similar to the experimental
distributions. The calculations for the loose collision complex are not peaked
sharply enough, but the calculations for the self contradictory model composed
of the angular distribution for a loose complex and the velocity distribution
for a tight complex give nearly quantitative agreement. The velocity distributions
for the 0 + Er2 reaction show the same results: the "hybrid" model gives results
that agree in shape and in position with experiment while the loose collision
complex predicts too much high velocity product.39 The agreement of the model
calculaticns with the LAB data, with the nominal CM distributions for 0 + Br2,
and with the anisotropy ratios extracted in an independent investigation 7 clearly
;hc.. that the an gular distributions are predicted very nearly exactly by the
Inose collision complex model while the velocity distributions are accurately
given by the approximate tight, linear complex model. Grice and coworkers7
al3o found that a tight, linear complex best fit their 0 + 12 velocity analysis
4 data and was in accord with their 0 + Br2 data. The angular distributions
obtained by Grice et al for the 0 + Br2 and 0 + 12 reactions are very similar
to tose obtained in this studyeven though their initial translational energy
was somewhat lower 40 although our angular distribution for the 0 + 12 reaction is
better resolved than that of Grice et al. 7 Comparison of velocity spectra is
not possible as we did not obtain this data for the 0 + 12 reaction and Grice
et al7 did not obtain velocity spectra for the 0 + Br2 reaction.

- 21 -
The apparent contradiction between the angular distribution and velocity
distribution models cannot be easily avoided by assuming that the product
velocity distribution is "fixed" early in the exit channel when the incipient
products are still interacting strongly (tight complex) while the angular
distribution is determined at the exit centrifugal barrier where a "loose"
complex must be the proper description. In order to calculate the angular
distribution from the loose complex all values of L' (product orbital angular
momentum) consistent with the conservation laws are weighted equally. Since
1' is related to final relative product velocity V' by
L' = I'
where b' is the final asymptotic impact parameter of the departing products,
only the velocity distribution from the loose collision complex model is
consistent with that angular distribution unless some ad hoc assumption con-
cerning the distribution of b' is made. Clearly a more unified model is
desirable, but for these systems the angular and the velocity distributions can
be adequately calculated from the separate and contradictory models.
These experiments are particularly sensitive to products produced with
low velocities in the center of mass system. This arises because the Jacobian
factor given in Eq. (1) greatly magnifies this scattering when it is observed
in the laboratory system. The approximate transition-state model predicts that
these reaction systems will give a particularly large amount of low velocity
products as may be seen from inspection of Eq. (7) and (8). The ratios p/1'
and C/C' are both much smaller than unity, so the energy distributions peak at
very low values as shown in Figure 11(b). This effect is responsible for the
lack of any clearly bimodal LAB angular distributions that usually characterize
reactions that proceed through collision complexes. Even though the C/C' ratio
enters Eq. (8) only to the power, the Jacobian factor so magnifies the low

- 22 -
velocity scattering that the data is quite sensitive to the value of this ratio.
The fact that the ratios calculated fcr these experimental systems do give
adequate fits to the data indicates corroborates our choice of the critical
configurations for complex information and decomposition as being the centrifugal
barriers where the interaction between reactants or products is adequately
given by the van der Waals interaction.
There are two important factors which vary with relative collision energy
in the model calculations. These are the cross section for complex formation
and the complex decomposition branching ratio between reactant and product
channels. At low collision energies the complex formation cross section is
larger (see Eq. (13).) The fraction of complexes decomposing into the exoergic
product channel rather than reforming reactants is also greater. Low energy
collisions give scattering near the halogen beam, near e = 900 in the LAB.
If either of these factors is neglected, the model predicts that the angular
distribution would have nearly the same shape but would appear at smaller
laboratory angles than the data show. These results also give more confidence
in the statistical complex model in general and the centrifugal barrier as the
criticdl configuration in particular.
0 + Cl2 Reaction. For this reaction, the agreement between our model and
experiment is not nearly as quantitative. The angular distribution appears to
be centere, at smaller laboratory angles than predicted by the statistical complex
4 r~models. This feature could be taken to indicate that collisions of high velocity
reactants which give scattering at smaller laborabory angles are more likely to
yield reaction than low velocity collisions. This would be consistent with the
5a I/experimental study which found that this system has an activation energy of
2.9 kcal/mole. To quantitatively verify this, the calculations for the "hybrid"
model were repeated with the inclusion of an approximate treatment of an energyo
barrier" in the entrance channel. At a reactant separation of 3.4 A (roughly

- 23 -
the distance expected from the atomic radii), only the collisions with
translational energies along their line of centers greater than 2.9 kcal/mole
were allowed to form complexes. It was not possible to easily account for
complexes decomposing to reactants so the variation of branching ratio with
collision energy was neglected. This approximate treatment gave the dash-dot
curves in Figs. (3) and (6). The predicted angular distribution is in better
agreement with experiment insofar as the general position is concerned, but it
is still not peaked sharply enough. The predicted velocity distribution,
however, shows too much high velocity product to agree with experiment.
The 0 + Cl2 reaction has been studied by Grice et al7d e at two different
initial translational energies, nominally 3.0 and 6.9 kcal/mole, using a seeded
oxygen nozzle beam. These workers find that the reaction proceeds via an
osculating complex41 with a ratio of backward to forward CM peaks of 0.30 at
the higher translational energy and an increased ratio of 0.55 at the lower
energy. Our initial translational energy (%2.9 kcal/mole) is comparable to
their lower energy study and coupled with the presence of the modest activation
energy the angular distributions should be quite similar. Although they7a
did not publish a LAB angular distribution, our LAB result would be quite
similar to theirs in that we do show a larger forward peak as compared to the
backward peak. As we did velocity analysis at only one angle (forward peak)
we could not construct a full CM map and thus cannot compare directly with
Grice et als CM angular distribution. We do note that they only obtained
velocity analysis at two angles at the lower energy which did not give a full
CM map either. Grice et al 7e found that there was a dependence of CM velocity,/
distribution on scattering angle and suggested that two components were present,
one proceeding by a stripping-like process and one proceeding via the osculating
complex. Our study, in agreement with the work of Grice et al7d at the higher

-24-
collision energy, predicts too much high velocity products. This is somewhat
surprising for a system proceeding by an indirect process with a more direct proc
superimposed on it. One would expect to see more high velocity product whereas
we find the opposite. Although it is likely that the reaction proceeds via
an osculating complex, the quantitative determination of the details of the
0 + Cl2 reactive scattering in the threshold region awaits further experiments.
0 + ICl and I + IBr Peactions. These two reactions are complicated by
the presence of two potential product channels: 10 + Cl or Br and ClO or
BrO + 1. Despite careful searches, only the 10 product has been observed in
each reaction. Figure 5 indicates that at least in the case of 0 + ICI, the
ClO product scattering is at least an order of magnitude less intense relative
to the 10 product than is predicted by the "hybrid" statistical complex model.
Figure 12 shows the branching ratio as a function of initial reactant trans-
lational energy as predicted by the statistical complex model. (These results
are from the loose complex model and are taken as the same in the "hybrid" model.)
When only the 10 product is allowed the exoergic product channel is greatly
fdvored over dissooiation of the complex to reform reactants at low collision
energies. At hich energies the ratios become more nearly equal. As discussed
above, this behavioe favors scattering at angles near 900. In contrast, if both6
product channels are allowed the fraction of complexes dissociating to the 10
product remains almost constant with reactant translational energy. For the
I + !Cl 7ystem, only the 10 channel can be allowed in order to come close to
matching the observe1 angular distribution. Figure 4 indicates that the
exoerimentl data sti1 lies at an angular range too large to be fit by the model.
Either sci'e factor that has not"been taken into account by the model highly
favors reaction at very low collision energies, or some experimental problem
such as the presence of van der Waals dimers must account for this.
a 4•
25-
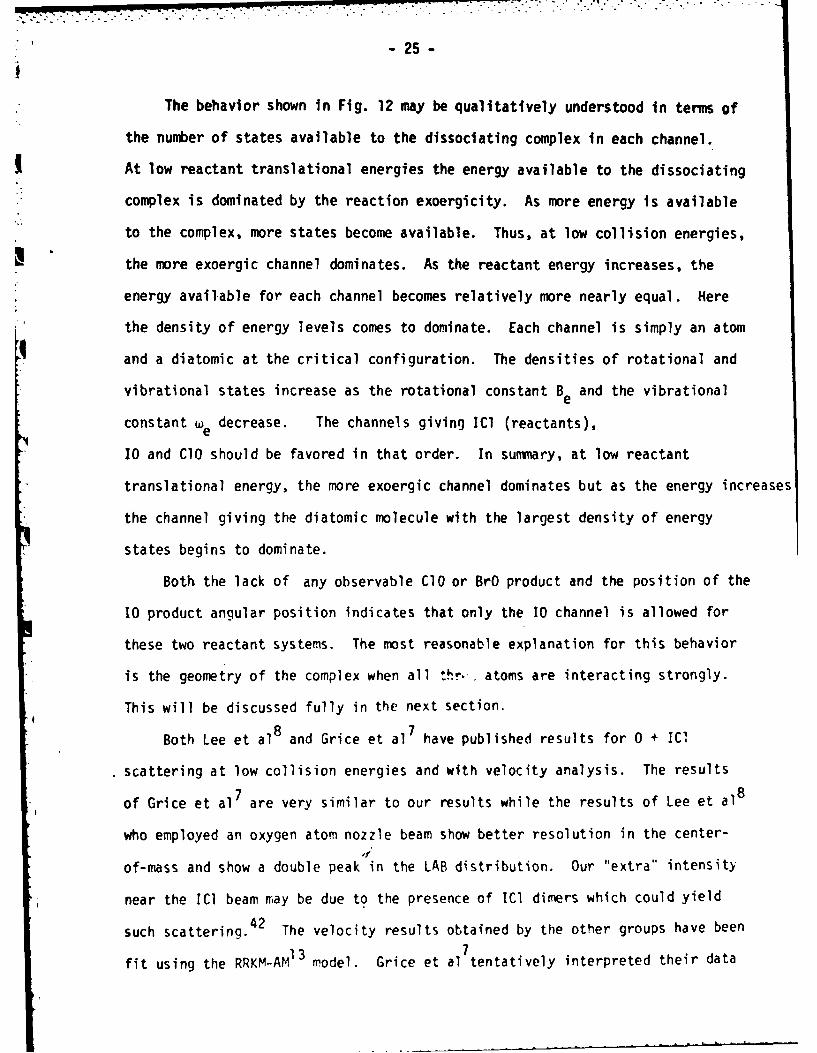
The behavior shown In Fig. 12 may be qualitatively understood In terms of
the number of states available to the dissociating complex in each channel.
At low reactant translational energies the energy available to the dissociating
complex is dominated by the reaction exoergicity. As more energy Is available
to the complex, more states become available. Thus, at low collision energies,
the more exoergic channel dominates. As the reactant energy increases, the
energy available for each channel becomes relatively more nearly equal. Here
the density of energy levels comes to dominate. Each channel is simply an atom
and a diatomic at the critical configuration. The densities of rotational and
vibrational states increase as the rotational constant Be and the vibrational
constant we decrease. The channels giving ICl (reactants),
10 and CIO should be favored in that order. In summary, at low reactant
translational energy, the more exoergic channel dominates but as the energy increases
the channel giving the diatomic molecule with the largest density of energy
states begins to dominate.
Both the lack of any observable ClO or BrO product and the position of the
10 product angular position indicates that only the 10 channel is allowed for
these two reactant systems. The most reasonable explanation for this behavior
is the geometry of the complex when all t.r, . atoms are interacting strongly.
This will be discussed fully in the next section.
Both Lee et al8 and Grice et al7 have published results for 0 + ICI
scattering at low collision energies and with velocity analysis. The results
of Grice et al7 are very similar to our results while the results of Lee et al8
who employed an oxygen atom nozzle beam show better resolution in the center-
of-mass and show a double peak in the LAB distribution. Our "extra" intensity
near the ICl beam may be due to the presence of ICl diers which could yield
such scattering. 42 The velocity results obtained by the other groups have been
fit using the RRKM-AM13 model. Grice et al 7tentatively interpreted their data

S.- 26 -
in terms of a loose complex model rather than the tight complex model we have
used. Lee et al 8do not present details of their calculations so we cannot
discuss this point in relation to their work. As indicated in Figure 4 here,
the angular distribution is better fit by the loose complex calculation at
Ithe collision energy that pertains to the experiments reported here.
10 Bond Energy. Two divergent values may be found in the literature for
the dissociation energy of the 10 molecule: A4 kcal/mole and 57 kcal/mole.44
In this study the reaction of 0 with ICI (Do = 49.6 kcal/mole3) to give the
product 10 has been found to proceed at low collision energies. The reaction
of 0 + CF3I (Do for CF3-1 = 54 kcal/mole 45 ) to yield 10 + CF3 is also spontaneous~46,47
at thermal energies. For these two reactions to proceed readily they must
be either exoergic or only slightly endoergic, so the reactant bonds broken in
these two reactions may be taken as approximate lower limits for the 10 dis-
sociation energy. These considerations certainly preclude the 44 kcal/mole value
and suggest that the larger value is approximately the minimum value consistent
with the results of the 0 + CF3 1 reaction.
Te data obtained in this study for the 0 + IC reaction provide a sensitive
test for the true value of the 10 dissociation energy. This dissociation energy
is one parameter of the statistical complex models. A value of 57 kcal/mole
gave the best overall fit to the angular and velocity distributions. Variations
of 2 kcal/nole gave significantly poorer fits. For the 0 + 12 and 0 + IBr
reactions the same D0 value was used in the calculations and gave good results,0
but since these reactions are more exoergic, the fit is not nearly as sensitive
to the value of this parameter. We, thus, suggest a value of 57 + 2 kcal/mole for
the dissociation energy D0 of f'O. Other molecular beam studies of this reaction7 ,8
determined a slightly lower value: 53 + 3 kcal/mole. The slight disagreeent
between the two molecular beam studies is perhaps due to the assumption of a loose
collision complex model for the velocity distribution calculations.

- 27 =
Total Reaction Cross Sections. Table III gives Q., the total cross
section for complex formation predicted by the statistical complex model, and
QR' the total cross section for reaction, which is obtained from Qc by
multiplying by the branching ratio predicted from the loose collision complexo2
model. The rough experimental values of QR obtained in this study are 0OA.
The pre-exponential factor of the rate constant from the flow tube study of
the 0 + C12 reaction corresponds to QRIA. These experimental values are
significantly lower than the model predictions. Such has been the case in
other studies48 of reactions proceeding through long-lived complexes where it
has been possible to estimate the magnitude of the total cross section or
compare reactive and non-reactive scattering. This behavior is usually interpreted
as indicating that a large fraction of the collisions which surmount the
centrifugal barrier still cannot form a complex which is capable of dissociating
to form products. Grice7 has suggested that for these reactions only the complexes
which form with a nearly collinear O-X-Y orientation are capable of dissociating
as products. As will be discussed in the next section, this is in accord with
the most stable geometry of the collision complex believed formed in these reactions.
DISCUSSION: ELECTRONIC STRUCTURE
The experimental results demonstrate that the reaction of oxygen atoms with
diatomic halogens (excluding F2) proceed via a long-lived complex or an osculating
complex in the case of the Cl2 reaction. Such long-lived three atom complexes
probably have well-depths at least of the order of 20 kcal/mole based on estimates
from RRKM theory. The molecules XOX are thought to have a 'A1 ground state
with an obtuse bond angle 49 b sed on the structure of Cl 050 at first glance,2'
these molecules suggest themselves as viable intermediates. However, one must
consider the spin and spatial symmetry constraints placed on the intermediate
state by the reactant and product states assuming that the reaction occurs on

. m~ . | . . n ml| " . I P m P m . . ... -., . . -. -. . . • . .. . . . . . . . .
- 28 -
a single electronic surface.51 The correlations for the reaction O+X2,-OX+X
are summarized in Table IV. The triplet ground state of the oxygen atom, 3pg
requires the reactants to have an overall triplet state and this necessitates
the formation of a triplet intermediate unless a spin transition occurs. This
spin correlation eliminates the ground sate of X2 0, 'A,, from being the
complex sampled by this reaction. For three atoms, AB2 , we need
consider only three approaches, CV, CS and C 2v. All of the complexes have at
least one correlation within the triplet manifold with the reactant states.
The product states, due to the presence of two doublets, correlate asymptotically
with both singlet and triplet states of the intermediate.
In order to provide further information about the nature of the electronic52
structure complex, orbital correlations must also be examined. Such correlations
are most easily seen for the C approach of an 0 atom to the X molecule. This
is shown by the "weeny-orbital" 53 diagram in Figure 13. We have ignored the
valence s orbital as it is low-lying and will not contribute to the correlations.
3 -2It is obvious that the E state of the intermediate arising from the 12 configu-
ratio, wi7 be repulsive as two "sigma" electrons on the atom are approaching a two
electron si, ma bond. Thus, for the collinear approach the 311 states of the
reactants must correlate with the triplet state of the complex. However, for
the intermediate to show the proper correlations, the orbital occupations of
the complex must be ... (,r) 3 (o)l or ... (d)l( r)3 in order to give a 311 state.
This is not the ...(d*)2 (n*2 configuration that we initially predicted4 and,
following -is, that Grice preJicted, 7 would be the orbital configuration of theconolex based simply on state diagrams.Rather this latter configuration gives rise
to states that correlate with the repulsive interaction described above. For
the C, apcroach, a similar correlation can be expected. The orbital correlation
diagram for the C2. approach is somewhat more difficult to construct but the
correlations ran be related to excited states of the molecule X20. As shown in
. . , , , , , i , -* i . , .,................................... .. .. -L..... ....
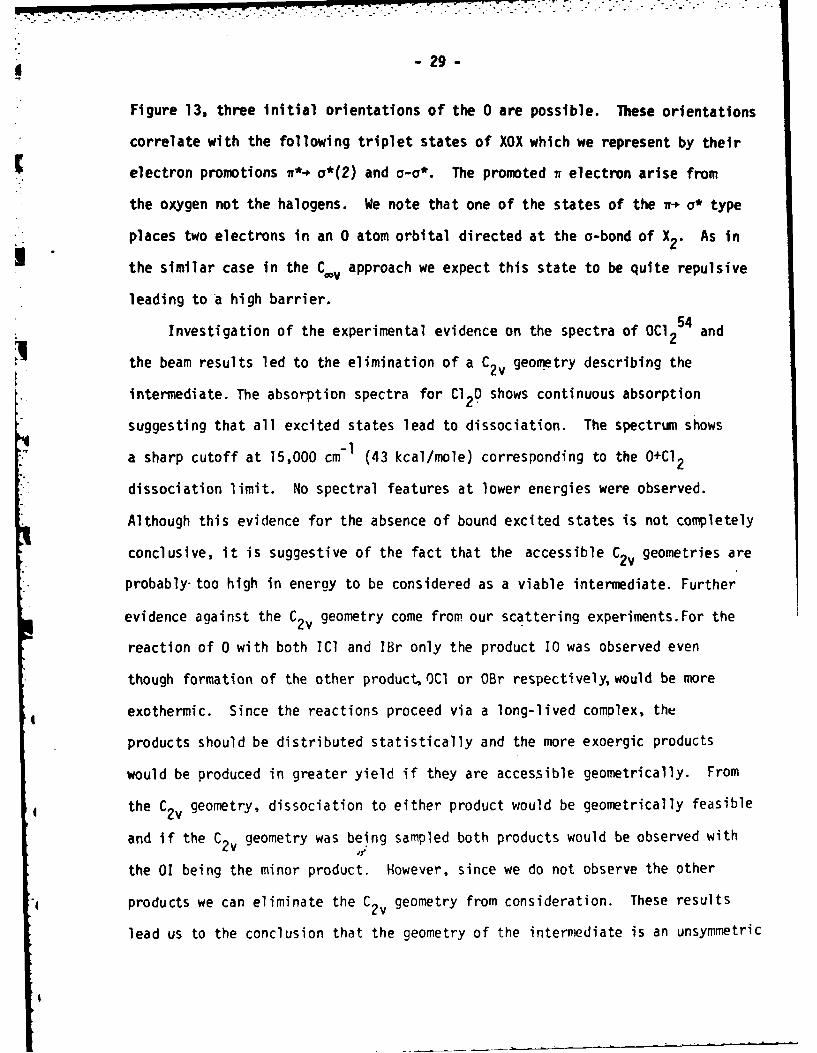
S- 29-
Figure 13, three initial orientations of the 0 are possible. These orientations
correlate with the following triplet states of XOX which we represent by their
electron promotions 7r*-# a*(2) and a-a*. The promoted n electron arise from
the oxygen not the halogens. We note that one of the states of the "r. G* type
places two electrons in an 0 atom orbital directed at the a-bond of X2. As in
the similar case in the Cv approach we expect this state to be quite repulsive
leading to a high barrier.
Investigation of the experimental evidence on the spectra of OC1254 and
the beam results led to the elimination of a C2v geometry describing the
intermediate. The absorption spectra for C120 shows continuous absorption
suggesting that all excited states lead to dissociation. The spectrum shows
a sharp cutoff at 15,000 cm-1 (43 kcal/mole) corresponding to the O+C12
dissociation limit. No spectral features at lower energies were observed.
Although this evidence for the absence of bound excited states is not completely
conclusive, it is suggestive of the fact that the accessible C2v geometries are
probably-too high in energy to be considered as a viable intermediate. Further
evidence against the C2. geometry come from our scattering experiments.For the
reaction of 0 with both ICl and IBr only the product 10 was observed even
though formation of the other product, OCI or OBr respectively, would be more
exothermic. Since the reactions proceed via a long-lived complex, the
products should be distributed statistically and the more exoergic products
would be produced in greater yield if they are accessible geometrically. From
the C2v geometry, dissociation to either product would be geometrically feasible
and if the C2v geometry was being sampled both products would be observed with
the 01 being the minor product. However, since we do not observe the other
products we can eliminate the C2. geometry from consideration. These results
lead us to the conclusion that the geometry of the intermediate is an unsymmetric

triplet of the form OXY with either a linear or bent configuration (we cannot
distinguish between these geometries from our results) and an orbital con-
figuration using the % notation of either --- (a*)1 (w*3) or --- (*) 3 (*)l.Further
we note for the case where the halogen is unsymnetric, that the intermediate
*1 has the halogen with the lowest electronegativity in the central position of
the complex. This follows directly from our observation that only 01 is
, produced in the O+ICl and O+IBr reactions.
Our structure for the intermediate shows an interesting feature on the
Walsh orbital diagram for these species. Walsh predicted 55 that the upper
orbitals in the general diagram are ordered -...n,w*ato* by increasing energy
while Mulliken predicted56 an ordering -..n,otnjo*. For our predicted triplet*1*3*1* *
state with orbital occupancy * o* or a * 3 the middle a and w* orbitals must be
essentially degenerate. If they are not degenerate then a 2 configuration* . AT *
arises if a is lower than nr while a n configuration arises for w lower than
o . However, neither of these configurations is allowed as the former arises
from a repulsive interaction as discussed previously while a V 4 configuration
leads to a singlet state which is not allowed. Since the a and n orbitals
are predicted to have a strong angular dependence with a increasing rapidly
with decreasing angle then it is unlikely that the molecule is strongly bent
since this would break the accidental a -i degeneracy and lead to incorrect
states of the intermediate.
Evidence from other studies supports our conclusions as to the nature of
the complex. Rochkind and Pimentel have identified an isomer of Cl20 in a
matrix isolation study of the photolysis of Cl20. Using infrared methods, they
characterized a species Cl...CIO with the CIO being similar to the diatomic
and the remaining Cl being weakly bound to the chlorine of the chatomic. They
also suggest that the molecule is not linear and that the bonding between

- 31 -
A
chlorines follows the model for the (p--,*)o bond developed by Spratley and
Pimentel. 58 A similar matrix isolation study of FCIO has been carried out
by Andrews and coworkers.59 They find a similar structure F.--CIO with the
F weakly bound to the chlorine end of diatomic ClO with this moiety being very
similar to free ClO. The beam results suggested an osculating complex for the
O+C12 reaction and we can estimate the stability of the OCI Cl complex as
being 10 kcal/mole. In agreement with these studies an asymmetric form was
predicted from the scattering experiments. The second study is in agreement
qwith our prediction that the least electronegative atom (Cl in this case)
occupies the central atomic position. For the system OC1 Cl it is apparent
that the second chlorine polarizes ClO to form a weak bond between the chlorines.
For complexes involving heavier halogens, the well depths increase significantly
as scattering typical of a long-lived complex is found. Further evidence for
the electronegativity ordering of the atoms in the complex comes from studies
on the isoelectronic XY+ trihalogen cation where the least electronegative atom is2 +60
always found to occupy the central site even in the case of Cl 2F. These studies
always show a bent cation.Similar electronegativity arguments are also found to hold
for other reactions of radicals with halogens.' 1 We note that the O+F2 reaction
has a significant barrier.6 In this case, the least electronegative element,
0, cannot have easy access to the central position (C2v approach) and thusa barrier is expected. It is also likely that the reactions proceeds by a
direct mechanism rather than by a complex mechanism. Using the above results,
we can summarize our predicted structure for the complex as being an asymmetric
triplet OXXwith an electron configuration of either .... (o*) (r*)3 or
.... (a*) and most likely the complex is linear or slightly bent.
We now compare these complexes with other known species in order to place
them in a chemical perspective. If we replace the 0 atom, by a halogen the
complex has the structure X3 and is expected to be quite weakly bound as isi-

-32-
found from molecular beam studies11 of the reaction X+Y2 which showed the
presence of osculating complexes. Substitution of a halogen in our complex61
by an oxygen yields XO2 which for C10 2 has two stable isomers OClO
and OOCl in doublet states. Indeed the latter asymmetric isomer is predicted
to be the more stable form.62 Substitution of another oxygen leads to ozone
which is a ground state singlet with a weak 070 bond. The trend in molecular
stabilities for these species follows the addition of extra w electrons
beginning with ozone. We note that only when there is a full complement of
w electrons as in X does the system become quite weakly bound. If the
species is HX2 rather than X3 then there is no complex formed9 even though
the system does follow the electronegativity ordering rule that the least
electronegative atom occupies the central site.
Acknowledgements
We gratefully acknowledge support of the early stages of this work by
the National Science Foundation and support of its final stages by the
Air Force Geophysical Laboratory under contract F19628-78-C-0100.
4
4

* - 33-
APPENDIX: MULTI-ANGLE TIME NORMALIZATION
FOR ANGULAR DISTRIBUTION MEASUREMENTS
" .In many molecular beam experiments the scattering intensity at all angles
exhibits a systematic variation with time. Usually one reference angle with
a relatively noise-free signal is chosen, and its magnitude is periodically
measured to follow this time variation. In this study, all the data points
are relatively noisy and the measurement of each is repeated several times.
Therefore, a more sophisticated time normalization treatment is required. The
procedure adopted here63 is (1) to calculate the most probable value of the
mean of all the raw data points taken at each angle, (2) to calculate reduced
data points by dividing each data point by the calculated mean of all the data
points taken at that angle, (3) to fit all of these reduced data points to
a Legendre polynomial expansion in time, (4) to obtain time normalized data
points by dividing each original data point by the value of the Legendre
expansion corresponding to the time that the data point was taken, and (5) to
repeat steps (2) - (4) with the mean recalculated from the time normalized data
points obtained in step (4). This iteration conti.nues until the sum of the
squares of the deviations of the reduced data points from the Legendre expansion
converges to a minimum. It is considered important here to obtain reliable
0 confidence limits on the final results; thus error propagation techniques64
are used to generate statistically meaningful error bars on the final averaged,
time normalized signals. A paragraph will now be devoted to the calculations
required for each of the above steps.
A single measurement, Si, of the reactive scattering at angle j is the
difference of the modulated signal with the beam flag open and closed. The
modulated signal is the difference between the counts on the "on" scalar,
NA, and the counts on the "off" scalar, NB
S Sij (NA- NB)open - (NA - N dclosed (Al)
-34-
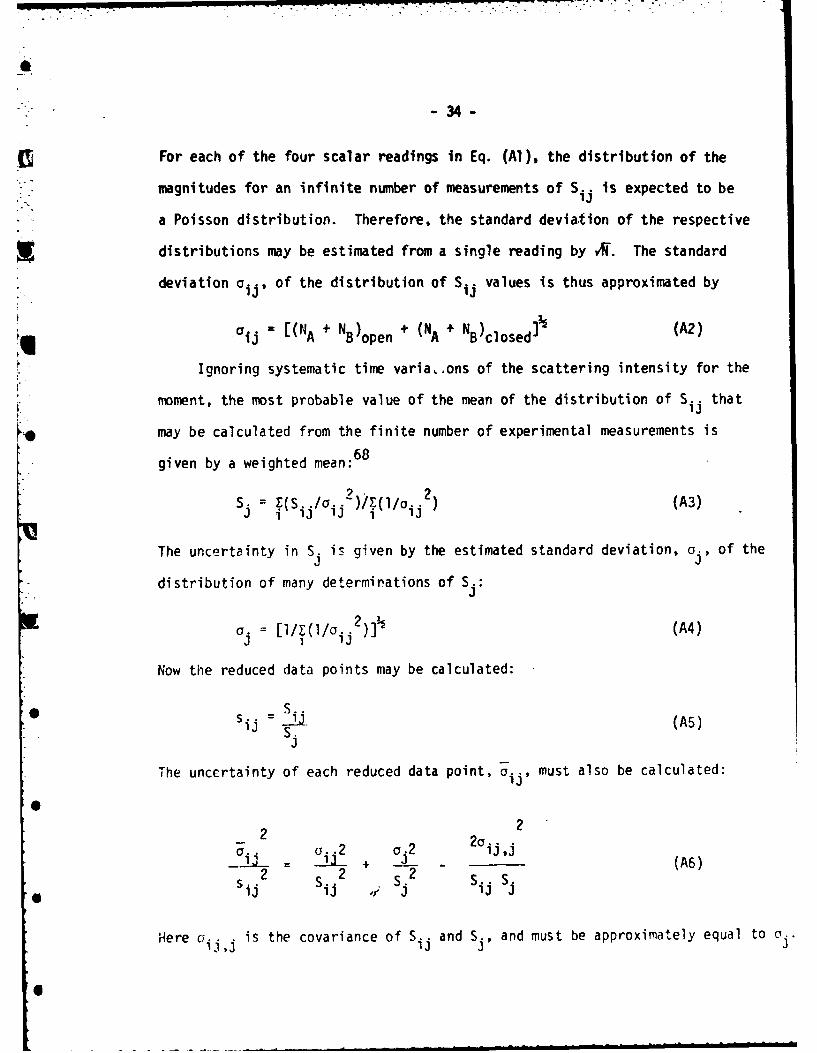
For each of the four scalar readings in Eq. (Al), the distribution of the
magnitudes for an infinite number of measurements of Sii is expected to be
a Poisson distribution. Therefore, the standard deviation of the respective
distributions may be estimated from a single reading by X. The standard
deviation aii, of the distribution of Si values is thus approximated by@13
Ui.Oj = [(NA + NB)open + (NA + NB)closed ] (A2)
Ignoring systematic time varia..ons of the scattering intensity for the
moment, the most probable value of the mean of the distribution of S.. that
13
' may be calculated from the finite number of experimental measurements is
68given by a weighted mean:
S = (Sij/ij )/(I/ij2) (A3)
The uncertainty in S. is given by the estimated standard deviation, o, of the
distribution of many determinations of S.:
a = [I/W(I/oi 2 (A4)3 ij
Now the reduced data points may be calculated:
* S..13sij S. (A5)
3
The uncertainty of each reduced data point, ij, must also be calculated:
2 22 .2 2A6)
1 2 2 s. ssij Sij 2 / 3 Sij
Here aiirj is the covariance of Sij and S., and must be approximately equal to u j.
I3
6i- ! i B |I d I t - |

-35-
The time normalization function is a weighted least-squares fit of the
reduced data points to a Legendre polynomial expansion defined by
F(t) = a nPn (cos t) (A7)
where 0 < t < 180. Each of the reduced data points is weighted by I/ij 2. It
- - is necessary to express the time span, T, of the experiment on the range of t.
This coordinate change is accomplished by t=cT-d where c = 0.98 [180/(Tmax-Tmid]
and d = c Tmin - (.02)(180). A maximum of ten polynomials is used, but the
expansion is terminated at a lesser number, m, if two conditions are met. First
the F distribution test of an additional term as described in Reference 64 is
applied after the calculation of each additional term to determine if that term
O is statistically justified. If the probability is -. 5% or greater that a set
of points with random deviations from the m term expansion would be fit by the
m + 1 term expansion as well as the true data points are actually fit, then the
first condition is fulfilled. Second, the X2 test of Reference 64 is used to
test the overall fit for m terms. If the probability is 't 5% or greater thatthe deviations of the sij's from the polynominal expansion are as great as would be
expected for the deviations of data points with the given uncertainties from
the true time normalization function, then the second condition is fulfilled.
The first approximation, S..', to the time normalized data points may now
be calculated
Si' : Sij /F(t) (A6)
The uncertainty of each Sij' is given by oij' in
,2
aa. .222 2 F(t)2(A9)
•Si S ij Ft
l 2
13 1J - mm•m
0
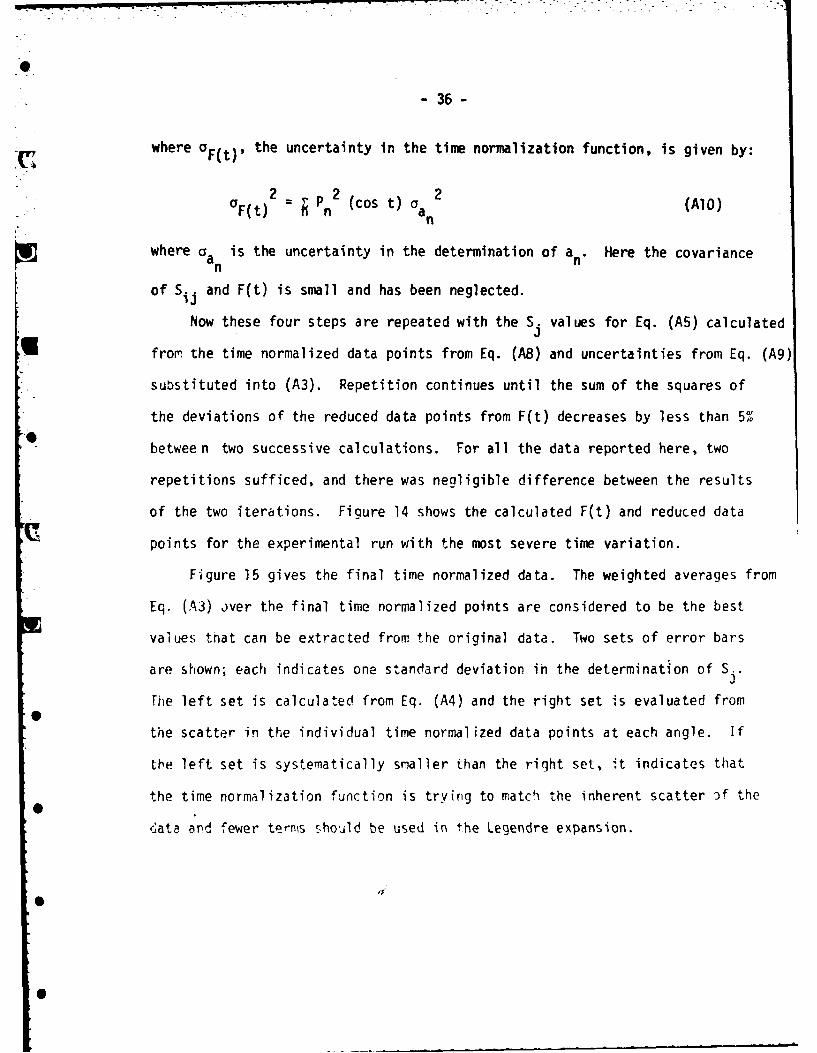
- 36 -
where aF(t)' the uncertainty in the time normalization function, is given by:
2(Cos t) " 2 (AlO)°F~t) = P 2 a
where aa is the uncertainty in the determination of a . Here the covariancea n
of S.j and F(t) is small and has been neglected.
Now these four steps are repeated with the Si values for Eq. (A5) calculated
; fro. the time normalized data points from Eq. (A8) and uncertainties from Eq. (A9)
substituted into (A3). Repetition continues until the sum of the squares of
the deviations of the reduced data points from F(t) decreases by less than 5%
between two successive calculations. For all the data reported here, two
repetitions sufficed, and there was negligible difference between the results
of the two iterations. Figure 14 shows the calculated F(t) and reduced data
points for the experimental run with the most severe time variation.
Figure 15 gives the final time normalized data. The weighted averages from
Eq. (A3) iver the final time normalized points are considered to be the best
values that can be extracted from the original data. Two sets of error bars
are shown; each indicates one standard deviation ih the determination of S..J
Fhe left set is calculated from Eq. (A4) and the right set is evaluated from
the scatter in the individual time normalized data points at each angle. If
the left set is systematically smaller than the right set, it indicates that
the time normalization function is trying to matcO the inherent scatter of the
4ata and fewer terms should be used in the Legendre expansion.
'5"
S
6"
-37-
References
1. D. G. Truhlar and D. A. Dixon in "Atom-Molecule Collision Theory: A Guidefor the Experimentalist", ed. R. B. Bernstein (Plenum Press, New York 1979)C18.
2. N. C. Blais and D. G. Truhlar, J. Chem. Phys. ,,, 4186 (1974).
3. a) J. M. Farrar and Y. T. Lee, J. Am. Chem. Soc., , 7570 (1974); b) J. ChemPhys., , 3639 (1975); c) J. J. Valentini, M. J. Fggiola, and Y. T. Lee,J. Am. em. Soc., U, 853 (1976); d) Faraday Discuss. Chem. Soc. R, 232(1977).
4. Preliminary results have previously been reported: a) D. D. Parrish andD. R. Herschbach, J. Am. Chem. Soc. 2, 6133 (1973); b) D. A. Dixon,
SD. D. Parrish and D. R. Herschbach, Fraday Discuss. Chem. Soc. 5k, 385 (1973)
5. a) M A.A. Clyne and J. A. Coxon, Trans. Faraday Soc. 62, 2175 (1966);b) H. Niki and B. Weinstock, J. Chem. Phys., 4,324911967); c) J. N.Bradley, 0. A. Whytock and T. A. Zaleski, J. C&em. Soc., Faraday Trans. I.69, 1251 (1973); d) M. Kaufman and C. E. Kolb, Chem. Instrum. 3, 175 (1971).
"0
6. R. H. Krech, G. J. Diebold and D. L. McFadden, J. Am. Chem. Soc., V,' 4605(1977).
7. a) C. F. Carter, M R. Levy, K. B. Woodall and R. Grice, Faraday Discuss.Chem. Soc. , 381 (1973); b) D.St.A.G. Radlein, J. C. Whitehead and R. Grice,Na ture, 53,9 37 (1975); c) Mol. Phys., ZA, 1813 (1975); d) P. A. Garry,C. V. Nouikow and R. Grice, Chem. Phys. Lett., 49, 116 (1977); e) ibid., 55,
19 (]978). e
8. S. J. Sibener, R. J. Buss and Y. T. Lee, XI International Symposium onRarefied Gas Dynamics 1978 to be published.
9. J. D. McDonald, P. R. LeBreton, Y. T. Lee and D. R. Herschbach, J. Chem. Phys.,
56, 769 (1972)
10. a) J. A. Logan, C. A. Mims, G. W. Stewart and J. Ross, J. Chem. Phys., §.,1804 (1976); b) C. F. Carter, M. R. Levy, and R. Grice, Faraday Discuss. Chem.Soc., k5, 357 (1973).
11. a) J. J. Valentini, Y. T. Lee and D. J. Auerbach, J. Chem. Phys., §, 4866
(1977); b) Y. T. Lee, P. R. LeBreton, J. D. McDonald and 0. R. Herschbach,J. Chem. Phys. 51, 455 (1969); c) N. C. Blais and J. B. Cross, J. Chem. Phys.,
* , 3580 (1970);') D. Beek, F. Engelke and H. J. Loesch. Ber. Bunsenges,
Pys. Chem. 72, 1105 (1968).
12. For a review :ee: D. R. Herschbach, Adv. Chem. Phys. 10, 319 (1966).
13. S. A. Safron, N. D. Weinstein, D. R. Herschbach, and J. C. Tully, Chem. Phys.
* 0Lett., 12, 564 (1972).
14. a) 0. K. Rice, "Statistical Mechanics, Thermodynamics, and Kinetics", W. A.
Freeman, San Francisco, Calif., 1967, pp. 495-573; b) R. A. Marcus, J. CkPm.
Phys., 4 . 265k (1965); c) P. J. Robinson and K. A. Holbrook, "Unimolecular
Reactions , (Wiley-Interscience, London, 1972).0

-38-
15. D. A. Case and D. R. Herschbach, J. Chem. Phys., 64, 4212 (1976).
16. D. D. Parrish, to be published.
17. Y. T. Lee, J. 0. McDonald, P. R. LeBreton, and D. R. Herschbach, Rev. Sct.Instrum., 40, 1402 (1969).
f"
18. J. D. McDonald, Ph.D. thesis, Harvard University, 1971.
19. F. C. Fehsenfeld, K. M. Evenson, and H. P. Broida, Rev. Sci. Instr., 36,294 (1965).
20. S. V. Filseth, F. Stuhi, and K. H. Welge, J. Chem. Phys., 52, 239 (1970).
21. J. B. Anderson in "Molecular Beams and Low Density Gas Dynamics", (MarcelDekker, New York, 1974) p. 1.
22. a) W. B. Miller, S. A. Safron and D. R. Herschbach, Discuss. Faraday Soc.,108 (1967); b) G. M. McClelland and D. R. Herschbach, J. Phys. Chem.
in press (1979).
!A 23. J. H. Birely, R. R. Herm, K. R. Wilson, and D. R. Herschbach, J. Chem.Phys., V, 993 (1967).
24. J. C. Light, Faraday Discuss. Chem. Soc., 44, 14 (1967) and work cited therein
25. See, for example, R. B. Leachman and E. E. Sonmann, Ann. Phys. 18, 274 (1962).
26, S. J. Riley and 0. R. Herschbach, J. Chem. Phys., 58, 27 (1973).
27. W. B. Miller, Ph.D. Thesis, Harvard Univ., 1969.
28. For the 0 + Cl , Br2, and 12 reactions the product channel was assumed to bedoubly degenergte, while for the mixed halogen reactions, Rach channelwas taken as non-degenerate.
29. H. L. Kramer and D. R. Herschbach, J. Chem. Phys., k , 2792 (1970).
30. A. I. Vogel, J. Chem. Soc., 644 (1948).
31. R. R. Teachout and R. T. Pack, Atomic Data, 3, 195 (1971).
32. E. Herbst and W. Steint tz, J. Chem. Phys., 56, 5342 (1972).
33. The IBr Dipole moment is an estimate obtained by considering the relative
eiectronegativities.
34. C. R. Byfleet, A. Carrington, and D. K. Russell, Molec. Phys., 20, 271 (1971).
35. D. deB. Darwent, "Bond Dissociation Energies in Simple Molecules", Nat. Bur.Stand. Pub. NSRDS-NBS 31 (1970).
36. B. Rosen, "Spectroscopic Data Relative to Diatomic Molecules", (Pergamon,New York, 1970).

-39-
37. Trial calculations including averaging over the halogen beam velocityIndicates it is indeed negligible. The single velocity is taken as themost probable velocity in a nozzle beam with high Mach number assumingcomplete rotational relaxation and no vibrational relaxation. Thus,
ri V = 7/2 d where a is the most probable velocity in the gas before theexpansion. Velocity analysis of the nozzle beam is consistent with thisassumption.
38. The velocities selected were integral multiples of 1/4 a. This coversthe full range of velocities present to a significant proportion in athermal beam.
39. The disagreement in magnitude of the model calculations with the velocityspectra data is deemed to be an experimental problen in the normalizationof the velocity distribution to the angular distribution.
- 40. The work described in Raference 7a-7c employed an 0 atom beam characterizedby a temperature of 350 k.
41. G. A. Fisk, J. D. McDonald and D. R. Herschbach, Discuss. Faraday Soc. 44,228 (1967).
42. a) D. L. King, D. A. Dixon and D. R. Herschbach, J. Am. Chem. Soc., 96, 3328(1974); b) D. A. Dixon and D. R. Herschbach, J. Am. Chem. Soc., "668(1975); c) D. A. Dixon, Ph.D. Thesis, Harvard U. (1975).
43. E. H. Coleman, A. G. Gaydon, and W. M. Vaidya, Nature, 162, 108 (1948);V. M. Trivedi and V. B. Gohel, J. Phys. B., 5, L38 (1972); M. L. P. Rao,D. V. K. Rao and P. T. Rao, Phys. Lett., 50A? 341 (1974).
44. L. F. Phillips and T. M. Sugden, Trans. Faraday Soc., 57, 914 (1961);R. B. Singh and D. K. Rai, J. Quant. Spect. Rad. Trans., 5, 723 (1965).
45. Lord, Goy and Pritchard, J. Phys. Chem., 71, 2705 (1967).
46. M. Kaufman and C. E. Kolb, Chem. Instrumentation Q, 175 (1971).
47. P. A. Gorry, C. V. Nowikow and R. Grice, Chem. Phys. Lett., k , 24 (1978).
• 48. W. B. Miller, S. A. Safron and D. R. Herschbach, J. Chem. Phys., U, 3581(1972).
49. B. J. Brisdon in "Inorganic Chemistry, MTP International Review of Science,Series 1, Vol. 3" ed. V. Gutmann (Butterworths, London, 1971) Chap. 8.
* 50. G. E. Herberich, R. H. Jackson and D. J. Millen, J. Chem. Soc. A, 336 (1966).
51. B. H. Mahan, Accts. Chem.,Res. , 55 (1975).
52. R. B. Woodward and R. Hoffman, "The Conservation cf Orbital Symmetry",(Verlag Chemie, GmbH, Weinheim, 1970).
. W. A. Goddard, 111, J. Am. Chem. Soc., &, 793 (1972).

-40-
54. a) W. Flnkelnburg, HJ. Schumacher and 6. Stelger, Z. Phys. Chem127 (1931); b) M.C.F. Goodeve and J. I. Wallace, Trans. Far. Soc.254 (1931); c) M. Bodenstein and G. B. Klstiakowsky, Z. Phys. Chem.371 (1925).
55. A. D. Walsh, J. Chem. Soc.,2266 (1952).
56. R. S. Mulleken, J. Chem. Phys. , 739 (1935).
57. M. M. Rochkind and G. C. Pimentel, J. Chem. Phys. 46, 4481 (1967).
58. R. D. Spratley and G. C. Pimentel, J. Am. Chem. Soc., 88, 2394 (1966).
59. L. Andrews, F. K. Chi and A. Avkell, J. Am. Chem. Soc., 96, 1997 (1974).
60. R. J. Gillespie and M. J. Morton in "Inorganic Chemistry, MTP InternationalReview of Science, Series 1, Vol. 3", ed. V. Gutmann (Butterworths, London,1971) Chapter 7.
61. See reference 48 for a review of this work.
62. J. L. Gole, (unpublished results). Ab initio SCF-CI Calculations Predictthe ClOO Isomer to be More Stable.
63. This procedure closely parallels that described in detail elsewhere (D.D... Parrish, Ph.D. thesis, University of California, Berkeley, 1970).
64. See, for example, P. R. Bevington, Data Reduction and Error Analysis forthe Physical Sciences (McGraw-Hill Book Co., New York, 1969).
65. Equation (3) is strictly true only for a Gaussian distribution, but sincethe values of N are large (r 10 - 105), the Poisson distributions areclosely approximated by Gaussian distributions.
,i
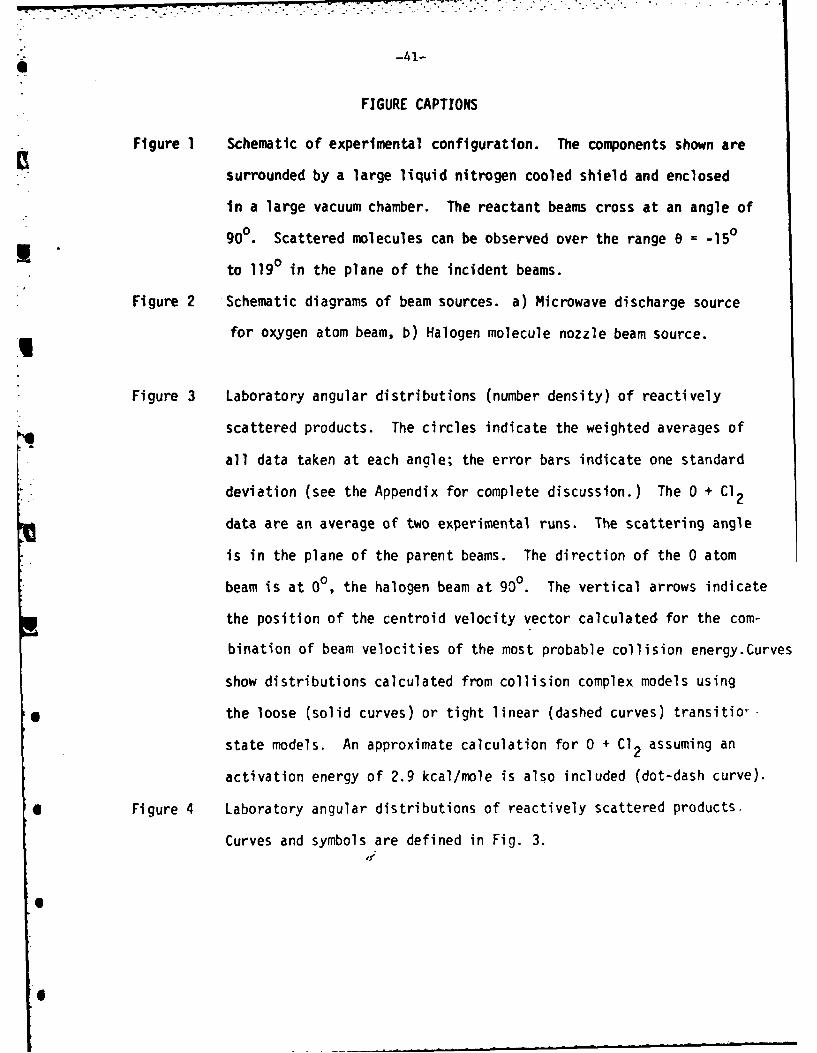
~-41-
FIGURE CAPTIONS
Figure 1 Schematic of experimental configuration. The components shown are
surrounded by a large liquid nitrogen cooled shield and enclosed
in a large vacuum chamber. The reactant beams cross at an angle of
90°. Scattered molecules can be observed over the range e = -150
to 1190 in the plane of the incident beams.
Figure 2 Schematic diagrams of beam sources. a) Microwave discharge source
for oxygen atom beam, b) Halogen molecule nozzle beam source.
Figure 3 Laboratory angular distributions (number density) of reactively
scattered products. The circles indicate the weighted averages of
all data taken at each angle; the error bars indicate one standard
deviation (see the Appendix for complete discussion.) The 0 + Cl2
data are an average of two experimental runs. The scattering angle
is in the plane of the parent beams. The direction of the 0 atom
beam is at 00, the halogen beam at 900. The vertical arrows indicate
the position of the centroid velocity vector calculated for the com-
bination of beam velocities of the most probable collision energy.Curves
show distributions calculated from collision complex models using
* the loose (solid curves) or tight linear (dashed curves) transitior
state models. An approximate calculation for 0 + C12 assuming an
activation energy of 2.9 kcal/mole is also included (dot-dash curve).
• Figure 4 Laboratory angular distributions of reactively scattered products.
Curves and symbols are defined in Fig. 3.,W
S
6 'm

-7.. ," .
-42-
Figure 5 Laboratory angular distributions of reactively scattered products
from the 0 + ICI reaction. The data points indicate the search
for the ClO product. Curves indicate the expected ClO product
(solid curve) compared to the 10 product (dashed curve) as predicted
by the loose transition-state model. Equal detection efficiencies
for the two products were assumed to normalize the curves and
'data points.
Figure 6 Laboratory velocity spectrum (flux density) of reactively scattered
ClO product at a scattering angle of 600 for the 0 + Cl2 reaction.
The error bars indicate one standard deviation and include the
uncertainty in the normalization to the angular data as well as
that in the velocity spectra measurement. The vertical arrow indi-
cates the upper limits on the velocity from energy conservation for
the nominal collision energy. Curves show distributions calculated
from the statistical complex models convoluted over the velocity
resolution of the detector. The solid curve is for a loose complex;
the other two are for a tight linear complex; the dot-dash curve
includes an approximate treatment for an activation energy of 2.9
* kcal/mol e.
Figure 7 Laboratory velocity spectra of reactively scattered BrO product at
* indicated scattering angles for the 0 + Br2 reaction. The cjrves
(as in Fig. 6) are calculated from the statistical complex models;
here convolution over the velocity resolution of the detector was
* not necessary.
Figure 8 Laboratory velocity spectra of reactively scattered 10 product at
indicated scattering angles for the 0 + ICI reaction. The curves
Sm -a-
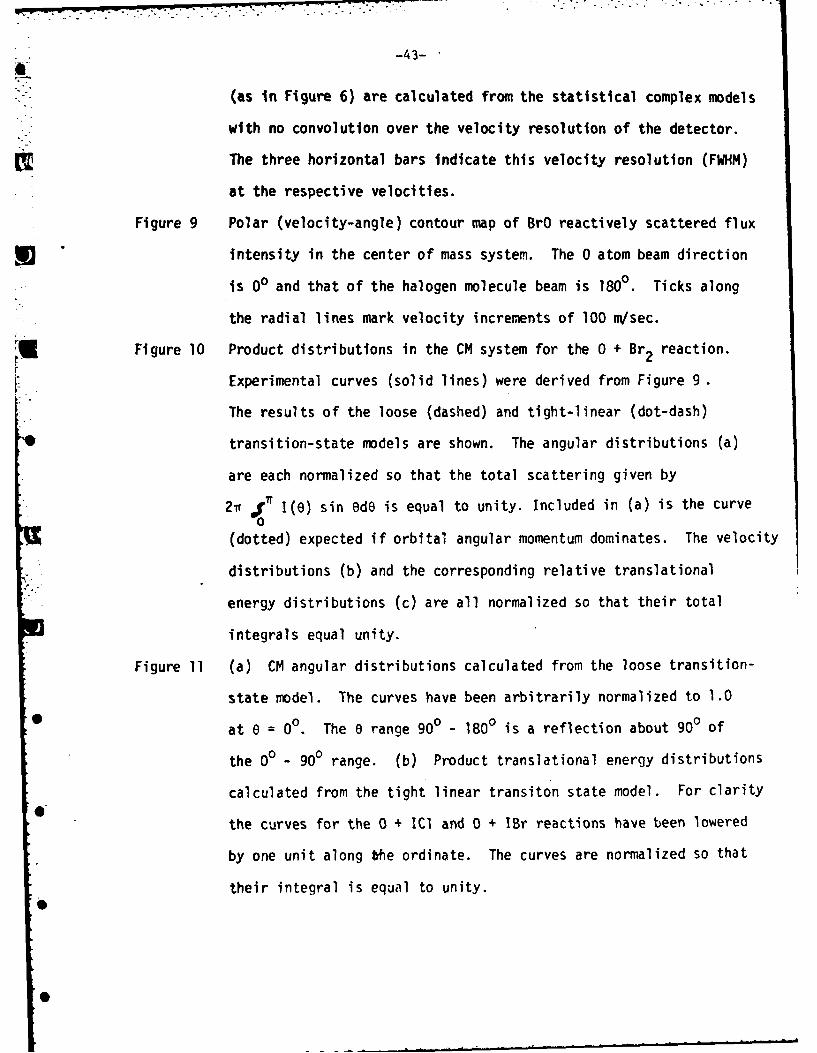
-43-
(as in Figure 6) are calculated from the statistical complex models
with no convolution over the velocity resolution of the detector.
The three horizontal bars indicate this velocity resolution (FWHM)
at the respective velocities.
Figure 9 Polar (velocity-angle) contour map of BrO reactively scattered flux
intensity in the center of mass system. The 0 atom beam direction
is 00 and that of the halogen molecule beam is 1800. Ticks along
the radial lines mark velocity increments of 100 m/sec.
Figure 10 Product distributions in the CM system for the 0 + Br2 reaction.
Experimental curves (solid lines) were derived from Figure 9
The results of the loose (dashed) and tight-linear (dot-dash)
transition-state models are shown. The angular distributions (a)
are each normalized so that the total scattering given by
2v f I(e) sin ede is equal to unity. Included in (a) is the curve0
(dotted) expected if orbital angular momentum dominates. The velocity
distributions (b) and the corresponding relative translational
energy distributions (c) are all normalized so that their total
integrals equal unity.
Figure 11 (a) CM angular distributions calculated from the loose transition-
state model. The curves have been arbitrarily normalized to 1.0
at 0 = 00. The e range 900 - 1800 is a reflection about 900 of
the 00 - 900 range. (b) Product translational energy distributions
calculated from the tight linear transiton state model. For clarity
the curves for the 0 + ICI and 0 + IBr reactions have been lowered
by one unit along Ofe ordinate. The curves are normalized so that
their integral is equal to unity.

-44-
Figure 12 Probability of complex decomposition to each channel as a function
of initial translational energy for the 0 + ICI reaction. Dashed
curves pertain to when the I + ClO channel is forbidden, solid
curves to when all three channels are allowed.
Figure 13 Orbital correlation diagram for the C2v and C approaches of an
0 atom (3p) to a diatomic homonuclear halogen a) Cs approach.
The state symmetry is shown on the left while the orbital con-
figurations of the complex are shown on the right. Note the
repulsive interaction for the Z approach. b) C2v approach. The
notation for the excitation corresponds to the type of orbital
excited from, in this case a a bonding orbital or a r out-of-plane
orbital, to an anti-bonding a*. We have not tried to identify
which orbital is the a or n orbitals, but presumably they are the
6aI and 2bI orbitals respectively. The o* orbitals would be
expected to be the 7aI and 5b2 orbitals. Note the repulsive inter-
action in diagram on the right.
Figure 14 Time normalization function and reduced data points for the 0 + 12
reaction data presented in Figure 3. Each reduced data point is
obtained by dividing an individual measurement of the signal at
a given angle by the mean of all the measurements made at that
angle. The abscissa scale is obtained by linearly normalizing the
time span of the experiment to a 0 to 180 span for purposes of the
Legendre polynomial expansion. At t = 40, the 0 beam discharge
source was retuned resulting in a sharp increase in product scatter-
ing intensity.

.".
-45-
Figure 15 Time normalized data points (open circles) and weighted averages
(solid diamonds) for data of Fig. 14. The error bars indicate
two-thirds confidence limits (one standard deviation) for the
determination of the average. The left bars are calculated by
the error propagation techniques discussed in the text, and the
right bars are evaluated from the scatter in the individual data
points shown.
0W
r" -
S
S

-46-
TABLE I. PARENT BEAM PARAMETERSa
Reactant T0 TN PN
Cl2 1200 683 400
Br2 1000 473 870
V 1200 473 1502
IC1 1200 418 260
IBr 1200 402 160
aTO and TN denote the temperatures (OK) of the oxygen atom beam and nozzle
source respectively. T0 was determined by velocity analyzing the oxygen
atom beam under identical conditions and fitting the results to a Maxwell-
Boltznann velocity distribution to extract the temperature. PN refers to
the halogen gas pressure (torr) behind the nozzle; this pressure is determined
from the vapor pressure of the halogen at the temperature of the supply reservoir
except for Cl2 for which the pressure was approximately measured by a gauge.
W

-47-
TABLE II. PARAMETERS FOR TRANSITION-STATE MODELSa
Parameter 0 + C12 0 + Br2 0 + 12 0 + IC1 0 + IBr
C(10 12 erg.a 6) 96 117 165 135 142
0 6V(10 12 erg.A ) 173 258 541 281 351
309 375
* W(kcal/mole) 1.0 0.7 0.9 0.6 0.6
Do XY(kcal/mole) 57.2 45.4 35.6 49.6 41.9
Do XO(kcal/mole) 63.3 55.3 57 57 5763.3 55.3
ECOLL(kcal/mole)b 3.92 2.11 2.44 2.43 2.41
we XY(cm-) 559.7 323.3 214.5 384.3 268.7
we XO(cm-1 ) 780 771 681.4 681.4 681.4780 771
Be XY(cm '' ) 0.2441 0.0811 0.0374 0.1141 0.0561
Be XO(cm" ) 0.622 0.4278 0.3403 0.3403 0.34030.622 0.4278
aFor the quantities where two entries are given for the mixed halogen reactions,
the upper value is for the 10 product channel and the lower value is for the
alternate (CIO or BrO) product channel.
bInitial collision energy,

i.o
-48-
TABLE III. CROSS SECTIONS CALCULATED FROM LOOSE TRANSITION STATE MODELa
02 02
Reaction QC(A ) QR(A )
L
0 + C12 42 35
0 + Br2 55 45
0 + 12 59 50
0 + IC1 55 12
0 + IBr 56 43
aThe quantity Qc is calculated from Eq. (13) of text at the nominal collision
energy. QR is obtained by multiplying Qc by the branching ratios predicted
from the loose complex model averaged over reactant translational energy. Only
the 10 channel was allowed in the mixed halogen reactions.
II
I

-49-TABLE IV. STATE CORRELATIONS FOR O+X2 REACTIONS
Approach Reactants Intermediate Products
Geometry [O(3Pg )+X2 (1 E) (Possible) [X(2P )+OX(2 W)J
3 3iv3 E + 3 A+3t+3 E+ +3 E-
+ b +1 1 1+ I-
+ 3 r+ l c
Cs 2(3A')+3All 1A,+lA,+3A +3Ahd 3(3A- )+3(3A")
+3('A')+3('A")
C2v 3A 2+3BI+3B2 AI e 2(3A1 )+2 (3A2 )+3BI + 3B2
+3A +3B+3B2 f +2( A2(A 2 )+IBI+B 2+IAII+B f+ A + B + B2
a These states arise from the ..(a*)2(T*)2 electron configuration.
bThis state arises from the ...(n*)4 electron configuration.
CThese states arise from either the ... ()Y*) I or ...(o*)1(w*)3 electron
configurations. The singlet states of the C intermediate could arise from
the O(D g) excited state which gives I + ++IA.
dThese states arise from the ..-(a')2 .(a)2 or "-(a' )(a") 1 configurations.
eThis state arises from the ground state configuration.
f 1IThese states arise from the confgurations ...(bl) (a1)9...(a d (a1), and
40.(b2)1 (a,) estimated from Walsh diagrams.

-.50-
I.
DETECTOR
ION SOURCE /0" To MASS0 FILTER
0 ATOM 90oSOURCE 90
00DISCHARGE TIME of FLIGHTTUBE CHOPPER
NOZZLE
HALOGENMOLECULE
* SOURCE
FIGURE I
S- -i " - I"' '

-51-
ZU
00 in
cra
0
ccr
cr-
~LL.
DcZD-J
D0
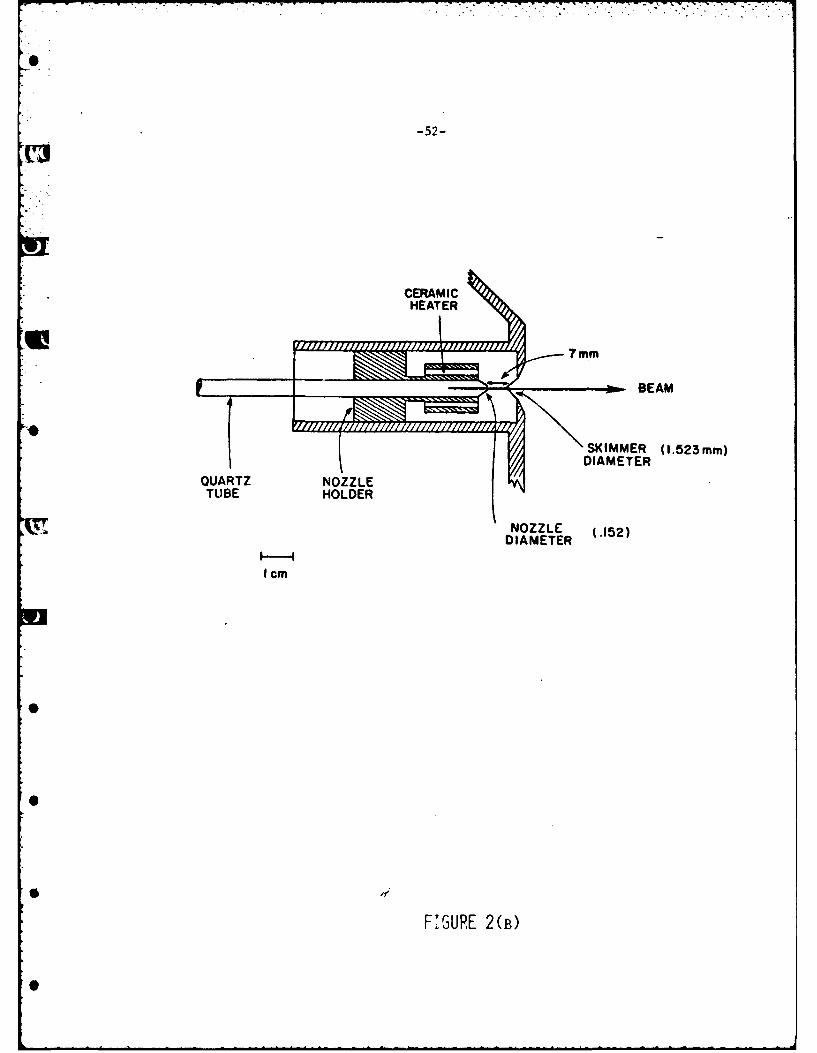
-52-
U 7mm
BEAM
SKIMMER (1.523mm)DIAMETER
QUARTZ NZLTUBE HOLDER
NOZZLE (.152)DIAMETER
I cm
FGURE 2(B)

20
CIO from 0O+C1 2
10
BrO from O+Br 2
0
w
z
10
Sz
50
05
300 00 00 6 9(r 1206
LABORATORY SCATTERING ANGLE.0
0 FIGURE 3
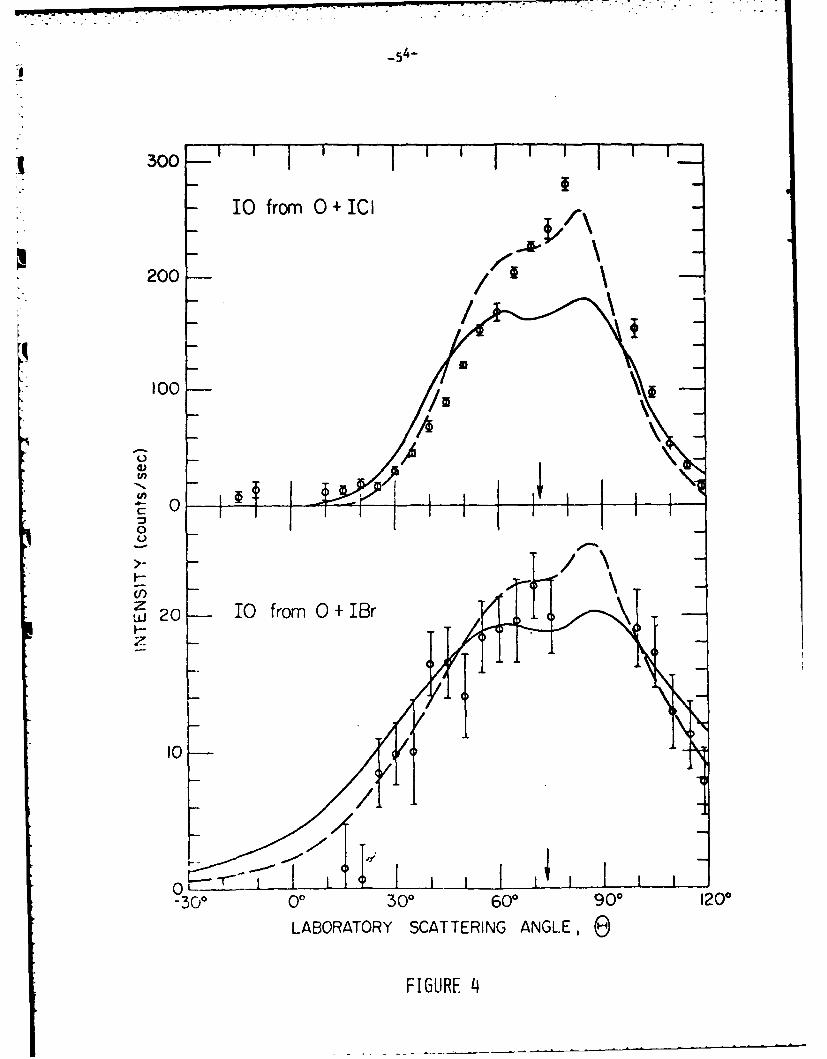
-54-
300-
10 fromO0+ICl
200
I00-
0-300 0 609010
LAOAOYSATEIGAGE EFIGRE
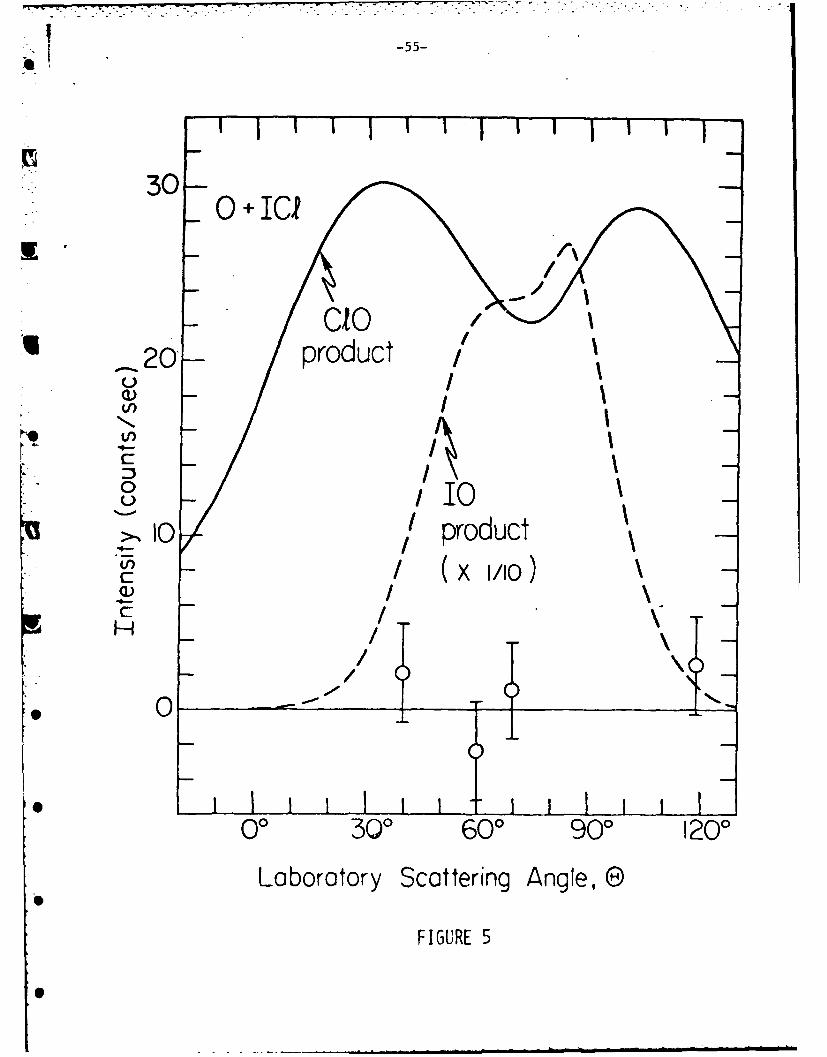
! -55-
30-0 0+IC
o I20 -pproduct
"8/ (x Io4- I
o__oc / I"- / product
/ T_,_I -____
- / (x 1/1o)\
A I Q_____I ii00
00 300 600 900 1200
Laboratory Scattering Angle, ®
FIGURE 5
0

-56-
a?
IL/1 c:ii 0
4'
(spu ANjqo /1U3AV3

-57-
\ r BfromO*B'2,
j I ; w
00
eii
z
w
-LJ
*0 500 1000 0 500 100
LABRATORY VELOCITY (rn,/sec)
* FIGURE 7

-58-
-.- T1- I I II I I I
licr o fro 0-Ic
f160'
F-iW\jI
40'
L LAV LAOAOY
o ~~500100 05000
LABORTORYVELOCITY (m/sec)

1' -59.-
0
0
0 or-
E00c
LL
00
0 b)cvn
E0
*E
0 L0 0
N. 0
0
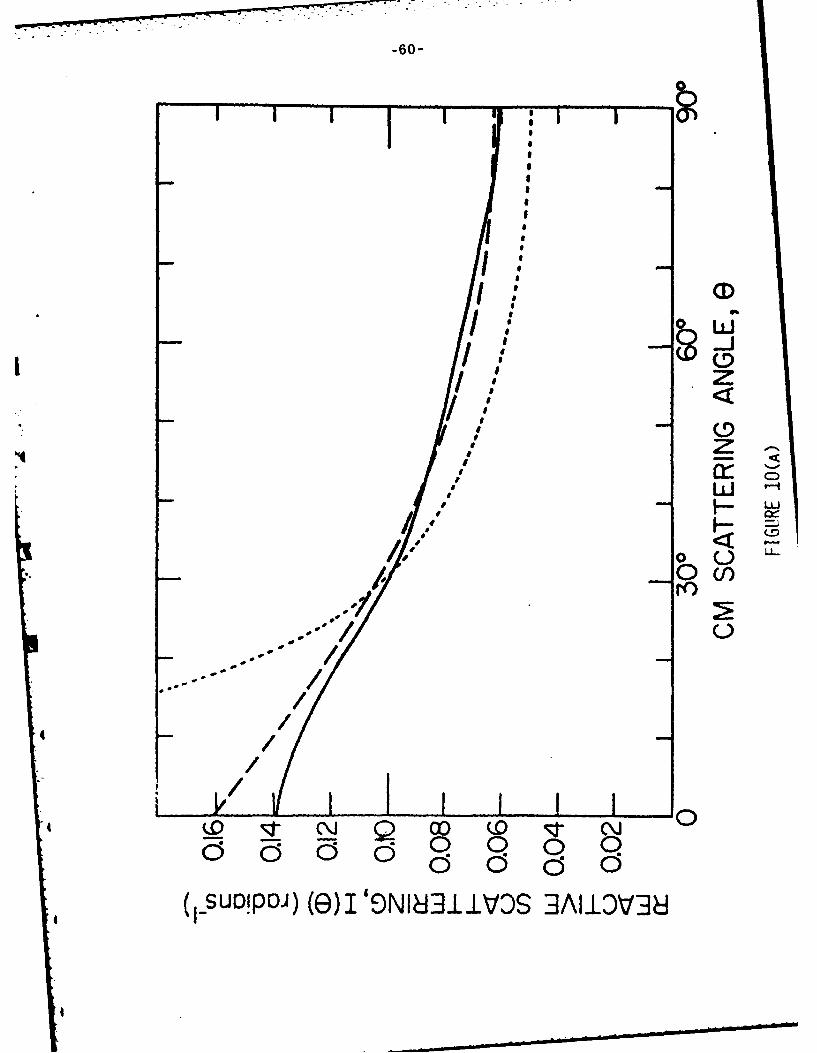
-60-
*Cfi
IL
I0
Iz
a<
fo %.
aCaL -
SL
I:0
/, DPJ (E)eeI8iiO (9iD3

400
//0~ 0E/0LO)
LIl> J0
0LuJ0 Q
00
CJ6 0j
(i-W ) A\IISN]GI Xflh

-622
/ 0I.0
'00O0/Z mH
I~d lx/

-63-
co+ +c1 .OF /II
o EEI /I E
o :0d~
0 C.0
/0 .2i
C-5 C -
(s~iufl Ajojyqjo) (0)1 'ON I]iiV3S ]ALIDVI J

-64-
P( f)
F 1 0
0 0 no *5/(N
> 3 n
G) 3<*
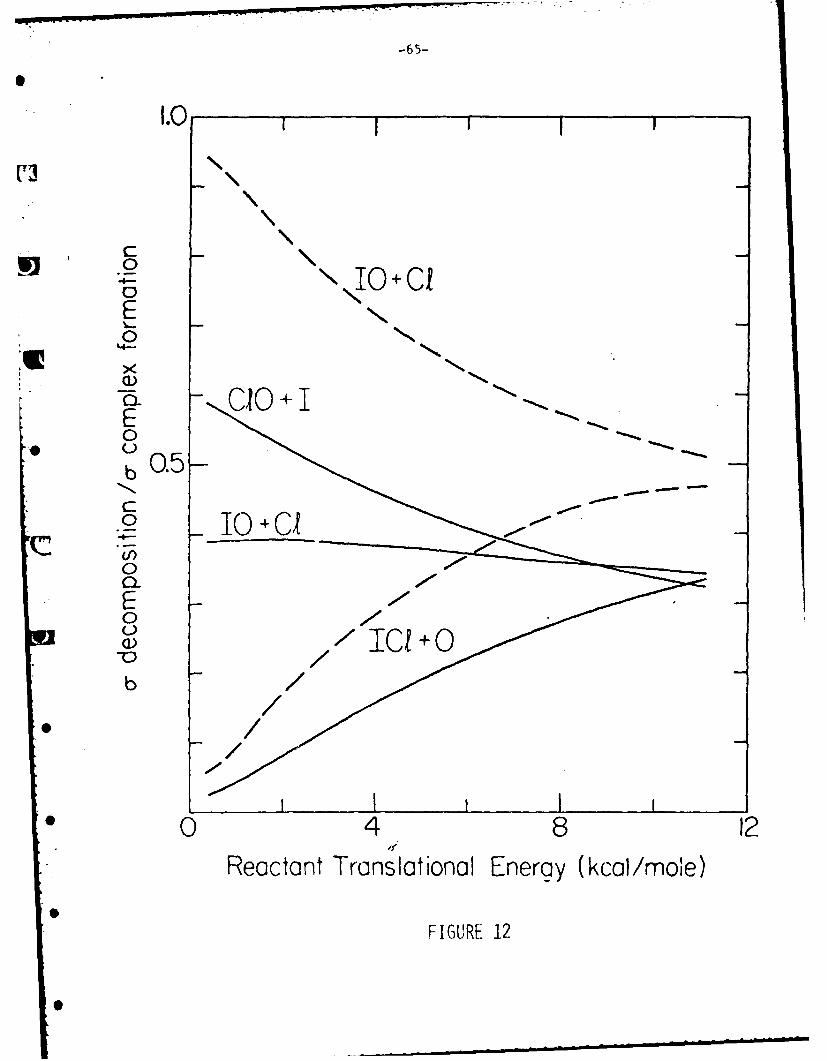
-65-
4- \%IO+CI
Eo
0
E0
b
*0 4 8 12Reactant Translational Energy (kcal /mole)
FIGURE 12
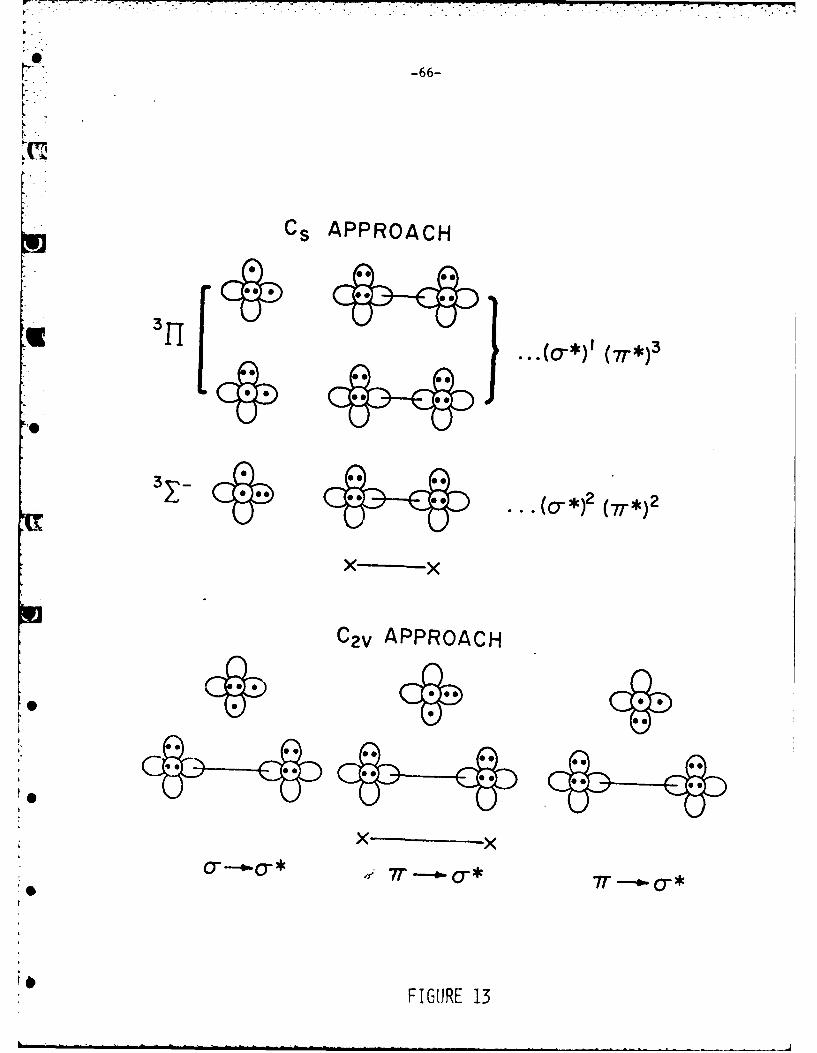
-"-66-
Cs APPROACH
* 3 -i (o-*)I (wr*) 3
~~C " c(3E0-T (*)2 (77*) 2
×-- -- ×
C2v APPROACH
*0
Cie 0
x0 x
FIG[URE 13
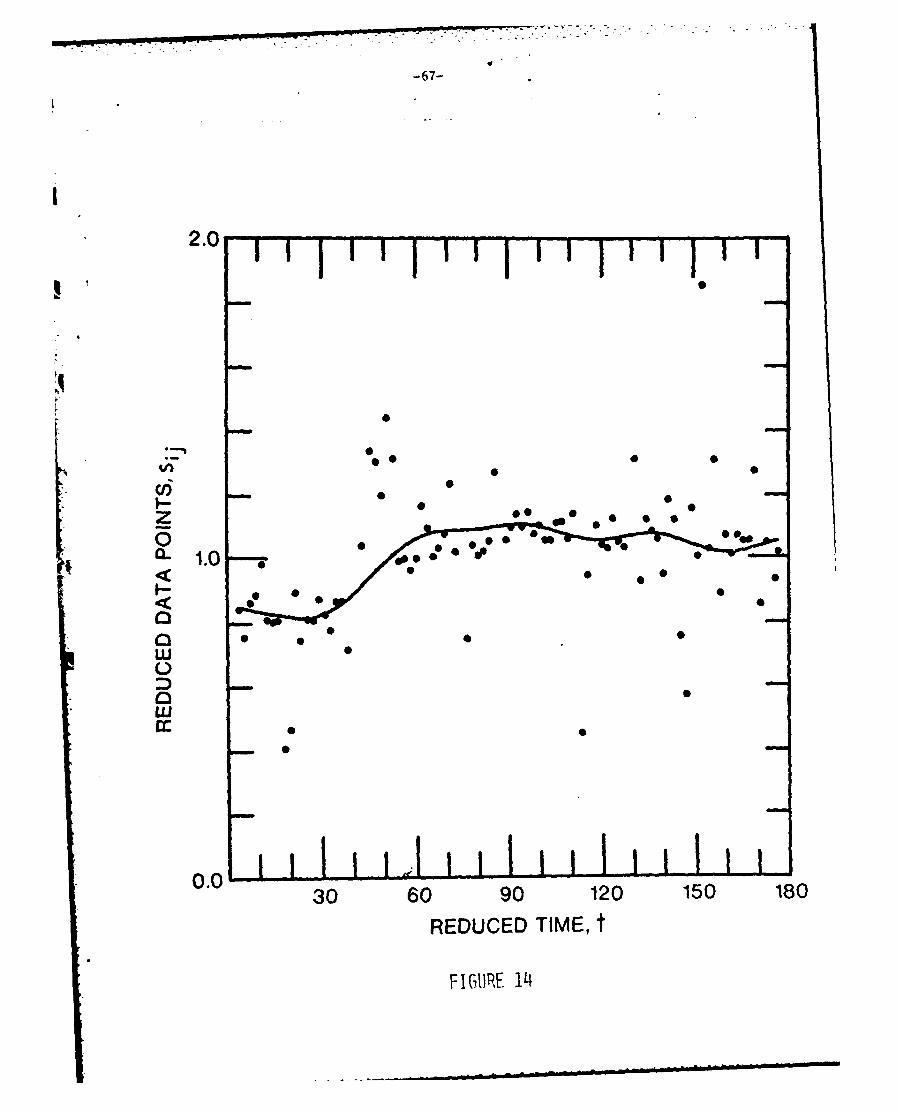
-67-
2.0 1 111111
0*- 0 0 5
0.
0w
wcc
0.030 60 90 120 150 180
REDUCED TIME, t
FIRURE 1~4

-68-
0
o Lr b
0 MH 0
0
o ~L
z
o 0 w L
LL:
0 oLcc Lo
0 0o ~r0
04
0 poi o
00
0 00
0 Je 0
(C3S/SlNfloo) SIVNOIS 03ZIIVVJU0N )V1II

I