m–i coupling across the auroral oval at dusk and midnight€¦ · · 2016-01-09334 p. e....
TRANSCRIPT
Ann. Geophys., 32, 333–351, 2014www.ann-geophys.net/32/333/2014/doi:10.5194/angeo-32-333-2014© Author(s) 2014. CC Attribution 3.0 License.
Annales Geophysicae
Open A
ccess
M–I coupling across the auroral oval at dusk and midnight:repetitive substorm activity driven by interplanetary coronal massejections (CMEs)
P. E. Sandholt1, C. J. Farrugia2, and W. F. Denig3
1Department of Physics, University of Oslo, Oslo, Norway2Space Science Center, University of New Hampshire, Durham, UK3NOAA, Boulder, Colorado, USA
Correspondence to:P. E. Sandholt ([email protected])
Received: 2 October 2013 – Revised: 25 February 2014 – Accepted: 25 February 2014 – Published: 9 April 2014
Abstract. We study substorms from two perspectives, i.e.,magnetosphere–ionosphere coupling across the auroral ovalat dusk and at midnight magnetic local times. By this ap-proach we monitor the activations/expansions of basic ele-ments of the substorm current system (Bostrøm type I cen-tered at midnight and Bostrøm type II maximizing at dawnand dusk) during the evolution of the substorm activity. Em-phasis is placed on the R1 and R2 types of field-alignedcurrent (FAC) coupling across the Harang reversal at dusk.We distinguish between two distinct activity levels in thesubstorm expansion phase, i.e., an initial transient phaseand a persistent phase. These activities/phases are discussedin relation to polar cap convection which is continuouslymonitored by the polar cap north (PCN) index. The sub-storm activity we selected occurred during a long intervalof continuously strong solar wind forcing at the interplan-etary coronal mass ejection passage on 18 August 2003.The advantage of our scientific approach lies in the com-bination of (i) continuous ground observations of the iono-spheric signatures within wide latitude ranges across the au-roral oval at dusk and midnight by meridian chain magne-tometer data, (ii) “snapshot” satellite (DMSP F13) observa-tions of FAC/precipitation/ion drift profiles, and (iii) observa-tions of current disruption/near-Earth magnetic field dipolar-izations at geostationary altitude. Under the prevailing for-tunate circumstances we are able to discriminate betweenthe roles of the dayside and nightside sources of polar capconvection. For the nightside source we distinguish betweenthe roles of inductive and potential electric fields in the twosubstages of the substorm expansion phase. According to
our estimates the observed dipolarization rate (δBz/δt) andthe inferred large spatial scales (in radial and azimuthal di-mensions) of the dipolarization process in these strong sub-storm expansions may lead to 50–100 kV enhancements ofthe cross-polar-cap potential due to inductive electric fieldcoupling.
Keywords. Magnetospheric physics (magnetosphere–ionosphere interactions)
1 Introduction
In the context of the development of substorm activity, theroles of different types of magnetosphere–ionosphere (M–I)current systems have been a topic of lively debate since thebeginning of the space age.Bostrøm(1964) introduced thetwo basic elements of the substorm current system, whichare often referred to as Bostrøm type I and II currents. TheBostrøm type I system is commonly applied to the couplingvia R1 field-aligned current (FAC) between the cross-tail cur-rent (CTC) of the plasma sheet and a westward-directed elec-trojet current (WEJ) along the auroral oval, centered nearmidnight. The latter curent system is often referred to asthe substorm current wedge (SCW) (McPherron et al., 1973;Lyons et al., 2003; Sergeev et al., 2011). Bostrøm type II is,on the other hand, often applied to the coupling between thepartial ring current and northward (southward)-directed cur-rents in the ionosphere via R2 FACs at dusk (dawn). Thiscoupling maximizes near the equatorward boundary of the
Published by Copernicus Publications on behalf of the European Geosciences Union.

334 P. E. Sandholt et al.: Repetitive substorm activity driven by interplanetary CMEs
auroral oval in the dusk-to-premidnight and postmidnight-to-dawn sectors (Bostrøm, 1977).
The activation of these two types of current system duringthe substorm process leads to distinct auroral phenomena: (i)breakup of the most equatorward auroral arc (MEA) in themidnight sector, followed by (ii) auroral expansions (north–south and east–west), as described byAkasofu(1964), and(iii) sequential activations of the auroral poleward bound-ary (poleward boundary intensifications, or PBIs) followedby equatorward-moving auroral streamers (Henderson et al.,1998; Lyons et al., 1999; Fairfield et al., 1999; Sandholt et al.,2002).
While the poleward auroral expansion may be explainedby an “in–out” motion of a current disruption (magnetic fielddipolarization) in the plasma sheet (Baumjohann et al., 1999;Akasofu, 2013), feature ii (auroral streamer events) is re-lated to the “out–in” motion of plasma-depleted flux tubes(Chen and Wolf, 1993) characterized by magnetic field dipo-larization fronts and bursty bulk flows (BBFs) (Hendersonet al., 1998; Fairfield et al., 1999; Lyons et al., 2012; Sergeevet al., 2012). Here we shall study low-altitude manifesta-tions of the dynamic plasma sheet–ring current system in theform of eastward electrojet (EEJ)/WEJ activations and asso-ciated FAC/precipitation events appearing on either side ofthe Harang reversal boundary at the peak of a major mag-netic storm. As an introduction to the detailed auroral elec-trodynamics of the Harang region we refer toMarghitu et al.(2009) and references therein. We shall adopt the definitionof the Harang region used byMarghitu et al.(2009): “By theHarang region (HR) we understand that part of the auroraloval where the eastward electrojet (EEJ) at lower latitudescoexists with the westward electrojet (WEJ) at higher lati-tudes.” This definition follows the tradition from the originalwork of Harang(1946) andHeppner(1972).
The Harang region, normally located in the premidnightsector, is considered to be a most interesting region for theinvestigation of ionospheric signatures of substorm dynam-ics (Lyons et al., 2003; Zou et al., 2009). This is the sec-tor of the auroral oval where most vigorous M–I couplingprocesses involving R1 and R2 FACs are expected to takeplace during substorm activity (Koskinen and Pulkkinen,1995; Lyons et al., 2003; Weygand et al., 2008; Zou et al.,2009; Nishimura et al., 2010). Thus, the Harang region is akey locus of magnetospheric convection currents where iono-spheric closures of both Bostrøm type I and II currents appearalong the same magnetic local time (MLT) meridian.
The ultimate goal of the present study is to improveon our knowledge of the detailed temporal evolution ofrepetitive substorm activity driven by interplanetary coro-nal mass ejections (CMEs) with emphasis on these threesubstorm elements: (1) activation of the SCWs (Bostrømtype I current system) with associated westward auroral elec-trojet (WEJ of Cowling channel type) current; (2) activa-tion of Bostrøm type II current systems with electrojets atdawn (WEJ) and dusk (EEJ); and (3) activation of current
wedgelets associated with BBFs. The main focus of our in-vestigation is on the evolution of these current systems dur-ing the substorm–storm phases, as monitored by the auro-ral electrojet index AL and the ring current index SYM-H,respectively, and the associated excitation of polar cap con-vection. Processes 2 and 3 will be monitored from ground–satellite conjunctions across the auroral oval at dusk. Inthe present case information on phenomenon 1 is obtainedfrom the AL index (and Alaska magnetograms) in combina-tion with plasma/field data from the magnetospheric probeGOES-10 (Geostationary Operational Environmental Satel-lite), moving at geostationary heights from dusk throughmidnight to dawn.
The M–I coupling from the inner edge of the plasmasheet–partial ring current is expected to intensify during theconditions we study, i.e., repetitive substorm activity dur-ing magnetic storms excited by interplanetary CMEs. In thisstudy we document the temporal variability of this couplingbased on ground–satellite conjunctions along the 18:00 MLTmeridian in different phases of the substorm–storm evolu-tion. This sector of the auroral oval is typically occupied bythe EEJ and Bostrøm type II arcs (Marklund, 1984; Kauristieet al., 2001). However, as we shall see, during certain sub-storm conditions the WEJ may expand westward into the17:00–18:00 MLT sector. This condition of repetitive west-ward expansions–eastward retractions of the Harang regionat dusk is a central feature of our observations.
This type of substorm activity is different from isolatedsubstorms appearing during more typical interplanetary con-ditions in that the present activity may not show the standardevolution of substorm phases growth–expansion–recovery(Farrugia et al., 1993; Klimas et al., 2000; Henderson et al.,2006; Troshichev and Janzhura, 2009; Sandholt et al., 2012;Akasofu, 2013). Most notable is the absence of a full recov-ery of the substorm activity. Thus, each major AL excursionis accompanied by a partial recovery.
Yagodkina et al.(2012) reported global auroral distribu-tion and oval boundary motions during interplanetary CMEconditions similar to those we study. The northern and south-ern branches of the double oval configuration (NorthernHemisphere) were found to be characterized by discrete anddiffuse precipitations, respectively (see alsoVorobjev et al.,2013). In the Harang region this difference corresponds toour distinction between Harang region-north occupied by theWEJ and Harang region-south (HR-S) characterized by theEEJ. The width of the two auroral branches were found byYagodkina et al.(2012) to depend on the storm intensity, asmeasured by the Dst index.
The response of polar cap convection (as reflected in thePCN index; seeTroshichev et al., 2000) during the substorm–storm evolution, as measured by the AL and SYM-H indices,is an important aspect of the present study. Furthermore,we aim at distinguishing between the dayside and nightsidesources of polar cap convection. As we shall see, this is anontrivial task when the dayside source is also variable.
Ann. Geophys., 32, 333–351, 2014 www.ann-geophys.net/32/333/2014/

P. E. Sandholt et al.: Repetitive substorm activity driven by interplanetary CMEs 335
The type of strong AL events we study is expected to beassociated with deep plasma injections into the partial ringcurrent (see e.g.Henderson et al., 2006, and Burke et al.,2007). According to the modeling work ofYang et al.(2012)and Birn and Hesse(2013) and the experimental study ofFrissell et al.(2011) such deep inward penetration of theplasma-depleted flux tubes may contribute to the partial ringcurrent and associated R2 FAC coupling to the ionosphere.In MHD studies it has been shown that shears in the az-imuthal flows near the plasma sheet–partial ring current in-terface can give rise to R1 and R2 polarity FACs at the outerand inner edges of the intruding plasma bubbles (Birn andHesse, 2013). We shall study associated signatures in the ex-panded Harang region at dusk. The appearance of auroralstreamers on the poleward boundary of the auroral oval in theHarang region has been reported bySandholt et al.(2002)and Lyons et al.(2012). Earthward-moving flow bursts inthe plasma sheet–partial ring current system are expectedto give rise to specific ionospheric signatures appearing onboth sides of the Harang reversal boundary. In this studywe extend previous work on these magnetotail phenom-ena by our ground–satellite conjunction observations alongthe 18:00 MLT meridian. Related to this we note that PBIsand auroral streamers may be taken as signatures of ongo-ing magnetotail reconnection with associated BBFs (see e.g.Sergeev et al., 2012).
Figure 1 shows a sketch of the Harang region in thedusk (left)-to-premidnight sector of the auroral oval placedin a larger ionosphere–magnetosphere context. Indicated areEEJ/WEJ currents on the equatorward and poleward sidesof the Harang reversal boundary (marked HRB in the fig-ure), R1 and R2 FACs with ionospheric closure currents, andauroral phenomena such as PBIs and equatorward-movingauroral streamers emanating from PBIs. M–I coupling viathree types of current systems applicable to substorms is il-lustrated: Bostrøm type I system in two variants (SCW andwedgelets–BBFs) and Bostrøm type II system on the duskand dawn sides. The Bostrøm type I current system is acti-vated on the magnetospheric side by disruptions of the CTC.Bostrøm type II current systems may be activated by dynamoaction (E ·J < 0) in flow braking regimes (J perp×B−force)near the plasma sheet–ring boundary, as indicated in the fig-ure (seeBirn and Hesse, 2013). We note that the R2 FAC inthe Bostrøm type II system configures as east–west alignedcurrent sheets in the dusk-to-premidnight and postmidnight-to-dawn sectors (seeBostrøm, 1977, his Fig. 8). Eventsof plasma intrusion from the midtail followed by diversioncloser to Earth (as indicated in the figure; see alsoMcPher-ron et al., 2011) and association with auroral arc brighten-ing have been recently documented byYau et al.(2013). Onthe relationship between the Harang reversal boundary andthe substorm injection boundary we refer to the early studyby Brekke(1977). The indicated ionospheric closure of R2FAC at subauroral latitudes (eastward-directed ionosphericcurrent) has been demonstrated byRitter and Lühr(2008).
HRB
PBI
WEJ
WEJ
R1
PARTIAL RING CURRENT
CROSSTAIL CURRENT
R2
R2
BBF
EEJ
BBF
E E
R2
CROSSTAIL CURRENT
MAGNETO TAIL
NORTH IONOSPHERE
Fig. 1. Schematic illustration of M–I coupling via three categoriesof current systems applicable to substorms: Bostrøm type 1 in twovariants (substorm current wedge, SCW, in the midnight sector andwedgelets related to BBFs) and Bostrøm type 2 currents on the duskand dawn sides. Ionospheric Pedersen current closures of R1 and R2FACs across the Harang reversal boundary (HRB) with their con-nections to the magnetosphere are indicated. The Bostrøm type Isystems are powered by earthward-directed plasma intrusions anddisruptions of the cross-tail current (CTC) giving rise to R1-typeFACs. Bostrom type II systems are powered by plasma intrusion tothe plasma sheet–partial ring current boundary and channels of flowbraking (Jperp×B− force) representing dynamo action (E ·J < 0)with associated excitation of field-aligned current (FAC) sheets.Connections with westward and eastward electrojets (WEJ/EEJ)in the ionosphere (afterBostrøm, 1977) are indicated as well asionospheric closure of R2 FAC at subauroral latitudes (eastward-directed ionospheric current).
Our definition of substorm activity as illustrated in Fig. 1involves the following basic elements: (i) disruption of theCTC in the near-Earth PS (magnetic field dipolarizationsseen at geostationary altitude) leading to the activation ofthe SCW (Bostrøm type I current system; seeMcPherronet al., 1973), followed by (ii) plasma intrusion to the par-tial ring current with activation of the injection dynamo(E ·J < 0; see e.g.Tanaka et al., 2010, andYau et al., 2013)with associated Bostrøm type II current systems at dusk anddawn, (iii) M–I coupling at subauroral latitudes giving riseto SYM-H partial recovery, and (iv) the presence of BBFswith ionospheric signatures on both sides of the Harang re-versal boundary in the later phase of the substorm expansion(persistent phase–partial recovery).
www.ann-geophys.net/32/333/2014/ Ann. Geophys., 32, 333–351, 2014
336 P. E. Sandholt et al.: Repetitive substorm activity driven by interplanetary CMEs
Under periods of moderate disturbance the Harang re-versal boundary lies in the premidnight sector. Thus, at18:00 MLT the auroral oval is typically occupied only bythe EEJ (see e.g.Kauristie et al., 2001, and Gjerloev andHoffman, 2001). However, during the expansion phase ofcertain substorm activities, including the category we discussin this paper (see e.g.Cai et al., 2006; Henderson et al., 2006;andAndalsvik et al., 2011), the WEJ and the Harang reversalboundary expand westward across the 18:00 MLT meridian(Andalsvik et al., 2011), as we shall also demonstrate below.According toNielsen and Greenwald(1979) the Harang dis-continuity (our Harang reversal boundary) tended to be ob-served by the Stare radar in the 21:00–24:00 MLT sector, butit was observed as early as 18:30 MLT under very disturbedconditions. Below we shall document the presence of the Ha-rang reversal boundary in DMSP F13 data at 17:00 MLT un-der the conditions we study, i.e., long-lasting repetitive sub-storm activity (AL =−1400 nT) driven by a geoeffective in-terplanetary CME. The type of extended Harang region (ex-treme WEJ expansions) we observe is consistent with the ob-servations ofHenderson et al.(2006) andTroshichev et al.(2011) during sawtooth substorms, i.e., substorms recurringat 2–3 h intervals during strong solar wind (SW) forcing con-ditions.
In this paper we study the evolution of M–I coupling dur-ing repetitive substorm activity by monitoring manifestationsof two basic current systems (Bostrøm types I and II) in twodifferent MLT sectors: (i) M–I coupling in the midnight sec-tor (20:00–03:00 MLT) based on magnetic field dipolariza-tions at geostationary altitude versus WEJ activity across theoval at midnight; and (ii) M–I coupling along the magneticmeridian in the 17:00–18:00 MLT sector, across the Harangregion, by ground–satellite conjunction studies. We distin-guish between two distinct substages of the substorm expan-sion phase, namely, an initial transient phase and a persistentphase. This is based on the character of the electrojet activ-ity (AL index; magnetograms at dusk and midnight). Cor-responding responses in polar cap convection (PCN index)are investigated. We note the presence of (i) rapid monotonicrise versus (ii) fluctuating, stable or decreasing PCN indexin the transient and persistent phases, respectively. The avail-able multi-instrument and multisite observations allow us todiscriminate between the dayside and nightside sources ofthe PCN response. For the nightside source we discuss theroles of inductive and potential electric fields in M–I cou-pling in the two mentioned substages of the substorm expan-sion phase. Thus, we aim at increasing our understanding ofthe convection sources of the polar cap index.
Continuous ground observations of magnetic deflectionsat dusk are obtained by the IMAGE chain of magnetome-ters in Svalbard, Scandinavia, Finland, and Russia (www.geo.fmi.fi/image). This magnetometer chain covers a widelatitude range from subauroral latitudes to the polar cap.Direct observations of the two substorm current branchescoupled to the EEJ and WEJs, in the form of FACs and
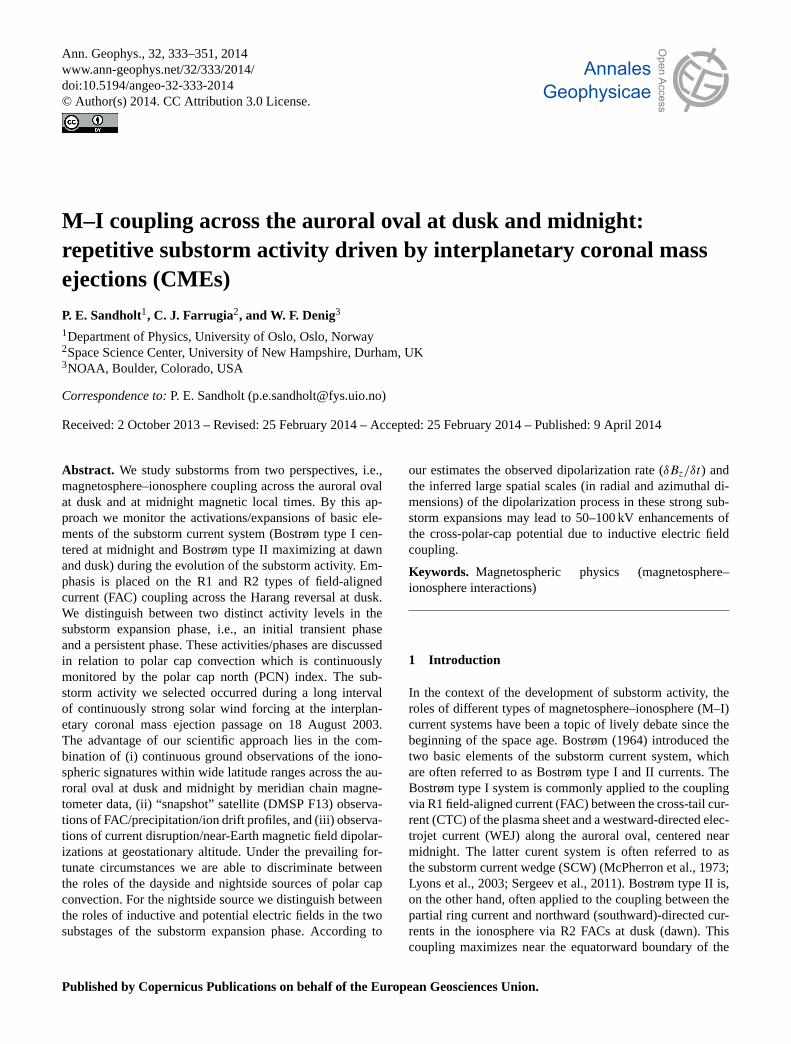
Fig. 2. Interplanetary data from spacecraft Advanced CompositionExplorer (ACE). Panels from top to bottom show proton density(Np; cm−3); bulk speed (Vp; km s−1); proton temperatureTp (K;in red the expected temperature afterLopez and Freeman, 1986);dynamic pressurePdyn (nPa); magnetic field componentsBx , By
andBz in GSM coordinates; the field strengthB (nT); the Kan–Leemerging electric fieldEKL (mV m−1); the Alfvén Mach numberMA ; and the clock angle of the magnetic field (◦). Different fieldorientations (clock angle regimes) are marked by vertical dashedguidelines.
particle precipitation, are obtained from DMSP F13 passesacross the oval at dusk. The UT interval we study is de-termined by the fact that the IMAGE chain of magnetome-ters typically enter the Harang region at∼ 14:30–16:00 UT(∼ 17:00–18:00 MLT) under the strong solar wind forcingconditions we study (Andalsvik et al., 2011, 2012; Sandholtet al., 2012).
The spatial-temporal evolution of the nightside WEJ ismonitored by Alaska chain magnetograms covering the lati-tude range from 63 to 69◦ magnetic latitude (MLAT) in the19:00–01:00 MLT sector (06:00–12:00 UT).
Ann. Geophys., 32, 333–351, 2014 www.ann-geophys.net/32/333/2014/
P. E. Sandholt et al.: Repetitive substorm activity driven by interplanetary CMEs 337
2 Data description
Figure 2 shows interplanetary magnetic field and plasmadata from spacecraft ACE on 18 August 2003. The panelsshow, from top to bottom, the proton density, bulk speed,temperature (in red: expected proton temperature afterLopezand Freeman, 1986), the dynamic pressure, the GeocentricSolar Magnetospheric (GSM) components of the magneticfield and the total field, the Kan–Lee merging electric fieldEKL (Kan and Lee, 1979), and the clock angle, i.e., the polarangle in the GSMy–z plane.EKL = V BT sin2(θ/2), whereV is the solar wind bulk speed,BT = (B2
y + B2z )1/2, andθ
is the clock angle (180◦ meaning due south IMF;By < 0regime corresponds to westward component).
The data correspond to the passage at Earth of a long-duration interplanetary CME lasting from 01:00 UT on18 August until 15:00 UT on 19 August (Richardson andCane, 2010). Noteworthy are (i) the highly variable dynamicpressure; (ii) the magnetic field vector, which after an initialrotation settles to values ofBz ∼ −15 nT andBy ∼ −10 nTwith corresponding smoothly decreasing clock angle to therange (150–120◦); and most importantly (iii) the high valuesof the merging electric field, settling later in the day to val-ues of∼ 7 mV m−1 and the low Alfvén Mach number (2–5)compared to typical solar wind values (∼ 8–10).
During the central time interval of our study (12:00–16:00 UT)Pdyn decreases from 5 to< 1 nPa due to the de-creasing density. The magnetic field lies essentially in they–z plane (Bx < 3 nT; By ∼ −10 nT; Bz ∼ −15 nT; clockangle decreasing from 150 to 120◦). The bulk speed is∼ 450 km s−1.
A major difference between the intervals 04:00–12:00 and12:00–18:00 UT (our detailed study) is the presence of subin-tervals when the clock angle is between 150 and 180◦ inthe former. This is associated with higherEKL values (8–10 mV m−1) and, as we shall see below, higher peaks of thePCN index. We also note the abrupt increases of the clock an-gle (to 180◦) andEKL (from 7 to 8.5 mV m−1) at 10:00 UT.Below we shall see that this leads to a convection increase atthe dayside polar cap boundary at∼ 11:00 UT, as monitoredby ground magnetometers. This is consistent with a propaga-tion delay from ACE to the magnetopause of≈ 60 min. ACEwas located at (228,−34, 13)RE.
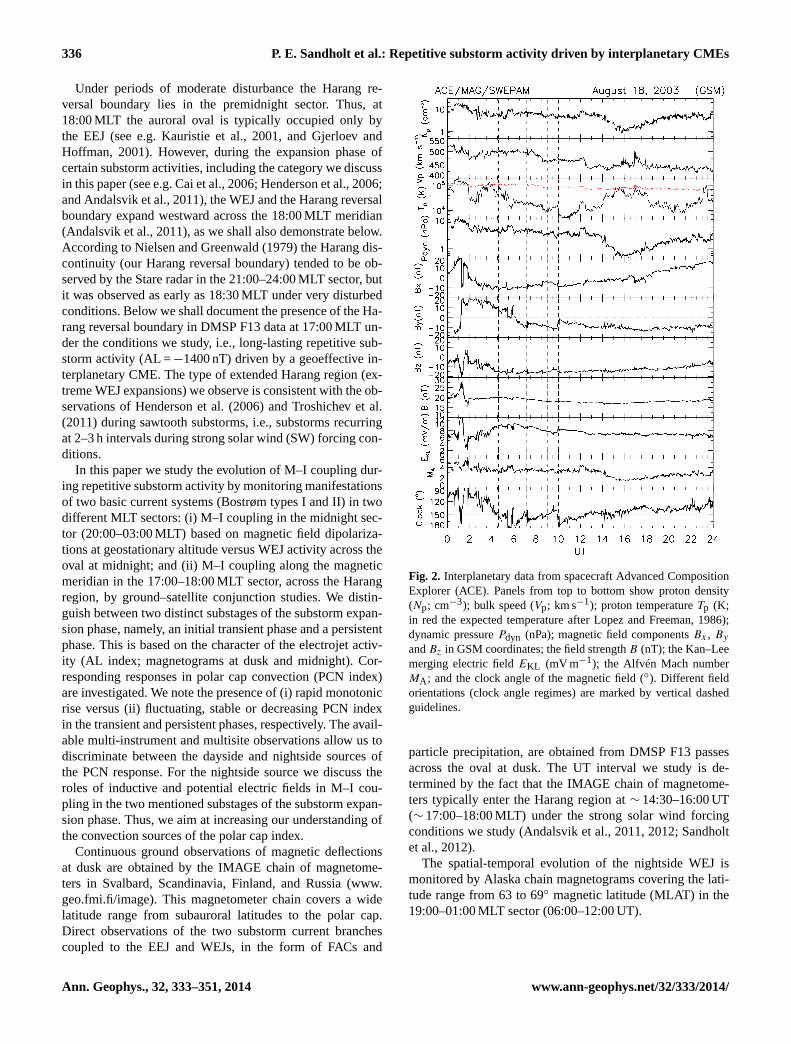
Figure3 shows the geomagnetic indices AL (nT) and PCN(mV m−1) for the whole day (18 August 2003). PCN is ameasure of the equivalent convection in the central polar capof the Northern Hemisphere (Troshichev et al., 2000). Theentire data set is from the Northern Hemisphere. The PCNindex is sensitive to both dayside and nightside convectionsources (Kullen et al., 2009; Gao et al., 2012; Sandholt et al.,2012). The interval from 04:00 to 20:00 UT is characterizedby a series of major AL excursions each of which maxi-mizes at values of−1000 to−1600 nT, marked by verticalguidelines. Each large AL excursion (initial transient phase)is followed by a persistent phase and a partial recovery to
Fig. 3. AL (nT) and PCN (mV m−1) indices for 18 August 2003.Onsets of AL excursions and corresponding PCN enhancements aremarked by vertical guidelines.
values within−400 to −600 nT. In subinterval I (04:00–12:00 UT) these events recur at 2–3 h intervals. In inter-val II (12:00–18:00 UT) major AL excursions recur at shorter(∼ 1 h) intervals. These AL events are accompanied by cor-responding PCN enhancements. The PCN index thus revealsa pulsed mode of polar cap convection. We note that thechange from larger to shorter recurrence times at 12:00 UTis accompanied by a change from higher (5–6 mV m−1) tolower (3.5 mV m−1) PCN peak amplitudes. Related to this isthe higher background (minimum value between the peaks)PCN level in interval I (3 mV m−1) compared to interval II(2.5 mV m−1). This may be due to a correspondingly higherlevel ofEKL (dayside source) in this interval (see Fig. 2).
The relatively stableEKL in this case (decreasing slowlyfrom 10 to 7 mV m−1 during the subinterval 06:00–12:00 UTand remaining very stable thereafter from 12:00 onwards)makes it generally easy to distinguish between the dayside(magnetopause reconnection) and nightside (magnetotail re-connection) sources of polar cap convection in such cases.
In these activity series we distinguish between (i) an ini-tial transient phase (initial, abrupt AL excursion) followedby (ii) a persistent phase characterized by a persistent highAL activity (see interval 04:00–12:00 UT) and (iii) a reducedAL deflection in the phase of partial recovery. A correspon-dence to this AL behavior is seen in the PCN index: (i) initialmonotonic rise, followed by (ii) persistent high PCN values,and (iii) decrease to the background level. Later we shall dis-cuss the specific PCN increase during the interval 11:00 to11:40 UT (with PCN maximum at 6 mV m−1) from the per-spective of the dayside and nightside convection sources. Adayside contribution is expected in view of the abruptEKLenhancement recorded by ACE at∼ 10:00 UT.
www.ann-geophys.net/32/333/2014/ Ann. Geophys., 32, 333–351, 2014

338 P. E. Sandholt et al.: Repetitive substorm activity driven by interplanetary CMEs
Fig. 4. AL–SYM-H–PCN indices for the interval 12:00–18:00 UT.Three passes of spacecraft DMSP F13 across the oval at dusk(13:26, 15:09, 16:46 UT) are marked by arrows. Two majorEEJ/WEJ events at dusk (14:20 and 15:45 UT) are marked by verti-cal dashed lines.
Figure4 shows a plot of the three indices AL (top), SYM-H, and PCN (bottom). Three passes of spacecraft DMSP F13across the oval at dusk (13:26, 15:09, 16:46 UT) are markedby arrows. Two major EEJ/WEJ events at dusk (14:20 and15:45 UT), as inferred from the IMAGE chain magnetometerdata (see below), are marked by vertical dashed lines.
A pattern of repetitive events consisting of (i) major ALevents followed by SYM-H dips and (ii) intervals of par-tial recoveries in both parameters are identified. Thus, fromthese plots we distinguish between two levels of the AL ac-tivity: (i) major AL events (AL minima within−1000 to−1500 nT) and (ii) AL partial recovery (repetitive AL eventswithin −400 to−1000 nT). We also note the PCN enhance-ments in the phase of SYM-H partial recovery. Major AL–PCN events recur at∼ 1 h intervals.
The two first satellite passes (13:26 and 15:09 UT, markedF13) occurred at the time of|SYM-H| increases, while thethird pass (at 16:46 UT) occurred in a phase of|SYM-H| par-tial recovery (see middle panel). Below we shall document
the different states of M–I coupling in Harang region-northand Harang region-south during the satellite traversals acrossthe auroral oval at dusk corresponding to these differentphases of SYM-H activity.
Figure5 shows particle precipitation, ion drift and mag-netic deflections (FAC signatures) during a dusk-to-dawncrossing of the oval and polar cap by satellite DMSP F13 inthe interval 13:18–13:45 UT. From the precipitation data wenote the presence of a double auroral configuration acrossboth the dusk and dawn sectors of the oval. The high-latitudebranch of the aurora at dusk corresponds to the regime ofwestward electrojet (antisunward convection) which we re-fer to as Harang region-north. At 13:25 UT Harang region-north is located within 69–72◦ MLAT. This regime is charac-terized by an outward-directed FAC (negative1Bz gradient).This is the expected FAC polarity at the western edge of thewestward electrojet in a Bostrøm type I current configuration(Marghitu et al., 2009) (see Fig. 1). The polar cap boundary isidentified as the abrupt transition from the auroral oval to po-lar rain precipitation (Fairfield and Scudder, 1985) at ∼ 72◦
MLAT (13:26:20 UT).The southern branch of the aurora, containing intense elec-
tron and ion fluxes within∼ 60–63◦ MLAT, is accompa-nied by large positive (at equatorward boundary) and neg-ative (further north)1Bz gradients. The steep positive gra-dient near the equatorward boundary indicates an intense,concentrated R2 FAC flowing into the ionosphere. We notethat this satellite crossing of the bipolar FAC system within57–62◦ MLAT (17.2 MLT) occurred at the time (13:22 UT)of increasing SYM-H deflection (partial ring current moni-tor; see Fig.4) and a clear positiveX deflection at IMAGEstation NUR (57◦ MLAT; see below), indicating enhancedEEJ activity. Northward-directed ionospheric Pedersen cur-rent closure of the R2 FAC, possibly giving rise to the EEJ,is marked by the horizontal arrow in the bottom panel. Theobserved bipolar FAC system in Harang region-south is thatwhich is schematically indicated in Fig. 1.
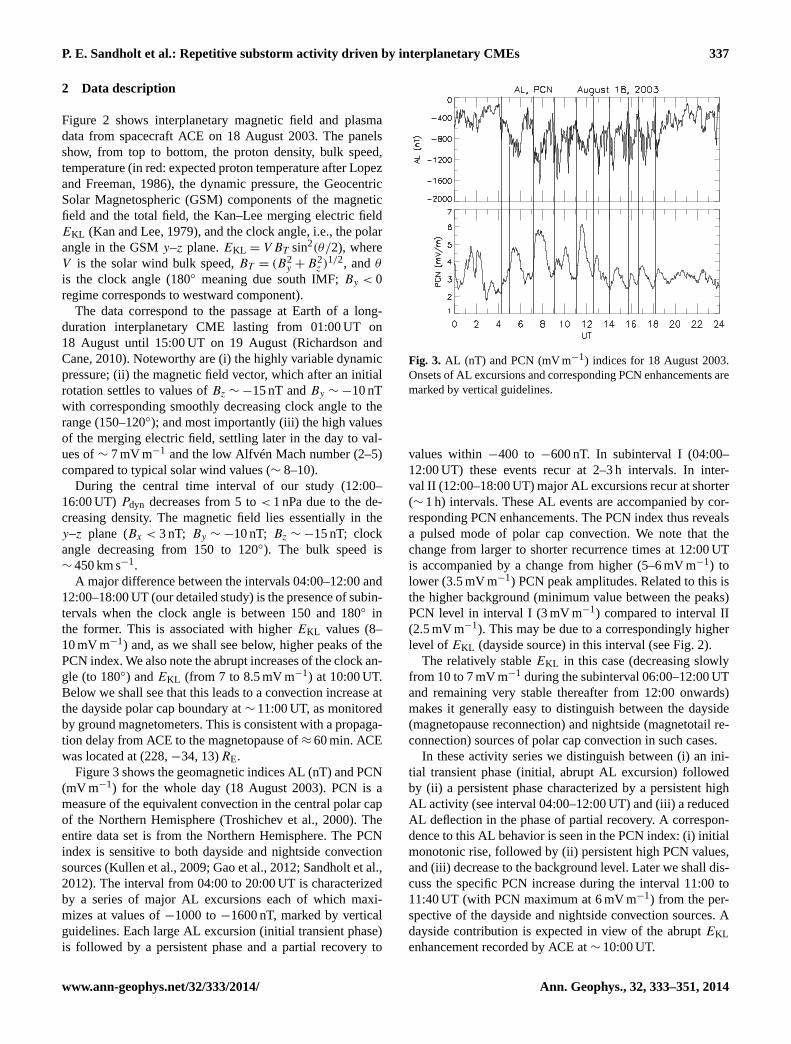
Figure6 shows F13 data for the next crossing of the ovalat dusk within the interval 15:03:00–15:08:10 UT. Combin-ing precipitation and cross-track ion drift data, we identifyclear signatures of Harang region-south and Harang region-north at 17.5 MLT, as marked in the figure. As on the pre-vious pass the F13 crossing of Harang region-south during15:03–15:05 UT occurred in a phase of increasing SYM-Hdeflection (see Fig.4). We note (i) the strong R2 FAC in-tensity (large positive1Bz gradient marked by solid arrow)at the equatorward boundary of the southern auroral branch(Harang region-south), (ii) a similarly strong negative gradi-ent further north in Harang region-south (solid arrow), and(iii) the R1-type FAC structures and inverted-V type elec-tron precipitations within Harang region-north. In the mostintense of the latter events we do see a FAC and ion driftconfiguration (flow channel on the poleward side of outward-directed FAC) which is similar to that typically associatedwith auroral streamer events (see e.g.Sergeev et al., 2004).
Ann. Geophys., 32, 333–351, 2014 www.ann-geophys.net/32/333/2014/

P. E. Sandholt et al.: Repetitive substorm activity driven by interplanetary CMEs 339
Fig. 5. DMSP F13 data for the dusk-to-dawn traversal of the oval–polar cap – oval during the interval 13:18–13:45 UT. Panels from top tobottom shows (i) electron (ion) energy flux, (ii) electron (ion) average energy, (iii) electron spectrograms, (iv) ion spectrograms, (v) cross-track ion drift (horizontal component in black trace), (vi)1By and1Bz (yellow). The regime of antisunward convection and northern auroralbranch at dusk (Harang region-north; HR-N) is marked by vertical guidelines. Regimes of enhanced FAC intensity are marked by verticalarrows in the bottom panel.
The association between the downward-directed R2 FAC,the ionospheric Pedersen current closure (indicated by hori-zontal arrow in the lower panel) and the EEJ is as expectedfrom the Bostrøm type II current configuration. The elec-tron precipitation in HR-S shows rather broad-banded energyspectra, which is a typical result of Alfv́en-wave acceleration(e.g.Haerendel, 2011).
These observations in Harang region-north are relevant inview of this statement byHaerendel(2011): “In the case ofauroral streamers we have a deplorable lack of electromag-netic data on the arcs and flow channels.” Below we shalldocument the ground magnetic signature of the auroral event(inverted-V type arc at 17.5 MLT) traversed by DMSP F13 at15:07 UT.
Figure 7 shows F13 data from an oval crossing fromsouth to north at dusk (17.9 MLT) within the interval 16:40–16:52 UT. This F13 crossing of the oval equatorward bound-ary at dusk (16:43 UT) occurred at the time of a maximumpartial recovery of the SYM-H index, just before a new
SYM-H dip appeared (see Fig.4). Thus we infer that thispass occurred near the western boundary of a retracted HRand WEJ. The oval at dusk is in this case occupied by theregime of EEJ (sunward convection). Compared to the othertwo passes reported above, the R2 FAC is a very weak R2(small 1Bz gradient). Absent is the strong R2 FAC (steeppositive 1Bz gradient) observed at the oval equatorwardboundary in the two previous passes.
The oval poleward boundary (polar cap boundary) at70.8◦ MLAT/17.9 MLT (16:48 UT) is characterized by twodiscrete arcs (accelerated electron populations), a fluctu-ating ion drift signature (sunward–antisunward–sunward–antisunward) and associated two-component outward-directed Birkeland current structure. High-resolution datashow a narrow regime of antisunward convection reach-ing 2 km s−1 in the close vicinity of the energetic arc. Thisaurora–FAC–ion drift configuration is observed at the po-lar cap boundary near the western edge of the WEJ-SCW(see Fig. 1 andMarghitu et al., 2009). The double arc (with
www.ann-geophys.net/32/333/2014/ Ann. Geophys., 32, 333–351, 2014
340 P. E. Sandholt et al.: Repetitive substorm activity driven by interplanetary CMEs
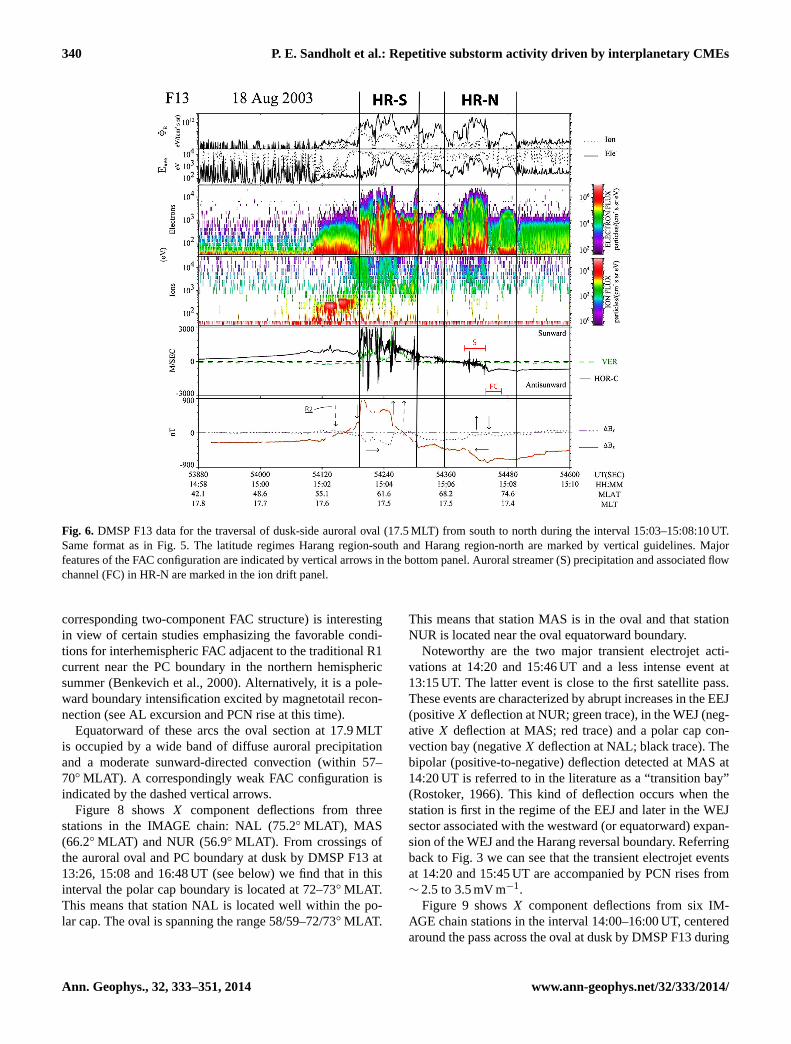
Fig. 6. DMSP F13 data for the traversal of dusk-side auroral oval (17.5 MLT) from south to north during the interval 15:03–15:08:10 UT.Same format as in Fig.5. The latitude regimes Harang region-south and Harang region-north are marked by vertical guidelines. Majorfeatures of the FAC configuration are indicated by vertical arrows in the bottom panel. Auroral streamer (S) precipitation and associated flowchannel (FC) in HR-N are marked in the ion drift panel.
corresponding two-component FAC structure) is interestingin view of certain studies emphasizing the favorable condi-tions for interhemispheric FAC adjacent to the traditional R1current near the PC boundary in the northern hemisphericsummer (Benkevich et al., 2000). Alternatively, it is a pole-ward boundary intensification excited by magnetotail recon-nection (see AL excursion and PCN rise at this time).
Equatorward of these arcs the oval section at 17.9 MLTis occupied by a wide band of diffuse auroral precipitationand a moderate sunward-directed convection (within 57–70◦ MLAT). A correspondingly weak FAC configuration isindicated by the dashed vertical arrows.
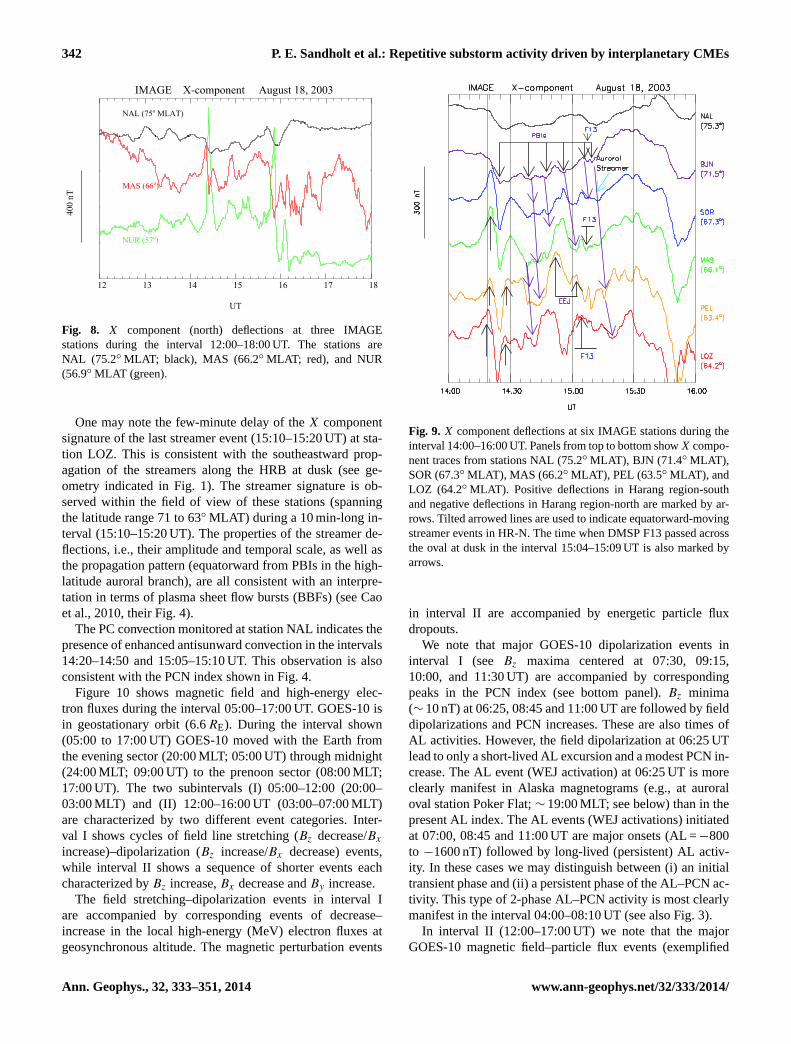
Figure 8 shows X component deflections from threestations in the IMAGE chain: NAL (75.2◦ MLAT), MAS(66.2◦ MLAT) and NUR (56.9◦ MLAT). From crossings ofthe auroral oval and PC boundary at dusk by DMSP F13 at13:26, 15:08 and 16:48 UT (see below) we find that in thisinterval the polar cap boundary is located at 72–73◦ MLAT.This means that station NAL is located well within the po-lar cap. The oval is spanning the range 58/59–72/73◦ MLAT.
This means that station MAS is in the oval and that stationNUR is located near the oval equatorward boundary.
Noteworthy are the two major transient electrojet acti-vations at 14:20 and 15:46 UT and a less intense event at13:15 UT. The latter event is close to the first satellite pass.These events are characterized by abrupt increases in the EEJ(positiveX deflection at NUR; green trace), in the WEJ (neg-ative X deflection at MAS; red trace) and a polar cap con-vection bay (negativeX deflection at NAL; black trace). Thebipolar (positive-to-negative) deflection detected at MAS at14:20 UT is referred to in the literature as a “transition bay”(Rostoker, 1966). This kind of deflection occurs when thestation is first in the regime of the EEJ and later in the WEJsector associated with the westward (or equatorward) expan-sion of the WEJ and the Harang reversal boundary. Referringback to Fig. 3 we can see that the transient electrojet eventsat 14:20 and 15:45 UT are accompanied by PCN rises from∼ 2.5 to 3.5 mV m−1.
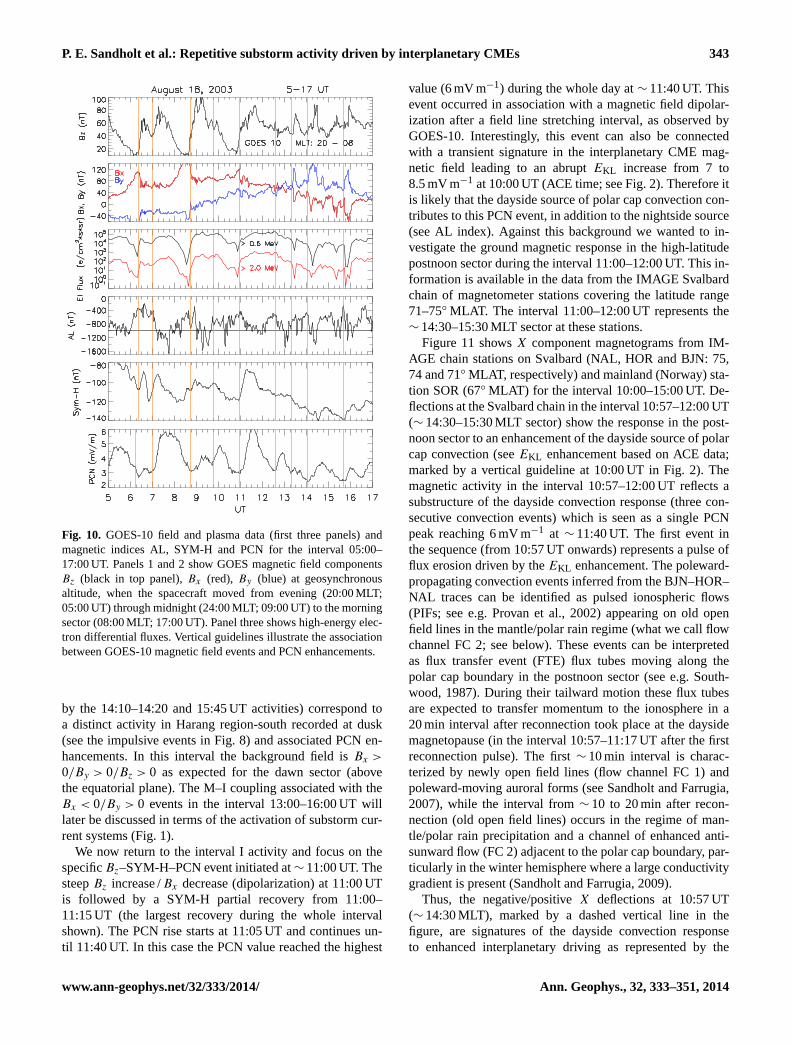
Figure 9 showsX component deflections from six IM-AGE chain stations in the interval 14:00–16:00 UT, centeredaround the pass across the oval at dusk by DMSP F13 during
Ann. Geophys., 32, 333–351, 2014 www.ann-geophys.net/32/333/2014/

P. E. Sandholt et al.: Repetitive substorm activity driven by interplanetary CMEs 341
Fig. 7.DMSP F13 data for the dusk-side oval traversal from south to north during interval 16:40–16:52 UT. Same format as in Fig.6.
15:04–15:09 UT. The stations span the latitude range from75.2 (NAL) to 63.5◦ MLAT (PEL). The trace from stationLOZ (64.2◦ MLAT) in the bottom panel is included becauseLOZ is located slightly to the east of the other stations (inKola Peninsula, Russia). The two major WEJ events at 14:20and 15:45 UT are easily identified. Referring back to Fig.4we note the association with major AL events and corre-sponding SYM-H dips at these times. The 14:20 UT eventis characterized by a WEJ expansion from the eastern side ofthe IMAGE chain. This WEJ activity is attributed to the west-ward expansion of the M–I current system called the SCW(see schematic illustration in Fig. 1).
This activity is preceded by a positive deflection (EEJ in-tensification) at stations SOR, MAS, PEL and LOZ in the in-terval 14:15–14:20 UT. The WEJ expansion event is followedby an interval characterized by auroral streamers propagat-ing equatorward from the high-latitude branch of the aurora,centered at∼ 71◦ MLAT (see satellite data above), during14:25–15:10 UT. This is an interval of partial AL recovery(AL within −500 to−700 nT), possibly dominated by BBFs.
We note the positiveX deflections (EEJ activity) at sta-tions LOZ, PEL, MAS and SOR in the interval 14:45–14:55 UT, after the eastward retreat of the short-lived WEJ
expansion event (also affecting stations PEL and LOZ). Thenegative deflections at stations PEL and SOR in this inter-val are not so strong as the positive deflections in the EEJsignature. The latter EEJ events are expanding westward inthe 18:00–17:00 MLT sector (compare LOZ and PEL traceswithin 14:43–14:45 UT) and poleward within 63–67◦ MLAT(PEL, MAS and SOR). This evolution is consistent with theprocess of R2 FAC excitation and coupling to Harang region-south associated with plasma intrusion and flow braking, assketched in Fig. 1.
The streamer activity detected at stations BJN and SOR(within 67–71◦ MLAT) during 15:06–15:07 UT occurred inthe vicinity of the DMSP F13 trajectory during its cross-ing of the Harang reversal boundary from south to northalong the 17.5 MLT meridian. This ground–satellite conjunc-tion gives us a chance to identify the particle precipitation–FAC–ion drift signatures of these streamer events (see F13data description above). The satellite pass (15:05–15:10 UT)occurred in an interval of very dynamic behavior of theHRB (north–south motions within the 63–67◦ MLAT range),as inferred from the ground magnetic data during 14:45–15:20 UT. This latitude range roughly corresponds to theregime located between HR-S and HR-N in Fig.6.
www.ann-geophys.net/32/333/2014/ Ann. Geophys., 32, 333–351, 2014
342 P. E. Sandholt et al.: Repetitive substorm activity driven by interplanetary CMEs
IMAGE X-component August 18, 2003
UT
12 13 14 15 16 17 186000
6200
6400
6600
6800
7000
NAL (75o MLAT)
MAS (66o)
400
nT
NUR (57o)
12 13 14 15 16 17 18
Fig. 8. X component (north) deflections at three IMAGEstations during the interval 12:00–18:00 UT. The stations areNAL (75.2◦ MLAT; black), MAS (66.2◦ MLAT; red), and NUR(56.9◦ MLAT (green).
One may note the few-minute delay of theX componentsignature of the last streamer event (15:10–15:20 UT) at sta-tion LOZ. This is consistent with the southeastward prop-agation of the streamers along the HRB at dusk (see ge-ometry indicated in Fig. 1). The streamer signature is ob-served within the field of view of these stations (spanningthe latitude range 71 to 63◦ MLAT) during a 10 min-long in-terval (15:10–15:20 UT). The properties of the streamer de-flections, i.e., their amplitude and temporal scale, as well asthe propagation pattern (equatorward from PBIs in the high-latitude auroral branch), are all consistent with an interpre-tation in terms of plasma sheet flow bursts (BBFs) (seeCaoet al., 2010, their Fig. 4).
The PC convection monitored at station NAL indicates thepresence of enhanced antisunward convection in the intervals14:20–14:50 and 15:05–15:10 UT. This observation is alsoconsistent with the PCN index shown in Fig.4.
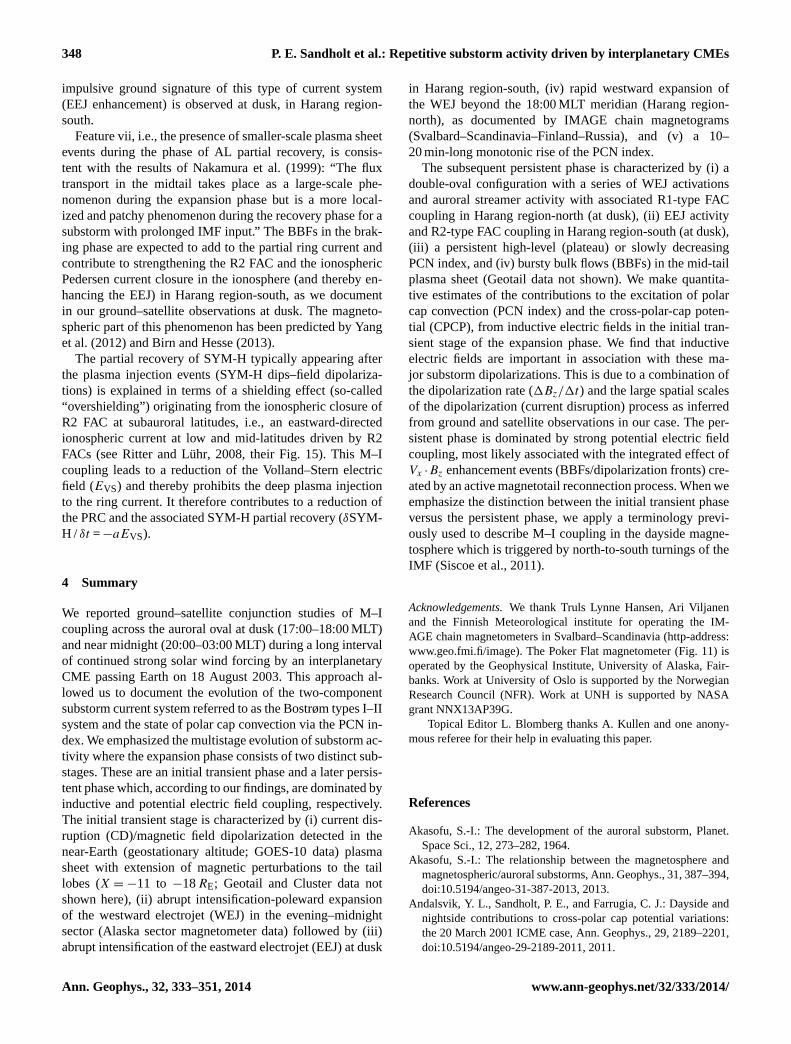
Figure 10 shows magnetic field and high-energy elec-tron fluxes during the interval 05:00–17:00 UT. GOES-10 isin geostationary orbit (6.6RE). During the interval shown(05:00 to 17:00 UT) GOES-10 moved with the Earth fromthe evening sector (20:00 MLT; 05:00 UT) through midnight(24:00 MLT; 09:00 UT) to the prenoon sector (08:00 MLT;17:00 UT). The two subintervals (I) 05:00–12:00 (20:00–03:00 MLT) and (II) 12:00–16:00 UT (03:00–07:00 MLT)are characterized by two different event categories. Inter-val I shows cycles of field line stretching (Bz decrease/Bx
increase)–dipolarization (Bz increase/Bx decrease) events,while interval II shows a sequence of shorter events eachcharacterized byBz increase,Bx decrease andBy increase.
The field stretching–dipolarization events in interval Iare accompanied by corresponding events of decrease–increase in the local high-energy (MeV) electron fluxes atgeosynchronous altitude. The magnetic perturbation events
Fig. 9. X component deflections at six IMAGE stations during theinterval 14:00–16:00 UT. Panels from top to bottom showX compo-nent traces from stations NAL (75.2◦ MLAT), BJN (71.4◦ MLAT),SOR (67.3◦ MLAT), MAS (66.2◦ MLAT), PEL (63.5◦ MLAT), andLOZ (64.2◦ MLAT). Positive deflections in Harang region-southand negative deflections in Harang region-north are marked by ar-rows. Tilted arrowed lines are used to indicate equatorward-movingstreamer events in HR-N. The time when DMSP F13 passed acrossthe oval at dusk in the interval 15:04–15:09 UT is also marked byarrows.
in interval II are accompanied by energetic particle fluxdropouts.
We note that major GOES-10 dipolarization events ininterval I (see Bz maxima centered at 07:30, 09:15,10:00, and 11:30 UT) are accompanied by correspondingpeaks in the PCN index (see bottom panel).Bz minima(∼ 10 nT) at 06:25, 08:45 and 11:00 UT are followed by fielddipolarizations and PCN increases. These are also times ofAL activities. However, the field dipolarization at 06:25 UTlead to only a short-lived AL excursion and a modest PCN in-crease. The AL event (WEJ activation) at 06:25 UT is moreclearly manifest in Alaska magnetograms (e.g., at auroraloval station Poker Flat;∼ 19:00 MLT; see below) than in thepresent AL index. The AL events (WEJ activations) initiatedat 07:00, 08:45 and 11:00 UT are major onsets (AL =−800to −1600 nT) followed by long-lived (persistent) AL activ-ity. In these cases we may distinguish between (i) an initialtransient phase and (ii) a persistent phase of the AL–PCN ac-tivity. This type of 2-phase AL–PCN activity is most clearlymanifest in the interval 04:00–08:10 UT (see also Fig. 3).
In interval II (12:00–17:00 UT) we note that the majorGOES-10 magnetic field–particle flux events (exemplified
Ann. Geophys., 32, 333–351, 2014 www.ann-geophys.net/32/333/2014/
P. E. Sandholt et al.: Repetitive substorm activity driven by interplanetary CMEs 343
Fig. 10. GOES-10 field and plasma data (first three panels) andmagnetic indices AL, SYM-H and PCN for the interval 05:00–17:00 UT. Panels 1 and 2 show GOES magnetic field componentsBz (black in top panel),Bx (red), By (blue) at geosynchronousaltitude, when the spacecraft moved from evening (20:00 MLT;05:00 UT) through midnight (24:00 MLT; 09:00 UT) to the morningsector (08:00 MLT; 17:00 UT). Panel three shows high-energy elec-tron differential fluxes. Vertical guidelines illustrate the associationbetween GOES-10 magnetic field events and PCN enhancements.
by the 14:10–14:20 and 15:45 UT activities) correspond toa distinct activity in Harang region-south recorded at dusk(see the impulsive events in Fig.8) and associated PCN en-hancements. In this interval the background field isBx >
0/By > 0/Bz > 0 as expected for the dawn sector (abovethe equatorial plane). The M–I coupling associated with theBx < 0/By > 0 events in the interval 13:00–16:00 UT willlater be discussed in terms of the activation of substorm cur-rent systems (Fig. 1).
We now return to the interval I activity and focus on thespecificBz–SYM-H–PCN event initiated at∼ 11:00 UT. ThesteepBz increase /Bx decrease (dipolarization) at 11:00 UTis followed by a SYM-H partial recovery from 11:00–11:15 UT (the largest recovery during the whole intervalshown). The PCN rise starts at 11:05 UT and continues un-til 11:40 UT. In this case the PCN value reached the highest
value (6 mV m−1) during the whole day at∼ 11:40 UT. Thisevent occurred in association with a magnetic field dipolar-ization after a field line stretching interval, as observed byGOES-10. Interestingly, this event can also be connectedwith a transient signature in the interplanetary CME mag-netic field leading to an abruptEKL increase from 7 to8.5 mV m−1 at 10:00 UT (ACE time; see Fig. 2). Therefore itis likely that the dayside source of polar cap convection con-tributes to this PCN event, in addition to the nightside source(see AL index). Against this background we wanted to in-vestigate the ground magnetic response in the high-latitudepostnoon sector during the interval 11:00–12:00 UT. This in-formation is available in the data from the IMAGE Svalbardchain of magnetometer stations covering the latitude range71–75◦ MLAT. The interval 11:00–12:00 UT represents the∼ 14:30–15:30 MLT sector at these stations.
Figure11 showsX component magnetograms from IM-AGE chain stations on Svalbard (NAL, HOR and BJN: 75,74 and 71◦ MLAT, respectively) and mainland (Norway) sta-tion SOR (67◦ MLAT) for the interval 10:00–15:00 UT. De-flections at the Svalbard chain in the interval 10:57–12:00 UT(∼ 14:30–15:30 MLT sector) show the response in the post-noon sector to an enhancement of the dayside source of polarcap convection (seeEKL enhancement based on ACE data;marked by a vertical guideline at 10:00 UT in Fig.2). Themagnetic activity in the interval 10:57–12:00 UT reflects asubstructure of the dayside convection response (three con-secutive convection events) which is seen as a single PCNpeak reaching 6 mV m−1 at ∼ 11:40 UT. The first event inthe sequence (from 10:57 UT onwards) represents a pulse offlux erosion driven by theEKL enhancement. The poleward-propagating convection events inferred from the BJN–HOR–NAL traces can be identified as pulsed ionospheric flows(PIFs; see e.g.Provan et al., 2002) appearing on old openfield lines in the mantle/polar rain regime (what we call flowchannel FC 2; see below). These events can be interpretedas flux transfer event (FTE) flux tubes moving along thepolar cap boundary in the postnoon sector (see e.g.South-wood, 1987). During their tailward motion these flux tubesare expected to transfer momentum to the ionosphere in a20 min interval after reconnection took place at the daysidemagnetopause (in the interval 10:57–11:17 UT after the firstreconnection pulse). The first∼ 10 min interval is charac-terized by newly open field lines (flow channel FC 1) andpoleward-moving auroral forms (seeSandholt and Farrugia,2007), while the interval from∼ 10 to 20 min after recon-nection (old open field lines) occurs in the regime of man-tle/polar rain precipitation and a channel of enhanced anti-sunward flow (FC 2) adjacent to the polar cap boundary, par-ticularly in the winter hemisphere where a large conductivitygradient is present (Sandholt and Farrugia, 2009).
Thus, the negative/positiveX deflections at 10:57 UT(∼ 14:30 MLT), marked by a dashed vertical line in thefigure, are signatures of the dayside convection responseto enhanced interplanetary driving as represented by the
www.ann-geophys.net/32/333/2014/ Ann. Geophys., 32, 333–351, 2014

344 P. E. Sandholt et al.: Repetitive substorm activity driven by interplanetary CMEs
EEJ
FC1
WEJ
EEJ
(FC2)
PIFs
Fig. 11.X component magnetograms from IMAGE chain stationson Svalbard (NAL, HOR and BJN: 75, 74 and 71◦ MLAT, re-spectively) and mainland station SOR (67◦ MLAT) for the inter-val 10:00–15:00 UT. Marked by arrows are signatures of poleward-propagating pulsed ionospheric flows (PIFs) in the postnoon sectorwithin 11:00–12:00 UT (∼ 14:30–15:30 MLT) and polar cap (PC)flow events (top panel) in the interval 12:30–15:00 UT (∼ 16:00–18:30 MLT). Events of positiveX deflection at SOR, associatedwith newly open field lines (FC 1) and return flows centered at lowerlatitudes (EEJ), are marked in the bottom trace (SOR).
reconnection electric field (seeEKL parameter in Fig. 2).The positiveX response at SOR is consistent with enhancednorthwestward convection in the regime close to the iono-spheric projection of the merging line, which is expected tobe longitudinally expanded in this case of magnetopause ero-sion event (see e.g.Crooker et al., 1991). For documenta-tions of associations between auroral, magnetic and convec-tion signatures of pulsed magnetopause reconnection in thepostnoon sector we refer toSandholt et al.(1986), Sandholtand Farrugia(2007) andSandholt et al.(2010).
Summarizing the observations most relevant to the presentcase (PCN event between 11:00 and 12:00 UT), we may listthe following sequence of events: (i) abruptEKL enhance-ment at 10:00 UT (ACE time), (ii) three pulses of enhanceddayside convection in the interval 10:57–11:40 UT, (iii) con-tinuous PCN increase from 3 to 6 mV m−1 between 11:05
and 11:40 UT, followed by decrease, (iv) magnetic field dipo-larizations at GOES-10 (located within 02:00–03:00 MLT)(Bz increase from 20 to 50 nT during 10:52–11:00 UT andfrom 50 to 85 nT during 11:00–11:45 UT), and (v) AL de-crease from−400 to−1000 nT during 11:00–12:00 UT.
From these observations we conclude that both the daysideand nightside sources of polar cap convection were activecontributors to the PCN event in the interval between 11:00and 12:00 UT.
Later in the interval shown (12:30–15:00 UT) we havemarked in the NAL trace in Fig.11 polar cap convectionevents, i.e., antisunward polar cap flow events recorded in the16:00–18:30 MLT sector (see correlation with PCN peaks).In this MLT regime station NAL becomes increasingly moresensitive to the nightside source of polar cap convectionwith time. The 14:20 UT event is one of the major sub-storm (WEJ) expansion events reported above. At this timestation SOR is initially in the EEJ regime, but later theWEJ expanded beyond this station, causing the transitionbay (positive–negativeX deflection) we discussed earlier.From the DMSP F13 crossing of the polar cap boundary at73◦ MLAT (16.5 MLT) at 13:26 UT (Fig.5) we infer that sta-tion NAL (75◦ MLAT) is located well inside the polar caparound this time.
We now present observations of substorm activity in inter-val I (05:00–12:00 UT) representing the ionospheric part ofM–I coupling at MLTs closer to midnight. This is the west-ward electrojet in the Bostrøm type I current system (sub-storm current wedge; see Fig. 1).
Figure12shows theH component traces from five Alaskachain stations in the interval 06:00–12:00 UT which cover theMLT sector 19:00–01:00 MLT. These stations are spanningthe latitude regime 63.6–68.7◦ MLAT. These traces providea good supplement to the AL index concerning the WEJ evo-lution in this particular interval. Pseudo-breakups at 06:25,08:40 and 10:55 UT are marked by vertical guidelines. Wenote the good correlation between GOES-10 dipolarizationsand major onsets (07:02, 09:00 and 11:06 UT) in the inter-val 09:00–12:00 UT (21:00–01:00 MLT). During the 09:00–09:50 and 11:00–12:00 UT substorms we do see a detailedcorrelation between GOES-10Bz enhancements and WEJintensifications. These events show the signature of double-onset substorms; i.e., a pseudo-breakup is followed by a ma-jor onset (see e.g.Nakamura et al., 1999). Most major excur-sions reached beyond−1000 nT. Each major WEJ enhance-ment (the transients at 07:02, 09:00, and 11:06 UT), spanninga wide latitude range (63.8–68.7◦ MLAT), is followed by alonger interval of persistent WEJ activity.
In the Discussion section we shall place these observa-tions in the context of M–I coupling processes with currentsystems as sketched in Fig. 1. Thus, the two categories ofGOES perturbation events observed in intervals I (midnightsector) and II (dawn sector) will be attributed to the activa-tion (intensification) of the Bostrøm type I (SCW centerednear midnight) and II (centered at dusk and dawn) current
Ann. Geophys., 32, 333–351, 2014 www.ann-geophys.net/32/333/2014/

P. E. Sandholt et al.: Repetitive substorm activity driven by interplanetary CMEs 345
Arctic-Ft Yukon-Poker Fl-CIGO H-component August 18, 2003
6 7 8 9 10 11 12UT
9.0•103
1.0•104
1.1•104
1.2•104
1.3•104
H (
nT)
Arctic Ft Yukon Poker Ft CIGO Gakona
63.6o
65.4o
65.7o
67.4o
68.7o
Fig. 12. Panels from top to bottom showH (horizontal) compo-nent traces from stations in Alaska (increasing latitude from top tobottom): Gakona (63.6◦ MLAT), CIGO (65.4◦), Poker Flat (65.4◦),Ft. Yukon (67.4◦), and Arctic Village (68.7◦) for the interval 06:00–12:00 UT. This interval corresponds to the 19:00–01:00 MLT sector.Pseudo-breakups are marked by vertical dashed lines.
systems, respectively. Related to this we also point out theassociation between theBx < 0/By > 0 events and the high-energy particle decreases in the interval 13:00–16:00 UT (seeDiscussion).
3 Discussion
The background for this study is related to the unsolved ques-tions that exist on the spatial-temporal evolution of the elec-trodynamic coupling between the plasma sheet–lobe–ringcurrent system and the ionosphere during substorms. Ac-cording to Akasofu (2013) “we are still at an early stageof understanding auroral/magnetospheric substorms”. Oneof the unsolved questions which we explore is related tothe activation of the different elements of the compositepattern of substorm currents (M–I coupling) during the ex-pansion phase of storm-time repetitive substorms. Thus, es-sential to us here is the temporal-spatial evolution of M–Icoupling in different latitude–longitude regimes, includingthe southern and northern sections of the auroral oval (atnight and at dusk/dawn) and the polar cap during eventsinitiated by plasma sheet current disruptions–magnetic fielddipolarizations. Taking advantage of two different ground–satellite conjunctions in two separate intervals (05:00–12:00and 13:00–17:00 UT), we investigate the roles of differentbranches of the substorm current system, i.e., (i) plasmasheet–R1-FAC–WEJ coupling (Bostrøm type I system cen-tered near midnight), (ii) partial ring current–R2-FAC–EEJcoupling at dawn/dusk (Bostrøm type II system with signa-tures in Harang region-south), and (iii) M–I coupling relatedto earthward-moving flux tubes/plasma flow events in twostages of their evolution: (a) a Bostrøm type I system asso-ciated with BBFs/streamers, with manifestations in Harang
region-north, and (b) excitation of a Bostrøm type II systemwith dynamo action in the braking phase of flows/flux tubesat the plasma sheet–ring current boundary, with manifesta-tions in Harang region-south (Fig. 1).
On the topic of auroral streamer activity, a central featureof our observations in Harang region-north at dusk,Haeren-del (2011) stated: “In the case of auroral streamers we have adeplorable lack of electromagnetic data on the arcs and flowchannels”. Our discussion is relevant to substorms in gen-eral and applicable in particular to the specific substorm ac-tivity appearing during long intervals of continuously strongsolar wind forcing, i.e., when major storms are in progress.Central to our approach is the combination of observationsat dusk and at midnight MLTs. By this approach we aim atincreasing our understanding of the dynamic M–I couplingrepresented by the evolution of the classical current systems(Bostrøm types I and II) during the repetitive substorm ac-tivity which is driven by highly geoeffective interplanetaryCMEs.
Two distinct stages of M–I coupling in the substorm ex-pansion phase and corresponding activity levels are identi-fied on the basis of our data sets. Phase 1 (the initial transientphase) is characterized by (i) a 10–20 min-long magneticfield dipolarization process in the near-Earth plasma sheetwith typical dipolarization rate1Bz/1t = 50 nT/10 min≈ 10−10 V m−2, (ii) transient enhancements of the WEJwithin a wide latitude regime (63–69◦ MLAT) in the mid-night sector (Alaska chain data in Fig. 12), (iii) correspond-ing impulsive electrojet intensifications on both sides ofthe Harang reversal at dusk (IMAGE chain in Svalbard–Scandinavia–Finland–Russia), and (iv) a 10–20 min-longmonotonic rise in the PCN index.
Phase 2 (the persistent phase) is characterized by (i) near-EarthBz fluctuations and/or relatively highBz values beforethe field-stretching phase sets in, (ii) a series of westwardelectrojet activations near midnight and (iii) correspondingelectrojet activity on both sides of the Harang reversal atdusk, and (iv) a persistent high or slowly decreasing PCNlevel. The WEJ activity in Harang region-north shows a se-ries of equatorward-propagatingX component deflectionsand associated auroral streamer precipitation and FAC struc-ture as documented in our ground (IMAGE chain)–satellite(DMSP F13) conjunction studies.
On this background we found it appropriate to apply theterminology previously used bySiscoe et al.(2011) to de-scribe M–I coupling triggered by north-to-south transitionsof the IMF, namely, an initial transient phase and a persistentphase.
The character of the initial transient phase (field dipolar-ization and associated impulsive electrojet events at midnight(Fig. 12) and dusk (Fig. 8)) indicates that inductive elec-tric fields (EPS (inductive)) can play an important role inthis phase. This is supported by the following reasoning. Anexpression for the local value of the dawn–dusk componentof EPS (inductive) may be derived from Maxwell–Faraday’s
www.ann-geophys.net/32/333/2014/ Ann. Geophys., 32, 333–351, 2014

346 P. E. Sandholt et al.: Repetitive substorm activity driven by interplanetary CMEs
law: EPS (inductive) = (1Bz/1t) ·Lx , whereLx is the radialdimension (along thex axis) of the CD/dipolarization pro-cess.
Then we may derive the corresponding formula for thecross-polar-cap potential (CPCP). CPCP =kEPS· LX · LY ,where the magnetosphere–ionosphere potential trans-mission factork = 0.1− 0.2 (Gordeev et al., 2011). Ly
is the dawn–dusk dimension of the CD/dipolarizationprocess. Here we use the following estimates:1Bz/1t(GOES-10) ≈ 50 nT/10 min≈ 10−10 V m−2;Lx ≈ 10RE; LY ≈ 20RE. EPS (ind.) ∼ 5 mV m−1. Fromthis we get for the CPCP enhancement∼ 50–100 kV.Lx inthe magnetotail corresponds (maps) to the latitudinal widthof the WEJ at midnight (indicated in Fig. 12).
The corresponding value for the enhancement of thePCN index is1PCN = const.· EPS= 2–4 mV m−1. This re-lation for PCN is based on combined observations of PCNand CPCP enhancements documented bySandholt et al.(2012), as summarized in the empirical relation1CPCP(V) ∼ 5 · 1PCN (mV m−1) · LPC (km).LPC is the cross-polarcap distance. The derived value for a typical PCN enhance-ment in the transient phase fits well with the observations inour case.
According to our estimates, the PCN enhancement from3 to 6 mV m−1 during the interval 11:00–11:40 UT consistsof a major contribution from the nightside source (1PCNnight∼ 2.5 mV m−1) and a smaller contribution from thedayside source (1PCN day∼ 0.6 mV m−1; based on the re-lation1PCN day / PCN day =1EKL/EKL ). The correspond-ing CPCP-day (EKL enhancement) and CPCP-night (sub-storm) enhancements are then∼ 20 kV and 50–100 kV, re-spectively, in this transient phase. Here we assume that thedayside source has not reached the level of saturation.
Related to the above estimates we note that the CPCPvalue (EPC× LPC) derived from the DMSP F13 potentialcurve (difference between potential maximum and mini-mum along the track; not shown) during the polar capcrossing in the interval 13:25–13:37 UT (Fig. 5) is 167 kV(∼ 35 mV m−1
× 4700 km). This value is consistent withCPCP-day and CPCP-night contributions of∼ 115 and∼ 50 kV, respectively.
In contrast to the transient phase, the persistent phase,which is characterized by a PCN plateau or a slowly de-creasing PCN, is most likely dominated by potential electricfields associated with the integrated effect ofVx–Bz events(BBFs/dipolarization fronts) in the mid-tail plasma sheet:EPS (potential) (=Vx ·Bz). Our distinction between the rolesof potential and inductive electric fields in the magnetotailduring the substorm process is in line with the study ofPu-dovkin et al.(1991). However, based on our observations ofthe association between near-Earth dipolarization and PCNrise in the transient phase we reserve a larger role for induc-tive electric fields in the excitation of polar cap convection inthis particular phase.
EE
IMF
Esw
ETL
R2R2
PRC
R1EEJ
R1
SW
LLBL
BBF
WEJ
JMP
OOFLC1
EHBL
D
N
CROSS-TAIL CURRENT
CROSS-TAILCURRENT
LLBL : low-latitude boundery layerEEJ : eastward electrojet ; WEJ : westward electrojetSW : solar wind ; TL : tail lobeBBF : bursty bulk �ow ; HBL : high latitude boundary layer
Fig. 13.Schematic illustration of Northern Hemisphere current sys-tems relating to the dayside and nightside sources of polar cap con-vection as marked by two dawn-to-dusk-directedE fields (D andN ) in the polar cap. The dayside source consists of dynamo pro-cesses (E ·J < 0) in magnetospheric boundary layers (BLs) at high(HBL) and low (LLBL) latitudes.E-field coupling from the solarwind (ESW) (along old open field lines) to the polar cap in thepostnoon sector is illustrated for a southwest-directed IMF (Bz < 0;By < 0). Dayside R1 FACs connected to the low-latitude boundarylayer (LLBL) and the magnetopause current flowing over the top ofthe magnetosphere (JMP) are shown. The substorm current systemsare reproduced from Fig.1. The auroral oval is represented by twoconcentric circles. The Harang reversal boundary is marked by adashed curved line connecting the poleward and equatorward ovalboundaries at dusk–premidnight.E-field coupling from the tail lobe(ETL ) to the nightside polar cap ionosphere (N ) is indicated.
Figure13 illustrates our effort at integrating the informa-tion extracted from the different data sets into a consistentpicture of the substorms process in the context of the basicelements of solar wind–magnetosphere–ionosphere couplingapplicable to the strong forcing case (interplanetary CME)we study. The dayside and nightside current systems respon-sible for the two-source nature of polar cap convection aremarked in this schematic drawing (see two dawn-to-dusk-directedE fields indicated by bold arrows in the PC). Thedayside source is shown in the variant of negative IMFBy
conditions (southwest-directed IMF) withE-field couplingalong old open magnetic field lines (OOFLs), giving rise toa prenoon versus postnoon convection asymmetry (see e.g.Heppner and Maynard, 1987), i.e.,E-field concentration in
Ann. Geophys., 32, 333–351, 2014 www.ann-geophys.net/32/333/2014/

P. E. Sandholt et al.: Repetitive substorm activity driven by interplanetary CMEs 347
the postnoon sector via ionospheric Pedersen current clo-sure of FACs marked R1–C1 (our FC 2 flow channel), asdescribed bySandholt and Farrugia(2009) and Sandholtet al.(2010). The ground magnetic signature of this daysideconvection source is demonstrated in Fig.11above (see alsodiscussion in relation to the presentation of this figure). Thedayside source of polar cap convection is regulated byEKL(Reiff et al., 1981; Kullen et al., 2010). According toKullenet al.(2010) the summer PC index correlates particularly wellwith EKL . This is demonstrated in our case by the 11:00 UTevent (see PCN increase during 11:00–11:40 UT), which in-cludes a response to the abruptEKL increase detected byACE at 10:00 UT (see Fig.2). However, from the relation1PCN day / PCN day =1EKL/EKL (seeTroshichev et al.,2000) we find (seeEKL enhancement from 7 to 8.5 mV m−1
at ≈ 10:00 UT in Fig. 2) that the contribution from1PCNday is relatively minor (≈ 0.6 mV m−1) compared to the PCNnight enhancement (≈ 2.5 mV m−1) in this case. By usingIMAGE chain data which are more sensitive to the daysideconvection source, we added information on the pulsed be-havior of the dayside source (MP reconnection) which is notresolved in the PCN index (Fig.11).
Our observations at dusk and midnight MLTs will be dis-cussed within the framework of the schematic illustration inFig. 13. A possible scenario for the type of repetitive sub-storms we study is a cycle involving (i) loading of magneticflux in the tail lobes, (ii) plasma sheet thinning/stretching ofthe magnetotail field (see e.g.Baumjohann et al., 1992), and(iii) disruption of the cross-tail current and magnetic fielddipolarization (see e.g.Jacquey and Sauvaud, 1992). This cy-cle is driven by continued magnetopause reconnection duringthe long intervals of southward-directed interplanetary mag-netic field in interplanetary CMEs.
The nightside source of polar cap convection involvesthe basic elements of M–I coupling processes from differ-ent magnetotail regimes applicable to our case: (i) R2 cou-pling from flow channel (injection dynamo) at the outer edgeof the partial ring current, at a radial distance of∼ 6.6RE(see GOES-10 data); (ii) R1 FAC coupling from large-scale current disruptions in the near-tail region (within∼ 6–12RE radial distance); and (iii) R1 coupling from smaller-scale current disruptions in the mid-tail (earthward-movingdipolarization fronts/BBFs–plasma-depleted flux tubes pos-sibly originating at the near-Earth neutral line beyondX ∼
−20RE).A central element in our interpretation is as follows: the
decrease (disruption) of the CTC and the activation of theSCW in the near-Earth plasma sheet is accompanied by adipolarization of the magnetic field, as documented in theGOES-10 data (see Fig.10), giving rise to inductive mag-netotail electric fields. At substorm onsetsBz enhancements(1Bz/1t ∼ 1Bx/1t ∼ 10 nT/10 min) in the tail lobes (X =
−17RE) have previously been observed to be accompaniedby E-field enhancements in the tail lobe (ETL ; seeSauvaudet al., 2012). This M–I coupling from the tail lobes to the
polar cap ionosphere is schematically indicated in Fig.13.The radial extent (outward expansion) of the dipolarizationprocess (see our estimate of the parameterLX: ∼ 5–10RE),corresponds to the latitudinal extent of the WEJ at midnight.The magnetic perturbation (and associated inductive electricfield) in the tail lobes gives rise to polar cap convection en-hancement (PCN night∝ EPS· Lx). The longitudinal expan-sion of SCW (ourLY parameter), corresponding to the ex-pansion of the WEJ into the 17:00–18:00 MLT sector, con-tributes to the CPCP enhancements in the transient phase ofour cases (1 CPCP∝ EPS· LY ).
The subsequent persistent phase is characterized by a se-ries of equatorward-propagating auroral streamers in Harangregion-north and EEJ enhancements in Harang region-south.The latter is explained by a dynamo process (E · J < 0) inthe regime of braking of intruding plasma (the injection dy-namo) and activation of a Bostrøm type II current system atdusk, as illustrated in the figure.
With reference to Fig.13 we suggest the following SW–M–I coupling processes in our case of repetitive substormactivity, based on the observations: (i) dayside and night-side sources of polar cap convection with ground stationsin Svalbard being sensitive primarily to the dayside andnightside convection sources in the intervals before and af-ter∼ 12:30 UT (∼ 16:00 MLT), respectively, in our case; (ii)cycles of magnetic field stretching–dipolarization observedby GOES-10; (iii) current disruptions (CD)/magnetic fielddipolarizations in the near-Earth magnetosphere (observedat geosynchronous altitude) with activations of the SCW in-volving R1 FAC coupling to the WEJ, leading to AL dips(and magnetic perturbations near midnight in Alaska); (iv)rapid longitudinal expansions of CD/dipolarization leadingto WEJ expanding into the 17:00–18:00 MLT sector recordedby IMAGE chain magnetograms; (v) plasma injection tothe partial ring current resulting in SYM-H dip and en-hanced R2-type FAC coupling to the EEJ in Harang region-south at dusk; (vi) the large spatial scales (LX and LY )of the CD/dipolarization process contributing to large in-ductive plasma sheet electric fields (∼ 2.5 mV m−1) and as-sociated momentum coupling to the polar cap ionosphere(1CPCP = (0.1–0.2)EPS·LY ; EPS= (1Bz/1t) ·LX), lead-ing to the observed PCN night enhancements in the initialphase (1PCN≈ 0.8EPS); and (vii) BBFs in the phase of ALpartial recovery with associated M–I coupling in two con-secutive stages: (1) plasma sheet–R1 FAC coupling to Ha-rang region-north (current wedgelets–auroral streamers) instage 1 (mid-tail) and (2) FAC coupling to Harang region-south (enhanced EEJ and intensified southern branch auroralprecipitation) in stage 2 (BBFs in braking phase).
Feature iii, involving dipolarizations related to activationsof the SCW (Bostrøm type I system), is observed from space-craft GOES-10 in the interval 05:00–12:00 UT (see Fig.10).We note that one of the activations of the Bostrøm type IIcurrent system at dawn is observed by GOES-10 (δBx <
0/δBy > 0 events) at the same time (14:10–14:20 UT) as an
www.ann-geophys.net/32/333/2014/ Ann. Geophys., 32, 333–351, 2014
348 P. E. Sandholt et al.: Repetitive substorm activity driven by interplanetary CMEs
impulsive ground signature of this type of current system(EEJ enhancement) is observed at dusk, in Harang region-south.
Feature vii, i.e., the presence of smaller-scale plasma sheetevents during the phase of AL partial recovery, is consis-tent with the results ofNakamura et al.(1999): “The fluxtransport in the midtail takes place as a large-scale phe-nomenon during the expansion phase but is a more local-ized and patchy phenomenon during the recovery phase for asubstorm with prolonged IMF input.” The BBFs in the brak-ing phase are expected to add to the partial ring current andcontribute to strengthening the R2 FAC and the ionosphericPedersen current closure in the ionosphere (and thereby en-hancing the EEJ) in Harang region-south, as we documentin our ground–satellite observations at dusk. The magneto-spheric part of this phenomenon has been predicted byYanget al.(2012) andBirn and Hesse(2013).
The partial recovery of SYM-H typically appearing afterthe plasma injection events (SYM-H dips–field dipolariza-tions) is explained in terms of a shielding effect (so-called“overshielding”) originating from the ionospheric closure ofR2 FAC at subauroral latitudes, i.e., an eastward-directedionospheric current at low and mid-latitudes driven by R2FACs (seeRitter and Lühr, 2008, their Fig. 15). This M–Icoupling leads to a reduction of the Volland–Stern electricfield (EVS) and thereby prohibits the deep plasma injectionto the ring current. It therefore contributes to a reduction ofthe PRC and the associated SYM-H partial recovery (δSYM-H / δt =−aEVS).
4 Summary
We reported ground–satellite conjunction studies of M–Icoupling across the auroral oval at dusk (17:00–18:00 MLT)and near midnight (20:00–03:00 MLT) during a long intervalof continued strong solar wind forcing by an interplanetaryCME passing Earth on 18 August 2003. This approach al-lowed us to document the evolution of the two-componentsubstorm current system referred to as the Bostrøm types I–IIsystem and the state of polar cap convection via the PCN in-dex. We emphasized the multistage evolution of substorm ac-tivity where the expansion phase consists of two distinct sub-stages. These are an initial transient phase and a later persis-tent phase which, according to our findings, are dominated byinductive and potential electric field coupling, respectively.The initial transient stage is characterized by (i) current dis-ruption (CD)/magnetic field dipolarization detected in thenear-Earth (geostationary altitude; GOES-10 data) plasmasheet with extension of magnetic perturbations to the taillobes (X = −11 to −18RE; Geotail and Cluster data notshown here), (ii) abrupt intensification-poleward expansionof the westward electrojet (WEJ) in the evening–midnightsector (Alaska sector magnetometer data) followed by (iii)abrupt intensification of the eastward electrojet (EEJ) at dusk
in Harang region-south, (iv) rapid westward expansion ofthe WEJ beyond the 18:00 MLT meridian (Harang region-north), as documented by IMAGE chain magnetograms(Svalbard–Scandinavia–Finland–Russia), and (v) a 10–20 min-long monotonic rise of the PCN index.
The subsequent persistent phase is characterized by (i) adouble-oval configuration with a series of WEJ activationsand auroral streamer activity with associated R1-type FACcoupling in Harang region-north (at dusk), (ii) EEJ activityand R2-type FAC coupling in Harang region-south (at dusk),(iii) a persistent high-level (plateau) or slowly decreasingPCN index, and (iv) bursty bulk flows (BBFs) in the mid-tailplasma sheet (Geotail data not shown). We make quantita-tive estimates of the contributions to the excitation of polarcap convection (PCN index) and the cross-polar-cap poten-tial (CPCP), from inductive electric fields in the initial tran-sient stage of the expansion phase. We find that inductiveelectric fields are important in association with these ma-jor substorm dipolarizations. This is due to a combination ofthe dipolarization rate (1Bz/1t) and the large spatial scalesof the dipolarization (current disruption) process as inferredfrom ground and satellite observations in our case. The per-sistent phase is dominated by strong potential electric fieldcoupling, most likely associated with the integrated effect ofVx ·Bz enhancement events (BBFs/dipolarization fronts) cre-ated by an active magnetotail reconnection process. When weemphasize the distinction between the initial transient phaseversus the persistent phase, we apply a terminology previ-ously used to describe M–I coupling in the dayside magne-tosphere which is triggered by north-to-south turnings of theIMF (Siscoe et al., 2011).
Acknowledgements.We thank Truls Lynne Hansen, Ari Viljanenand the Finnish Meteorological institute for operating the IM-AGE chain magnetometers in Svalbard–Scandinavia (http-address:www.geo.fmi.fi/image). The Poker Flat magnetometer (Fig. 11) isoperated by the Geophysical Institute, University of Alaska, Fair-banks. Work at University of Oslo is supported by the NorwegianResearch Council (NFR). Work at UNH is supported by NASAgrant NNX13AP39G.
Topical Editor L. Blomberg thanks A. Kullen and one anony-mous referee for their help in evaluating this paper.
References
Akasofu, S.-I.: The development of the auroral substorm, Planet.Space Sci., 12, 273–282, 1964.
Akasofu, S.-I.: The relationship between the magnetosphere andmagnetospheric/auroral substorms, Ann. Geophys., 31, 387–394,doi:10.5194/angeo-31-387-2013, 2013.
Andalsvik, Y. L., Sandholt, P. E., and Farrugia, C. J.: Dayside andnightside contributions to cross-polar cap potential variations:the 20 March 2001 ICME case, Ann. Geophys., 29, 2189–2201,doi:10.5194/angeo-29-2189-2011, 2011.
Ann. Geophys., 32, 333–351, 2014 www.ann-geophys.net/32/333/2014/

P. E. Sandholt et al.: Repetitive substorm activity driven by interplanetary CMEs 349
Andalsvik, Y., Sandholt, P. E., and Farrugia, C. J.: Substorms andpolar cap convection: the 10 January 2004 interplanetary CMEcase, Ann. Geophys., 30, 67–80, doi:10.5194/angeo-30-67-2012,2012.
Baumjohann, W., Paschmann, G., and Nagai, T.: Thinning and ex-pansion of the substorm plasma sheet, J. Geophys. Res., 97,17173–17175, 1992.
Baumjohann, W., Hesse, M., Kokubun, S., Nagai, T., andPetrukovich, A. A.: Substorm dipolarization and recovery, J.Geophys. Res., 104, 24995–25000, 1999.
Benkevich, L., Lyatsky, W., and Cogger, L. L.: Field-aligned cur-rents between conjugate hemispheres, J. Geophys. Res., 105,27727–27737, 2000.
Birn, J. and Hesse, M.: The substorm current wedge inMHD simulations, J. Geophys. Res., 118, 3364–3376,doi:10.1002/jgra.50187, 2013.
Bostrøm, R.: A model of the auroral electrojets, J. Geophys. Res.,69, 4983–4999, 1964.
Bostrøm, R.: Current systems in the magnetosphere and ionosphere,in: Radar Probing of the Auroral Plasma, edited by: Brekke, A.,257–284, Universitetsforlaget, Tromsø-Oslo-Bergen, 1977.
Brekke, A.: The relationship between the Harang discontinuity andthe substorm injection boundary, Planet. Space Sci., 25, 1119–1134, 1977.
Burke, W. J., Gentile, L. C., and Huang, C. Y.: Penetration electricfields driving main phase Dst, J. Geophys. Res., 112, A07206,doi:10.1029/2006JA012137, 2007.
Cai, X., Henderson, M. G., and Clauer, C. R.: A statistical studyof magnetic dipolarization for sawtooth events and isolated sub-storms at geosynchronous orbit with GOES data, Ann. Geophys.,24, 3481–3490, doi:10.5194/angeo-24-3481-2006, 2006.
Cao, J.-B., Yan, C., Dunlop, M., Reme, H., Dandouras, I., Zhang, T.,Yang, D., Moiseyev, A., Solovjev, S. I., Wang, Z. Q., Leonoviche,A., Zolotukhina, N., and Mishin, V.: Geomagnetic signatures ofcurrent wedge produced by fast flows in the plasma sheet, J. Geo-phys. Res., 115, A08205, doi:10.1029/2009JA014891, 2010.
Chen, C. X. and Wolf, R. A.: Interpretation of high-speed flows inthe plasma sheet, J. Geophys. Res., 98, 21409–21419, 1993.
Crooker, N. U., Toffoletto, F. R., and Gussenhoven, M. S.: Openingthe cusp, J. Geophys. Res., 96, 3497–3503, 1991.
Fairfield, D. H. and Scudder, J. D.: Polar rain: Solar coronal elec-trons in the Earth’s magnetosphere, J. Geophys. Res., 90, 4055–4068, 1985.
Fairfield, D. H., Mukai, T., Brittnacher, M., Reeves, G. D.,Kokubun, S., Parks, G. K., Nagai, T., Matsumoto, H., Hashimoto,K., Gurnett, D. A., and Yamamoto, T.: Earthward flow bursts inthe inner magnetotail and their relation to auroral brightenings,akr intensifications, and geosynchronous particle injections andmagnetic activity, J. Geophys. Res., 104, 355–370, 1999.
Farrugia, C. J., Freeman, M. P., Burlaga, L. F., Lepping, R. P., andTakahashi, K.: The Earth’s magnetosphere under continued forc-ing: Substorm activity during the passage of an interplanetarymagnetic cloud, J. Geophys. Res., 98, 7657–7671, 1993.
Frissell, N. A., Baker, J. B. H., Ruohoniemi, J. M., Clausen, L.B. N., Kale, Z. C., Rae, I. J., Kepko, L., Oksavik, K., Green-wald, R. A., and West, M. L.: First radar observations in thevicinity of the plasmapause of pulsed ionospheric flows gen-erated by bursty bulk flows, Geophys. Res. Lett., 38, L0113,doi:10.1029/2010GL045857, 2011.
Gao, Y., Kivelson, M. G., Walker, R. J., and Weygand,J. M.: Long-term variation of driven and unloading effectson polar cap dynamics, J. Geophys. Res., 117, A02203,doi:10.1029/2011JA017149, 2012.
Gjerloev, J. W. and Hoffman, R. A.: The convection electric field insubstorms, J. Geophys. Res., 106, 12919–12931, 2001.
Gordeev, E. I., Sergeev, V., Pulkkinen, T. I., and Palmroth, M.:Contribution of magnetotail reconnection to the cross-polarcap electric potential drop, J. Geophys. Res., 116, A08219,doi:10.1029/2011JA016609, 2011.
Haerendel, G.: Six auroral generators, J. Geophys. Res., 116,A00K05, doi:10.1029/2010JA016425, 2011.
Harang, L.: The mean field of disturbance of the polar earth-magnetic storm, Geofys. Publ., 16, 12–56, 1946.
Henderson, M. G., Reeves, G. D., and Murphree, J. S.: Are north-south aligned auroral structures an ionospheric manifestation ofbursty bulk flows?, Geophys. Res. Lett., 25, 3737–3740, 1998.
Henderson, M. G., Skoug, R., Donovan, E., Thomsen, M. F.,Reeves, G. D., Denton, M. H., Singer, H. J., McPherron, R. L.,Mende, S., Immel, T. J., Sigwarth, J. B., and Frank, L. A.: Sub-storms during the 10–11 August 2000 sawtooth event, J. Geo-phys. Res., 111, A06206, doi:10.1029/2005JA011366, 2006.
Heppner, J. and Maynard, N. C.: Empirical high-latitude electricfield models, J. Geophys. Res., 92, 4467–4489, 1987.
Heppner, J. P.: The harang discontinuity in auroral belt ionosphriccurrents, Geofys. Publ., 29, 105–120, 1972.
Jacquey, C. and Sauvaud, J. A.: Dynamics of the cross-tail currentduring a long period of enhanced energy input from the solarwind to the magnetosphere, in SUBSTORMS 1, ESA SP-335,155–163, Kiruna, Sweden, 1992.
Kan, J. R. and Lee, L. C.: Energy coupling function and solar wind-magnetosphere dynamo, Geophys. Res. Lett., 6, 577–580, 1979.
Kauristie, K., Syrjasuo, M. T., Amm, O., Viljanen, A., Pulkkinen,T. I., and Opgenorth, H.: A statistical study of evening sector arcsand electrodynamics, 28, 1605–1610, 2001.
Klimas, A. J., Valdivia, J. A., Vassiliadis, D., Baker, D. N., Hesse,M., and Takalo, J.: Self-organized criticality in the substorm phe-nomenon and its relation to localized reconnection in the mag-netospheric plasma sheet, J. Geophys. Res., 105, 18765–18780,2000.
Koskinen, H. and Pulkkinen, P.: Midnight velocity shear zone andthe concept of Harang discontinuity, J. Geophys. Res., 100,9539–9547, 1995.
Kullen, A., Ohtani, S., and Karlsson, T.: Geomagnetic signaturesof auroral substorms preceded by pseudobreakups, J. Geophys.Res., 114, A04201, doi:10.1029/2008JA013712, 2009.
Kullen, A., Karlsson, T., Cumnock, J. A., and Sundberg,T.: Occurrence and properties of substorms associatedwith pseudobreakups, J. Geophys. Res., 115, A12310,doi:10.1029/2010JA015866, 2010.
Lopez, R. E. and Freeman, J. W.: Solar wind proton temperature–velocity relationship, J. Geophys. Res., 91, 1701–1705, 1986.
Lyons, L. R., Nagai, T., Blanchard, G. T., Samson, J. C., Yamamoto,T., Mukai, T., Nishida, A., and Kokubun, S.: Association betweenGeotail plasma flows and auroral poleward boundary intensifi-cations observed by CANOPUS photometers, J. Geophys. Res.,104, 4485–4500, 1999.
www.ann-geophys.net/32/333/2014/ Ann. Geophys., 32, 333–351, 2014
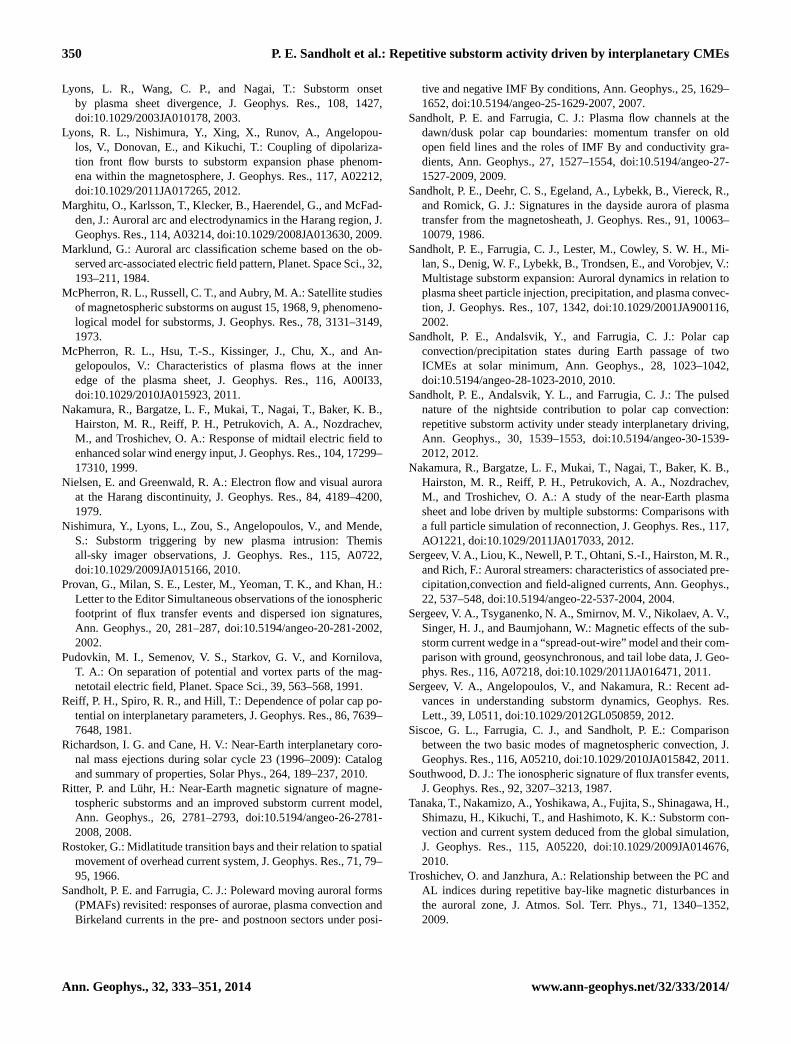
350 P. E. Sandholt et al.: Repetitive substorm activity driven by interplanetary CMEs
Lyons, L. R., Wang, C. P., and Nagai, T.: Substorm onsetby plasma sheet divergence, J. Geophys. Res., 108, 1427,doi:10.1029/2003JA010178, 2003.
Lyons, R. L., Nishimura, Y., Xing, X., Runov, A., Angelopou-los, V., Donovan, E., and Kikuchi, T.: Coupling of dipolariza-tion front flow bursts to substorm expansion phase phenom-ena within the magnetosphere, J. Geophys. Res., 117, A02212,doi:10.1029/2011JA017265, 2012.
Marghitu, O., Karlsson, T., Klecker, B., Haerendel, G., and McFad-den, J.: Auroral arc and electrodynamics in the Harang region, J.Geophys. Res., 114, A03214, doi:10.1029/2008JA013630, 2009.
Marklund, G.: Auroral arc classification scheme based on the ob-served arc-associated electric field pattern, Planet. Space Sci., 32,193–211, 1984.
McPherron, R. L., Russell, C. T., and Aubry, M. A.: Satellite studiesof magnetospheric substorms on august 15, 1968, 9, phenomeno-logical model for substorms, J. Geophys. Res., 78, 3131–3149,1973.
McPherron, R. L., Hsu, T.-S., Kissinger, J., Chu, X., and An-gelopoulos, V.: Characteristics of plasma flows at the inneredge of the plasma sheet, J. Geophys. Res., 116, A00I33,doi:10.1029/2010JA015923, 2011.
Nakamura, R., Bargatze, L. F., Mukai, T., Nagai, T., Baker, K. B.,Hairston, M. R., Reiff, P. H., Petrukovich, A. A., Nozdrachev,M., and Troshichev, O. A.: Response of midtail electric field toenhanced solar wind energy input, J. Geophys. Res., 104, 17299–17310, 1999.
Nielsen, E. and Greenwald, R. A.: Electron flow and visual auroraat the Harang discontinuity, J. Geophys. Res., 84, 4189–4200,1979.
Nishimura, Y., Lyons, L., Zou, S., Angelopoulos, V., and Mende,S.: Substorm triggering by new plasma intrusion: Themisall-sky imager observations, J. Geophys. Res., 115, A0722,doi:10.1029/2009JA015166, 2010.
Provan, G., Milan, S. E., Lester, M., Yeoman, T. K., and Khan, H.:Letter to the Editor Simultaneous observations of the ionosphericfootprint of flux transfer events and dispersed ion signatures,Ann. Geophys., 20, 281–287, doi:10.5194/angeo-20-281-2002,2002.
Pudovkin, M. I., Semenov, V. S., Starkov, G. V., and Kornilova,T. A.: On separation of potential and vortex parts of the mag-netotail electric field, Planet. Space Sci., 39, 563–568, 1991.
Reiff, P. H., Spiro, R. R., and Hill, T.: Dependence of polar cap po-tential on interplanetary parameters, J. Geophys. Res., 86, 7639–7648, 1981.
Richardson, I. G. and Cane, H. V.: Near-Earth interplanetary coro-nal mass ejections during solar cycle 23 (1996–2009): Catalogand summary of properties, Solar Phys., 264, 189–237, 2010.
Ritter, P. and Lühr, H.: Near-Earth magnetic signature of magne-tospheric substorms and an improved substorm current model,Ann. Geophys., 26, 2781–2793, doi:10.5194/angeo-26-2781-2008, 2008.
Rostoker, G.: Midlatitude transition bays and their relation to spatialmovement of overhead current system, J. Geophys. Res., 71, 79–95, 1966.
Sandholt, P. E. and Farrugia, C. J.: Poleward moving auroral forms(PMAFs) revisited: responses of aurorae, plasma convection andBirkeland currents in the pre- and postnoon sectors under posi-
tive and negative IMF By conditions, Ann. Geophys., 25, 1629–1652, doi:10.5194/angeo-25-1629-2007, 2007.
Sandholt, P. E. and Farrugia, C. J.: Plasma flow channels at thedawn/dusk polar cap boundaries: momentum transfer on oldopen field lines and the roles of IMF By and conductivity gra-dients, Ann. Geophys., 27, 1527–1554, doi:10.5194/angeo-27-1527-2009, 2009.
Sandholt, P. E., Deehr, C. S., Egeland, A., Lybekk, B., Viereck, R.,and Romick, G. J.: Signatures in the dayside aurora of plasmatransfer from the magnetosheath, J. Geophys. Res., 91, 10063–10079, 1986.
Sandholt, P. E., Farrugia, C. J., Lester, M., Cowley, S. W. H., Mi-lan, S., Denig, W. F., Lybekk, B., Trondsen, E., and Vorobjev, V.:Multistage substorm expansion: Auroral dynamics in relation toplasma sheet particle injection, precipitation, and plasma convec-tion, J. Geophys. Res., 107, 1342, doi:10.1029/2001JA900116,2002.
Sandholt, P. E., Andalsvik, Y., and Farrugia, C. J.: Polar capconvection/precipitation states during Earth passage of twoICMEs at solar minimum, Ann. Geophys., 28, 1023–1042,doi:10.5194/angeo-28-1023-2010, 2010.
Sandholt, P. E., Andalsvik, Y. L., and Farrugia, C. J.: The pulsednature of the nightside contribution to polar cap convection:repetitive substorm activity under steady interplanetary driving,Ann. Geophys., 30, 1539–1553, doi:10.5194/angeo-30-1539-2012, 2012.
Nakamura, R., Bargatze, L. F., Mukai, T., Nagai, T., Baker, K. B.,Hairston, M. R., Reiff, P. H., Petrukovich, A. A., Nozdrachev,M., and Troshichev, O. A.: A study of the near-Earth plasmasheet and lobe driven by multiple substorms: Comparisons witha full particle simulation of reconnection, J. Geophys. Res., 117,AO1221, doi:10.1029/2011JA017033, 2012.
Sergeev, V. A., Liou, K., Newell, P. T., Ohtani, S.-I., Hairston, M. R.,and Rich, F.: Auroral streamers: characteristics of associated pre-cipitation,convection and field-aligned currents, Ann. Geophys.,22, 537–548, doi:10.5194/angeo-22-537-2004, 2004.
Sergeev, V. A., Tsyganenko, N. A., Smirnov, M. V., Nikolaev, A. V.,Singer, H. J., and Baumjohann, W.: Magnetic effects of the sub-storm current wedge in a “spread-out-wire” model and their com-parison with ground, geosynchronous, and tail lobe data, J. Geo-phys. Res., 116, A07218, doi:10.1029/2011JA016471, 2011.
Sergeev, V. A., Angelopoulos, V., and Nakamura, R.: Recent ad-vances in understanding substorm dynamics, Geophys. Res.Lett., 39, L0511, doi:10.1029/2012GL050859, 2012.
Siscoe, G. L., Farrugia, C. J., and Sandholt, P. E.: Comparisonbetween the two basic modes of magnetospheric convection, J.Geophys. Res., 116, A05210, doi:10.1029/2010JA015842, 2011.
Southwood, D. J.: The ionospheric signature of flux transfer events,J. Geophys. Res., 92, 3207–3213, 1987.
Tanaka, T., Nakamizo, A., Yoshikawa, A., Fujita, S., Shinagawa, H.,Shimazu, H., Kikuchi, T., and Hashimoto, K. K.: Substorm con-vection and current system deduced from the global simulation,J. Geophys. Res., 115, A05220, doi:10.1029/2009JA014676,2010.
Troshichev, O. and Janzhura, A.: Relationship between the PC andAL indices during repetitive bay-like magnetic disturbances inthe auroral zone, J. Atmos. Sol. Terr. Phys., 71, 1340–1352,2009.
Ann. Geophys., 32, 333–351, 2014 www.ann-geophys.net/32/333/2014/
P. E. Sandholt et al.: Repetitive substorm activity driven by interplanetary CMEs 351
Troshichev, O., Stauning, P., Liou, K., and Reeves, G.: Saw-toothsubstorms: Inconsistency of repetitive bay-like magnetic distur-bances with behaviour of aurora, 47, 702–709, 2011.
Troshichev, O. A., Lukianova, R. Y., Papitashvili, V. O., Rich, F. J.,and Rasmussen, O.: Polar cap index (PC) as a proxy for iono-spheric electric field in the near-pole region, Geophys. Res. Lett.,27, 3809–3812, doi:10.1029/2000GL003756, 2000.
Vorobjev, V. G., Yagodkina, O. I., and Katkalov, Y. V.: Auroral Pre-cipitation Model and its application to ionospheric and magneto-spheric studies, J. Atmos. Sol.-Terr. Phys., 102, 157–171, 2013.
Weygand, J. M., McPherron, R. L., Frey, H. U., Amm, O., Kau-ristie, K., Viljanen, A., and Koskinen, H.: Relation of substormonset to Harang discontinuity, J. Geophys. Res., 113, A04213,doi:10.1029/2007JA012537, 2008.
Yagodkina, O. I., Despirak, I. V., and Vorobjev, V. G.: Spatial distri-bution of auroral precipitation during storms caused by magneticclouds, J. Atmos. Sol.-Terr. Phys., 77, 1–18, 2012.
Yang, J., Toffoletto, F. R., Wolf, R. A., Sazykin, S., Ontiveros, P. A.,and Weygand, J. M.: Large-scale current systems and groundmagnetic disturbance during deep substorm injections, J. Geo-phys. Res., 117, A04223, doi:10.1029/2011JA017415, 2012.
Yau, Z. H., Angelopoulos, V., Pu, Z. Y., Fu, S. Y., Kubyshkina, M.,Liu, J., Chu, X. N., Nishimura, T., Cao, X., Du, A. M., Shi, Q.Q., and Wei, Y.: Conjugate observations of flow diversion in themagnetotail and auroral arc extension in the ionosphere, J. Geo-phys. Res., 118, 4811–4816, doi:10.1002/jgra.50419, 2013.
Zou, S., Lyons, L. R., Wang, C.-P., Boudouridis, A., Ruo-honiemi, J. M., Anderson, P. C., Dyson, P. L., and Devlin,J. C.: On the coupling between the Harang reversal evolutionand substorm dynamics: A synthesis of SuperDARN, DMSP,and IMAGE observations, J. Geophys. Res., 114, A01205,doi:10.1029/2008JA013449, 2009.
www.ann-geophys.net/32/333/2014/ Ann. Geophys., 32, 333–351, 2014