mia: mutual information analyzer, a graphic user interface
TRANSCRIPT

Lichtenstein et al. BMC Bioinformatics (2015) 16:409 DOI 10.1186/s12859-015-0837-0
SOFTWARE Open Access
MIA: Mutual Information Analyzer, agraphic user interface program thatcalculates entropy, vertical and horizontalmutual information of molecular sequencesets
Flavio Lichtenstein1,3* , Fernando Antoneli Jr1,3 and Marcelo R. S. Briones2,3Abstract
Background: Short and long range correlations in biological sequences are central in genomic studies ofcovariation. These correlations can be studied using mutual information because it measures the amount ofinformation one random variable contains about the other. Here we present MIA (Mutual Information Analyzer) auser friendly graphic interface pipeline that calculates spectra of vertical entropy (VH), vertical mutual information(VMI) and horizontal mutual information (HMI), since currently there is no user friendly integrated platform that in asingle package perform all these calculations. MIA also calculates Jensen-Shannon Divergence (JSD) between pair ofdifferent species spectra, herein called informational distances. Thus, the resulting distance matrices can bepresented by distance histograms and informational dendrograms, giving support to discrimination of closelyrelated species.
Results: In order to test MIA we analyzed sequences from Drosophila Adh locus, because the taxonomy andevolutionary patterns of different Drosophila species are well established and the gene Adh is extensively studied.The search retrieved 959 sequences of 291 species. From the total, 450 sequences of 17 species were selected. Withthis dataset MIA performed all tasks in less than three hours: gathering, storing and aligning fasta files; calculatingVH, VMI and HMI spectra; and calculating JSD between pair of different species spectra. For each task MIA savedtables and graphics in the local disk, easily accessible for future analysis.
Conclusions: Our tests revealed that the “informational model free” spectra may represent species signatures. SinceJSD applied to Horizontal Mutual Information spectra resulted in statistically significant distances between species,we could calculate respective hierarchical clusters, herein called Informational Dendrograms (ID). When comparedto phylogenetic trees all Informational Dendrograms presented similar taxonomy and species clusterization.
Keywords: Software, Information theory, Entropy, Mutual information, DNA sequences, Species
* Correspondence: [email protected] de Informática em Saúde, Escola Paulista de Medicina,Universidade Federal de Sao Paulo, Rua Botucatu, 862, Ed. José Leal Prado,andar térreo, Vila Clementino, CEP 04023-062 Sao Paulo, SP, Brazil3Laboratory of Evolutionary Genomics and Biocomplexity, Escola Paulista deMedicina, Universidade Federal de São Paulo, Rua Pedro de Toledo, 669, 4andar L4E, CEP 04039-032 São Paulo, SP, BrazilFull list of author information is available at the end of the article
© 2015 Lichtenstein et al. Open Access This article is distributed under the terms of the Creative Commons Attribution 4.0International License (http://creativecommons.org/licenses/by/4.0/), which permits unrestricted use, distribution, andreproduction in any medium, provided you give appropriate credit to the original author(s) and the source, provide a link tothe Creative Commons license, and indicate if changes were made. The Creative Commons Public Domain Dedication waiver(http://creativecommons.org/publicdomain/zero/1.0/) applies to the data made available in this article, unless otherwise stated.

Lichtenstein et al. BMC Bioinformatics (2015) 16:409 Page 2 of 19
BackgroundGenic and intergenic regions in chromosomes have sta-tistically distinct properties. Most intergenic regions be-have randomly in regard to nucleotide mutations,besides some special regions like transcription regulatorysites and transposons. On the other hand, most of thegenes are highly conserved, especially in regions likepromoters, TATA box, exons, splice junctions etc. But,even these conserved regions, and others such as in-trons, can present many polymorphic single regions aswell as two separated regions that present orchestratedmutations in a way as to try to conserve or improve de-termined phenotype [1–4]. Hereupon, the main goal ofthis work is to provide methods and tools in order todiscriminate closely related species using informationalspectrum distances. Here we searched for polymorphicregions seeking out covariation signals by using DNA se-quences from Drosophila Adh locus. With these se-quences we calculated entropy and mutual informationalspectra from different closely related species sequences.Thereafter, via Jensen-Shannon Divergence, we calcu-lated distances between these spectra resulting in dis-tance matrices capable of inferring the possibility ofspecies discrimination.Furthermore, in microorganisms the species definition
is coarse. Attempts to measure sequence diversity by in-formational entropy and speciation have been proposedin Protista [5, 6]. However, these studies suggest that be-sides information entropy, mutual information couldprovide a means to access covariation, a central problemin diversifying molecules and species.Thus, herein we present a computational pipeline
called MIA (Mutual Information Analyzer) developed inPython [7] and BioPython [8]. MIA modules can be seenin Fig. 1, and it is capable of retrieving DNA sequences,and of calculating Entropy and Mutual Informationspectra applying a statistical framework that allows infer-ences. This pipeline was developed due to the inexis-tence of an application able to calculate and displayvertical Shannon entropy (VH), vertical mutual infor-mation (VMI), horizontal mutual information (HMI),and Jensen-Shannon Divergence (JSD) between pairsof different species spectra, herein called informa-tional distances.Entropy and Mutual Information theory can be found
in [9, 10], and a nice review in [11]. Many applications[12–14] are capable of calculating biological sequenceparameters, but only BioEdit [15] calculates mutual in-formation and vertical entropy. There are also some the-oretical studies like in Grosse et al. [1] focused onhorizontal mutual information of DNA sequences, andother studies of co-evolution of proteins [3, 4, 16, 17]based on vertical mutual information. However noneof these studies and applications has algorithms to
calculate and display VH, VMI and HMI distributionsand their informational distances.Therefore, we began the development of MIA guided
by the questions: Given some sequences, grouped inrecognizable sets (species), are molecular data capable ofdiscriminating theses sets using methods of informationtheory? Can we present statistical calculations that con-firm or deny the results? Given a set of sequences withconserved and polymorphic residues and differentlengths, how to deal with many possible alignments andtheir gaps?In order to address these problems we demonstrated
that Entropy and Mutual Information are good methodsto deal with this complex problem, but caveats andwarnings still remain: a) multiple sequence alignment(MSA) gives rise to many possible alignments hereindenoted “mincut” for the minimum length alignmentand “maxmer” for the maximum; b) gaps should bereplaced by vertical consensus residues, differentlyfrom Weil et al. [4] who replaced them with a newcharacter (a 21th amino acid) for their protein study,otherwise covariation between two residues will giverise to new states containing a strange fifth nucleo-tide; c) short strings present deviation called bias,thus we applied a bias correction for entropy, mutualinformation and respective standard errors as definedin Roulston [18] and also demonstrated by Steueret al. in [11]; finally d) mutual information can becalculated residue by residue (1 x 1 positions) or 2 by2 residues, or n by n residues - this parameter wewill call NOL (number of letters of a word) andherein NOL will be equal to one (see Fig. 4b).
ImplementationMIA has the following algorithms: A1) NCBI: gathersdata at NCBI and stores them in gbk file format; A2)gbk to fasta: analyzes gbk file and organizes sequences infasta files per species; A3) Alignment: aligns sequenceswith Muscle [19] and in the end creates two fasta files:“mincut” cutting out columns and sequences with largegaps and “maxmer” maintaining maximum number ofgaps; A4) Purging: replaces ambiguous nucleotides viaIUPAC nucleotide ambiguity table, and eliminates se-quences with undesirable words in their names like “syn-thetic”; A5) Consensus: replaces gaps by their verticalconsensus nucleotide; A6) VMI: calculates and storesVertical Entropy (VH) and Vertical Mutual Information(VMI) spectra, and displays respective histograms andheat maps; A7) HMI: calculates and stores HorizontalMutual Information (HMI) spectra, and displays histo-grams; A8) JSD: calculates Jensen-Shannon Divergencefrom pair of normalized spectra, storing distances andtheir SE in distance matrix files, and displays distancehistograms; A9) HC: calculates hierarchical clusters and

Fig. 1 MIA Pipeline: all algorithms (modules) can be seen from A1 to A5 retrieving, preparing and storing sequences; A6 to A7 informationalspectra calculation; A8 informational distances calculation and A9 informational dendrograma calculation
Lichtenstein et al. BMC Bioinformatics (2015) 16:409 Page 3 of 19
presents them as dendrograms, herein called informa-tional dendrograms; A10) Entropy: simulates Shannonentropy.Before gathering sequences it is important to analyze
available Drosophila species data. There are some sitesspecialized in Drosophila data. They present sequencebrowsers, protein sequences, genes sequences and manyparameters for molecular data. Three of these sites are:DPDB [20], Flybase [21] and BDGP [22].In the first algorithm MIA is capable of searching for
an organism, a gene or a word in the NCBI GBK. Herewe searched for organism/genus “Drosophila” and thegene “Adh” (alcohol dehydrogenase). The resultingsearch retrieved 959 sequences of 291 species. From thetotal, 450 sequences of 17 species were selected (datagathered in March 2015). We did this task imposing aninferior limit called “number of sequence cutoff” in sucha way that if this cutoff is high MIA finds a set withfewer species (there are not many genera/genes witha lot of sequences in NCBI). Otherwise, if the cutoffis low, the set will have a larger number of species,some of which with a low number of sequences. Theconsequence is that when calculating entropy andmutual information, a species with many sequencesprovides a lower standard error, while a species withfewer sequences provides a higher standard error.Therefore, in the Drosophila/Adh case we set thecutoff equal to 7 resulting in 17 species and 450sequences.
After gathering sequences, the next step was the align-ment algorithm - MIA uses Muscle for this task - andthereafter starts deleting columns and sequences “withmany gaps” (which gives rise to the question – whatis the “correct percentage of maximum gaps”?)replacing them by consensual vertical residues. How-ever, deletions and replacements alter the informa-tional distribution profiles. The human decision to setthe percentage of possible gaps creates “mincut” and“maxmer” alignment sequences and their informa-tional difference can be analyzed comparing distancematrices. Answering the question posed, “there is nocorrect choice” to how to deal with controlling gapdeletions; only empirical tests and their results arelikely ways to solve this problem in each genus/genecase.With the aligned sequences MIA computes vertical
entropy like did Adami in [9]. Thereafter MIA calculatesmutual information in the horizontal direction as inGrosse et al. [1, 2, 23, 24], and in the vertical directionas in Martin et al. [16] and Hamacher et al. [3, 4]. Allthese methods are well explained in the Methods sectionthat follows.VH, HMI and VMI are calculated with and with-
out bias correction; therefore the gain or loss of in-formation for “mincut” versus “maxmer” with orwithout bias correction can be compared. Informa-tional distances between different informational spec-tra are calculated via JSD method. Since JSD is not a

Lichtenstein et al. BMC Bioinformatics (2015) 16:409 Page 4 of 19
linear function, standard errors are calculated by em-pirical propagation giving rise to distance matriceswith SE.ANOVA test was performed on each set of spectra for
each method (VH, VMI, and HMI), in order to assesswhether at least one spectrum was statistically differentfrom the others (see Additional file 1: drosophila “sum-mary” tab). Otherwise, all distributions would be statisti-cally similar and we could not discriminate species. Ascan be noticed, this was only a first test to verify whetherwe could move forward.All informational spectra were compared to spectra
of shuffled and random sequences in order to analyzeif they are statistically distinct. Spectra of shuffled se-quence were generated using original sequences andshuffling the residues. Spectra of random sequencewere created drawing nucleotides randomly, up to thesame length as the original sequences. The firstmethod preserves nucleotide contents and the latteris fully random tending to 25 % of representation toeach nucleotide. In this study we will present onlyspectra of shuffled sequences and omit the randomones, since they presented similar results. Notwith-standing, MIA calculates and presents spectra forboth methods.
MethodsShannon Entropy was defined in 1948 [25] as weightedaverage of the log of state probabilities,
H ¼ −Xkm¼1
pm � logb pm
Equation 1 – Shannon entropy.In Equation 1 H is the Shannon Entropy, pm is the
probability of the existence of a state m in k possiblestates, and b is the base of the logarithm. If b is equal to2 the entropic unit is defined as a “bit”, but if b is “e”(Neper’s number) the entropic unit is defined as “nat”,entropy derived from natural log. In this paper we willwork only with “nat”.Shannon Entropy of DNA sequences can be mea-
sured aligning sequences and calculating the relativefrequency of encountering each nucleotide at deter-mined residue (site). In this particular case only 4possible states are found, Ω = {A, C, G, T}. Maximumentropy is defined as 1 MER [9], and it is achievedonly when all states are equiprobable (p = 0.25). In thiscase Hmax
DNA = − ∑i = 14 pi log2 pi = − 4 (1/4 log21/4) = 2
bit or 1.386 nat. However, if one of the states has fre-quency equal to 1 (100 %), and the others are 0, theresulting entropy is H = 0 because log 1 = 0 and thisresidue is said to be conserved.
We shall call Vertical Entropy (VH) the way of calcu-lating entropy counting nucleotide frequencies in thevertical orientation, that means, is a measure of howpolymorphic any residue is after aligning sequences fordetermined species.In Fig. 2, we present an oversimplified alignment for 8
sequences: a) S1, S2 to S8 are 8 aligned sequences, i= {1,2,3,4} are nucleotide positions (or residues), eachcell represents a nucleotide for a given sequence at agiven position i; b) is the nucleotide frequency distribu-tion per site for each residue; c) is the relative nucleotidefrequency distribution per site; d) is the vertical entropicspectrum; e) are the values for each nucleotide entropiccontribution and at the bottom is the vertical total en-tropy of each residue.Thus, given the position i = 1, we realize that all nucle-
otides are “A”. For i = 2 we realize that 50 % of nucleo-tides are “A” and 50 % are “G”. As previously discussed,the first position has H = 0 nat and the residue is con-served, the second position has H = .693 nat and theresidue is polymorphic. For i = 3, see the red arrow, werealize that this position is more polymorphic than theprevious (see Fig. 2d) but less polymorphic than i = 4that has H[4] = Hmax = 1 MER.Mutual Information (MI) represents the covariation
between two random variables, here denoted X and Y[10, 11, 24]. Mutual Information (Equation 2) is de-fined by the sum of two entropies, in position i and j,minus the joint entropy H(i,j). As shown in the nexttwo sections, MI can be applied in the Vertical direc-tion of aligned sequences or in the Horizontal direc-tion for one single or many sequences, aligned ornot. Both calculations measure the nucleotide variabil-ity in two positions. The first position i is representedby the random variable X, and the second position jis represented by the random variable Y. Therefore,MI(X,Y) can be defined as,
MI i; jð Þ ¼ H ið Þ þH jð Þ −H i; jð Þ
Equation 2 – Mutual Information between two posi-tions (i, j).Another parameter for MI calculation is the size of
the word, whose width is defined as number of letters(NOL). Therefore, we can analyze co-variation be-tween regions with width greater than 1. However, inthis study we will calculate MI only for NOL = 1 (seeFig. 4b).In order to calculate the Vertical Mutual Information
(VMI), see Fig. 3, we need first to estimate the nucleo-tide frequencies for position i and j, covering all residuepairs. Since, MI(X,Y) is a symmetric function, in otherwords, MI(X,Y) =MI(Y,X), and MI is zero if X cov-aries independently of Y, covering (i,j) in such a way

Fig. 3 VMI calculation – the blue and red arrows point to a particular pair (X,Y), but all possible pairs are calculated: a) S1, S2 … to S8 are alignedsequences versus DNA positions (residues); b) nucleotide relative frequency distribution for all pairs of nucleotides; c) vertical entropy of eachresidue and at the bottom the vertical entropy per residue; d) mutual information calculation for pair of residues; and e) on the left is the VMIbidimensional spectrum represented as a heat map, and on the right side we see the color scale
Fig. 2 VH calculation: here we see an oversimplified DNA sequence alignment. The red arrow points to the residue (site) 3, but all residues arecalculated: a) S1,S2… to S8 are aligned sequences versus DNA positions (residues); b) nucleotide frequency distribution per residue; c) nucleotiderelative frequency distribution per residue; d) vertical entropic spectrum; e) entropy per residue; and f) calculation of entropy for residue 3 or H[3]
Lichtenstein et al. BMC Bioinformatics (2015) 16:409 Page 5 of 19

Lichtenstein et al. BMC Bioinformatics (2015) 16:409 Page 6 of 19
that i = {1, L-1} and j = (i + 1, L), for j > i. VMI canalso be expressed by,
VMI i; jð Þ ¼X
m;n ∈ A;C;G;Tf gpmn i; jð Þ log pmn i; jð Þ
pm ið Þpn jð Þ
Equation 3 – Vertical Mutual Information.In Equation 3 m and n are nucleotide states = {A,C,G,T}.
Since we are talking about a bidimensional relationship,the resulting spectrum is represented by a heat map.In Fig. 3, we present an oversimplified example of
aligned sequence with the intention of explaining how tocalculate VMI. The blue and red arrows point to a par-ticular pair (X,Y), but all possible pairs are calculatedwhere: a) S1, S2 … to S8 are 8 aligned sequences and ior j = {1,2,3,4} are nucleotide positions (or residues); b) isthe nucleotide relative frequency distribution for all pairsof nucleotides; c) is the vertical entropy for each residueand at the bottom the vertical entropy per residue; d) isthe mutual information calculation for pair of residues;and e) on the left is the VMI bidimensional spectrumrepresented as a heat map, on the right side is the colorscale.Horizontal Mutual Information (HMI) has a different
concept and method of calculation when compared toVMI. HMI is defined as a measure of auto-covariationbetween two positions distant k units one from theother. Here k varies from 3 to L/2 (where L is the se-quence length) with step equal to 1 in the 5′ to 3′ direc-tion. The step is one, because we intend to calculate allresidue to residue co-variations in the gene. In otherwords, transcription and translation rules are not neces-sary in our study.For each value of k all sequence is covered counting
all possible pair of nucleotides (m,n) Є{AA, AC, …TT}. Here, pmn represents the probability to find apair (m,n), where m and n Є {A,C,G,T}. HMI(k) isgiven by Equation 4, and pm (k) and pn (k) are mar-ginal probabilities given by Equation 5 and Equation6, respectively.
HMI kð Þ ¼X
m¼ A;G;T;Cf gX
n¼ A;G;T;Cf gpmn kð Þ � logpmn kð Þ
pm kð Þpn kð Þ
Equation 4 – HMI equation for DNA sequences.The marginal probabilities (pm(k)e pn(k)) can be
calculated as,
pm kð Þ ¼X
n¼ A;C;G;Tf gpmn kð Þ
Equation 5 – Marginal probability of nucleotide m ispm (k)and
pn kð Þ ¼X
m¼ A;C;G;Tf gpmn kð Þ
Equation 6 – Marginal probability of nucleotide n ispn (k).In Fig. 4, we present an oversimplified example of
aligned sequence with the intention of explaining how tocalculate HMI. In this example we see: a) k = 3 and thecursor covering the sequence from the left to the rightfinding = {AA, AA,GG…}; b) in this study NOL = 1, butNOL can be any other integer greater than 1; c) the mar-ginal probabilities for X; d) the marginal probabilities forY; e) the joint frequencies and relative joint frequenciesfor each found pair; f ) HMI spectrum; and g) calculationof HMI for this particular case.With all calculated spectra we used Jensen-Shannon
Divergence (JSD) method to calculate the distancesbetween all pairs of different informational speciesspectra, for VH, VMI and HMI. Since JSD needs twodistributions to calculate a distance, we had tonormalize the spectra and then apply them to thismethod. Therefore, we can calculate JSD to VH, VMIand HMI in order to calculate all distances betweenpairs of different species,
JSDðP Qk Þ ¼ HPþQ
2
� �−12
H Pð Þ þH Qð Þð Þ
Equation 7 – Jensen-Shannon Divergence (JSD).Where P and Q are normalized spectra for differ-
ent species. Equation 7 is the JSD equation, but thesquare root of JSD is indeed the distance betweentwo distributions [26]. A distance equal to zeromeans that we cannot discriminate two distributions.A short distance means that both distributions areclose and perhaps statistically impossible to discrim-inate depending on SE. Large distances means thatspecies spectra are far allowing their discrimination,but also dependent on the SE. Thus, it can be in-ferred that JSD discriminates species with 95 % ofprobability if most of the distances do not fall in theconfidence intervals (CI) of all the others – whereCI ~ distance ± 2*SE.
ResultsWe tested our algorithms searching in NCBI, atnucleotide database, for Organism = “Drosophila” andGene = “Adh” (Alcohol Dehydrogenase) resulting in 959sequences of 291 species. Only species with 7 or moresequences available were accepted to minimize the verti-cal entropy and mutual information standard errors. The

Fig. 4 HMI calculation – a) k represents the distance between two residues ranging from 3 to L/2; b) is the number of letters, here NOL = 1; c) isthe table of marginal frequencies of X for k = 3; d) is the table of marginal frequencies of Y for k = 3; e) is the table of frequencies for found pairs(X,Y); f) is the HMI spectrum; and g) is HMI calculation for k = 3
Lichtenstein et al. BMC Bioinformatics (2015) 16:409 Page 7 of 19
final result was 450 sequences and 17 species, withlengths between 405 and 2204 bp. After going throughthe first two modules we encountered the Alignmentmodule having 3 parameters which were designed tocontrol column and line (sequences) gap deletions. Thefirst parameter “Maximum Vertical Gaps1” (set to 10 %)allows gaps up to this percentage and transforms thedata in minimum length sequences, or “mincut”. A max-imum length sequence is obtained with the parameter“Maximum Vertical Gaps2” (set to 40 %) which allowsmore gaps, and whose resulting sequences are called“maxmer”. The third parameter “Maximum HorizontalGaps” (set to 40 %) cuts out all sequences presentingmore than 40 % of horizontal gaps. The resulting alignedsequences can be seen calling an external program calledSeaview [12].All aligned sequences resulted in “mincut” length
equal to 588 bp and “maxmer” length equal to 859 bp.
After this procedure, sequences were purged/filtered andnot “ACGT” nucleotides replaced with their consensusvia IUPAC [27] ambiguous table. Finally, consensusalgorithm substitutes all gaps by the vertical consensusnucleotide.VH, HMI and VMI were calculated for “mincut” and
“maxmer” with and without bias correction. The final re-sults presented twelve distance matrices, twelve distancehistograms and twelve hierarchical cluster dendrograms(2 for mincut/maxmer × 2 for with/without bias cor-rection × 3 informational methods). In order to per-form these informational calculations we used NOLequal to 1.According to the phylogeny proposed by van der
Linde et al. [28] the subfamily Drosophilinae (sub-genus Sophophora and subgenus Drosophila) showsthat D. paulistorum is close to D. willistoni and D.kikkawai is fairly close to D. melanogaster. The first

Fig. 5 Vertical Entropy: four Vertical Entropy (in mnat) for maxmer sequences with bias correction, data from: a) D. paulistorum, b) D. willistoni;c) D. kikkawai; and d) D. melanogaster. On the left side, from each species frame, we see the entropic spectrum, vertical red lines are the SE(Hi),where ‘i’ is the nucleotide position; the horizontal red line is 2 SD and the horizontal black line is the mean. On the right side we see thefrequency distribution; in black is the mean, in red is 1 SD and in yellow is the median. Data are explained in text
Fig. 6 Vertical Entropy from shuffled sequences: “mincut” sequences (in mnat). On the left side we see the spectrum, in orange the SE and inblue the signal. On the right side we see the frequency distribution; in black is the mean, in yellow is the median and in red is 1 standarddeviation. The “random” profile can be observed, very different from the D. kikkawai’s VH spectrum
Lichtenstein et al. BMC Bioinformatics (2015) 16:409 Page 8 of 19

Fig. 7 Vertical MI heat maps: four Vertical MI heat maps (in mnat) for maxmer sequences with bias correction from: a) D. paulistorum, b) D.willistoni, c) D. kikkawai, and d) D. melanogaster. Each heat map has a different profile and different maximum; data are explained in the text. Theobservation of peaks is possible by zooming the figure
Lichtenstein et al. BMC Bioinformatics (2015) 16:409 Page 9 of 19

Lichtenstein et al. BMC Bioinformatics (2015) 16:409 Page 10 of 19
two are further away from the last two, and this wasthe choice to present our data in the following sec-tions. Therefore, we will focus on these four species,only to summarize the explanations.
Vertical entropy and mutual informationVH and VMI were computed for each of the two posi-tions (i,j) as in [4] and also explained in methods. VHspectrum can be seen in Fig. 5 and VMI spectrum – aheat map - in Fig. 7. Both, VH spectra and VMI heatmaps can be visually discriminated. In order to assesswhether at least one distribution is statistically differentfrom the others, ANOVA test was performed and re-sulted in p-values near zero (for all maxmer/mincutversus with/without bias correction distributions).Therefore, there is at least one spectrum statisticallydifferent from all other spectra, and VH and VMImethods may be able to discriminate sets of molecu-lar sequences.Observing Vertical Entropy spectra (VH), in Fig. 5, the
reader can visually discriminate the 4 frames with differ-ent profiles and frequency distributions. The data camefrom “maxmer” sequences with length equal to 859 bp,NOL = 1 and bias correction. Since the Adh locus ishighly conserved (many residues with entropy equal tozero), the mean entropic value is very low and the stand-ard error is large. On the left side of each frame we seethe vertical red lines are SE(H(i)), where ‘i’ is the nucleo-tide position and SE(H) is the entropic standard errorcalculated from the polymorphism in this position overn sequences (species studies usually have different num-ber of sequences). The horizontal red line stands for 2standard deviations of the distribution and the black linefor its mean. On the right side we see the frequencydistribution graphic with 4 vertical lines: in black isthe mean, in red is 1 standard deviation, in yellow isthe median of the VH spectrum. Summarizing the
Fig. 8 Vertical MI from shuffled sequences: VMI heat map in mnat for D. ki23 sequence residues with maximum VMI = 841mnat. On the right side weyellow is the median = 122 mnat and in red is the standard deviation = 106profile can be observed, very different from the D. kikkawai’s VMI
four species: a) D. paulistorum has 12 sequences,mean(VH) = 37.7 (SD = 150.8) and median = 0 mnat;b) D. willistoni has 19 sequences, mean(VH) = 14.9(SD = 70.8) and median = 0 mnat; c) D. kikkawai has23 sequences, mean(VH) = 26.6 (SD =113.5) and me-dian = 0 mnat; d) D. melanogaster has 30 sequences,mean(VH) = 96.7 (SD = 151.3) and median = 0 mnat.Spectra of shuffled sequences simulated from original
data can be seen in Fig. 6, having mean near 1 MER(maximum entropy), which produces a completely dif-ferent spectrum when compared to the real data.Observing Vertical Mutual Information (VMI)
spectrum, in Fig. 7, the reader can visually discriminatefour heat maps with different patterns, different loca-tions of peaks and different maximum values (zoom theimage). All data came from “maxmer” sequences withlength equal to 859 bp, NOL = 1 and bias correction:Summarizing the four species: a) D. paulistorum has 12sequences, max(VMI) = 734.8 (SE = 104.6) mnat at a dis-creet point in the heat map (112 × 138 bp); b) D. willis-toni has 19 sequences, max(VMI) = 541.0 (SE = 115.2)mnat at a discreet point in the heat map (712 × 754 bp);c) D. kikkawai has 23 sequences, max(VMI) = 713.9(SE = 51.6) mnat close to a region with a bumpy pro-file localized at 89 × 117 bp; and d) D. melanogasterhas 30 sequences, max(VMI) = 835.1 (SE = 120.5) mnatin a highly bumpy profile with maximum value at637 × 712 bp.Spectra of shuffled sequences simulated from original
data can be seen in Fig. 8, having mean = 136 mnat, alarge SD = 106 mnat and median = 122 mnat, a com-pletely different spectrum when compared to the realdata. Here all mutual information is lost.
Horizontal mutual informationHMI was computed as in [1] and also explained inmethods. All 17 Horizontal MI spectra cannot be
kkawai. On the left side we see the heat map for shuffled each of thesee the frequency distribution, in black is the mean = 136 mnat, inmnat. We concluded that all mutual information is lost. The “random”
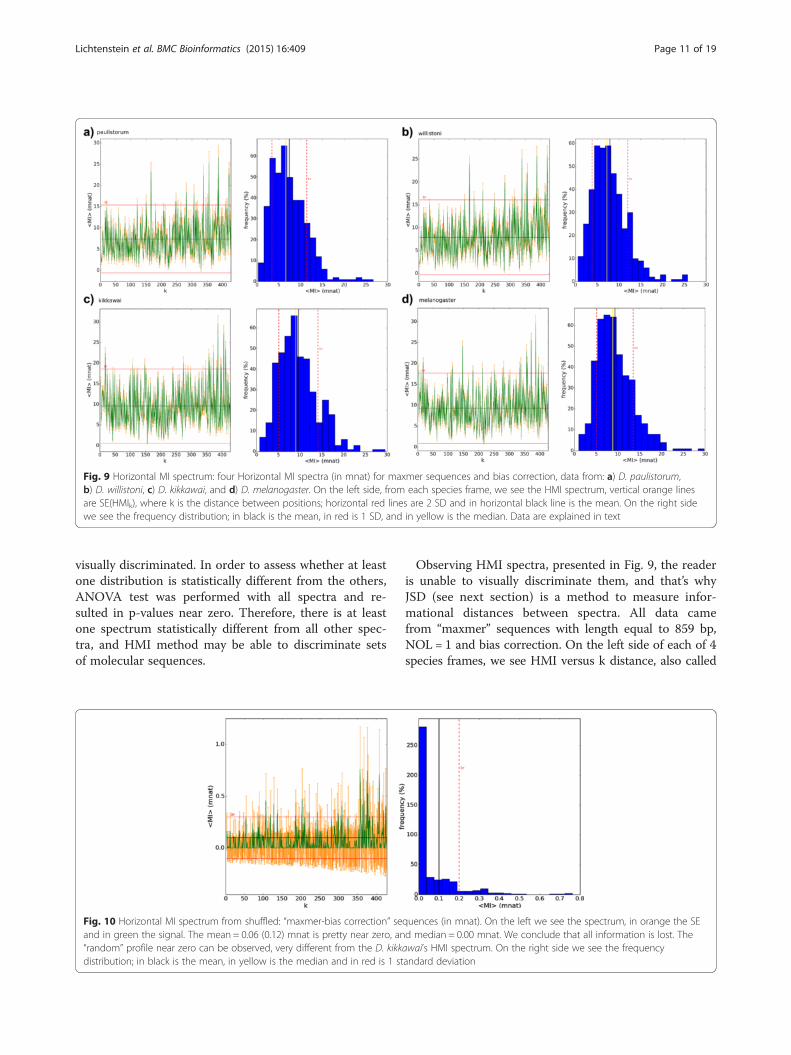
Fig. 9 Horizontal MI spectrum: four Horizontal MI spectra (in mnat) for maxmer sequences and bias correction, data from: a) D. paulistorum,b) D. willistoni, c) D. kikkawai, and d) D. melanogaster. On the left side, from each species frame, we see the HMI spectrum, vertical orange linesare SE(HMIk), where k is the distance between positions; horizontal red lines are 2 SD and in horizontal black line is the mean. On the right sidewe see the frequency distribution; in black is the mean, in red is 1 SD, and in yellow is the median. Data are explained in text
Lichtenstein et al. BMC Bioinformatics (2015) 16:409 Page 11 of 19
visually discriminated. In order to assess whether at leastone distribution is statistically different from the others,ANOVA test was performed with all spectra and re-sulted in p-values near zero. Therefore, there is at leastone spectrum statistically different from all other spec-tra, and HMI method may be able to discriminate setsof molecular sequences.
Fig. 10 Horizontal MI spectrum from shuffled: “maxmer-bias correction” seand in green the signal. The mean = 0.06 (0.12) mnat is pretty near zero, an“random” profile near zero can be observed, very different from the D. kikkdistribution; in black is the mean, in yellow is the median and in red is 1 st
Observing HMI spectra, presented in Fig. 9, the readeris unable to visually discriminate them, and that’s whyJSD (see next section) is a method to measure infor-mational distances between spectra. All data camefrom “maxmer” sequences with length equal to 859 bp,NOL = 1 and bias correction. On the left side of each of 4species frames, we see HMI versus k distance, also called
quences (in mnat). On the left we see the spectrum, in orange the SEd median = 0.00 mnat. We conclude that all information is lost. Theawai’s HMI spectrum. On the right side we see the frequencyandard deviation

Lichtenstein et al. BMC Bioinformatics (2015) 16:409 Page 12 of 19
HMI spectrum. Each value HMI(k) has its own mean andstandard error obtained from the ensemble (all sequencesfrom determined set). The mean of HMI(k) (horizontalblack line) and its standard deviation (the red line is 2 SD)can be observed. On the right side we see the frequencydistribution for HMI spectrum with 4 vertical lines: inblack is the mean, in red is 1 standard deviation, and in
Fig. 11 JSD histogram for HMI(maxmer): JSD histogram for pairs of HMI diwithout bias correction: “am” for D. americana, “am-am” for D. americana a“angor” for D. angor, “kik” for D. kikkawai, “mela” for D. melanogaster, “mira”bogotana, “persi” for D. persimilis, “pseud” for D. pseudoobscura, “sim” for D.yakuba. The observation of species names and vertical error bars is possible
yellow is the median. Summarizing the four species:a) D. paulistorum has 12 sequences, mean(HMI) =7.4 (SD = 4.1) and median = 6.6 mnat; b) D. willistonihas 19 sequences, mean(HMI) = 7.9 (SD = 4.1) andmedian = 7.2 mnat; c) D. kikkawai has 23 sequences,mean(HMI) = 9.6 (SD = 4.5) and median = 9.0 mnat; d)D. melanogaster has 30 sequences, mean(HMI) = 9.3
stributions for maxmer sequences a) with bias correction; and b)mericana, “am-tx” for D. americana texana, “ana” for D. ananassae,for D. miranda, “paul” for D. paulistorum, “pbogo” for D. pseudoobscurasimulans, “sturt” for D. sturtevanti, “wil” for D. willistoni, “yak” for D.by zooming the figure

Lichtenstein et al. BMC Bioinformatics (2015) 16:409 Page 13 of 19
(SD = 4.2) and median = 8.8 mnat. All these meanvalues are very low and we certified that they aregreater than the superior value from the confidenceinterval from shuffled analyses.Spectra of shuffled sequences simulated from ori-
ginal data can be seen in Fig. 10 having mean andmedian near zero mnat, a completely different spectrumcompared to real data. Once again, all mutual informationis lost. This is very important since all HMI have low
Fig. 12 JSD histogram HMI(mincut): JSD histogram for pairs of HMI distribubias correction: “am” for D. americana, “am-am” for D. americana americanaangor, “kik” for D. kikkawai, “mela” for D. melanogaster, “mira” for D. miranda“persi” for D. persimilis, “pseud” for D. pseudoobscura, “sim” for D. simulans, “observation of species names and vertical error bars is possible by zooming
mean, in a particular example, D. paulistorum has <HMI > = 7.2 mnat > > 0.063 (0.117) mnat for shuffled se-quences. Therefore we can confirm that all spectra are sta-tistically distinct compared to the spectrum of shuffledsequences. A nice discussion can be seen in [11, 29].
JSDJSD applied to HMI spectra (JSD[HMI]) can be seen inFigs. 11 and 12, where informational distance histograms
tions for mincut sequences a) with bias correction; and b) without, “am-tx” for D. americana texana, “ana” for D. ananassae, “angor” for D., “paul” for D. paulistorum, “pbogo” for D. pseudoobscura bogotana,sturt” for D. sturtevanti, “wil” for D. willistoni, “yak” for D. yakuba. Thethe figure

Lichtenstein et al. BMC Bioinformatics (2015) 16:409 Page 14 of 19
for maxmer and mincut, respectively, are displayed. Re-markable differences between distances are observed,many of them are statistically significant. Therefore, thismethod discriminates species with NOL = 1 and biascorrection, since SE are negligible (see Additional file 1:HMI tab). However, phylogenetic studies are recom-mended to analyze whether closely related species areclusterized in a similar way.A histogram calculated from spectra of shuffled se-
quences can be seen in Fig. 13, having very highmean (680 mnat) and low standard deviation (17mnat), a completely different profile when comparedto the real histogram. This histogram shows the lossof the capacity to discriminate species, since the in-formational distances are very similar as well as thestandard errors.Observing VMI, most of informational distances have
small differences. Furthermore, for VMI and VH re-spective standard errors are very large resulting in alarge confidence intervals. These results imply that JSDapplied to both methods results in not statistically sig-nificant distance differences. Therefore, VH and VMIpoorly discriminate species with NOL = 1 and bias cor-rection (see Additional file 1: VMI tab and VH tab).
Hierarchical clusterHierarchical cluster analysis is the last algorithm and iscomputed based on a distance matrix calculated from
Fig. 13 JSD histogram for HMI from shuffled sequences: maxmer with biasfor D. americana americana, “am-tx” for D. americana texana, “ana” for D. anmelanogaster, “mira” for D. miranda, “paul” for D. paulistorum, “pbogo” for Dpseudoobscura, “sim” for D. simulans, “sturt” for D. sturtevanti, “wil” for D. wilbe observed for JSD[HMI] from shuffled sequences, demonstrating a regula
JSD. In Fig. 14, we see four HMI dendrograms – herecalled Informational Dendrograms (ID) - obtained byapplying weighted pair group with averaging method(WPGMA) for: a) maxmer with bias correction; b)maxmer without bias correction; c) mincut with biascorrection; and d) mincut without bias correction. ForJSD[VMI], applying bias correction, distances increaseslightly and SE increases significantly (data notshown). But, for JSD[HMI], as seen in Figs. 11 and12, standard errors are negligible and distances in-crease in few percentiles to 25 % when comparingmincut to maxmer. Those observed low SEs allow usto infer discrimination between species since distancesare greater than zero with different values betweenpair of species. Changing from mincut to maxmer,with or without bias correction, some species changetheir positions in ID, but most of the clusters remainthe same, like: “wil-paul-sturt-angor” (see acronym inthe legend of Fig. 11), “tria-kik-ana”, “sim-mela-yak”,“pbogo-pseud-persi-mira”, and the “americanas” or“am-am_am-am_tx”. Because many of these speciescan be discriminated, these clusters must be com-pared to phylogenetic trees.
Hierarchical cluster and phylogenetic gene treesWe also calculated phylogenetic trees for maxmer andmincut original sequences. We used Mega [14] for themethods Maximum Likelihood (ML) and Neighbor
correction, mean = 675.6(18.2) mnat; “am” for D. americana, “am-am”anassae, “angor” for D. angor, “kik” for D. kikkawai, “mela” for D.. pseudoobscura bogotana, “persi” for D. persimilis, “pseud” for D.listoni, “yak” for D. yakuba. Very high distance with a very low SD canr profile very different from the original histogram

Fig. 14 (See legend on next page.)
Lichtenstein et al. BMC Bioinformatics (2015) 16:409 Page 15 of 19

(See figure on previous page.)Fig. 14 Hierarchical cluster dendrograms calculated for JSD[HMI], also called Informational Dendrogram: a) maxmer with bias correction; b)maxmer without bias correction; c) mincut with bias correction; d) mincut without bias correction. Acronyms are: “am” for D. americana, “am-am”for D. americana americana, “am-tx” for D. americana texana, “ana” for D. ananassae, “angor” for D. angor, “kik” for D. kikkawai, “mela” for D.melanogaster, “mira” for D. miranda, “paul” for D. paulistorum, “pbogo” for D. pseudoobscura bogotana, “persi” for D. persimilis, “pseud” for D.pseudoobscura, “sim” for D. simulans, “sturt” for D. sturtevanti, “wil” for D. willistoni, “yak” for D. yakuba
Lichtenstein et al. BMC Bioinformatics (2015) 16:409 Page 16 of 19
Joining (NJ). It was not our intention at all to comparephylogenetic trees versus mutual information dendro-grams, but to observe whether ML and NJ can discrim-inate species for closely related species and whether theformed clusters are similar to the calculated informa-tional dendrogram (ID) clusters.In Fig. 15, we see the gene tree for maxmer se-
quences - a) ML × ID, and b) NJ × ID. ML was calcu-lated using TN93 model, the resulted max loglikelihood (LnL) was −14561 and Ts/Tv equal to 1.30. InFig. 16, we see the gene tree for mincut sequences - a)ML × ID, and b) NJ × ID. ML was calculated using TN93model, the resulted LnL was −8004 and Ts/Tv equal to1.53. One reason for different LnL is different lengths formaxmer and mincut sequences.For maxmer sequences (Fig. 15), ML and NJ could
not discriminate the “americanas” species (D. ameri-cana, D. americana americana and D. americana tex-ana). The species in group “wil-paul-angor-sturt” (D.willistoni, D. paulistorum, and D. sturtevanti) arefairly close and this also occurs in JSD[HMI]-clustermethod, except for D. Angor. This last group is closeto the “americanas” cluster in NJ and ID. The speciesin group “sim-mela-yak” (D. simulans, D. melanoga-ster and D. yakuba) are close in all three methods.The species in group “tria-kik-ana” (D. triaurium, D.kikkawai and D. ananassae) are close in all threemethods with a similar topology. And finally, the speciesin group “pbogo-pseud-persi-mira” (D. pseudoobscura-bogotana, D. pseudoobscura, D. persimilis, and D. mi-randa) are also close in all three methods.
DiscussionMutual Information refers to common variation betweenresidues/sites, here DNA sequences. It can be applied tohorizontal direction (HMI) and vertical direction (VMI).JSD can be applied to pairs of mutual information spec-tra representing “mutual informational distances”. Thesedistances are used to infer discrimination between spe-cies. However, JSD applied to VH refers to “informationdistance”, like a difference of potential as pointed byAdami [9]. These three informational methods generatedwell defined spectrum patterns, similar to molecularsignatures.For HMI, mincut sequences resulted in almost the
same distance profile when compared to maxmer(Figs. 11 and 12). Comparing Fig. 11: a) “with bias
correction” and b) “without bias correction”, we observethat the profile gets bumpier, which is a nice feature thatallows better discrimination between species. The sameoccurs in Fig. 12a, b.VH and VMI spectra can be visually discriminated,
as molecular signatures (Figs. 5 and 7), but it wasmore difficult to visually compare all HMI spectra(Fig. 9). However JSD, with respective SE, allowed usto infer that HMI can discriminate species (Figs. 11and 12), while with VH and VMI methods it was notpossible.Shuffled tests applied to all information spectra
and distance histograms confirmed the all originalresults are statistically distinct than the shuffledone.Afterwards we compared Phylogenetic Gene Trees to
Informational Dendrograms calculated for HMI spectra.In Figs. 15 and 16, we observed that the clusters andtopologies are in reasonable concordance. But, we certi-fied that these Informational Dendrograms (JSD[HMI]-clusterization) are not phylogenetic gene trees, they areonly a mathematical way to cluster elements of the dis-tance matrix.
ConclusionsMIA is a user friendly pipeline capable in retrieving,selecting, aligning and storing molecular sequences.It is also capable in calculating Shannon VerticalEntropy, Vertical and Horizontal Mutual Informationand JSD between these informational spectra. MIAexports fasta files, calculated spectrum files and dis-tance matrices in ASCII format. It displays VH, HMIand VMI spectra. VMI heat maps can be visualizedin 2D and 3D (not shown here). MIA also displaysinformational distance histograms and informationaldendrograms. It is designed to analyze possible spe-cies discrimination via any molecular sequences, butin this first version only DNA sequences were ana-lyzed. More tests must be done in a near future likeincreasing NOL for the same data and also moredeep analyses like: polymorphic genes (not highlyconserved), sequences with larger lengths, and manysimultaneous gene analyses.
AvailabilityMIA is freely available at https://github.com/flalix/MIA.

Fig. 15 Phylogenetic Trees versus maxmer HMI-cluster: comparison between a) maximum likelihood versus informational dendrogram;b) neighbor joining versus informational dendrogram; ID was calculated from JSD[HMI | maxmer, bias correction]; bootstrap valuescan be observed at the nodes from ML and NJ
Lichtenstein et al. BMC Bioinformatics (2015) 16:409 Page 17 of 19

Fig. 16 Phylogenetic Trees versus mincut HMI-cluster: comparison between a) maximum likelihood versus informational dendrogram;b) neighbor joining versus informational dendrogram; ID was calculated from JSD[HMI | mincut, bias correction]; bootstrap values can beobserved at the nodes from ML and NJ
Lichtenstein et al. BMC Bioinformatics (2015) 16:409 Page 18 of 19

Lichtenstein et al. BMC Bioinformatics (2015) 16:409 Page 19 of 19
Additional file
Additional file 1: Drosophila-Adh data. (XLSX 153 kb)
AbbreviationsJSD: Jensen-Shannon divergence; HC: Hierarchical cluster; HMI: Horizontalmutual information; HMI-cluster: Horizontal mutual information hierarchicalcluster; Maxmer: Sequences with maximum gaps; MI: Mutual information;MIA: Mutual information analyzer; Mincut: Sequences with minimum gaps;MSA: Multiple sequence alignment; NOL: Number of letters or length of aword; VH: Vertical (Shannon) entropy; VMI: Vertical mutual information.
Competing interestsThe authors declare that they have no competing interests.
Authors’ contributionsFL concept, design, programming, manuscript draft, documentation andtesting. MB and FA concept, tests and discussion. All authors were involvedin writing the manuscript. All authors read and approved the finalmanuscript and manuals.
AcknowledgementsThe authors wish to thank Francisco Bosco, who passed away in 2012, forthe support and initial discussions, and also to Prof. Geoff Barton andAlexandre Ramos who read a previous version of the manuscript and helpedto improve it. This work was supported by CAPES PhD fellowship to FL, aFAPESP (2013/07838-0) grant to MRSB and CNPq (Brazil) productivityfellowships to FA and MRSB.
Author details1Departamento de Informática em Saúde, Escola Paulista de Medicina,Universidade Federal de Sao Paulo, Rua Botucatu, 862, Ed. José Leal Prado,andar térreo, Vila Clementino, CEP 04023-062 Sao Paulo, SP, Brazil.2Departamento de Microbiologia, Immunologia and Parasitologia, EscolaPaulista de Medicina, Universidade Federal de Sao Paulo, Rua Botucatu, 862,Ed. Ciências Biomédicas, 3 andar, Vila Clementino, CEP 04023-062 Sao Paulo,SP, Brazil. 3Laboratory of Evolutionary Genomics and Biocomplexity, EscolaPaulista de Medicina, Universidade Federal de São Paulo, Rua Pedro deToledo, 669, 4 andar L4E, CEP 04039-032 São Paulo, SP, Brazil.
Received: 3 September 2015 Accepted: 2 December 2015
References1. Grosse I, Herzel H, Buldyrev SV, Stanley E. Species independence of mutual
information in coding and noncoding DNA. Phys Rev E. 2000;61(5):5624–9.2. Carpena P, Bernaola-Galván P, Grosse I, Oliver JL, Román-Roldán R, Stanley E.
Finding Borders between Coding and Noncoding DNA Regions by anEntropic Segmentation Method. Phys Rev Lett. 1999;85(6):1342–5.
3. Bremm S, Schreck T, Boba P, Held S, Hamacher K. Computing and visuallyanalyzing mutual information in molecular co-evolution. BMCBioinformatics. 2010;11(330):1–6.
4. Weil P, Hoffgaard F, Hamacher K. Estimating sufficient statistics inco-evolutionary analysis by mutual information. Comput Biol Chem.2009;33:440–4.
5. Kawashita SY, da Silva CV, Mortara RA, Burleigh BA, Briones MRS. Homology,paralogy and function of DGF-1, a highly dispersed Trypanosoma cruzispecific gene family and its implications for information entropy of itsencoded proteins. Mol Biochem Parasitol. 2008;165(1):19–31.
6. Ferreira RC, Briones MRS. Phylogenetic evidence based on Trypanosomacruzi nuclear gene sequences and information entropy suggest thatinter-strain intragenic recombination is a basic mechanism underlying theallele diversity of hybrid strains. Infect Genet Evol. 2012;12(5):1064–71.
7. Python Community. Python Programming Language [Internet]. 2012[cited 2012 Jan 29]. Available from: http://www.python.org/
8. Biopython community. Biopython [Internet]. 2012 [cited 2012 Jan 25].Available from: http://biopython.org/wiki/Biopython
9. Adami C. Information theory in molecular biology. Phys Life Rev.2004;1:3–22.
10. Cover TM, Thomas JA. Elements of Information Theory. second edition. JohnWiley & Sons, Inc., Hoboken, New Jersey; 2006.
11. Steuer R, Kurths J, Daub CO, Weise J, Selbig J. The mutual information:detecting and evaluating dependencies between variables. Bioinformatics.2002;18 Suppl 2:S231–40.
12. Gouy M, Guindon S, Gascuel O. SeaView Version 4: A MultiplatformGraphical User Interface for Sequence Alignment and Phylogenetic TreeBuilding. Mol Biololgy Evol. 2002;27(2):221–4.
13. Kearse M, Moir R, Wilson A, Stones-Havas S, Cheung M, Sturrock S, et al.Geneious Basic: an integrated and extendable desktop software platform forthe organization and analysis of sequence data. Bioinformatics.2012;28(12):1647–9.
14. Tamura K, Stecher G, Peterson D, Filipski A, Kumar S. MEGA6: MolecularEvolutionary Genetics Analysis Version 6.0. Mol Biol Evol. 2013;30:2725–9.
15. Hall TA. BioEdit: a user-friendly biological sequence alignment editor andanalysis program for Windows 95/98/NT. Nucl Acids Symp Ser. 1999;41:95–8.
16. Martin LC, Gloor GB, Dunn D, Wahl LM. Using information theory to searchfor co-evolving residues in proteins. Bioinformatics. 2005;21(22):4116–24.
17. Gouveia-Oliveira R, Roque FS, Wernersson R, Sicheritz-Ponten T, Sackett PW,Mølgaard A, et al. InterMap3D: predicting and visualizing co-evolvingprotein residues. Bioinforma - Appl Notes. 2009;25(16):1963–5.
18. Roulston MS. Estimating the errors on measured entropy and mutualinformation. Phys D. 1999;125:285–94.
19. Edgar RC. MUSCLE: multiple sequence alignment with high accuracy andhigh throughput. Nucleic Acids Res. 2004;32(5):1792–7.
20. DPDB Home Page: Drosophila DNA polymorphism [Internet]. [cited 2012Nov 4]. Available from: http://bioinf3.uab.cat/DPDB/dpdb.asp
21. Santos G, Schroeder AJ, Gelbart W, FlyBase Consortium. FlyBase:introduction of the Drosophila melanogaster Release 6 reference genomeassembly and large-scale migration of genome annotations. Nucl Acids Res.2014;1:1–8.
22. Berkeley. Berkeley Drosophila Genome Project [Internet]. Available from:http://insitu.fruitfly.org/cgi-bin/ex/insitu.pl
23. Herzel H, Grosse I. Measuring correlations in symbol sequences. Phys A.1995;216:518–42.
24. Herzel H, Grosse I. Correlations in DNA sequences: The role of proteincoding segments. Phys Rev E. 1997;55(1):800–10.
25. Shannon CE. A Mathematical Theory of Communication. Bell Syst Tech J.1948;27:379–423. 623–56.
26. Endres DM, Schindelin JE. A new metric for probability distributions. IEEETrans Inf Theory. 2003;49(7):1858–60.
27. Johnson AD. An extended IUPAC nomenclature code for polymorphicnucleic acids. Genet Popul Anal. 2010;26(10):1386–9.
28. van der Linde K, Houle D, Spicer GS, Steppan SJ. A supermatrixbased on molecular phylogeny of the family Drosophilidae. GenetRes. 2010;92(01):25–38.
29. Grosse I, Bernaola-Galván P, Carpena P, Román-Roldán R, Oliver J, StanleyHE. Analysis of symbolic sequences using the Jensen-Shannon divergence.Phys Rev E. 2002;65(041905):1–16.
• We accept pre-submission inquiries
• Our selector tool helps you to find the most relevant journal
• We provide round the clock customer support
• Convenient online submission
• Thorough peer review
• Inclusion in PubMed and all major indexing services
• Maximum visibility for your research
Submit your manuscript atwww.biomedcentral.com/submit
Submit your next manuscript to BioMed Central and we will help you at every step: