mibzmao/eecs589/papers/mib.pdf · ork using the same mib v ... proactiv net w ork managemen t in...
TRANSCRIPT

MIB Variable Based Fault Classi�cation� The
Next Step Towards Proactive Management
Experience Paper
Marina Thottan
Bell Laboratories
Room �F����
��� Crawfords Corner Road
Holmdel� NJ ����������
email�marinat�lucent�com
phone� ����������
Please use a color printer
Abstract
Faults can be classi�ed using information contained in the MIB vari�ables� It is observed that distinct changes in the MIB data characteris�tics precede di�erent fault types� Previous work has shown that networkfaults can be predicted ���� using MIB data� Now with the possibilityof classifying faults� network alarms can be associated with speci�c faulttypes� Associating a network alarm with a speci�c network fault is anessential pre�requisite for automated recovery� In our current work we de�scribe the classi�cation of four di�erent faults network access problems�protocol implementation error� runaway process and �le server failures�We also show that a simple discriminant function scheme that accountsfor spatial correlations in the MIB data performs better than commonmajority�voting schemes�
Key�words� fault and performance management� proactive management� faultclassi�cation� majority�vote� discriminant functions� statistical methods
�

� Introduction
The increased commercial use of the Internet is critically dependent on a reliablenetwork� Hence identi�cation and correction of network faults is an imperative�There are several techniques available today to perform fault detection �������A major goal of our research is to be able to automate network managementthrough fault prediction� classi�cation and recovery� It has been shown thatnetwork faults are preceeded by indications in the MIB variables that allow forprediction� ����� In this work we focus on the classi�cation of faults in an IPnetwork� using the same MIB variable data�
Faults can be classi�ed based on the changes observed in the MIB variablesimmediately preceeding the fault� This �nding has great potential as a meansof initiating corrective measures for proactive network management ��������In earlier work we have shown that predictive alarms can be generated usingdiscriminant functions ���� These discriminant functions are functions of thefeatures derived from the input MIB variables� This is a �exible method sincethe feature vectors can be tailored to the type of problem under study ���� Thealarms generated correlated well with the faults observed in the data� However�these alarms alone are not su cient to indicate the type of fault� Once a faultis declared� the alarms have to be associated with a speci�c fault type in orderto implement recovery actions� Fault identi�cation may be done using standardalarm correlation techniques such as �nite state machine or constraint satisfac�tion algorithms ����� ��� ���� ����� In this work we show� using real network data�that network faults can be identi�ed based on the characteristics of the MIBdata immediately prior to the fault� There is no new processing of informationrequired and therefore allows simultaneous declaration and identi�cation of thefault� This provides a signi�cant advantage in terms of the timeliness of recoverymeasures implemented�
A large number of existing fault detection algorithms use a majority�votescheme to declare the occurrence of a fault� The majority�vote scheme obscuresthe details necessary to further classify a network fault due to hard thresholds�In this work we compare our discriminant function scheme with a majority�voting scheme� Using real network data� we found our method performs betterin terms of prediction and false alarm rate �the discriminant function predictedmost of the faults while the majority�vote only detected one type of fault� Themean time between false alarms using discriminant functions was two timesmore than with majority�vote��
The organization of the paper is as follows� In section � we discuss somepossible choices for feature vectors and provide speci�c details relating to thechoice of feature vectors for this work� Section ��� describes the system studiedalong with the description of the production networks used to obtain data� Themetrics used to evaluate management schemes are also described� A discussionon the discriminant function along with the summary of results is presentedin section ���� The fault classi�cation problem is addressed in section � A
�with respect to fault labels obtained using syslog messages
�

comparative study of the discriminant function with the majority�voting schemeis provided in section �� Discussions and conclusion follow in section ��
� System Description
The existing management tools provide statistics on a large number of variablesthat may or may not be relevant to fault detection� Therefore one of the mainchallenges faced by the research community in this regard is the choice of asingle variable or a set of variables that are relevant towards fault detection�Data mining techniques are being used to study di�erent management databases in order to extract the relevant information ���� Statistical informationobtained from such variables constitute the feature vectors� For any given faultdetection scheme� to cover a wide range of failures it is necessary to choose aset of relevant feature vectors� Maxion et al used features such as packet loss�and number of collisions ��� Trouble tickets can be used as feature vectorsin algorithms using arti�cial intelligence techniques ��������� ����� In our workwe use the statistical changes in the Management Information Base �MIB II�variables ��� �which are a part of SNMP��
Since most of the faults of interest are user related we chose those MIB vari�ables that re�ect the tra c behavior at a given network node� For example inthe case of the router we used the following MIB variables�ipIR� Number of datagrams received by the ip layer of the routeripIDe� Number of datagrams forwarded to the higher layersipOR� Number of datagrams received from the higher layers�These variables provide a cross�sectional view of the tra c at the network layer�For more details on the choice of these variables refer ����� The statistical behav�ior of the change points in the MIB variables are then studied and abnormalityindicators� are obtained for each of these variables ���� The value of the ab�normality indicator ranges from � to �� A value of � corresponds to no changein MIB data behavior and a value of � denotes maximal change� Change ismeasured by comparing adjacent windows of data �approx� � hr long� ����� Theabnormality indicators constitute the components of the input feature vector�
��� Network Description
The experimental system consisted of two production networks� an enterprisenetwork and a campus network� Both these networks were being actively mon�itored and were well designed to meet customer requirements� The types offaults observed were the following� File server failures� protocol implementationerror� network access problems and runaway processes ����� Most of these fail�ures were due to abnormal user activity except for the protocol implementationerrors� File server failures could result from user behavior such as excessivenumber of ftp requests and a runaway process is an example of high network
�The abnormality indicators are obtained using a change detection algorithm� For moredetails please refer ����

utilization by some culprit user� However all of these cases did a�ect the normalcharacteristics of the MIB data� and impaired the functionality of the network�
The analysis of the two schemes under study consisted of comparing thealarms obtained� with the corresponding syslog messages and the trouble tick�eting systems that were being actively used by the system administrators� Theperformance measures used were as follows� Prediction time Tp is given as�
Tp � TE � Ta ���
where TE is the time stamp of the fault as given by the syslog messages� Ta isthe alarm time given by the scheme under study� The detection time Td is�
Td � Ta � TE ���
Tf � the mean time between false alarms is the average time between any twoalarms obtained by the scheme that were not positively associated with a faultby the available labeling systems� The quantities Tp and Td are constrained tobe always less than Tf �
��� Discriminant Functions and Fault Space
A discriminant function is used to discriminate between two classes of data� afault class and a non�fault class� Often the discriminant function is a function ofthe input feature vectors and incorporates information speci�c to the problembeing studied� The discriminant function captures the spatial correlation amongthe components of the input feature vector �� through the matrix operator A�The feature vector is the abnormality indicators derived from the di�erent MIBvariables� The operator is essentially a variant of the correlation matrix � �����The scheme used is shown in Figure �� � is one of the eigenvalues of the matrix
ψ ψ( T ) > λ declare alarm
ψ
ψ
ψ
1
2
N
A
Input Feature Vectors
Figure �� Discriminant function scheme for N inputs using the operator A� � isthe eigenvalue of A�
A� The choice of the eigenvalue used to declare alarms involves preferentialweighting of the input features based on their relevance to the nature of faults
�persistence �lters incorporated in the interest of robustness ����
�

Fault Data Set Case Prediction Detection Mean TimeType No No Time Time Between
Tp�mins� Td�mins� False AlarmsTf �mins�
File server I � �� � ���II � �� � ���III � �� � ���
� � � �� �
IV � �� � ����V � �� � ���VI � � � ��
� � �Protocol imple� VII � �� � no other alarmsMentation errorRunaway process VIII � � � ��Network access IX � �� � ��
� � � � ��
Avg� ���� � �Std�dev ���� ���� ����
Table �� Prediction of failures at the router using the discriminant functionscheme
studied� In our case we are focusing on faults caused by user tra c which ismaximally represented in the variable ipIR� Hence the eigenvalue correspondingto this variable is weighted heavier than the others and is used to declare alarms�The matrixA is designed so that the discriminant function ��A��T returns a valuebetween � and � ����� The results obtained using this discriminant function areshown in Table ���� Data set number refers to the di�erent time periods of datacollection� Data was collected over a period of ten months� The case numbersin each data set identify the fault instances encountered in the di�erent timeperiods� There is no thresholding performed on the input feature vectors priorto fault declaration� This helps to preserve the information required to detectthe subtle changes associated with the di�erent types of faults�
The discriminant function can be used to divide the problem space intoa fault and non�fault region� With each of the three input feature vectorsranging in value from � to �� we have a problem space that is the same as a unitcube� The discriminant function carves out a region in this problem space whichdenotes the fault region� In general� the fault region corresponds to maximalvalues of abnormality in all of the feature vectors� Hence the input vector�� � ����� corresponds to the maximum fault condition� The fault space canbe represented as shown in Figure �� The color scale indicates the gradient inthe combined abnormality of the input vectors� Thus the brighter �red� region
�
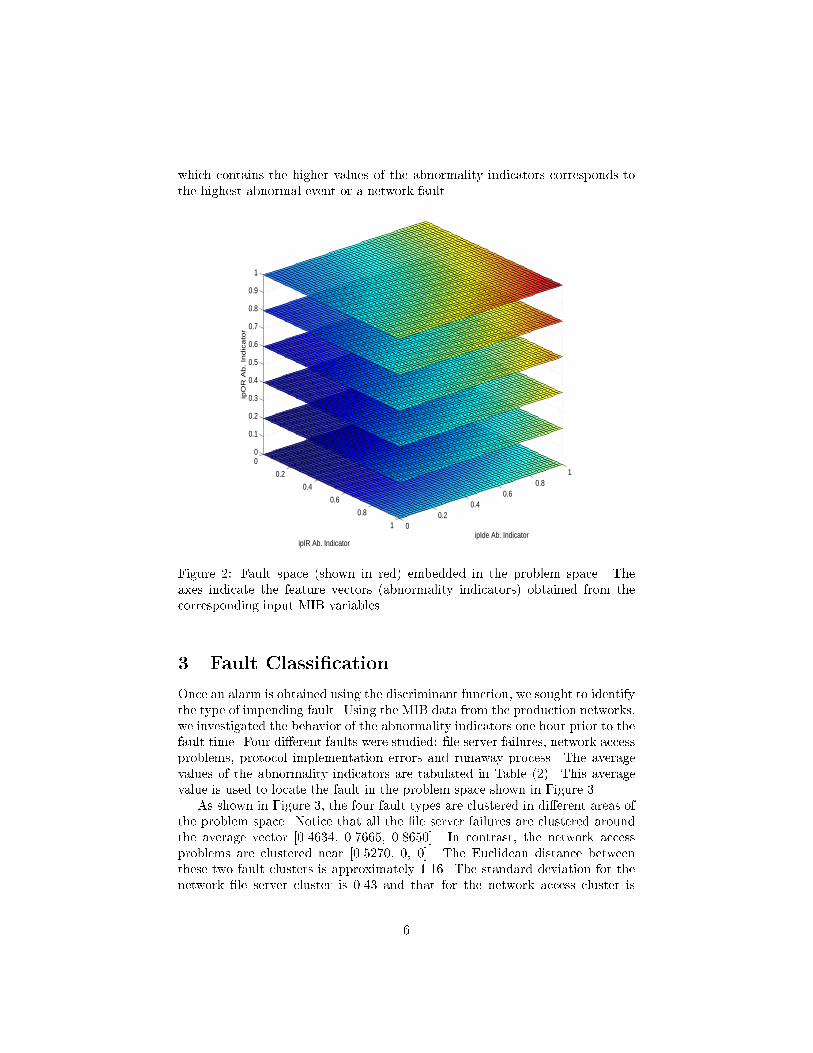
which contains the higher values of the abnormality indicators corresponds tothe highest abnormal event or a network fault�
0
0.2
0.4
0.6
0.8
1 00.2
0.40.6
0.81
0
0.1
0.2
0.3
0.4
0.5
0.6
0.7
0.8
0.9
1
ipIde Ab. IndicatoripIR Ab. Indicator
ipO
R A
b.
Ind
ica
tor
Figure �� Fault space �shown in red� embedded in the problem space� Theaxes indicate the feature vectors �abnormality indicators� obtained from thecorresponding input MIB variables
� Fault Classi�cation
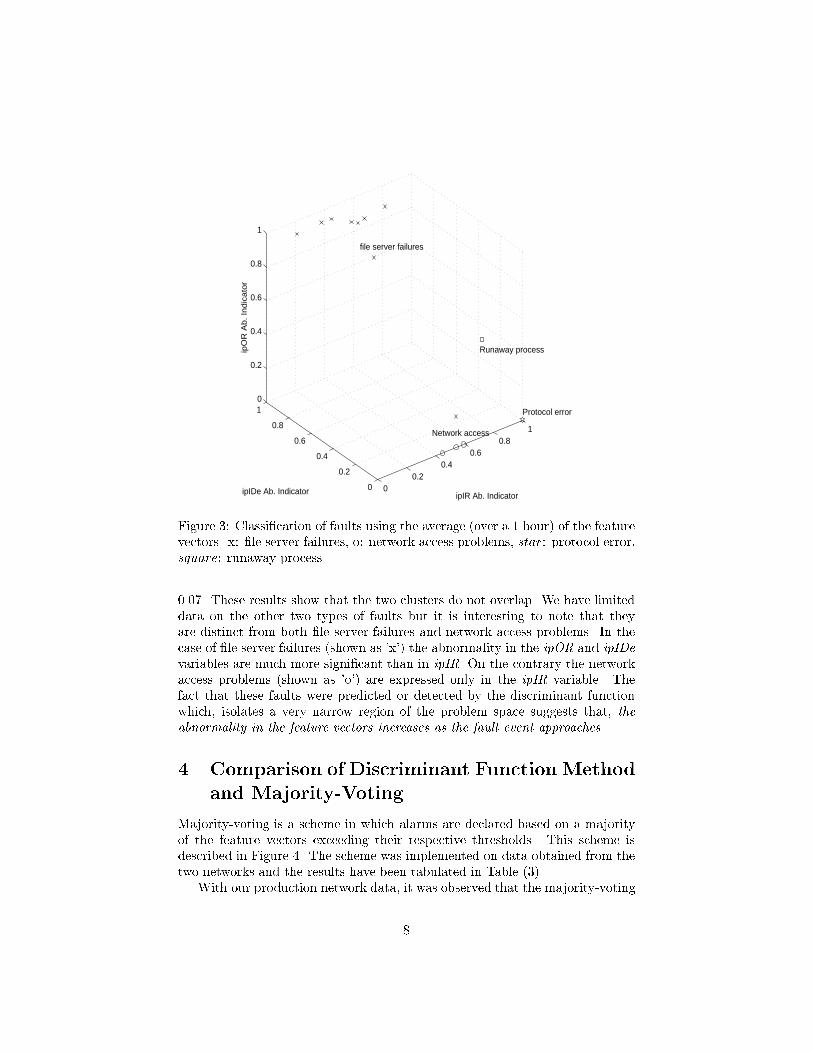
Once an alarm is obtained using the discriminant function� we sought to identifythe type of impending fault� Using the MIB data from the production networks�we investigated the behavior of the abnormality indicators one hour prior to thefault time� Four di�erent faults were studied� �le server failures� network accessproblems� protocol implementation errors and runaway process� The averagevalues of the abnormality indicators are tabulated in Table ���� This averagevalue is used to locate the fault in the problem space shown in Figure �
As shown in Figure � the four fault types are clustered in di�erent areas ofthe problem space� Notice that all the �le server failures are clustered aroundthe average vector ������� ������� ������� In contrast� the network accessproblems are clustered near �������� �� ��� The Euclidean distance betweenthese two fault clusters is approximately ����� The standard deviation for thenetwork �le server cluster is ��� and that for the network access cluster is
�

Fault Data Set Case Abnormality Abnormality AbnormalityType No No of of of
ipIR ipIDe ipORFile server I � ����� � ���
II � ����� ���� ���III � ����� ��� ���
� ����� ����� ����� ��� ����� �����
IV � ���� ��� �����V � ���� ���� �����VI � ���� ��� ���
� ����� ����� �����Avg� ���� ����� ����
Std�dev ���� ����� ���Protocol imple� VII � ����� � �mentation errorRunaway process VIII � ���� ����� ����Network access IX � ����� � �
� ����� � � ����� � �
Avg� ����� � �Std�dev ����� � �
Table �� Abnormality indicators of the feature vectors averaged over an hourprior to the fault�
�
00.2
0.40.6
0.81
0
0.2
0.4
0.6
0.8
10
0.2
0.4
0.6
0.8
1
Protocol error
Runaway process
ipIR Ab. Indicator
Network access
file server failures
ipIDe Ab. Indicator
ipO
R A
b. In
dic
ato
r
Figure � Classi�cation of faults using the average �over a � hour� of the featurevectors� x� �le server failures� o� network access problems� star� protocol error�square� runaway process
����� These results show that the two clusters do not overlap� We have limiteddata on the other two types of faults but it is interesting to note that theyare distinct from both �le server failures and network access problems� In thecase of �le server failures �shown as �x�� the abnormality in the ipOR and ipIDevariables are much more signi�cant than in ipIR� On the contrary the networkaccess problems �shown as �o�� are expressed only in the ipIR variable� Thefact that these faults were predicted or detected by the discriminant functionwhich� isolates a very narrow region of the problem space suggests that� theabnormality in the feature vectors increases as the fault event approaches�
� Comparison of Discriminant FunctionMethod
and Majority�Voting
Majority�voting is a scheme in which alarms are declared based on a majorityof the feature vectors exceeding their respective thresholds� This scheme isdescribed in Figure �� The scheme was implemented on data obtained from thetwo networks and the results have been tabulated in Table ���
With our production network data� it was observed that the majority�voting

1
2
N
feature vectors
input
1/0
1/0
alarm declared
ψ
ψ
ψ
j =
j =
j =
1/0Σ j > Ν/2
Figure �� Majority�voting scheme for N input vectors� � is the sum of allthresholded feature vectors
scheme failed to predict or detect certain fault conditions such as network accessproblems� runaway processes and protocol implementation errors� On the otherhand� the discriminant function predicted or detected these faults suggestingthat the faults did a�ect the characteristics of the MIB data� The discriminantfunction scheme avoids hard thresholds on the input feature vectors� Thereforethis scheme is able to detect the subtle changes in the MIB characteristicsassociated with di�erent fault types� Imposing hard thresholding to the inputfeature vectors leads to a loss of information� Furthermore� the discriminantfunction scheme accounts for the lesser and more subtle spatial correlationsamong the input feature vectors making it capable of detecting a variety offailures�
The discriminant function was able to predict all of the �le server failures�On the other hand� the majority�vote scheme only detected failures at the sametime or immediately after it was observed by the existing mechanisms �syslogand trouble tickets�� To provide predictability for the majority�voting schemeit will be necessary to lower the hard thresholds used� This will compromise onthe number of false alarms generated� The optimal thresholds to be imposedon the input feature vectors are hard to obtain in practice� especially with theevolving or non�stationary nature of network tra c �����
In addition to the bene�ts of prediction� the discriminant function out�performs the majority�vote scheme by producing only half as many false alarms�the average mean time between false alarms is hrs for the discriminant func�tion and � hrs for the majority�vote scheme�� The discriminant function providesa continuous indicator of network abnormality while the majority�vote scheme
�

Fault Data Set Case Prediction Detection Mean TimeType No No Time Time Between
Tp�mins� Td�mins� False AlarmsTf �mins�
File server I � � � ���II � � �� �III � � � ��
� � � �
IV � � � ���V � � � ���VI � � � ��
� � �Avg � ���� ���
Std�dev ��� �
Table � Detection of �le server failures at the router using the majority�votingscheme
gives an on�o� output� A continuous indicator is essential to provide trends inavailability and reliability information� Thus on comparing Tables �� and ���we can conclude that a more sophisticated discriminant function that accountsfor spatial correlation among the input feature vectors performs better than themajority�vote scheme�
� Discussion and Conclusion
In this work we have demonstrated using real network data that the MIBvariables show distinctive features prior to a network fault� These distinctivechanges can be associated with speci�c fault types� The four di�erent fault typesstudied� �le server failures� network access problems� protocol implementationerrors and runaway processes� show characteristic �nger prints in the abnormal�ity indicators of the ipIR� ipIDe and ipOR MIB variables� There is su cientdistance between the clusters of �le server failures and network access problemsthat it is possible to distinguish them easily� As soon as more data becomesavailable� we hope to con�rm our initial �ndings on the other two fault types aswell� We believe that this is a novel approach to perform online classi�cation ofnetwork fault conditions by looking at just an hour duration of the MIB data� Itis a simple scheme and does not require much data manipulation to do classi��cation� We only consider predictive indicators to do fault classi�cation becausewe are interested in proactively managing the network to prevent failures�
The fault classi�cation described here can be used to develop suites of recov�ery options for di�erent fault types� Furthermore� this work presents the �rststep to characterize network fault behavior in terms of the e�ects of the fault
��

on tra c measurements� More research is under way to test the �ndings incontrolled environments and on new network data� Finally� we have shown thatusing discriminant functions that incorporate the spatial correlations among theMIB variables is signi�cantly better than the majority�vote scheme�
� Acknowledgments
The author would like to thank Prof� Chuanyi Ji and DARPA for facilitating theearly work in this research and Lucent Technologies for providing the enterprisenetwork data� The e�orts of D� Hollinger� R� Collins� N� Schimke and C� Hoodwith the set up of the data collection on the campus network is very muchappreciated�
References
��� A� Bouloutas� G� Hart� and M� Schwartz� On the design of observers for fail�ure detection of discrete event systems� Network Management and Control�New York� Plenum� �����
��� G� Jakobson and M� D� Weissman� Alarm correlation� IEEE Network�pages ������ Nov ����
�� I� Katzela and M� Schwarz� Schemes for fault identi�cation in communica�tion networks� IEEE�ACM Trans� on Networking� �������� �����
��� M� Kirby and L� Sirovich� Application of the karhunen�loeve procedure forthe characterization of human faces� IEEE Trans� on Pattern Analysis andMachine Intelligence� ������������ �����
��� A� Knobbe� D� Wallen� and L� Lewis� Experiments with data mining in en�terprise management� Proceedings of IEEE�IFIP Integrated Network Man�agement VI� Boston� USA� pages ����� �����
��� A� Lazar� W� Wang� and R� Deng� Models and algorithms for network faultdetection and identi�cation� A review� In Proc� of IEEE ICC� �����
��� L� Lewis and G� Dreo� Extending trouble ticket systems to fault diagnosis�IEEE Network� pages ������ Nov ����
�� R� Maxion and F� E� Feather� A case study of ethernet anomalies in adistributed computing environment� IEEE Trans� on Reliability� ���������� Oct �����
��� K� McCloghrie and M� Rose� Management information base for networkmanagement of tcp�ip�based internets� Mib �� RFC����� �����
��

���� C� Melchiors and L� M� R� Tarouco� Troubleshooting network faults us�ing past experience� Proceedings of IEEE�IFIP Network Operations andManagement Symposium� Honolulu� Hawaii� pages ������� �����
���� S� Papavassiliou� M� Pace� and A� Zawadzki� Proactive maintenance toolsfor transaction oriented wide area networks� Proceedings of IEEE�IFIPNetwork Operations and Management Symposium� Honolulu� Hawaii� pages������ �����
���� G� Penido and C� Machado J� M� Nogueira� An automatic fault diagnosisand correction system for telecommunications management� Proceedingsof IEEE�IFIP Integrated Network Management VI� Boston� USA� pages������� �����
��� M� A� Rocha and C� B� Westphall� Proactive management of computernetworks using arti�cial intelligence agents and techniques� Proceedings ofIEEE�IFIP Integrated Network Management V� San Diego� USA� pages������� �����
���� I� Rouvellou and G�W� Hart� Automatic alarm correlation for fault iden�ti�cation� In Proc� of IEEE INFOCOM� pages ������� Apr Boston USA�����
���� M� Sabin� R� D� Russell� and E� C� Freuder� Generating diagnostic tools fornetwork fault management� Proceedings of IEEE�IFIP Integrated NetworkManagement V� San Diego� USA� pages ������� �����
���� D� Shen and J� Hellerstein� Predictive models for proactive networkmanagement� Application to a production web server� Proceedings ofIEEE�IFIP Network Operations and Management Symposium� Honolulu�Hawaii� pages ���� �����
���� M� Thottan� Fault Detection and Prediction for Management of ComputerNetworks� Doctoral Thesis� Rensselaer Polytechnic Institute� Troy� NY�USA�� May �����
��� M� Thottan and C� Ji� Fault prediction at the network layer using intelligentagents� In IEEE�IFIP� Integrated Network Management VI� Boston� USA��pages �������� May �����
���� M� Thottan and C� Ji� Statistical detection of enterprise network prob�lems� Journal of Network and Systems Management� ����������� �����Also available from http���neuron�ecse�rpi�edu��
���� M� Thottan and C� Ji� Properties of network faults� Proceedings of theIEEE�IFIP Network Operations and Management Symposium� Honolulu�Hawaii� page ���� May �����
���� M� Thottan and C� Ji� Proactive anomaly detection using distributed in�telligent agents� IEEE Network� pages ������ Sept�Oct ����
��

Biography Marina Thottan received her M�S� in Physics from Madras Univer�sity� India� She obtained an M�S� in Biomedical Engineering and a Ph�D in Elec�trical Engineering from Rensselaer Polytechnic Institute� Troy� NY� Currentlyshe is working as a member of technical sta� in the Department of Networkand Service Management at Bell Labs Research� Her research interests are inthe areas of adaptive algorithms and management of computer communicationnetworks�
�