michael doane luke froeb competition economics … economic analysis of the proposed merger between...
TRANSCRIPT

AN ECONOMIC ANALYSIS OF THE PROPOSED MERGER BETWEEN WELLMONT
HEALTH SYSTEM AND MOUNTAIN STATES HEALTH ALLIANCE
Michael Doane
Luke Froeb
Competition Economics LLC
January, 2015
The views expressed herein are solely those of the authors and do not necessarily reflect the
views of Competition Economics LLC, Vanderbilt University, Anthem VA, or BCBS-
Tennessee.

1
I. Introduction and Summary
We have been asked by America’s Health Insurance Plans (“AHIP”) to evaluate the
likely competitive effects of the proposed merger between Wellmont Health System
(“Wellmont”) and Mountain States Health Alliance (“Mountain States”). Wellmont and
Mountain States have agreed to exclusively explore the creation of a new, combined system and
the proposed merger was recently approved by the boards of directors of both systems. 1
Following Tenn. Code Ann. § 68-11-1303 (2014), we analyzed the likely competitive effects of
the proposed merger on “[t]he ability of … health care payors to negotiate optimal payment and
service arrangements with hospitals.”2
Specifically, we analyzed the competitive impact of combining the acute care hospital
facilities of each system. To do this, we performed three empirical studies that show (1) how the
proposed merger changes the structure of the market for inpatient services provided by hospitals
in relevant geographic markets, (2) the extent to which the merging hospitals are close
substitutes for each other (using the tool of diversion analysis), and (3) the extent to which the
merger affects bargaining between health plans and hospitals and, ultimately, hospital prices
(using bargaining models employed by the U.S. Federal Trade Commission to evaluate hospital
mergers).
We found:
1 See Letter of Notice to the Southwest Virginia Health Authority of the intent of Mountain States and Wellmont to
file an application for the issuance of a Certificate of Public Advantage (“COPA”) with respect to a cooperative
agreement among the parties (dated September 16, 2015) and Letter of Notice to the Tennessee Department of
Health of the intent of Mountain States and Wellmont to file an application for the issuance of COPA with respect to
cooperative agreement among the parties (dated September 15, 2015).
2 See House Bill 2316 Southwest Virginia Health Authority (offered January 22, 2015).

2
In the Southwest Virginia and Northeast Tennessee areas that comprise the 90 percent
inpatient draw area of the merged hospitals, the proposed merger creates a firm with
over a 77 percent share. Concentration would increase well beyond the thresholds
presumed to be anticompetitive by competition agencies.
An analysis of inpatients’ hospital choices shows that the merged hospitals are each
other’s closest competitors. If Wellmont were to close, 75 percent of its patients
would go to a Mountain States hospital. Similarly, if Mountain States were to close,
72 percent of its patients would go to a Wellmont facility.
The modeling framework routinely used by competition agencies to evaluate hospital
mergers predicts huge post-merger price increases.
All three of these findings point to the same conclusion -- this merger is likely to
significantly reduce competition and raise prices for consumers. This finding is consistent with
the hospital merger retrospectives performed by economists at the U.S. Federal Trade
Commission (“FTC”) suggesting that reductions in competition of this magnitude have
significant anticompetitive effects.3
We have not analyzed any potential efficiencies or quality improvements of the merger.
However, given the magnitude of the loss in competition, any merger-specific efficiencies and
quality improvement would need to be significant to offset the loss of competition. In this
regard, we note that economic analyses of past hospital mergers have not found projected
efficiencies to be large enough to offset anticompetitive effects.
II. Overview of the Merging Hospital Systems
The proposed merger would combine two large hospital systems serving communities in
Northeast Tennessee and Southwest Virginia. Wellmont operates four hospitals in Tennessee
3 For a summary, see Farrell, Joseph, David Balan, Keith Brand, and Brett Wendling, (2011), “Economics at the
FTC: Hospital Mergers, Authorized Generic Drugs, and Consumer Credit Markets,” Review of Industrial
Organization, Vol. 39, No. 4. pp. 271-296.

3
and two hospitals in Virginia as well as numerous outpatient care sites. Mountain States operates
eight hospitals in Tennessee and five hospitals in Virginia and, like Wellmont, numerous
outpatient care facilities located throughout the region.
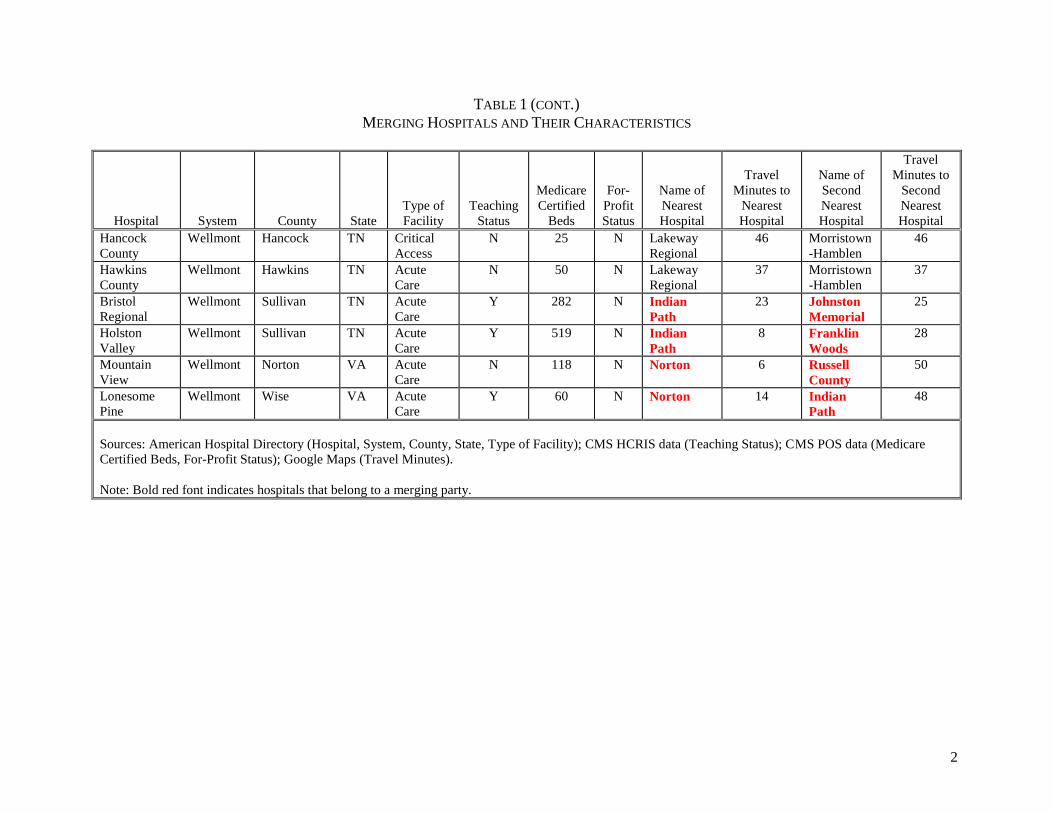
Table 1 lists the hospital facilities operated by the merging systems and describes their
characteristics, including type of facility (acute care, critical access, children’s, rehabilitation,
and psychiatric care), teaching status, number of Medicare certified beds, and the names of the
two closest hospitals. As the table highlights, for sixteen of the twenty merging hospitals, the
closest competing hospital (and in many cases, both the closest and second-closest competing
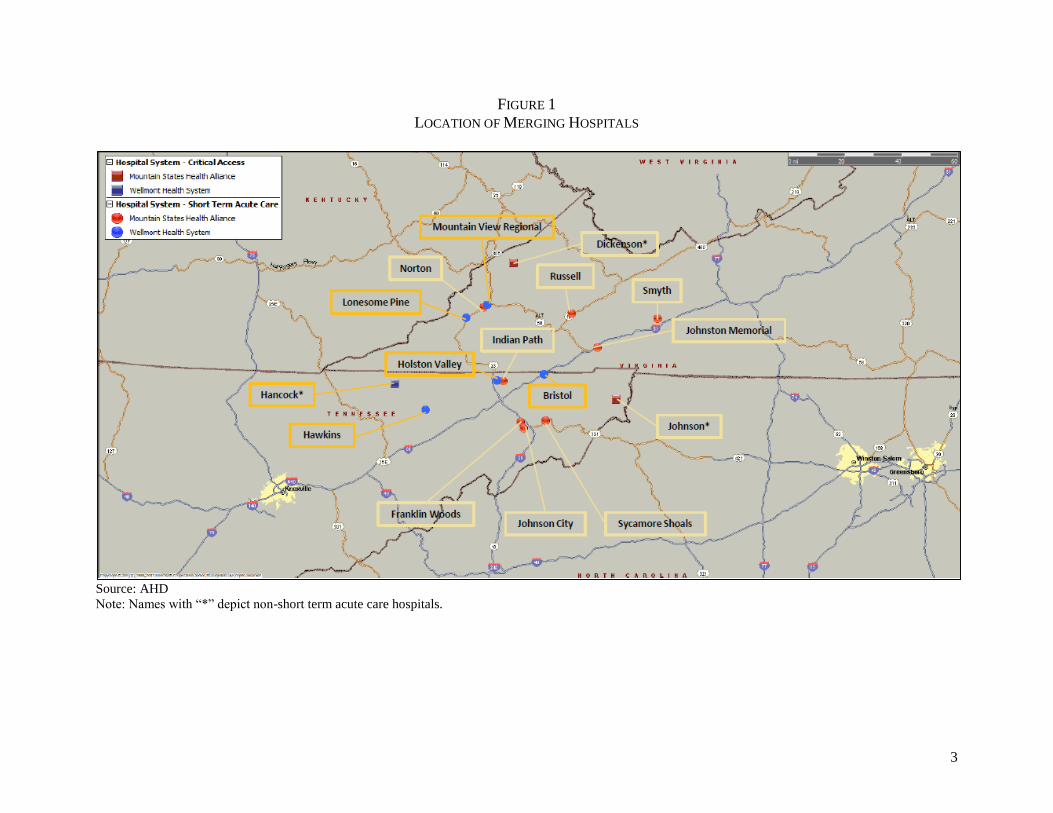
hospital), is owned by the merging partner. The close proximity of the merger hospitals is
further depicted in Figure 1. For example, the closest acute care hospital to Wellmont’s
Mountain View hospital (118 beds) is Mountain States’ Norton hospital (129 beds) with an
estimated driving time between them of six minutes. The closest acute care hospital to
Wellmont’s Holston Valley hospital (519 beds) is Mountain States’ Indian Path hospital (300
beds) with an estimated driving time between them of nine minutes. The two closest hospitals to
Wellmont’s Bristol Regional hospital (282 beds) are Mountain States’ Indian Path and Johnston
Memorial (116 beds) hospitals with estimated driving times of 22 minutes and 24 minutes,
respectively.
III. Economic Analysis of Proposed Merger
Patients are the ultimate consumers of hospital-based acute care inpatient services. In
order to attract employers, health plans seek to offer access to hospitals that are attractive to their
covered subscribers. To attract hospitals to their networks, health plans offer access to
subscribed employees and individuals, and negotiate rates that the hospitals are willing to accept.
A health plan with few subscribers will typically be less attractive to a hospital (all else equal),

4
and a health plan with few hospitals, far away from subscribers, in its network will typically be
less attractive to subscribers (again, all else equal). More generally, third-party payors (e.g.,
private providers of health insurance) are responsible for negotiating the rates paid to hospitals
and making payments for enrollees in accordance with these rates. Typically, patients do not pay
the entire bill for the services they consume, but pay a portion of the negotiated rates as
“deductibles” or “co-payments.” They can also receive balance bills directly from “out-of-
network” providers.
Health insurance plans create a network of preferred hospitals and other health-care
providers for their subscribers, while providing access to potential customers (i.e., their
subscribers) to the health-care providers in their network. That is, health plans provide each side
of the market (i.e., health-care providers and patients) with access to suitable alternatives on the
other side of the market. The rates at which hospitals are reimbursed are typically determined by
negotiation between a health plan and the hospital. Consumers’ preferences affect these
negotiations. Payers try to put together a network with a large number of high quality and
conveniently located hospitals, which increases demand for their plans, which in turn makes
payers more willing to pay higher prices to include attractive hospitals in their networks. By
quality, we mean the attributes of a hospital that appeal to consumers.
The largest public payors are Medicare, which provides health insurance for the elderly,
and Medicaid, which provides coverage for low-income persons.4 Private insurance companies
such as Blue Cross/Blue Shield of Tennessee (“BCBS-TN”) and Anthem VA sell health
4 In 1983, Medicare adopted the Inpatient Prospective Payment System (“IPPS”). IPPS defined diagnostic-related
groups (“DRGs”), and paid hospitals on the basis of the average cost of treating all patients in that DRG and certain
other factors, regardless of the actual cost incurred in the specific case for which reimbursement was sought.

5
insurance to individuals directly and indirectly, through group policies sold to employers. Rates
(and other contractual terms and conditions) are determined in negotiations between health
insurers and health care providers. Economic models of bargaining provide a useful framework
for analyzing price determination in this economic setting.
A. The Role of Bargaining in Evaluating Hospital Mergers
A commonly used economic framework for analyzing bargaining was developed by John
Nash, and begins by listing the properties that a reasonable bargaining outcome should have.5
From these properties, it follows that the parties split the gains from trade, where the gains are
measured relative to the total surplus both parties gain from reaching an agreement relative to
their outside alternatives if no agreement is reached. An interesting feature of this analytical
framework is the role that the alternatives to agreement play in determining the terms of
agreement. A good outside alternative will improve a party’s bargaining position, and allow it to
capture a bigger share of the proverbial pie.
To improve its bargaining position, a party must either increase the other party’s gain for
reaching agreement or reduce its own gain reaching agreement. Increasing the other party’s gain
from agreement makes the other more willing to compromise to reach an agreement, which leads
to a bigger share of the joint profit. Likewise, by reducing its own gain from reaching
agreement, a party becomes less willing to compromise, improving its bargaining position, and
increasing its share of the joint profit.
Mergers or acquisitions can weaken the other party’s bargaining position by making them
more eager to reach agreement. To illustrate this, suppose a health plan puts together a network
5 John Nash, (1950) “The Bargaining Problem,” Econometrica, Volume 18, pp. 155-162. See also Froeb, Luke and
Brian T. McCann, Managerial Economics: A Problem Solving Approach, Thomson South-Western, 2008, Chapter
14.

6
of hospitals to serve its client base. The health plan bargains with individual hospitals over
whether to include them in the network and what price it will charge if included in the network.
To make this concrete, one can imagine that the health plan plays the hospitals off against each
other by threatening to include only one of them in the network. But whether or not the threat is
explicit, it is clear that the alternative to reaching agreement with one hospital is agreement with
the other. If the hospitals are close substitutes, then the health insurer has a good alternative to
reaching agreement with one of the hospitals — it can reach agreement with the other. But if the
two hospitals merge and bargain jointly, the health insurer’s alternatives become much worse.
The loss in competition due to merger is big if the merging hospitals are close substitutes and the
non-merging hospitals are worse substitutes.
When there is only one hospital that is easily accessible by patients, negotiated rates are
likely to be higher than they would otherwise be. Thus, a critical determinant of the hospital
rates negotiated by a health plan is the availability of multiple hospitals that the health plan’s
subscribers would consider reasonably close substitutes for one another. For example, in Hot
Springs, Arkansas the only two acute care hospitals abandoned their plans to merge when the
FTC indicated it would challenge the merger. The next closest hospitals were in Little Rock,
more than 30 miles away. Presumably the FTC was worried that the merger would increase the
bargaining power of the two Hot Springs hospitals because payors who wanted to sell policies in
Hot Springs would have had to contract with the merged hospital.

7
B. Structural Analysis of Proposed Merger
As noted in the Horizontal Merger Guidelines, market concentration is often a useful
“structural” indicator of likely competitive effects of a merger.6 In evaluating market concentration,
the Guidelines consider both the post-merger level of market concentration and the change in
concentration resulting from a merger. Market concentration is measured using the Herfindahl-
Hirschman Index (“HHI”) which is calculated by summing the squares of the individual market
shares.7 The HHI ranges from 10,000 (equivalent to a single firm) to a number approaching zero
(equivalent to many infinitesimally small firms). In a horizontal context, an acquisition is
presumed likely to create or enhance market power when the post-merger HHI exceeds 2,500
(equivalent to four independent firms) points and the acquisition increases the HHI by more than
200 points.8
A structural analysis of a proposed merger begins with market delineation. Antitrust
market delineation is a tool for identifying markets in which firms have the ability to exercise
market power.9 Thus, when delineating a market, one should be mindful of the reason for
undertaking the exercise. Since our focus is on assessing the competitive effect of a merger
among competing acute care hospital systems, and because there are few viable substitutes for
acute care delivered at a hospital, we define the relevant product market to be the cluster of acute
care services for inpatient hospital care. This definition is consistent with the economic literature
6 U.S Department of Justice and Federal Trade Commission, Horizontal Merger Guidelines (issued August 19,
2010), (hereinafter “Guidelines”), Section 5.3.
7 For example, a market consisting of four firms with market shares of 30 percent, 30 percent, 20 percent, and 20
percent has an HHI of 2,600 (302 + 302 +202 + 202).
8 Merger Guidelines, Section 1.51.
9See, for example, G. J. Werden (1992), “Four Suggestions on Market Delineation,” Antitrust Bulletin, vol. 37, pp.
107-121.

8
on hospital mergers and with prior court rulings.10 Although acute care hospitals offer a large
number of differentiated services, basic services available at most acute care hospitals include
normal childbirth, pediatrics, gynecology, general medicine, and general surgical services.
When prices are negotiated, as in the present case, geographic markets are defined by
asking whether a hypothetical monopolist of all the acute-care hospitals in a candidate market
could profitably negotiate price increases of 5 percent, the usual threshold used in delineating an
antitrust market. Thus, we seek to quantify the extent to which consumers consider various
alternatives to be close substitutes for one another.
The extent to which consumers are willing to substitute one hospital for another can be
inferred from past choices that consumers have made. To analyze these choices, we utilized
calendar year 2014 data on commercially-insured inpatients covered by Anthem VA and BCBS-
TN, the largest commercial payors in Virginia and Tennessee, respectively. Anthem VA has
10 See, for example, Gowrisankaran, Gautam, Aviv Nevo, and Robert Town (2015), "Mergers When Prices Are
Negotiated: Evidence from the Hospital Industry." American Economic Review, Vol. 105 No. 1;pp. 172-203; Capps,
Cory, David Dranove, and Mark Satterwaite, (2003) “Competition and Market Power on Option Demand Markets,”
RAND Journal of Economics, Vol. 34, No. 4, pp. 737–763; FTC v. Butterworth Health Corp (1996). Hospital Corp.
of Am., 807 F.2d 1381 (7th Cir. 1986); United States v. Mercy Health Services, 902 F. Supp. 968 (N.D. Iowa
1995), vacated as moot 107 F.3d 632 (8th Cir. 1997); and ProMedica Health Sys., Inc. v. Fed. Trade Comm’n, 749
F.3d 559, 562 (6th Cir. 2014). Some of the court rulings define the product market somewhat more narrowly than
the cluster of acute inpatient hospital care, excluding, for example, tertiary services. Such definitions are likely to
lead higher market shares for the parties than the cluster of all acute inpatient hospital care used here. Therefore, the
approach used here likely understates the market shares of the parties that would be found using the narrower
product market definition used by some courts.

9
negotiated contracts with hospitals located in Virginia and Sullivan County, TN (a county
contiguous to Virginia) and BCBS-TN has negotiated contracts with hospitals in Tennessee.11
To understand how consumers are willing to substitute one hospital for another, for each
merging acute care hospital shown in Table 1, we first determined the ZIP codes that comprised
the hospital’s 90 percent inpatient draw area.12 We then determined the other (non-merging)
hospitals serving inpatients from those ZIP codes. Specifically, we included all non-merging
acute care hospitals that discharged inpatients to any of the 127 ZIP codes comprising the
combined draw areas of the merging hospitals as long as the non-merging hospital’s share of
total discharges equal or exceed one percent of the combined discharges from all merging
hospitals. Fourteen non-merging hospitals met this criterion; their ownership and other
characteristics are shown in Table 2. As shown in Figure 2, the competitive alternatives to the
merging hospitals are generally located to the southwest and northeast of the merging hospitals.
Our resulting database contained 15,244 inpatient discharges residing in 127 ZIP codes.13
11 Data on inpatient discharges from Virginia hospitals were obtained from Virginia Health Information (“VHI”).
VHI's patient level database system includes patient demographic, administrative, clinical, and financial information
on every discharge that occurs in Virginia licensed hospitals (see http://www.vhi.org/pld.asp). We use discharges
designated as Anthem – BCBS. Since the VHI inpatient discharge database includes discharges from Virginia
hospitals only, we use internal Anthem VA data for its covered discharges from the Wellmont and Mountain States
hospitals under contract with Anthem VA located in Sullivan County, Tennessee. Because inpatient discharge data
were not readily available from the State of Tennessee, internal BCBS-TN data were used to identify BCBS-TN
covered inpatients discharged from hospitals in Tennessee. Other data sources used in our study include Centers for
Medicare and Medicaid Services (“CMS”) Healthcare Provider Reporting Information System (“HCIS”) and
Provider of Services files (for hospital characteristics); American Hospital Directory (for hospital location,
ownership, facility type, and Medicare discharges), and Google Maps (for travel times).
12 Specifically, the ZIP codes to which each hospital discharged inpatients were sorted from largest to smallest in
terms of total inpatient discharges. Starting with the ZIP code with the largest number of discharges, other ZIP
codes were added until the limit of 90 percent of total discharges was reached.
10
Figure 3 depicts the share of discharges by ZIP code for Wellmont, Mountain States, and
all competing hospitals combined. The relative size of the circles shown in the figure reflect
differences in the number of inpatient discharges across ZIP codes. For each ZIP code, the
shares of the merging systems are denoted in red for Wellmont, blue for Mountain States, and
yellow for non-merging, competing hospitals. Figure 3 shows that the merging systems are the
two most frequently chosen alternatives for Anthem VA and BCBS-TN covered inpatients in
most of the ZIP codes contained in the combined draw areas of the merging hospitals. To
illustrate this point further, in Figure 4 the combined share of the merging firm is shown in black.
As shown in the figure, the merged firm has a dominant share in many of the ZIP codes that
comprise Northeast Tennessee and Southwest Virginia. Using each hospital’s share of inpatient
discharges, and accounting for common ownership, the pre-merger and post-merger HHIs are
3,436 and 5,987, respectively (see Table 3). Another way to measure the magnitude of the
merger is to look at the combined share of the merging firm. The share of the combined firm is
77 percent. In sum, the merger creates what looks like a “must have” hospital system, in that it
would be difficult for a payor to put together a viable provider network in the draw area that did
not include the merged hospital. Table 3 also reports the pre-merger and post-merger HHIs for
the 90 percent draw area of each merging hospital. The post-merger HHI for the individual
hospital draw areas all exceed 2,500 points and increases in the HHI range from 1,313 to 4,387.
Since both Anthem-VA and BCBS-TN may incur additional costs when customers go to
an out-of-state hospital, each generally prefers that patients choose facilities with whom they
13 Each DRG may be a separate relevant product market, but we aggregate all DRGs for convenience. To the extent
that the merging parties may not offer all of the included services, we are likely under-reporting their shares and the
increase in concentration following merger.

11
contract in their respective states.14 (Specifically, these costs include an “access charge” paid to
the health plan (e.g., Anthem VA or BCBS-TN) that processes the claim and a potentially higher
reimbursement rate.) For this reason, we also calculated pre-merger and post- merger HHIs
separately for the inpatients covered by Anthem VA and the inpatients covered by BCBS-TN.
Using data describing the hospital choices made by Anthem VA covered inpatients, the pre-
merger and post-merger HHIs are 2,989 and 4,768, respectively. The hospitals chosen by the
inpatients covered by Anthem VA are shown in Table 4. Figures 5 and 6 show the location of
the hospitals and their shares by ZIP code. Figure 7 highlights the combined share of the merged
system.
Using data describing the hospital choices made by BCBS-TN covered inpatients, the
pre-merger and post-merger HHIs are 3,780 and 6,674, respectively (see Table 6). The hospitals
chosen by the inpatients covered by BCBS-TN are shown in Table 7. Figures 8 and 9 show the
location of the hospitals and their shares by ZIP code, and Figure 7 highlights the combined
share of the merged system
The above analysis excludes hospitals located in Kentucky and North Carolina as
potential alternatives for inpatients residing in the draw areas of the merging hospitals. We
understand, from conversations with market participants, that few inpatients located in Virginia
and Tennessee travel to Kentucky and North Carolina for hospital care. To check this, we
utilized data available from American Hospital Directory (“AHD”), which reports Medicare
discharges from all hospitals by ZIP code. Using the Medicare discharges reported by AHD, we
identified the ZIP codes to which the merging hospitals discharged Medicare inpatients. For
14 As a licensee of the BCBS association, each plan has restrictions with respect to contracting with hospitals for
Blue-branded business in counties that are not within its licensed service area (which in this case is defined by state
boundaries) or which are not contiguous to the service area.

12
each of these ZIP codes (128 in total), we identified all other hospitals that discharged Medicare
inpatients to those ZIP codes, including hospitals located in Virginia, Tennessee, Kentucky, and
North Carolina. We found that only 3 percent of the Medicare inpatients in the combined draw
area of the merging systems chose hospitals in Kentucky and only 3 percent chose hospitals
located in North Carolina. Using each hospital’s share of Medicare inpatient discharges, and
accounting for common ownership, the pre-merger and post-merger HHIs become 2,967 and
5,701, respectively in the combined draw area of the merging systems (see Table 8). The share
of the combined system is 75 percent. Thus, concentration estimates reported using the
Medicare data are consistent with those calculated using Anthem VA and BCBS-TN covered
inpatients, and the omission of discharges from Kentucky and North Carolina hospitals would be
unlikely to change conclusions drawn from our analysis of the Anthem VA and BCBS-TN data.
An important factor in assessing the competitive implications of the structural indicators
described above is ease of entry into the relevant market. As noted in the Guidelines, if entry is
easy and sufficiently rapid, a firm’s high prices will return to competitive levels as entrants,
enticed by above-competitive profits, enter the market. Because of the need to plan, obtain
zoning, licensing, and certificate of need regulatory permits to construct a new hospital, we do
not consider ease of entry as a deterrent to any competitive concerns raised in this context.
Moreover, the profitability of entry is likely lower in lower density areas (such as in rural
Tennessee and Virginia) relative to other locations.
In sum, the structural analysis suggests that the proposed merger would eliminate
substantial competition between the merged hospitals.

13
C. Diversion Analysis to Determine Substitutability between the Merging Hospitals
Diversion analysis is commonly used in antitrust economics to analyze mergers involving
differentiated products. In this case, hospitals are differentiated by a number of factors, including the
type and quality of services offered, as well as location. The diversion ratio between two products, A
and B, measures the extent to which the products are close substitutes for each other. In the context
of hospital mergers, the diversion ratio attempts to estimate the share of inpatients that each merging
hospital would lose to its merging partner and to alternate competing hospitals, if the first hospital
were no longer available to inpatients as an option.15 Stated differently, in evaluating a merger
between hospitals A and B, hospital B would be considered a close substitute to hospital A if a high
share of inpatients would switch to B if hospital A were no longer available. Merging firms that are
close substitutes to each other present a greater likelihood that post-merger price would increase as a
result of the increase in bargaining power. That is, in a scenario where the hospitals bargain with a
health insurer, a merger between two such hospitals has the potential to increase the bargaining
power of the merged hospital relative to the health insurer, given that the merger eliminates
competition between the merging systems.
Since the diversion analysis is based on patient choice, to implement the diversion analysis
we first estimated a model of individual hospital choices to understand how inpatients select the
hospital they use.16 In doing so, we examined how the choices among available hospitals are
influenced by the characteristics of the patient (e.g., age and gender), of the hospital (e.g., bed
capacity, teaching status, and measures of quality), the driving time to each hospital (expressed in
15 See, for example, Farrell, Joseph, David Balan, Keith Brand, and Brett Wendling, (2011), “Economics at the FTC:
Hospital Mergers, Authorized Generic Drugs, and Consumer Credit Markets,” Review of Industrial Organization,
Vol. 39, No. 4. pp. 271-296.
16 We adopt a standard conditional logit specification based on the random utility model (see Appendix B). The
specification allows the disutility of travel time to vary by the characteristics of the inpatient, including the clinical
condition of the inpatient (see Table 9 and the model’s variable glossary in Appendix A).

14
minutes), the clinical treatment sought by the inpatients (e.g., the Diagnosis-Related Group
(“DRG”)), and the match between the service sought by the inpatient and the services provided by
the hospital. The information obtained from the estimated choice model is then used to predict how
inpatient choices would change if a hospital involved in the proposed merger were no longer
available. That is, by excluding a merging hospital as an option, the model is used to determine the
proportion of inpatients that would switch to other competing hospitals, including those of the
proposed merging partner.17
We estimated our choice model using data describing the hospital choices of 15,244 Anthem
VA and BCBS-TN inpatients that reside in the ZIP codes that comprise the 90 percent draw areas of
the merging hospitals. The set of hospital alternatives include the merging Wellmont and Mountain
State acute-care hospitals and the fourteen competing acute care hospitals shown in Table 2 above.
The estimated choice model of hospital choice is presented in Table 9. We used the parameter
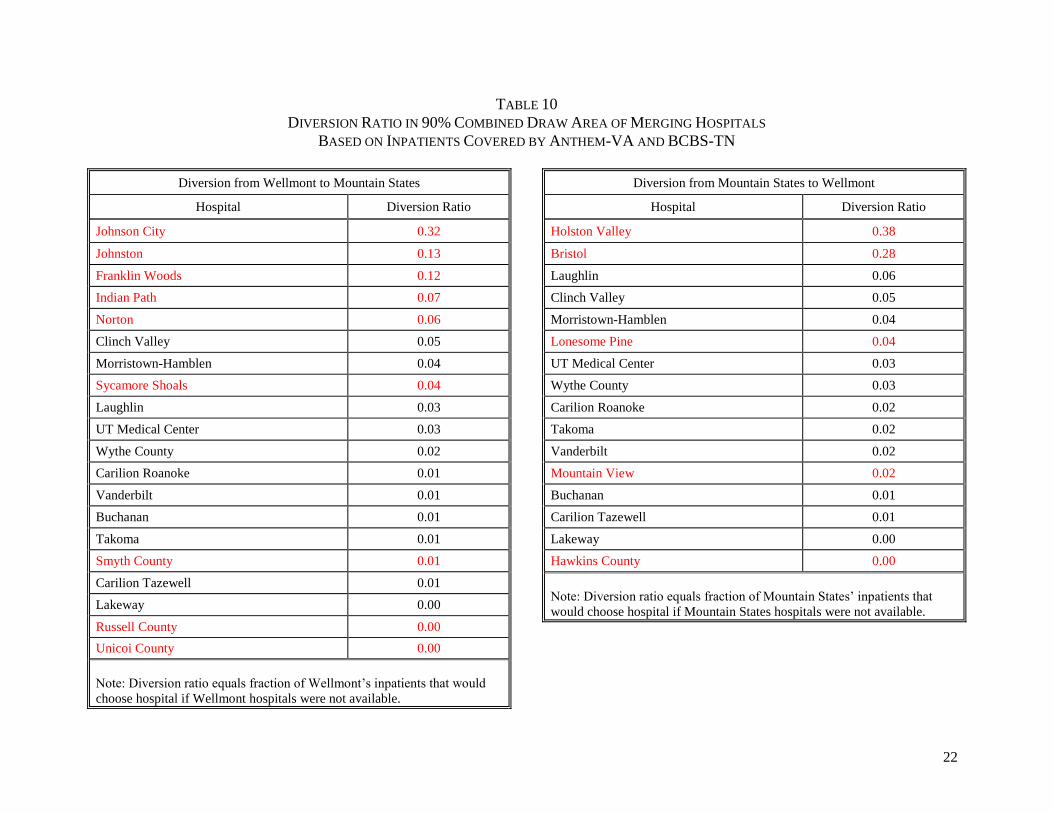
estimates from the choice model to calculate the diversion ratios shown in Tables 10-13. Using the
covered inpatients of Anthem VA and BCBS-TN, the left panel of Table 10 reports diversion from
Wellmont to Mountain States when the Wellmont hospitals are hypothetically excluded from the
choice set. The hospital names shown in red font are those of Wellmont’s merging partner,
Mountain States. From the table, it is apparent the Mountain States hospitals are close substitutes to
the Wellmont hospitals. The five largest diversion ratios are all associated with a Mountain States
hospital and combined they account for 70 percent of the diversion from Wellmont. Overall, the
diversion from to Mountain States from Wellmont is 75 percent. Similarly, as shown in the right
panel of Table 10, the overall diversion from Mountain States to Wellmont is significant (72
17 The diversion ratio between two hospitals, A and B, when A is hypothetically removed from the choice set, is
calculated as follows: 𝐷𝑖𝑣𝑒𝑟𝑠𝑖𝑜𝑛 𝑅𝑎𝑡𝑖𝑜𝐴→𝐵 =(𝑆ℎ𝑎𝑟𝑒 𝑜𝑓 𝐻𝑜𝑠𝑝𝑖𝑡𝑎𝑙 𝐵,𝑜𝑛 𝑒𝑥𝑐𝑙𝑢𝑠𝑖𝑜𝑛 𝑜𝑓 𝐻𝑜𝑠𝑝𝑖𝑡𝑎𝑙 𝐴 − 𝑆ℎ𝑎𝑟𝑒 𝑜𝑓 𝐻𝑜𝑠𝑝𝑖𝑡𝑎𝑙 𝐵)
(𝑆ℎ𝑎𝑟𝑒 𝑜𝑓 𝐻𝑜𝑠𝑝𝑖𝑡𝑎𝑙 𝐴).

15
percent). The two largest diversion ratios are associated with Wellmont hospitals and combined they
account for 66 percent of the diversion from Mountain States.
We also used the estimated choice model to examine how our diversion analysis would
change if we included six Kentucky acute care hospitals that appear in our analysis of Medicare data.
As noted above, few (less than 3 percent) Medicare inpatients residing in the combined draw areas of
the merged hospitals chose to travel to a Kentucky for hospital care. As shown in Table 11, the
diversion results discussed above are only slightly changed when the Kentucky hospitals are
considered a competitive alternative and included in the diversion analysis.
Tables 12 reports diversion ratios using the inpatients covered by Anthem-VA and the set of
hospitals (merging and non-merging) chosen by them. Table 13 reports diversion ratios using the
inpatients covered by BCBS-TN and the set of hospitals they selected. The diversion ratios shown in
these tables tell a similar story: the Wellmont and Mountain States systems are each other’s closest
competitors.
D. Willingness to Pay (“WTP”) Analysis
The FTC uses WTP analysis as a tool to evaluate the competitive effects of hospital
mergers.18 The approach is based on a model of “two-stage hospital competition” characterizing
the interaction among hospitals, health insurers, and health plan enrollees. In the first stage of
the two-stage model, hospitals negotiate with health insurers to be included in their networks.
Negotiations over the rates a health insurer pays for services occur between each hospital or
hospital system and the outcome of the bargaining process are prices that reflect the relative
18 See, for example, Opinion of the Commission, In the Matter of ProMedica Health System, Inc., Docket No. 9346;
Complaint Counsel’s Pre-Trial Brief, In the Matter of the OSF Healthcare System and Rockford Health System,
Docket No. 9349, and Farrell, Joseph, David Balan, Keith Brand, and Brett Wendling, (2011), “Economics at the
FTC: Hospital Mergers, Authorized Generic Drugs, and Consumer Credit Markets,” Review of Industrial
Organization, Vol. 39, No. 4. pp. 271-296.

16
value added to the health insurer’s network by each hospital. In the second stage, hospitals
compete among themselves to provide care to a health plan’s members. Since a patient who
becomes sick generally has strong financial incentives to choose among hospitals available in the
network of its previously chosen heath plan, the model assumes that there are no payment
differences among hospitals in the network and non-price factors (such as the hospitals location
and other attributes) determine which hospitals are chosen.
In this framework, health plans construct networks that take into account the preferences
of their prospective enrollees, and a hospital is added to a payer network if the incremental
benefit of having the additional hospital as an option to subscribers exceeds the incremental cost
to enrollees. The incremental cost to enrollees is represented by the insurance premium which is
assumed to reflect the rates expected to be paid to the hospital. The incremental benefit of
adding a new hospital to the network is measured as the additional benefit of each of its enrollees
from using that new hospital in its network. An enrollee located far from a particular hospital, or
who considers the hospital relatively unattractive, would have a low probability of actually using
the hospital, and would place a low value on its inclusion in the network. Thus, each hospital’s
negotiating position (bargaining power) reflects the incremental value it offers to enrollees for
being in the network. That incremental value is determined by the availability of and
attractiveness of substitute hospitals for health plan members. The better are the substitute
hospitals (location, quality), the less incremental value another hospital adds. The value to the
enrollees of having the additional hospital as an option is referred to as the “willingness to pay”
for that hospital (or for the network of hospitals included in a system).
The logic of this framework suggests that when the merging hospitals are close
substitutes to each other, each hospital’s pre-merger bargaining power is attenuated by the ability

17
of a health plan to move patients to its rival. A merger among two substitute hospitals would
increase the combined hospital’s bargaining power because it eliminates this ability.
The change in price related to the merger is a function of the incremental value of the
merged entity being in the network relative to the incremental value of either hospital separately
being in the network. In this context, price refers to the amount a health plan pays hospitals for
services provided to its plan members. Prior research has examined the relationship between
hospital prices and the incremental value of adding a hospital to a network. For example, in their
study of hospital merger cases, Fourier and Gai (2007) found the overall (across all DRGs)
elasticity of price with respect to WTP to be in the range of 0.63 to 0.68. This means that a
hospital merger that increases WTP by 10% would raise post-merger prices by 6.3%.
Using the estimated model of hospital choice presented above, the predicted change in
WTP resulting from the combination of the Wellmont and Mountain States hospital systems is
shown in Table 14 for a range of assumptions regarding the elasticity of price with respect to
WTP19 The WTP estimates were calculated using the inpatient discharges for Anthem VA and
BCBS-TN combined, and separately using inpatient discharges for Anthem VA and BCBS-TN.
The WTP analysis shows the merger significantly increases the bargaining position of the
merged hospitals because inpatients in the draw areas of the merging hospitals view the merging
hospitals as very close substitutes, confirmed by the estimated diversion ratios presented above.
As shown in the table, for a range of assumptions regarding the elasticity of price with respect to
WTP (including conservative values significantly below those in the published literature), large
post-merger price increases are predicted (see Table 14).
19 See Appendix B for a detailed description of the WTP formulas derived from the hospital choice model.

18
In sum, the large predicted price increase (12 percent at the low end and ranging to 130
percent at the high end) resulting from the WTP approach illustrates that the bargaining position
of the merged hospital system is substantially improved because it would be difficult for payers
to turn to a desirable alternative hospital network that excluded the two merging hospitals
systems.
It is important to note that this analysis, as is true with any such analysis, has its
limitations. The WTP analysis and the other tools to evaluate the competitive effects of the
proposed merger are not without criticism. The benefit of the diversion ratio and WTP analysis
is they attempt to estimate the effect of the merger on prices negotiated between health insurers
and hospitals without the need to explicitly define geographic markets. Critics have noted that
errors in the WTP framework include the reliability of the hospital choice model (including its
strong reliance on travel time as a determinant of hospital choice) and the measurement of the
relationship between WTP and hospital prices. While such criticisms may affect the magnitude
of precise price predictions, because this merger is so big, they do not change the conclusion that
the merger would lead to large hospital price increases for consumers in the Southwest Virginia-
Northeast Tennessee markets affected.
III. Conclusion
To evaluate the likely competitive effects of the proposed merger between Wellmont and
Mountain States, we have performed three different empirical analyses that show (1) how the
proposed merger changes the structure of the market for inpatient services provided by hospitals
in relevant geographic markets, (2) the extent to which the merging hospitals are close

19
substitutes for each other, and (3) the extent to which the merger affects bargaining between
health plans and hospitals and, ultimately, hospital prices.
The results all three analyses say the same thing: this merger is anticompetitive.
Concentration would increase well beyond the thresholds considered anticompetitive by
competition agencies. The observed hospital choices of inpatients residing in Northeastern
Tennessee and Southeast Virginia show the merging systems are close substitutes and a merger
of the combined systems would give the merged system significant bargaining power that would
likely lead to significantly higher post-merger prices.

TABLES AND FIGURES

1
TABLE 1
MERGING HOSPITALS AND THEIR CHARACTERISTICS
Hospital System County State
Type of
Facility
Teaching
Status
Medicare
Certified
Beds
For-
Profit
Status
Nearest
Competing
Hospital
Travel
Minutes to
Nearest
Competing
Hospital
Second-
Nearest
Competing
Hospital
Travel
Minutes to
Second-
Nearest
Competing
Hospital
Sycamore
Shoals
MSHA Carter TN Acute
Care
N 109 N Holston
Valley
36 Bristol
Regional
37
Johnson
County
MSHA Johnson TN Critical
Access
N 2 N Bristol
Regional
59 Wythe
County
78
Indian Path MSHA Sullivan TN Acute
Care
Y 300 N Holston
Valley
8 Bristol
Regional
22
Unicoi
County
MSHA Unicoi TN Acute
Care
N 48 N Laughlin
Memorial
43 Holston
Valley
46
Johnson City MSHA Washington TN Acute
Care
Y 480 N Holston
Valley
31 Bristol
Regional
36
Franklin
Woods
MSHA Washington TN Acute
Care
N 139 N Holston
Valley
27 Bristol
Regional
32
Niswonger MSHA Washington TN Childrens Y N/A N Holston
Valley
31 Bristol
Regional
36
Quillen MSHA Washington TN Rehab. Y N/A N Holston
Valley
27 Bristol
Regional
32
Woodridge MSHA Washington TN Psych. Y N/A N Holston
Valley
33 Bristol
Regional
38
Dickenson MSHA Dickenson VA Critical
Access
N 25 N Mountain
View
36 Lonesome
Pine
47
Norton MSHA Norton VA Acute
Care
Y 129 N Mountain
View
6 Lonesome
Pine
14
Russell
County
MSHA Russell VA Acute
Care
N 78 N Clinch
Valley
34 Bristol
Regional
45
Smyth
County
MSHA Smyth VA Acute
Care
N 170 N Wythe
County
31 Bristol
Regional
51
Johnston
Memorial
MSHA Washington VA Acute
Care
N 116 N Bristol
Regional
24 Holston
Valley
46
2
TABLE 1 (CONT.)
MERGING HOSPITALS AND THEIR CHARACTERISTICS
Hospital System County State
Type of
Facility
Teaching
Status
Medicare
Certified
Beds
For-
Profit
Status
Name of
Nearest
Hospital
Travel
Minutes to
Nearest
Hospital
Name of
Second
Nearest
Hospital
Travel
Minutes to
Second
Nearest
Hospital
Hancock
County
Wellmont Hancock TN Critical
Access
N 25 N Lakeway
Regional
46 Morristown
-Hamblen
46
Hawkins
County
Wellmont Hawkins TN Acute
Care
N 50 N Lakeway
Regional
37 Morristown
-Hamblen
37
Bristol
Regional
Wellmont Sullivan TN Acute
Care
Y 282 N Indian
Path
23 Johnston
Memorial
25
Holston
Valley
Wellmont Sullivan TN Acute
Care
Y 519 N Indian
Path
8 Franklin
Woods
28
Mountain
View
Wellmont Norton VA Acute
Care
N 118 N Norton 6 Russell
County
50
Lonesome
Pine
Wellmont Wise VA Acute
Care
Y 60 N Norton 14 Indian
Path
48
Sources: American Hospital Directory (Hospital, System, County, State, Type of Facility); CMS HCRIS data (Teaching Status); CMS POS data (Medicare
Certified Beds, For-Profit Status); Google Maps (Travel Minutes).
Note: Bold red font indicates hospitals that belong to a merging party.
3
FIGURE 1
LOCATION OF MERGING HOSPITALS
Source: AHD
Note: Names with “*” depict non-short term acute care hospitals.

4
TABLE 2
CHARACTERISTICS OF COMPETING HOSPITALS IN 90% COMBINED DRAW AREA OF MERGING HOSPITALS
BASED ON INPATIENTS COVERED BY ANTHEM-VA AND BCBS-TN
Hospital System County State
Type of
Facility
Teaching
Status
Medicare
Certified Beds
For-Profit
Status
Roanoke Memorial Carilion Roanoke VA Acute Care Y 703 N
Tazewell Community Carilion Tazewell VA Acute Care N 238 N
Lakeway Regional CHS Hamblen TN Acute Care N 135 Y
Morristown-Hamblen Covenant Hamblen TN Acute Care N 155 N
Clinch Valley LifePoint Tazewell VA Acute Care N 175 Y
Wythe County LifePoint Wythe VA Acute Care N 100 N
Vanderbilt University Vanderbilt University Davidson TN Acute Care Y 985 N
Laughlin Memorial N/A Greene TN Acute Care N 140 N
Takoma Regional N/A Greene TN Acute Care N 94 N
University of Tennessee N/A Knox TN Acute Care Y 581 N
Buchanan General N/A Buchanan VA Acute Care N 134 N
Sources: American Hospital Directory (Hospital, System, County, State, Type of Facility); CMS HCRIS data (Teaching Status); CMS POS data
(Medicare Certified Beds, For-Profit Status).

5
FIGURE 2
LOCATION OF MERGING AND COMPETING HOSPITALS IN 90% COMBINED DRAW AREA OF MERGING HOSPITALS
BASED ON INPATIENTS COVERED BY ANTHEM-VA AND BCBS-TN
Sources: AHD; CMS Provider of Services File (June 2015); Virginia Health Information PLD (2014); BCBS internal data; Anthem internal data.
Note: Short term acute care hospital locations only. Height of bars indicate the relative number of hospital beds.

6
FIGURE 3
MERGING AND COMPETING HOSPITAL DISCHARGES IN 90% COMBINED DRAW AREA OF MERGING HOSPITALS
BASED ON INPATIENTS COVERED BY ANTHEM-VA AND BCBS-TN
Sources: AHD; CMS Provider of Services File (June 2015); Virginia Health Information PLD (2014); BCBS internal data; Anthem internal data.
Note: Short term acute care hospital locations only. Height of bars indicate the relative number of hospital beds.

7
FIGURE 4
MERGING AND COMPETING HOSPITAL DISCHARGES IN 90% COMBINED DRAW AREA OF MERGING HOSPITALS
BASED ON INPATIENTS COVERED BY ANTHEM-VA AND BCBS-TN
Sources: AHD; CMS Provider of Services File (June 2015); Virginia Health Information PLD (2014); BCBS internal data; Anthem internal data.
Note: Short term acute care hospital locations only. Height of bars indicate the relative number of hospital beds.

8
TABLE 3
STRUCTURAL CONCENTRATION IN 90% COMBINED DRAW AREA OF MERGING HOSPITALS
BASED ON INPATIENTS COVERED BY ANTHEM-VA AND BCBS-TN
Geographic Market
Pre-Merger
HHI
Post-
Merger
HHI
Change in
HHI
Combined
Firm Share
(%)
90% Draw Area:
Johnson City 4,607 7,834 3,227 88.4
Holston Valley 3,822 6,978 3,157 83.3
Bristol Regional 4,117 7,348 3,231 85.4
Franklin Woods 5,097 7,963 2,866 89.1
Indian Path 4,483 8,519 4,037 92.3
Russell County 3,475 6,500 3,024 79.7
Johnston Memorial 3,825 7,117 3,292 83.8
Sycamore Shoals 7,788 9,101 1,313 95.4
Unicoi County 7,166 9,205 2,039 95.9
Hawkins County 2,680 4,494 1,814 64.3
Lonesome Pine 4,351 8,635 4,284 92.9
Norton Community 4,490 8,662 4,172 93.0
Mountain View 4,574 8,961 4,387 94.6
Smyth County 4,990 6,893 1,903 82.4
Combined 3,436 5,987 2,551 77.0
Source: AHD; BCBS internal data; Virginia Health Information PLD (2014); Anthem internal
data.

9
TABLE 4
STRUCTURAL CONCENTRATION IN 90% COMBINED DRAW AREA OF MERGING HOSPITALS
BASED ON INPATIENTS COVERED BY ANTHEM-VA
Geographic Market
Pre-Merger
HHI
Post-
Merger
HHI
Change in
HHI
Combined
Firm Share
(%)
90% Draw Area:
Bristol Regional 3,111 4,853 1,743 66.8
Russell County 3,244 4,851 1,607 66.4
Johnston Memorial 4,044 6,014 1,969 76.1
Holston Valley 3,263 6,068 2,804 76.7
Indian Path 4,026 7,864 3,838 88.5
Norton Community 4,400 8,441 4,041 91.8
Lonesome Pine 4,275 8,462 4,187 91.9
Mountain View 4,642 8,954 4,311 94.6
Smyth County 5,260 6,245 985 77.9
Combined 2,989 4,768 1,779 66.0
Source: AHD; Virginia Health Information PLD (2014); Anthem internal data.

10
TABLE 5
CHARACTERISTICS OF MERGING AND COMPETING HOSPITALS IN 90% DRAW AREA OF MERGING HOSPITALS
BASED ON INPATIENTS COVERED BY ANTHEM-VA
Hospital System County State Type of Facility
Teaching
Status
Medicare Certified
Beds
For-Profit
Status
Indian Path MSHA Sullivan TN Acute Care Y 300 N
Norton MSHA Norton VA Acute Care Y 129 N
Russell County MSHA Russell VA Acute Care N 78 N
Smyth County MSHA Smyth VA Acute Care N 170 N
Johnston MSHA Washington VA Acute Care N 116 N
Bristol Regional Wellmont Sullivan TN Acute Care Y 282 N
Holston Valley Wellmont Sullivan TN Acute Care Y 519 N
Mountain View
Regional Wellmont Norton VA Acute Care N 118 N
Lonesome Pine Wellmont Wise VA Acute Care Y 60 N
New River Valley Carilion Montgomery VA Acute Care N 146 N
Roanoke Carilion Roanoke VA Acute Care Y 703 N
Tazewell Carilion Tazewell VA Acute Care N 238 N
Clinch Valley LifePoint Tazewell VA Acute Care N 175 Y
Wythe County LifePoint Wythe VA Acute Care N 100 N
University of Virginia University of Virginia Charlottesville VA Acute Care Y 622 N
Buchanan N/A Buchanan VA Acute Care N 134 N
Sources: American Hospital Directory (Hospital, System, County, State, Type of Facility); CMS HCRIS data (Teaching Status); CMS POS data (Medicare
Certified Beds, For-Profit Status); Virginia Health Information PLD (2014); Anthem internal data.

11
FIGURE 5
LOCATION OF MERGING AND COMPETING HOSPITALS IN 90% DRAW AREA OF MERGING HOSPITALS
BASED ON INPATIENTS COVERED BY ANTHEM-VA
Sources: AHD; CMS Provider of Services File (June 2015); Virginia Health Information PLD (2014); Anthem internal data.
Note: Short term acute care hospital locations only. Height of bars indicate the relative number of hospital beds.

12
FIGURE 6
MERGING AND COMPETING HOSPITAL DISCHARGES IN 90% COMBINED DRAW AREA OF MERGING HOSPITALS
BASED ON INPATIENTS COVERED BY ANTHEM-VA
Sources: AHD; CMS Provider of Services File (June 2015); Virginia Health Information PLD (2014); Anthem internal data.
Note: Short term acute care hospital locations only. Height of bars indicate the relative number of hospital beds.

13
FIGURE 7
MERGING AND COMPETING HOSPITAL DISCHARGES IN 90% COMBINED DRAW AREA OF MERGING HOSPITALS
BASED ON INPATIENTS COVERED BY ANTHEM-VA
Sources: AHD; CMS Provider of Services File (June 2015); Virginia Health Information PLD (2014); Anthem internal data.
Note: Short term acute care hospital locations only. Height of bars indicate the relative number of hospital beds.

14
TABLE 6
STRUCTURAL CONCENTRATION IN 90% COMBINED DRAW AREA OF MERGING HOSPITALS
BASED ON INPATIENTS COVERED BY BCBS-TN
Geographic Market
Pre-Merger
HHI
Post-Merger
HHI
Change in
HHI
Combined
Firm Share
(%)
90% Draw Area:
Johnson City 4,661 8,017 3,356 89.4
Holston Valley 3,852 6,818 2,966 82.2
Franklin Woods 5,158 7,987 2,829 89.2
Indian Path 4,547 8,510 3,963 92.2
Bristol Regional 5,007 9,241 4,233 96.1
Sycamore Shoals 7,845 9,151 1,306 95.6
Unicoi County 7,241 9,260 2,020 96.2
Hawkins County 2,632 4,383 1,751 63.3
Combined 3,780 6,674 2,894 81.3
Source: AHD; BCBS internal data.

15
TABLE 7
CHARACTERISTICS OF MERGING AND COMPETING HOSPITALS IN 90% DRAW AREA OF MERGING HOSPITALS
BASED ON INPATIENTS COVERED BY BCBS-TN
Hospital System County State Type of Facility
Teaching
Status
Medicare Certified
Beds
For-Profit
Status
Sycamore Shoals MSHA Carter TN Acute Care N 109 N
Indian Path MSHA Sullivan TN Acute Care Y 300 N
Unicoi County MSHA Unicoi TN Acute Care N 48 N
Franklin Woods MSHA Washington TN Acute Care N 139 N
Johnson City MSHA Washington TN Acute Care Y 480 N
Hawkins County Wellmont Hawkins TN Acute Care N 50 N
Bristol Regional Wellmont Sullivan TN Acute Care Y 282 N
Holston Valley Wellmont Sullivan TN Acute Care Y 519 N
Lakeway CHS Hamblen TN Acute Care N 135 Y
Physicians Regional CHS Knox TN Acute Care N 610 Y
Morristown-Hamblen Covenant Hamblen TN Acute Care N 155 N
Vanderbilt University Vanderbilt University Davidson TN Acute Care Y 985 N
Laughlin N/A Greene TN Acute Care N 140 N
Takoma N/A Greene TN Acute Care N 94 N
University of
Tennessee N/A Knox TN Acute Care Y 581 N
Sources: American Hospital Directory (Hospital, System, County, State, Type of Facility); CMS HCRIS data (Teaching Status); CMS POS data (Medicare
Certified Beds, For-Profit Status); BCBS internal data.

16
FIGURE 8
LOCATION OF MERGING AND COMPETING HOSPITALS IN 90% DRAW AREA OF MERGING HOSPITALS
BASED ON INPATIENTS COVERED BY BCBS-TN
Sources: AHD; CMS Provider of Services File (June 2015); BCBS internal data.
Note: Short term acute care hospital locations only. Height of bars indicate the relative number of hospital beds.

17
FIGURE 9
MERGING AND COMPETING HOSPITAL DISCHARGES IN 90% COMBINED DRAW AREA OF MERGING HOSPITALS
BASED ON INPATIENTS COVERED BY BCBS-TN
Sources: AHD; CMS Provider of Services File (June 2015); BCBS internal data.
Note: Short term acute care hospital locations only. Height of bars indicate the relative number of hospital beds.

18
FIGURE 10
MERGING AND COMPETING HOSPITAL DISCHARGES IN 90% COMBINED DRAW AREA OF MERGING HOSPITALS
BASED ON INPATIENTS COVERED BY BCBS-TN
Sources: AHD; CMS Provider of Services File (June 2015); BCBS internal data.
Note: Short term acute care hospital locations only. Height of bars indicate the relative number of hospital beds.

19
TABLE 8
STRUCTURAL CONCENTRATION IN COMBINED DRAW AREA OF MERGING HOSPITALS
BASED ON INPATIENTS COVERED BY MEDICARE
Geographic Market Pre-Merger HHI Post-Merger HHI Change in HHI Combined Firm Share (%)
Draw Area:
Johnson City 3,582 6,830 3,248 82.3
Holston Valley 3,634 7,106 3,471 84.1
Bristol Regional 3,784 7,490 3,706 86.2
Indian Path 4,551 8,833 4,283 93.9
Franklin Woods 5,107 8,258 3,151 90.7
Sycamore Shoals 5,640 9,705 4,065 98.5
Johnston Memorial 4,085 8,085 4,000 89.7
Norton Community 4,691 9,357 4,667 96.7
Russell County 4,707 7,861 3,154 88.1
Lonesome Pine 4,964 9,718 4,754 98.6
Smyth County 3,590 5,150 1,560 69.2
Unicoi County 8,967 9,842 875 99.2
Hawkins County 4,813 6,216 1,403 78.0
Combined 2,967 5,701 2,734 75.0
Source: AHD; CMS Provider of Services data (June 2015).

20
TABLE 9
HOSPITAL CHOICE MODEL
Variable Parameter
Driving Time (minutes) -0.0922958
Driving Time Squared 0.0000577
Teaching Hospital -0.533981
Teaching*Male -0.0092189 *
Teaching*Length of Stay (days) -0.0095582 *
Teaching*Patient Older than 61 Years of Age 0.2046083
Teaching*Patient Younger than 18 Years of Age -0.2726483
Number of Beds 0.0006906
Beds*Male 0.0007159
Beds*Length of Stay (days) 0.000199
Beds*Patient Older than 61 Years of Age 0.0009057
Beds*Patient Younger than 18 Years of Age 0.0009665
For-Profit Hospital (FP) -1.859845
FP*Male 0.370776
FP*Length of Stay (days) -0.0394727 *
FP*Patient Older than 61 Years of Age 0.1848587 *
FP*Patient Younger than 18 Years of Age -0.425434
Nursing Intensity (N) -73.05278
N*Male 19.10245
N*Length of Stay (days) -1.871556
N*Patient Older than 61 Years of Age 8.783048
N*Patient Younger than 18 Years of Age -58.61092
Capital Intensity (C) 0.0304038
C*Male 0.0232912
C*Length of Stay (days) -0.01496
C*Patient Older than 61 Years of Age 0.0943971
C*Patient Younger than 18 Years of Age -0.0923083
Hospital Services:
Cardiology 0.5679328
Labor & Delivery 1.346332
Nervous System 0.4686566
Psychiatric -0.3506205
Transplant 0.2762136
Hospital Services Interacted with Corresponding Patient Treatment Category Based
on MDC:
Cardiology 0.6475583

21
TABLE 9 (CONT.)
HOSPITAL CHOICE MODEL
Variable Parameter
Labor & Delivery 19.22139 *
Nervous System 0.8572154
Psychiatric 5.670516
Driving Time Interacted with Hospital Characteristics:
Teaching Hospital -0.0013858 *
Number of Beds 0.0000578
For-Profit Hospital 0.0114433
Nursing Intensity -0.2429945
Capital Intensity 0.0005666
Driving Time Interacted with Patient Characteristics:
Male 0.000098 *
Length of Stay (days) -0.0000908 *
Patient Older than 61 Years of Age -0.0089102
Patient Younger than 18 Years of Age 0.0012455 *
Driving Time Interacted with Patient Treatment Category Based on MDC:
Circulatory -0.0035003
Obstetrics -0.0155155
Respiratory -0.0246734
Digestive -0.0066864
Musculoskeletal -0.0011332 *
Nervous -0.004803
Kidney -0.0060736
Reproductive -0.0102048
Psychiatric -0.0182139
Hepatobiliary -0.0040826
Endocrine -0.0111445
Infection -0.010393
Skin -0.0253741
Myeloproliferative 0.0181401
Injury -0.0021937 *
ENT -0.0021012 *
Other -0.0010147 *
Notes: All parameters are statistically significant at the 5% level except those marked
by an asterisk. Variable glossary contained in Appendix B.
22
TABLE 10
DIVERSION RATIO IN 90% COMBINED DRAW AREA OF MERGING HOSPITALS
BASED ON INPATIENTS COVERED BY ANTHEM-VA AND BCBS-TN
Diversion from Wellmont to Mountain States
Hospital Diversion Ratio
Johnson City 0.32
Johnston 0.13
Franklin Woods 0.12
Indian Path 0.07
Norton 0.06
Clinch Valley 0.05
Morristown-Hamblen 0.04
Sycamore Shoals 0.04
Laughlin 0.03
UT Medical Center 0.03
Wythe County 0.02
Carilion Roanoke 0.01
Vanderbilt 0.01
Buchanan 0.01
Takoma 0.01
Smyth County 0.01
Carilion Tazewell 0.01
Lakeway 0.00
Russell County 0.00
Unicoi County 0.00
Note: Diversion ratio equals fraction of Wellmont’s inpatients that would
choose hospital if Wellmont hospitals were not available.
Diversion from Mountain States to Wellmont
Hospital Diversion Ratio
Holston Valley 0.38
Bristol 0.28
Laughlin 0.06
Clinch Valley 0.05
Morristown-Hamblen 0.04
Lonesome Pine 0.04
UT Medical Center 0.03
Wythe County 0.03
Carilion Roanoke 0.02
Takoma 0.02
Vanderbilt 0.02
Mountain View 0.02
Buchanan 0.01
Carilion Tazewell 0.01
Lakeway 0.00
Hawkins County 0.00
Note: Diversion ratio equals fraction of Mountain States’ inpatients that
would choose hospital if Mountain States hospitals were not available.

23
TABLE 11
DIVERSION RATIO IN 90% COMBINED DRAW AREA OF MERGING HOSPITALS
BASED ON INPATIENTS COVERED BY ANTHEM-VA AND BCBS-TN (INCLUDING KENTUCKY HOSPITALS)
Diversion from Wellmont to Mountain States
Hospital Diversion Ratio
Johnson City 0.32
Johnston Memorial 0.13
Franklin Woods 0.12
Indian Path 0.07
Clinch Valley 0.04
Norton 0.04
Morristown-Hamblen 0.04
Sycamore Shoals 0.04
Laughlin Memorial 0.03
University of Tennessee 0.02
Wythe County 0.02
Pikeville 0.02
Carilion Roanoke 0.01
Whitesburg ARH 0.01
Takoma Regional 0.01
Smyth County 0.01
Vanderbilt 0.01
Buchanan General 0.01
Carilion Tazewell 0.01
Lakeway Regional 0.00
Harlan ARH 0.00
Russell County 0.00
Middlesboro ARH 0.00
Unicoi County 0.00
UK Chandler 0.00
Hazard ARH 0.00
Note: Diversion ratio equals fraction of Wellmont’s inpatients that would
choose hospital if Wellmont hospitals were not available. ARH hospitals,
Pikeville, and UK Chandler are located in Kentucky.
Diversion from Mountain States to Wellmont
Hospital Diversion Ratio
Holston Valley 0.37
Bristol Regional 0.28
Laughlin Memorial 0.06
Clinch Valley 0.05
Morristown-Hamblen 0.04
University of Tennessee 0.03
Wythe County 0.03
Lonesome Pine 0.03
Carilion Roanoke 0.02
Pikeville 0.02
Takoma Regional 0.02
Vanderbilt 0.01
Whitesburg ARH 0.01
Buchanan General 0.01
Mountain View 0.01
Carilion Tazewell 0.01
Lakeway Regional 0.00
Middlesboro ARH 0.00
Harlan ARH 0.00
UK Chandler 0.00
Hawkins County 0.00
Hazard ARH 0.00
Note: Diversion ratio equals fraction of Mountain States’ inpatients that
would choose hospital if Mountain States hospitals were not available. ARH
hospitals, Pikeville, and UK Chandler are located in Kentucky.

24
TABLE 12
DIVERSION RATIO IN 90% COMBINED DRAW AREA OF MERGING HOSPITALS
BASED ON INPATIENTS COVERED BY ANTHEM-VA
Diversion From Wellmont to Mountain States
Hospital Diversion Ratio
Johnston 0.34
Indian Path 0.20
Norton 0.14
Clinch Valley 0.12
Wythe County 0.05
Carilion Roanoke 0.04
Buchanan 0.03
Smyth County 0.03
Carilion Tazewell 0.02
Carilion New River Valley 0.02
Russell County 0.01
University of Virginia 0.00
Note: Diversion ratio equals fraction of Wellmont’s
inpatients that would choose hospital if Wellmont hospitals
were not available.
Diversion From Mountain States to Wellmont
Hospital Diversion Ratio
Bristol 0.31
Holston Valley 0.28
Clinch Valley 0.12
Lonesome Pine 0.08
Wythe County 0.07
Carilion Roanoke 0.04
Mountain View Regional 0.03
Buchanan 0.03
Carilion Tazewell 0.02
Carilion New River 0.02
University of Virginia 0.00
Note: Diversion ratio equals fraction of Mountain States’
inpatients that would choose hospital if Mountain States
hospitals were not available.

25
TABLE 13
DIVERSION RATIO IN 90% COMBINED DRAW AREA OF MERGING HOSPITALS
BASED ON INPATIENTS COVERED BY BCBS-TN
Diversion from Wellmont to Mountain States
Hospital Diversion Ratio
Johnson City 0.46
Franklin Woods 0.17
Indian Path 0.11
Sycamore Shoals 0.05
Morristown-Hamblen 0.05
Laughlin 0.04
Physicians Regional 0.04
University of Tennessee 0.03
Vanderbilt University 0.02
Takoma 0.02
Lakeway 0.01
Unicoi County 0.00
Note: Diversion ratio equals fraction of Wellmont’s
inpatients that would choose hospital if Wellmont hospitals
were not available.
Diversion from Mountain States to Wellmont
Hospital Diversion Ratio
Holston Valley 0.46
Bristol 0.29
Laughlin 0.07
Morristown-Hamblen 0.05
Physicians Regional 0.04
University of Tennessee 0.04
Vanderbilt University 0.02
Takoma 0.02
Lakeway 0.01
Hawkins County 0.00
Note: Diversion ratio equals fraction of Mountain States’
inpatients that would choose hospital if Mountain States
hospitals were not available.

26
TABLE 14
WILLINGNESS-TO-PAY ANALYSIS
Change in WTP (%)
[1]
Elasticity of Price with
Respect to WTP
[2]
Predicted Price Increase (%)
[3] = [1] x [2]
Based on Inpatients Covered by Anthem-VA:
200 0.1 20
200 0.2 40
200 0.5 100
200 0.65 130
Based on Inpatients Covered by BCBS-TN:
122 0.1 12
122 0.2 24
122 0.5 61
122 0.65 79
Based on Inpatients Covered by Anthem-VA and BCBS-TN:
138 0.1 14
138 0.2 28
138 0.5 69
138 0.65 90

27
APPENDIX A
VARIABLE GLOSSARY
Variable Type Description Sources
Driving Time Continuous Driving time in minutes from patient's
ZIP code to hospital address
Google Maps
Hospital Characteristics:
Teaching Hospital Binary Equal to 1 if hospital is a teaching
hospital, 0 otherwise
CMS
Number of Beds Continuous Medicare certified beds CMS
For-Profit Hospital Binary Equal to 1 if hospital is a for-profit
hospital, 0 otherwise
CMS
Nursing Intensity Continuous Full-time equivalent nursing hours
divided by total patient days
CMS
Capital Intensity Continuous Total assets divided by total patient
days
CMS
Hospital Services:
Cardiology Binary Equal to 1 if hospital provides cardiac
catheterization lab services, cardiac
thoracic surgery services, or coronary
care unit services; 0 otherwise
CMS
Labor & Delivery Binary Equal to 1 if hospital provides neonatal
intensive care unit services, neonatal
nursery services, or obstetrics services;
0 otherwise
CMS
Nervous System Binary Equal to 1 if hospital provides
neurosurgical services, 0 otherwise
CMS
Psychiatric Binary Equal to 1 if hospital provides adult
inpatient psychiatric services,
emergency psychiatric services,
forensic psychiatric services, geriatric
psychiatric services, or child and/or
adolescent psychiatric services; 0
otherwise
CMS
Transplant Binary Equal to 1 if hospital provides
Medicare certified transplant center
services or non-Medicare certified
organ transplant services; 0 otherwise
CMS
Patient Characteristics:
Male Binary Equal to 1 if patient's sex is male, 0
otherwise
Claims/discharge
data
Length of Stay Continuous Number of days patient was an
inpatient at a hospital as indicated by
admission and discharge dates
Claims/discharge
data
Patient Older than 61 Years of Age Binary Equal to 1 if patient's age at the time of
discharge was greater than or equal to
62 years; 0 otherwise
Claims/discharge
data

28
APPENDIX A (CONT.)
VARIABLE GLOSSARY
Variable Type Description Sources
Patient Younger than 18 Years of Age Binary Equal to 1 if patient's age at the time of
discharge was less than 18 years; 0
otherwise
Claims/discharge
data
Patient Treatment Category Based on MDC:
Circulatory Binary Equal to 1 if patient's Major Diagnostic
Category (MDC) was classified as
MDC 5; 0 otherwise
Claims/discharge
data
Obstetrics Binary Equal to 1 if patient's MDC was
classified as MDC 14 or MDC 15; 0
otherwise
Claims/discharge
data
Respiratory Binary Equal to 1 if patient's MDC was
classified as MDC 4; 0 otherwise
Claims/discharge
data
Digestive Binary Equal to 1 if patient's MDC was
classified as MDC 6; 0 otherwise
Claims/discharge
data
Musculoskeletal Binary Equal to 1 if patient's MDC was
classified as MDC 8; 0 otherwise
Claims/discharge
data
Nervous Binary Equal to 1 if patient's MDC was
classified as MDC 1; 0 otherwise
Claims/discharge
data
Kidney Binary Equal to 1 if patient's MDC was
classified as MDC 11; 0 otherwise
Claims/discharge
data
Reproductive Binary Equal to 1 if patient's MDC was
classified as MDC 12 or MDC 13; 0
otherwise
Claims/discharge
data
Psychiatric Binary Equal to 1 if patient's MDC was
classified as MDC 19; 0 otherwise
Claims/discharge
data
Hepatobiliary Binary Equal to 1 if patient's MDC was
classified as MDC 7; 0 otherwise
Claims/discharge
data
Endocrine Binary Equal to 1 if patient's MDC was
classified as MDC 10; 0 otherwise
Claims/discharge
data
Infection Binary Equal to 1 if patient's MDC was
classified as MDC 18; 0 otherwise
Claims/discharge
data
Skin Binary Equal to 1 if patient's MDC was
classified as MDC 9; 0 otherwise
Claims/discharge
data
Myeloproliferative Binary Equal to 1 if patient's MDC was
classified as MDC 17; 0 otherwise
Claims/discharge
data
Injury Binary Equal to 1 if patient's MDC was
classified as MDC 21; 0 otherwise
Claims/discharge
data
ENT Binary Equal to 1 if patient's MDC was
classified as MDC 3; 0 otherwise
Claims/discharge
data
Other Binary Equal to 1 if patient's MDC was
classified as MDC 2, 16, 20, 22, 23,
24, or 25; 0 otherwise
Claims/discharge
data

29
APPENDIX B
TECHNICAL APPENDIX
The indirect utility of inpatient 𝑖 from chosing hospital 𝑗 is:
𝑈𝑖𝑗 = 𝑢𝑖𝑗 + 𝜖𝑖𝑗,
where 𝑢𝑖𝑗 = 𝑈(𝑇𝑖𝑗 , 𝐻𝑋𝑖𝑗, 𝐻𝑆𝑖𝑗 , 𝑃𝑋𝑖𝑗, 𝑃𝑇𝐶𝑖𝑗; 𝜃) is a function of driving time 𝑇𝑖𝑗, hospital
characteristics 𝐻𝑋𝑖𝑗, hospital services 𝐻𝑆𝑖𝑗, patient characteristics 𝑃𝑋𝑖𝑗, and patient treatment
categories 𝑃𝑇𝐶𝑖𝑗. Specifically, as shown in Table 9, we include in the utility function: (a) 𝑇𝑖𝑗 and
squared 𝑇𝑖𝑗, (b) 𝐻𝑋𝑖𝑗 and their interactions with 𝑃𝑋𝑖𝑗, (c) 𝐻𝑆𝑖𝑗 and their interactions with 𝑃𝑇𝐶𝑖𝑗
based on MDC, and (d) interactions of 𝑇𝑖𝑗 with 𝐻𝑋𝑖𝑗, 𝑃𝑋𝑖𝑗, and 𝑃𝑇𝐶𝑖𝑗.
Under the assumption that 𝜖𝑖𝑗 and 𝜖𝑖𝑘 are independently-distributed, extreme value random
variables, the probability that patient 𝑖 chooses hospital 𝑗, given the hospital network 𝐺 is:
𝑠𝑖𝑗𝐺 =
𝑒𝑥𝑝(𝑢𝑖𝑗)
∑ 𝑒𝑥𝑝(𝑢𝑖𝑘)𝑘∈𝐺.
Patient 𝑖’s expected utility from a given set of hospitals 𝐺 is
𝐸𝑈𝑖𝐺 = 𝐸 max
𝑗∈𝐺[𝑢𝑖𝑗 + 𝜖𝑖𝑗] = 𝑙𝑛 (∑ 𝑒𝑥𝑝(𝑢𝑖𝑗)
𝑗∈𝐺
),
where the last equality follows from the distribution assumption on 𝜖𝑖𝑗 stated above.
Patient 𝑖’s willingness-to-pay (“WTP”) for including hospital 𝑗 in her choice set 𝐺 can be
measured as
WTPij𝐺 = 𝐸𝑈𝑖
𝐺 − 𝐸𝑈𝑖𝐺/𝑗
= 𝑙𝑛 (∑ 𝑒𝑥𝑝(𝑢𝑖𝑘)
𝑘∈𝐺
) − 𝑙𝑛 ( ∑ 𝑒𝑥𝑝(𝑢𝑖𝑘)
𝑘∈𝐺/𝑗
) = 𝑙𝑛 (1
1 − 𝑠𝑖𝑗𝐺 ),
where 𝐺/𝑗 denotes the choice set 𝐺 excluding hospital 𝑗.20
Similarly, Patient 𝑖’s WTP for including a hospital system (a set of hospitals) 𝐽 ⊂ 𝐺 is
20 Note that all terms in 𝑢𝑖𝑗 that does not vary by 𝑗 will be cancelled out. Thus, if we assume that out-of-pocket
payment is the same across hospitals for a given patient whether hospital 𝑗 is included in the choice set or not, then
we do not need to observe out-of-pocket payment.

30
WTPiJ𝐺 = 𝑙𝑛 (
1
1 − ∑ 𝑠𝑖𝑗𝐺
𝑗∈𝐽
).
Total WTP for all patients for including the hospital system 𝐽 is simply the sum of WTPs across
all patients: WTPJ𝐺 = ∑ WTPiJ
𝐺𝑁𝑖=1 .
The effect of a merger between two hospital systems 𝐽 and 𝐾 can be measured using the ratio of
WTPs:
WTPJ∪K𝐺
WTPJ𝐺 + WTPK
𝐺 .
Lastly, the diversion ratio of hospital 𝑗 to hospital 𝑘 when hospital 𝑗 is excluded from the choice
set can be measured by recalculating choice probabilities using the new set of hospitals 𝐺/𝑗:
𝑠𝑖𝑘𝐺/𝑗
=𝑒𝑥𝑝(𝑢𝑖𝑘)
∑ 𝑒𝑥𝑝(𝑢𝑖𝑙)𝑙∈𝐺/𝑗.
Similarly, choice probability for hospital 𝑘 when a hospital system 𝐽 is excluded from patient 𝑖’s
choice set is simply
𝑠𝑖𝑘𝐺/𝐽
=𝑒𝑥𝑝(𝑢𝑖𝑘)
∑ 𝑒𝑥𝑝(𝑢𝑖𝑙)𝑙∈𝐺/𝐽.
The sample average is
1
𝑁∑ 𝑠𝑖𝑘
𝐺/𝐽
𝑁
𝑖=1
=1
𝑁∑
𝑒𝑥𝑝(𝑢𝑖𝑘)
∑ 𝑒𝑥𝑝(𝑢𝑖𝑙)𝑙∈𝐺/𝐽
𝑁
𝑖=1
.