michael todd gardner over ip networks analyzing mission ... · analyzing mission critical voice...
TRANSCRIPT

Analyzing Mission Critical Voice over IP Networks
Michael Todd Gardner

2University of KansasA KTEC Center of Excellence
Organization• What is Mission Critical Voice?• Why Study Mission Critical Voice over IP? • Approach to Analyze Mission Critical Voice over IP• Voice Quality Analysis (E-Model Optimization)• Latency Analysis• Conclusions• Future Work

3University of KansasA KTEC Center of Excellence
What is Mission Critical Voice?• Voice Communications that has the potential to cause
injury or loss of life if not received properly.• Examples of Mission Critical Voice:
– Air Traffic Control– Military Communications– E-911 (Emergency) Services
• What components make up Mission Critical Voice– Acceptable Voice Quality– Acceptable Latency– High Availability/Survivability
• This research focuses on Voice Quality and Latency.

4University of KansasA KTEC Center of Excellence
Why Study Mission Critical Voice over IP?
• Many public and private entities are struggling with separate voice and data networks.
• Integrated networks are easier and less costly to maintain.• Mission Critical Voice has different requirements than
ordinary voice communications.• Military and other Government Agencies (like the FAA)
are researching the integration of their mission critical networks.
• Examples uses include Military Communications, Air Traffic Control Communications, Natural and Man-made Disaster Recovery.

5University of KansasA KTEC Center of Excellence
Approach to Analyzing Mission Critical VoIP
1. Voice Quality Analysis– E-Model Optimization
2. Latency Analysis– Simulation Model
3. Survivability and Availability Analysis– A topic for future research
These analyses interact with each other. Therefore, it may be necessary to run each analysis multiple times.

6University of KansasA KTEC Center of Excellence
Voice Quality Analysis The E-Model Optimization
• The European Telecommunications Standards Institute (ETSI) developed the E-Model to address the needs of network planners.
• The E-model is based on the premise that “Psychological factors on the psychological scale are additive”.
• The ITU and the TIA have recommended the E-Model for use.• The E-Model defines the R value as the measure of voice quality.• Comparison of Mean Opinion Score (MOS) and R value.
User Satisfaction E-model - R MOS Very Satisfied 90 4.3
Satisfied 80 4.0 Some Users Dissatisfied 70 3.6 Many Users Dissatisfied 60 3.1
Nearly All Users Dissatisfied 50 2.6 Not Recommended 0 1.0

7University of KansasA KTEC Center of Excellence
E-Model R Value
Ro: Basic signal-to-noise ratio. Is: Impairments associated with voice
signals, like incorrect loudness levels, quantization noise, and incorrect sidetone levels.
Id: Impairments associated with delay, including end-to-end and echo.
Ie: Equipment related impairments associated with specific equipment.
A: Represents an advantage factor based on “advantage of access”.
R = Ro – Is – Id – Ie + A
R value vs. Delay

8University of KansasA KTEC Center of Excellence
Optimization Problem Objective Function (all cases):
Maximize the number of calls that can be active on a link whilemaintaining a minimum level of voice quality (R).
The cases considered are:1. Optimization: Find voice coder given link bandwidth, packet loss
level, and link utilization. 2. Optimization: Find voice coder and packet loss level given link
bandwidth and link utilization.3. Optimization: Find voice coder and link utilization level given link
bandwidth and packet loss level.

9University of KansasA KTEC Center of Excellence
Optimization Algorithm1. The Set of system configurations is defined. For Example, In Case 2,
the Set is the combination of coders and packet loss percentages. This allows the algorithm to search the “universe” of possibilities.
2. The parameters are calculated, including all E-Model parameters with fixed inputs and variable inputs based on the Set.
3. The objective is to maximize the number of calls on a link.4. The first constraint is that the minimum R value (voice quality) is 70. 5. The second constraint is that the sum of the variable Portion is 1.0.
• Number of calls will be maximized with one of the Set combinations, Therefore this problem is an "assignment" type optimization.

10University of KansasA KTEC Center of Excellence
Optimization Algorithm• AMPL Optimization Software is used to implement algorithm. • Non-Fixed Parameters are: T, Ta, and Tr (Delay variables), Ie
(Equipment Impairment), PL - Packet Loss %, ρ - Link Utilization, Coder Type
• T (mean one way delay of the echo path), Ta (absolute delay in echo free conditions), Tr (round trip delay in a 4-wire loop). We assume that the echo cancellers are very good. Therefore: T = Ta = (1/2)Tr.
• The variable Portion is used to assign the calls to a particular combination in the Set. Strict assignment would require Portion to be a binary integer (1 or 0). To avoid this non-linearity, we relaxed the integer requirement and allowed the program to make fractional assignments. Assignment theorem ensures that the solution produced will always exhibit an assignment of 1 or 0 for every Portion variable.

11University of KansasA KTEC Center of Excellence
Optimization Algorithm• The Code_Feas variable is a binary variable that penalizes elements of
the set that do not meet the constraints and limits the working set to R > 70.
• The algorithm can switch Code_Feas for that coder from a 1 to a 0 which eliminates the impairment portion of the equation and satisfies the constraint. Setting Code_Feas to zero for that coder eliminates it from participating in the objective which removes that coder from its working set. This is a hard (binary) penalty function that is nonlinear.
• During the first attempt, the optimization would not attempt to set the Code_Feas to “1” on all variables. Being non-linear, the algorithm found one coder that met the constraints and did not look for others that could produce a better objective function. This problem was solved by setting all Code_Feas variables to “1” during program initialization. For the algorithm to meet the R > 70 constraint, it MUST look at all Code_Feas variables and reverse them if necessary.

12University of KansasA KTEC Center of Excellence
Assumptions for Optimization
TdeXS )1(1)( ρµ −−−=
)1(%)ln(ρµ −−
= PLTd
Ta = Hop Count*Td + Code Delay + Propagation Delay + Misc. Delay
Delay is based on M/M/1 Assumptions
•S(X) represents M/M/1 delay distribution
•Td is the delay calculated by rearranging the delay distribution and assuming that the tail of the distribution is lost to packet loss (%PL)
•Ta is total one way delay
13University of KansasA KTEC Center of Excellence
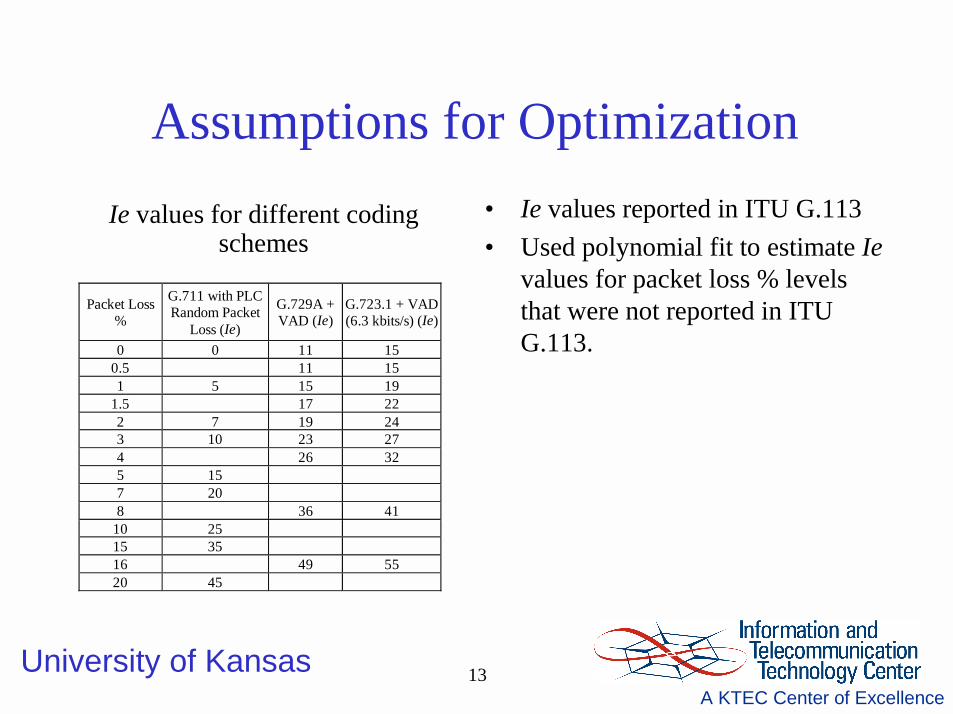
• Ie values reported in ITU G.113• Used polynomial fit to estimate Ie
values for packet loss % levels that were not reported in ITU G.113.
Packet Loss %
G.711 with PLC Random Packet
Loss (Ie)
G.729A + VAD (Ie)
G.723.1 + VAD (6.3 kbits/s) (Ie)
0 0 11 15 0.5 11 15 1 5 15 19
1.5 17 22 2 7 19 24 3 10 23 27 4 26 32 5 15 7 20 8 36 41
10 25 15 35 16 49 55 20 45
Ie values for different coding schemes
Assumptions for Optimization
14University of KansasA KTEC Center of Excellence
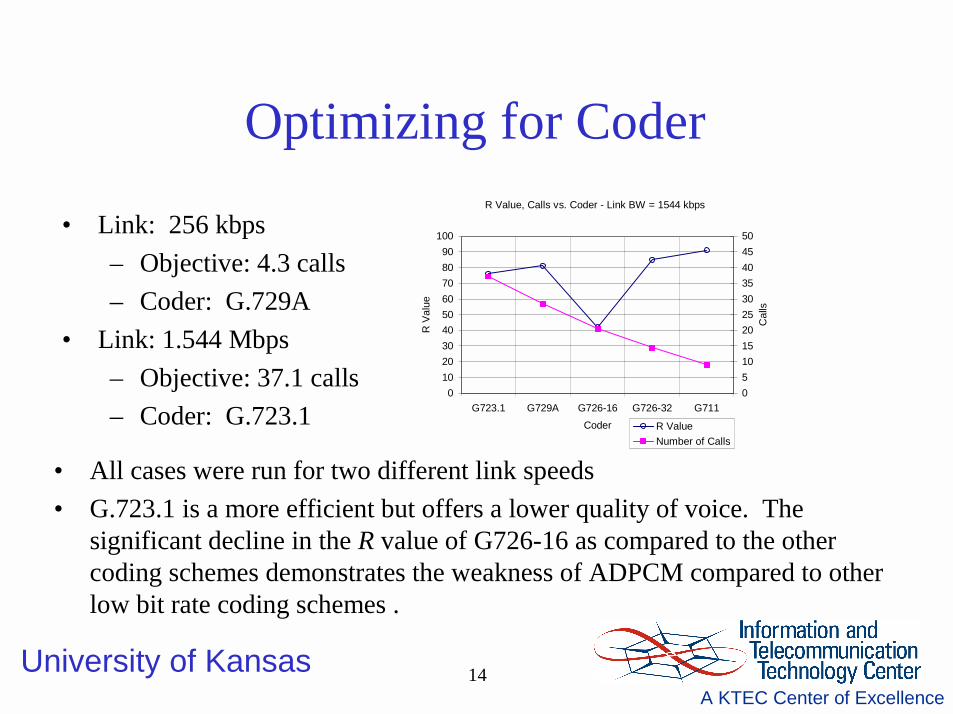
Optimizing for Coder
• All cases were run for two different link speeds• G.723.1 is a more efficient but offers a lower quality of voice. The
significant decline in the R value of G726-16 as compared to the other coding schemes demonstrates the weakness of ADPCM compared to other low bit rate coding schemes .
• Link: 256 kbps– Objective: 4.3 calls– Coder: G.729A
• Link: 1.544 Mbps– Objective: 37.1 calls– Coder: G.723.1
R Value, Calls vs. Coder - Link BW = 1544 kbps
0102030405060708090
100
G723.1 G729A G726-16 G726-32 G711Coder
R V
alue
05101520253035404550
Cal
ls
R ValueNumber of Calls

15University of KansasA KTEC Center of Excellence
Optimizing for Coder, Packet Loss
• Algorithm used a small objective benefit to favor links with higher packet losses (all other thing being equal).
• Degradation from packet loss to the audio (via the Ie factor) far outweighs any gains made from reductions in delay (at least using M/M/1 assumptions). This is due to the relatively steep Ie curves.
Link: 256 kbpsObjective: 4.3 callsCoder: G.729A with 2% packet loss
Link: 1.544 MbpsObjective: 37.1 callsCoder: G.723.1 with 1% packet loss
R Value vs. Packet Loss - Link BW = 256 kbps
0
10
20
30
40
50
60
70
80
1 2 3 4 5 6 7 8 9
Packet Loss (%)R
Val
ueG.711 - 1.5 CallG.723.1 - 6.2 CallsG.729A - 4.3 Calls

16University of KansasA KTEC Center of Excellence
Optimizing for Coder, Utilization • Link: 256 kbps
– Objective: 5.6 calls– Coder: G.729A with 60% link utilization
• Link: 1.544 Mbps– Objective: 66.8 calls– Coder: G.723.1 with 90%
• Notice that the R curves when the link speed was 256 kbps were much more sensitive than the 1.544 Mbps case. This is due to the impact that the lower bandwidth has on delay.
• Notice that in the 1.544 Mbps case, G.723.1 carried more calls at 90% load than G.729A did at 95% load.

17University of KansasA KTEC Center of Excellence
Optimizing for Coder, UtilizationR, Calls vs. Link Utilization (Voice) - Link BW = 256 kbs
0
10
20
30
40
50
60
70
80
50 55 60 65 70 75 80 85 90 95Link Utilization (%)
R V
alue
0.0
2.0
4.0
6.0
8.0
10.0
12.0
14.0
Num
ber o
f Cal
ls
G711 - R Value G723_1 - R Value G729A - R Value
G711 - Calls G729A - Calls G723_1 - Calls
R Value, # of Calls vs Link Utilization - Link BW = 1544 kbs
0102030405060708090
100
50 55 60 65 70 75 80 85 90 95Link Utilization (%)
R V
alue
0.0
10.0
20.0
30.0
40.0
50.0
60.0
70.0
80.0
Num
ber o
f Cal
ls
G711 - R Value G723_1 - R Value G729A - R Value
G711 - Calls G723_1 - Calls G729A - Calls

18University of KansasA KTEC Center of Excellence
E-Model Optimization Results
• G.729A is a better coder on lower bitrate links than G.723.1. This is due to the fact that G.729A has higher quality of voice, but is less efficient with respect to bandwidth than G.723.1.
• Packet loss typically hurt voice quality more than the delay saved (using M/M/1 assumptions).
• In the optimization for coder/load scenario, we saw that when the link BW was 1.544 Mbps, G.723.1 carried more calls at a load of 90% than G.729A did at a load of 95%. It would be interesting to run the optimization with priority queue assumptions instead of M/M/1.
Case # Variables Link Bitrate (b/s) Optimum Solution1 Coder 256000 G.729A1 Coder 1544000 G.723.12 Coder, Packet Loss % 256000 G.729A with 2% PL2 Coder, Packet Loss % 1544000 G.723.1 with 1% PL3 Coder, Link Utilization 256000 G.729A with 60% Load3 Coder, Link Utilization 1544000 G.723.1 with 90% Load

19University of KansasA KTEC Center of Excellence
Latency Analysis - Simulation Study• The Remote Network model simulates the edge of the network where the
voice traffic encounters a router connected to a link with limited bandwidth. The Core Network model simulates the core of the network. In the ATC environment, this would be the network between the Remote Network and the terminal or enroute Air Traffic Control facility.
Remote Node
Remote (Edge) Network Core Network
Control Node
Coding Delay = 35 ms
Switching = 3 msPropagation = 25 ms
Peak Core Network Delay <= 40 ms
Decode and Buffer Delay = 20 ms
Switching = 10 msPeak Edge Network Delay <= 12 ms
• Based on research that connects delays over 150 ms with “step on”occurrences, 145 ms was chosen as the maximum allowable delay.

20University of KansasA KTEC Center of Excellence
Remote Network Model• 6 Voice Sources
(on-off type)• 2 Data Sources• Variable Data
Source Load and MTU size distribution
• Priority and DRR Queues
• Variable Link Bandwidth
• Opnet 6.0/7.0 used to build simulation models

21University of KansasA KTEC Center of Excellence
Core Network Model
• 2048 Voice Sources, 32 Data Sources, Variable Data Source Loads and MTU size distributions
• Ingress, Core, Egress Routers – Low/High and High/Low bandwidth Transitions, Priority and DRR Queues, Variable Link Bandwidths
1 Data Source
Ingress Router
8 Voice Sources8 Voice Sources
8 Voice Sources8 Voice Sources
8 Voice Sources8 Voice Sources
8 Voice Sources8 Voice Sources
Pass ThruPass Thru
Core Router
7 Ingress Routers Pass Thru
Egress Router
3 Core Routers
User Eq.
High Speed Link
Low Speed Link

22University of KansasA KTEC Center of Excellence
Remote Network – MTU Size
0.0010
0.0100
0.1000
1.0000
10.0000
64,000 5,000 3,000 1,000
Max Data MTU Size (bits)
Del
ay (s
ec) -
Log
Sca
le
Average Voice Delay Peak Voice DelayAverage Data Delay Peak Data DelayTheoretical Voice Delay
•Data load of .64, voice load of .20 - Constant•Link speed of 288 kbps – Constant•Data MTU size variable

23University of KansasA KTEC Center of Excellence
Remote Network – LoadLink Rate (bps) Data Interarrival Time Total Load Voice Load Data Load
144,000 0.3203 0.80 0.40 0.40 192,000 0.1836 0.83 0.30 0.53 288,000 0.1016 0.83 0.20 0.63 576,000 0.043 0.85 0.10 0.75
0.0010
0.0100
0.1000
1.0000
10.0000
100.0000
.40/.40 .30/.53 .20/.63 .10/.75
Voice Load/Data Load
Del
ay (s
ec) -
Log
Sca
le
Theoretical Bound - 1Kb Max Pkt Peak Voice Delay
Average Voice Delay Peak Data Delay
Average Data Delay

24University of KansasA KTEC Center of Excellence
Remote Network – DRR Queue
0.0010
0.0100
0.1000
1.0000
10.0000
95/5 80/20 65/35 50/50 35/65 20/80 5/95
DRR Weights (Voice/Data)
Del
ay (s
ec) -
Log
Sca
le
Peak Voice Delay Average Voice Delay
Peak Data Delay Average Data Delay
•Data load of .64, voice load of .20 - Constant•Link speed of 288 kbps – Constant•Maximum Data MTU size 1000 bits

25University of KansasA KTEC Center of Excellence
Remote Network – Pareto w/ DRR
• Data load of .64, voice load of .20 - Constant• Link speed of 288 kbps – Constant, Maximum Data MTU size 1000 bits• Pareto shape parameter used is 1.06 and the k parameter used is 453. • This test is a repeat of test on last slide, except that a Pareto distribution is
being used for the data MTU size instead of an exponential distribution.• Graphs show a comparison of the results with a Pareto distribution and
exponential distribution
0.0010
0.0100
0.1000
1.0000
10.0000
100.0000
95/5 80/20 65/35 50/50 35/65 20/80 5/95
DRR Weights (Voice/Best Effort)
Dela
y (s
ec)
Average Voice Delay - Pareto Peak Voice Delay - ParetoAverage Voice Delay - MM1 Peak Voice Delay - MM1
0.1000
1.0000
10.0000
95/5 80/20 65/35 50/50 35/65 20/80 5/95
DRR Weights (Voice/Best Effort)
Dela
y (s
ec)
Average Data Delay - MM1 Peak Data Delay - MM1Average Data Delay - Pareto Peak Data Delay - Pareto

26University of KansasA KTEC Center of Excellence
Core Network – Load
Voice Load Data Load Total Load .10 .78 .88 .30 .57 .87 .50 .36 .86 .70 .16 .86
0.001
0.01
0.1
1
10
0.10 0.30 0.50 0.70
Voice Load (Total Load = .85 - .88)
Del
ay (S
ec) -
Log
Sca
le
Peak Voice Delay Average Voice DelayPeak Data Delay Average Data Delay

27University of KansasA KTEC Center of Excellence
Core Network – DRR Queue•Voice load of .5 - Constant•Data load of .36 - Constant•Maximum Data MTU size 4000 bits
0.001
0.01
0.1
1
95/5 80/20 65/35 50/50 35/65Voice/Data DRR Weights
Del
ay (S
ec) -
Log
Sca
le
.
Peak Voice Delay Average Voice DelayPeak Data Delay Average Data Delay

28University of KansasA KTEC Center of Excellence
Core Network – Pareto w/ DRR
• Data/Voice Load is constant, Voice Load = .5, Data Load = .36• Maximum Data MTU size is 4000 bits• Pareto shape parameter used is 1.06 and the k parameter used is 453. • This test is a repeat of Core Scenario 3, except that a Pareto distribution is being
used for the data MTU size instead of an exponential distribution.• Graphs show a comparison of the results with a Pareto distribution and exponential
distribution
0.01
0.1
1
10
100
95/5 80/20 65/35 50/50 35/65Voice/Data DRR Weights
Dela
y (s
ec) -
Log
Sca
le .
Peak Data Delay - Pareto Average Data Delay - ParetoPeak Data Delay - MM1 Average Data Delay - MM1
0.001
0.01
0.1
1
10
95/5 80/20 65/35 50/50 35/65Voice/Data DRR Weights
Dela
y (s
ec) -
Log
Sca
le
.
Peak Voice Delay - MM1 Average Voice Delay - MM1Peak Voice Delay - Pareto Average Voice Delay - Pareto

29University of KansasA KTEC Center of Excellence
Latency Analysis - Observations• The interarrival time between voice packets (20 ms for this simulation) is very
important in the determination of load and the calculation of delay for both the Remote Network and Core Network models.
• The assumption of 40% "on" time for the voice generator also played a critical role in determining maximum delay.
• When DRR queues were used in the Core Network, delay were in excess of 60 ms. When priority queues were used in the same situations, delays were as low as 40 ms. This presents problems with DRR queues in large networks. This probably occurred because a DRR queue will let a data packet start once it has built enough “quantum”, even if voice packets are waiting.
• Maximum MTU size is very important in the Remote Network Model• [CHARNY] showed that with multiple hop counts, analytical calculation of
maximum possible delay can lead to very high delay times for relatively low link utilization levels. This study did not see those delay times in simulation.

30University of KansasA KTEC Center of Excellence
Conclusions• The 3-Step Approach proposed to Analyze Mission Critical Voice was
partially completed. The two analyses were completed (Voice Quality, Latency) and were successful.
• The Voice Quality Analysis using the E-Model Optimization worked properly and was an effective tool to help choose parameters like coder, packet loss level, and utilization in a Mission Critical Voice over IP network.
• The Latency Analysis showed that even with very tight control over the network parameters, it is difficult (but still possible) to meet the requirements for mission critical voice over IP. Strict control over load, MTU size, file size distribution is required. This may or may not be possible in different mission critical networks.

31University of KansasA KTEC Center of Excellence
Topics for Future Research• Research is needed that studies the survivability and availability of mission
critical voice over IP networks. More research is needed into ways to tie voice quality and latency into availability analysis.
• More accurate methods to model large IP networks are needed. This research modeled a large network, but frequently assumptions were necessary to manage the size of the model.
• More accurate estimates of delay bounds in core networks are needed. • More research is needed to extend the optimization of the E-Model to
include more variables, which will increase its usefulness. In addition, better estimates of network latency will help this model to be more accurate.

32University of KansasA KTEC Center of Excellence
Questions?