michigan infrared combiner (mirc): array · mirc is an image-plane combiner, allowing simultaneous...
TRANSCRIPT
PROCEEDINGS OF SPIE
SPIEDigitalLibrary.org/conference-proceedings-of-spie
Michigan Infrared Combiner (MIRC):commissioning results at the CHARAArray
John D. Monnier, Ettore Pedretti, Nathalie Thureau,Jean-Philippe Berger, Rafael Millan-Gabet, et al.
John D. Monnier, Ettore Pedretti, Nathalie Thureau, Jean-Philippe Berger,Rafael Millan-Gabet, Theo ten Brummelaar, Harold McAlister, JuditSturmann, Lazlo Sturmann, Phil Muirhead, Ajay Tannirkulam, ScottWebster, Ming Zhao, "Michigan Infrared Combiner (MIRC): commissioningresults at the CHARA Array," Proc. SPIE 6268, Advances in StellarInterferometry, 62681P (28 June 2006); doi: 10.1117/12.671982
Event: SPIE Astronomical Telescopes + Instrumentation, 2006, Orlando,Florida , United States
Downloaded From: https://www.spiedigitallibrary.org/conference-proceedings-of-spie on 7/11/2018 Terms of Use: https://www.spiedigitallibrary.org/terms-of-use
Michigan Infrared Combiner (MIRC): Commissioning Resultsat the CHARA Array
John D. Monniera, Ettore Pedrettia, Nathalie Thureaua, Jean-Philippe Bergerb, RafaelMillan-Gabetc, Theo ten Brummelaard, Harold McAlisterd, Judit Sturmannd,
Lazlo Sturmannd, Phil Muirheada,e, Ajay Tannirkulama, Scott Webstera, and Ming Zhaoa
aUniversity of Michigan (Astronomy), 500 Church St, Ann Arbor, MI 48104 USA;bLab. d’Astrophysique de l’Observatoire de Grenoble, Grenoble, France;
cMichelson Science Center (Caltech), Pasadena, CA, USA;dGeorgia State University CHARA Array, Mt. Wilson, CA, USA;
eNow at Cornell University, Ithaca, NY, USA
ABSTRACT
The Michigan Infrared Combiner (MIRC) has been designed for two primary goals: 1) imaging with all sixCHARA telescopes simultaneously in the near-infrared, 2) direct detection of “hot Jupiter” exoplanets usingprecision closure phases. In September 2005, MIRC was commissioned on-sky at the CHARA Array on Mt.Wilson, CA, successfully combining light from 4 telescopes simultaneously. After a brief overview of MIRC fea-tures and design philosophy, we provide detailed description of key components and present results of laboratorytests. Lastly, we present first results from the commissioning run, focusing on engineering performance. Wealso present remarkable on-sky closure phase results from the first night of recorded data with the best-everdemonstrated closure phase stability and precision (∆Φ = 0.03 degrees).
Keywords: imaging, interferometry, infrared, closure phase, infrared
1. INTRODUCTION
The Georgia State University (GSU) Center for High Angular Resolution Astronomy (CHARA) interferometeris a 6-telescope optical array located on Mt. Wilson,1 which recently published first science results2 . In acollaboration with GSU, Dr. Monnier’s group at the University of Michigan began in 2003 to build an instrumentto act as an “imaging” infrared combiner to combine all six telescopes together to allow true interferometricimaging with CHARA from 1.45-2.5µm with ∼1 milliarcsecond resolution. The Michigan Infrared Combiner(MIRC) was first described in the last SPIE proceedings;3 since that time, the MIRC combiner has been built,tested, and commissioned on the the sky.
1.1. FEATURES OF MIRC COMBINER
Here we briefly summarize the main properties of the MIRC combiner. Please refer to Monnier et al.3 for furtherdetails.
• Image Plane Combination: 6 telescopes, 15 visibilities, 20 closure phases simultaneously (and measurementsof closure amplitudes for the first time); for commissioning, we used only 4 telescopes
• 1.45-2.5 microns (H and K bands separately or simultaneously)
• Low-resolution spectroscopy, R∼35, 150 or 450
• Spatial filtering using single-mode fibers
• Straight-forward integration with a separate fringe tracker (CHAMP, see Berger et al., these proceedings).
Further author information, J.D.M.: [email protected]
Advances in Stellar Interferometry, edited by John D. Monnier,Markus Schöller, William C. Danchi, Proc. of SPIE Vol. 6268,62681P, (2006) · 0277-786X/06/$15 · doi: 10.1117/12.671982
Proc. of SPIE Vol. 6268 62681P-1
Downloaded From: https://www.spiedigitallibrary.org/conference-proceedings-of-spie on 7/11/2018Terms of Use: https://www.spiedigitallibrary.org/terms-of-use
E 0w CH VbGD S7' r U 2
J-
CL
w
-0
0-Q
b
0 0
w
w
V
C2
M
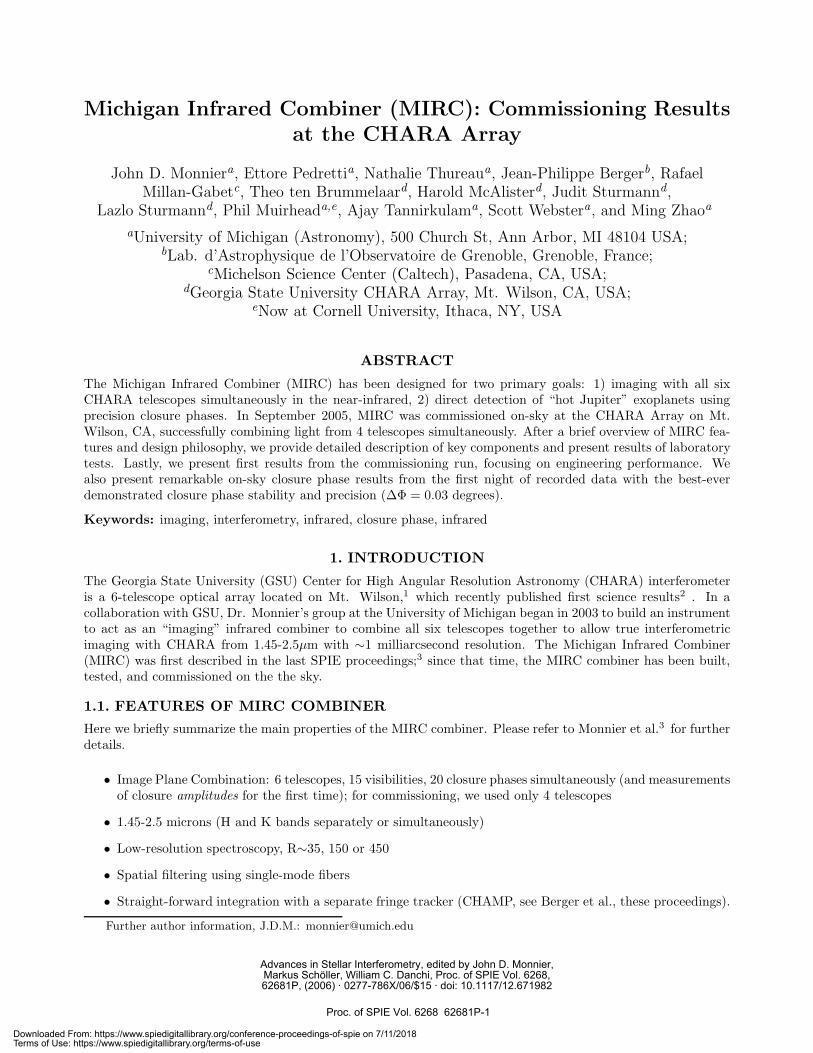
Figure 1. This figure shows the actual layout of the MIRC combiner (upper left part of optical table) as well as theplanned location for the CHARA Fringe Tracker CHAMP (see paper by Berger et al. in these proceedings).
MIRC is an image-plane combiner, allowing simultaneous measurements of all available baselines and closurephases in the full 6-telescope CHARA array. The beams from all telescopes are arranged in a linear non-redundant pattern and then imaged onto the slit of an infrared spectrograph at the backend. In order toallow precision calibration of visibility amplitudes and closure phases, the synthetic pupil is formed using lighttransported and spatially-filtered by single-mode fibers for optical stability.4 A non-deviating prism pair (R∼35)or low-resolution grism (R∼150,450) on the output mitigates dispersion problems and bandwidth-smearing ofdata (especially important with the long CHARA baselines). This proposal is very similar to the recommendeddesigns evaluated by Theo ten Brummelaar and Steve Ridgway in early CHARA technical memos,5, 6 for exampleappendices K and L.
The primary drawback to the above design is that this combiner will have relatively poor sensitivity, sinceboth all-in-one beam combination and the dispersive element act to spread out the available light across manypixels (diluting the signal at the expense of additional read noise). In K band, there is another problem that inthe synthetic pupil allows extra thermal background into the camera. However, these serious deficiencies can beovercome through future improved detectors and (in the short-term) use of a “fringe tracker.”
We ascribe to the philosophy that mature interferometers will all have dedicated fringe tracking systems whichact to correct for fast atmospheric fluctuations in realtime. In this way, a fringe tracker is like the now-common,adaptive optics systems found on most large telescopes. By separating out the light for fringe tracking from thelight used for science, each fringe tracker and science combiner can be separately optimized. This is critical, sincefringe trackers need lots of photons but good calibration is not needed. MIRC was designed with the assumption
Proc. of SPIE Vol. 6268 62681P-2
Downloaded From: https://www.spiedigitallibrary.org/conference-proceedings-of-spie on 7/11/2018Terms of Use: https://www.spiedigitallibrary.org/terms-of-use

-ii'
m
0 C)
C,,
-t' =
C
C) 0 C)
C,, I-
CD
=
r C
D
II -
V
that an infrared fringe tracker would be built to recover the sensitivity lost (∼4 magnitudes) in pursuing goodcalibration and powerful imaging capabilities – indeed, a fringe tracker will be integral to MIRC’s ability toobserve a wide-range of targets. The “CHARA-Michigan Phasetracker (CHAMP) ” has now been funded by theNational Science Foundation and will be built at the University of Michigan; our design is described elsewherein these proceedings (Berger et al.).
This “science combiner with separate fringe tracker” design has been developed over many years, and wasprobably first best expressed by the CHARA team in their original NSF proposal.7 This represents a majordeparture from the approaches at the “first generation” imaging interferometers COAST and NPOI. We notethat the European Southern Observatory Very Large Telescope Interferometer (ESO-VLTI) has adopted a similararchitecture as we have for their AMBER instrument,8 which also will require a separate fringe tracker unit(FINITO9) to achieve reasonable sensitivity at high spectral resolution.
Figure 1 shows how the MIRC combiner has been implemented at CHARA, and the next section will takeyou through a guided tour.
Figure 2. Here we begin our guided tour of the MIRC combiner. The left panel shows how the light is deflected out of theCHARA beampath into the MIRC instrument. You can see the off-axis parabolas that inject the light into single-modefibers. Once in the fibers, the light takes the path shown in the upper-right schematic. The bottom right image showsthe fibers being arranged into a silicon v-groove array, the location of the collimator lenslet array, and a spherical silvermirror that focuses the beams to produce interference fringes at the input slit of the camera-spectrometer.
2. GUIDED TOUR
2.1. Forming Fringes
After light is received by the 1-m CHARA telescopes, the beams are compressed to 19 mm and the siderealdelay is corrected by a combination of (in-vacuum) fixed delay segments and (in-air) dynamic delay line carts;see recent CHARA instrument paper1 for details. The six beams are split by a dichroic – the visible light is usedfor tip-tilt tracking using a new CCD-based system (see Sturmann et al., these proceedings), while the infraredlight (JHK bands) is sent towards the MIRC combiner.
The 6 beams are picked-off by picomotor-steered mirrors on automated (Zabar/Ealing) translation stages(for phasing MIRC with internal CHARA internal fringes). Each 19 mm beam is injected into custom-drawn,low-OH silica fiber (Highwave; used by VLTI AMBER) using an EFFL 60mm off-axis parabola (gold-coated,
Proc. of SPIE Vol. 6268 62681P-3
Downloaded From: https://www.spiedigitallibrary.org/conference-proceedings-of-spie on 7/11/2018Terms of Use: https://www.spiedigitallibrary.org/terms-of-use
IR-gradeFused Silica
CalciumFluoride
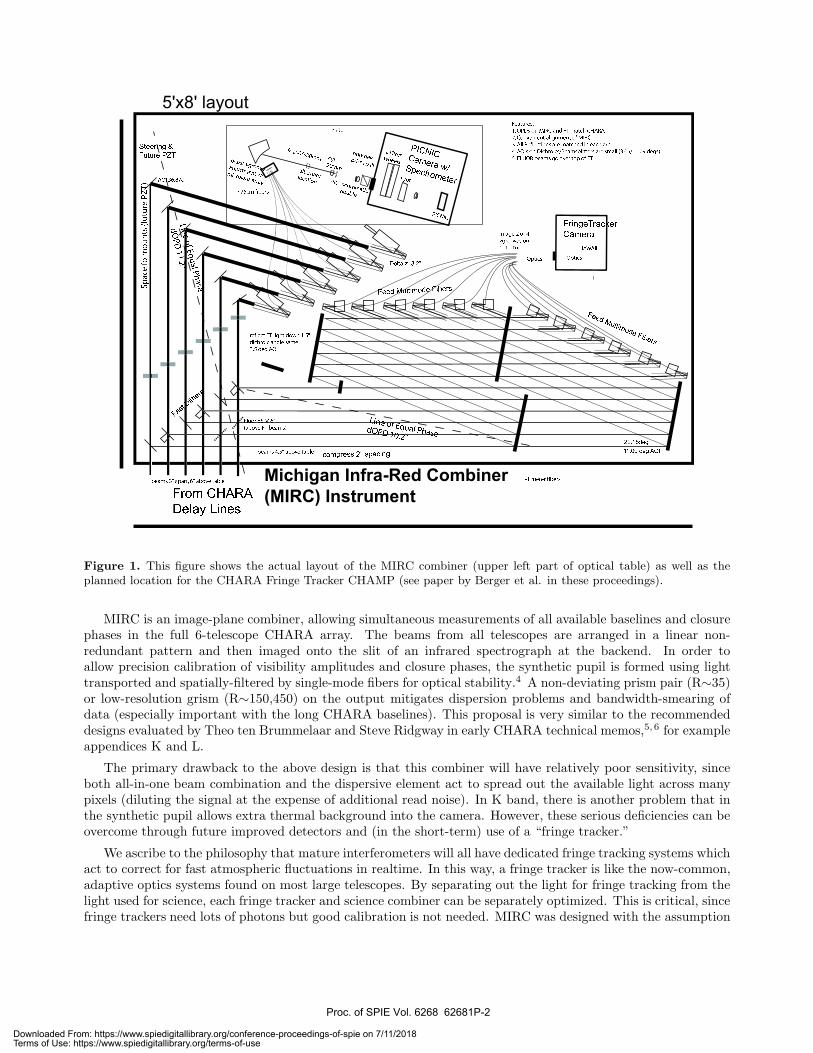
Figure 3. This figure shows the custom achromatic double designed for MIRC, requiring spot sizes of <40µm over a 5degree field from 1.1-2.4 µm (designed by N. Thureau). The upper left panel shows the design while the other panelsshow spot diagrams at 1.25µm, 1.65µm, and 2.2µm. We have verified that ∼90% of light does fall into a single 40µm rowof pixels for 1.65µm and 2.2µm without re-focusing.
diamond-turned silicon mirrors from Nu-Tek). Coupling is maximized by using 3-axis nanopositioning mounts(Luminos) to align fiber with 0.2µm repeatability (absolute) in X-Y and a few microns of error in the focusdirection.
The single-mode fibers (λcutoff =1.45µm) are “highly-birefringent (HB),” or “polarization-maintaining (PM),”which means that linearly-polarized light injected along a fiber axis is maintained along the fiber path. In ourcase, we are using unpolarized light so all fibers have been aligned to a common orientation and care has beento taken to not stress the fibers. Stress will induce differential birefringence between the two polarization states,leading to reduced fringe contrast in unpolarized light. We have provision for placing an in-line, squeeze-stylepolarization controller (General Photonics) on each fiber to correct for birefringence, however we found only 1fiber needed this correction.
All 6 fibers are then arranged on a silicon v-groove array (the fiber array was populated and packaged by OzOptics) with an exact 250µm pitch. The fibers are arranged in a non-redundant spacing so that each fringe thatforms will have a unique spatial frequency signature. Light exiting a fiber is strongly diverging until collimatedby a microlens array (SUSS MicroOptics) placed ∼ 100 µm from the tip of the v-groove. The collimated beamsform a synthetic pupil which is imaged using a R=400mm (for 4 beams) or 750mm (for 6 beams) focusing mirror(Lambda Research Optics).
All of these steps are illustrated in Figure 2.
2.2. MIRC Spectrograph
Since the fringes are forming in only one dimension, it is advantageous to compress the fringe pattern into a lineof pixels. We use a f=20mm cylindrical lens (CaF2, ISP Optics) to do this for 4 beams (f=30mm will be needed
Proc. of SPIE Vol. 6268 62681P-4
Downloaded From: https://www.spiedigitallibrary.org/conference-proceedings-of-spie on 7/11/2018Terms of Use: https://www.spiedigitallibrary.org/terms-of-use
C
7'
U
q
LS
C
G
r
V
2w
p
0 D
pn b
A
2
V ab
M
p
Gr
E a
2UHJ- 1C q C9
M IH bB v\Ja
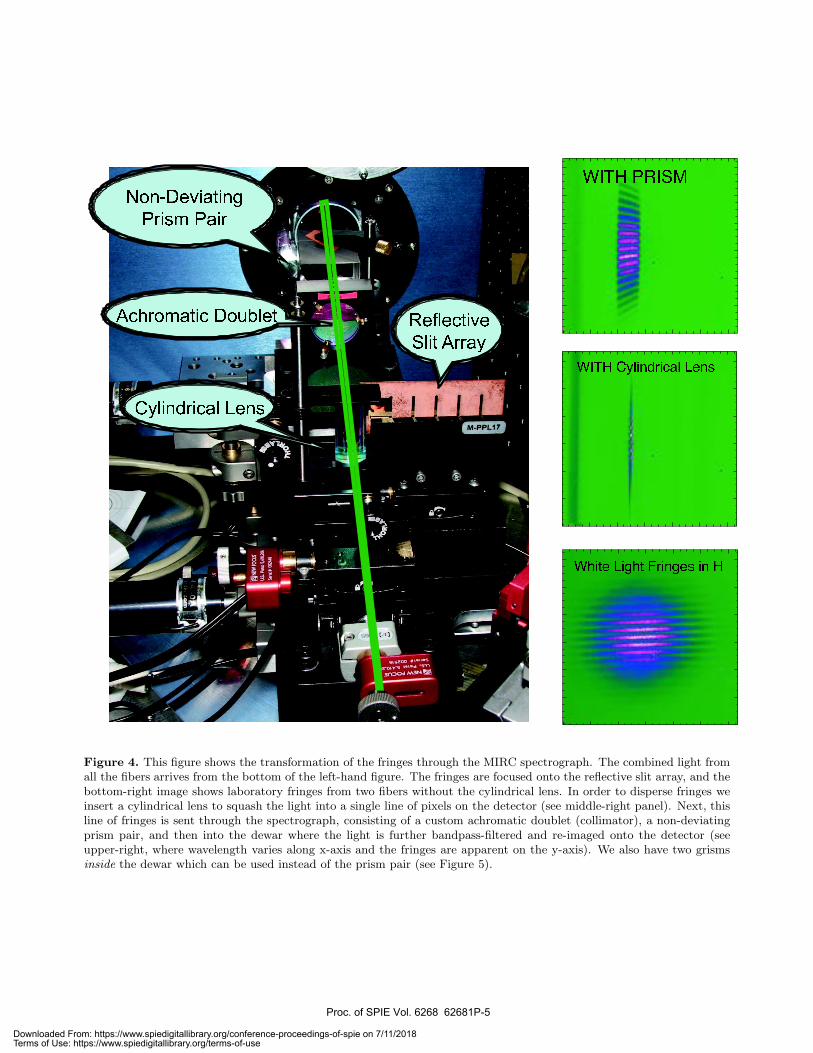
Figure 4. This figure shows the transformation of the fringes through the MIRC spectrograph. The combined light fromall the fibers arrives from the bottom of the left-hand figure. The fringes are focused onto the reflective slit array, and thebottom-right image shows laboratory fringes from two fibers without the cylindrical lens. In order to disperse fringes weinsert a cylindrical lens to squash the light into a single line of pixels on the detector (see middle-right panel). Next, thisline of fringes is sent through the spectrograph, consisting of a custom achromatic doublet (collimator), a non-deviatingprism pair, and then into the dewar where the light is further bandpass-filtered and re-imaged onto the detector (seeupper-right, where wavelength varies along x-axis and the fringes are apparent on the y-axis). We also have two grismsinside the dewar which can be used instead of the prism pair (see Figure 5).
Proc. of SPIE Vol. 6268 62681P-5
Downloaded From: https://www.spiedigitallibrary.org/conference-proceedings-of-spie on 7/11/2018Terms of Use: https://www.spiedigitallibrary.org/terms-of-use

Figure 5. Here we present first (lab) fringes across H band using the low (R=150) and high (R=450) resolution grismsinside the MIRC dewar (wavelength along y axis and fringes along x axis). The grisms work out to K band but sufferfrom increased thermal background since the input slit is not cooled. Note there is neglible differential dispersion in thesefringes, indicating the fibers are nearly equal in length (∆x < 0.25 mm).
for 6 beams). The fringes come to a line-focus onto a reflective slit array (gold-foiled; National Aperture), whichdefines the entrance aperture of the spectrograph. The gold foil acts to reduce the infrared background enteringthe camera for K-band operation – ideally, the slit would be cryogenic and located in the cold volume of thecamera, but this upgrade will drastically increase alignment difficulties and has been deferred.
The beam expands from the slit and is collimated by a f=100mm custom acromatic doublet (design by N.Thureau, fabricated by ISP Optics; see Figure 3). The collimated beam is then dispersed either using a non-deviating prism pair (design by W. Traub, fabricated by Red Optronics & Planar Optics) or infrared grisms.At this point, the light enters the MIRC camera dewar through an Infrasil window (Esco). The LN2 dewarwas made by IR Labs and has two automated filter wheels and a hold time 48 hours. After passing through abandpass filter, the light is re-imaged onto a 256×256 pixel PICNIC (Rockwell) detector.
Figure 4 shows both a picture of the spectrograph as well as recorded images of interference fringes with andwithout the cylindrical lens in place.
In April 2006, we installed custom grisms (Newport/Spectra Physics) into the MIRC dewar, in one of thefilter wheels. This allows us to observe with 2 additional levels of spectral resolution (R=150 and 450). Whilethese two grisms have not been used on the sky, we present validation fringes in Figure 5 using a laboratorywhite light source.
As mentioned, the detector is a Rockwell PICNIC array detector, sensitive from 1 to 2.5µm. This combinerrequires reading-out a relatively large area (∼50×120 pixels) at high rates (>∼20 Hz) with lowest possible read-noise. We are using the cold fanout board and warm analog amplifiers from IR Labs and using high-speed digitalelectronics (including ADCs) from Astronomical Research Cameras (Bob Leach). We have demonstrated 23 e−
read noise for single reads at 1 MHz pixel rates, comparable to that achieved at IOTA10 after correcting forour faster pixel clock. Custom DSP timing patterns have been written to maximize signal-to-noise ratio (byoptimizing use of non-destructive reads and Fowler sampling; Leach & Monnier) and to allow sophisticated dataanalysis, such as employing variable coherent integration times in post-processing.
In order to have full control of the data acquisition and realtime feedback to the CHARA interferometerfor fringe tracking, the camera has been interfaced under linux with the RTAI-FUSION realtime extension (seePedretti et al, these proceedings). Using the fastest fiber interface board offered by Leach (12.5 Mpixels/sec),we can readout the PICNIC array at maximum data rates, retaining every non-destructive read and spoolingto disk with no latency or loss of integration time (see Pedretti et al, these proceedings for details). With 4
Proc. of SPIE Vol. 6268 62681P-6
Downloaded From: https://www.spiedigitallibrary.org/conference-proceedings-of-spie on 7/11/2018Terms of Use: https://www.spiedigitallibrary.org/terms-of-use
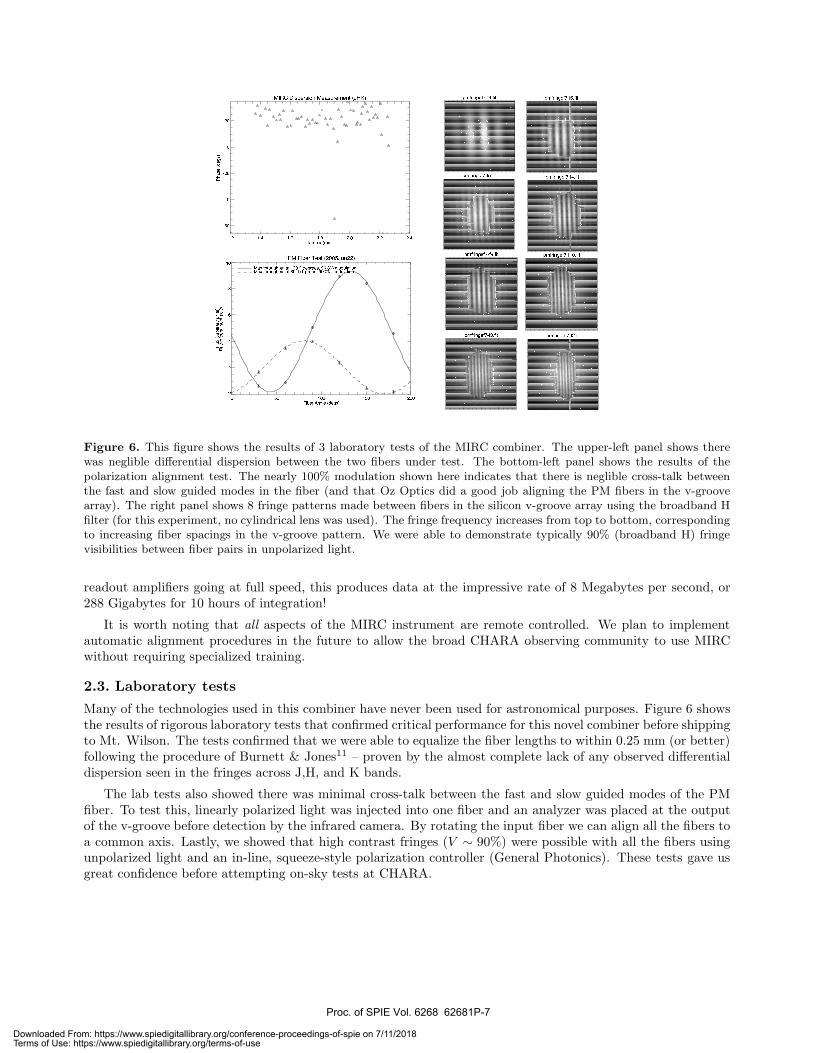
Figure 6. This figure shows the results of 3 laboratory tests of the MIRC combiner. The upper-left panel shows therewas neglible differential dispersion between the two fibers under test. The bottom-left panel shows the results of thepolarization alignment test. The nearly 100% modulation shown here indicates that there is neglible cross-talk betweenthe fast and slow guided modes in the fiber (and that Oz Optics did a good job aligning the PM fibers in the v-groovearray). The right panel shows 8 fringe patterns made between fibers in the silicon v-groove array using the broadband Hfilter (for this experiment, no cylindrical lens was used). The fringe frequency increases from top to bottom, correspondingto increasing fiber spacings in the v-groove pattern. We were able to demonstrate typically 90% (broadband H) fringevisibilities between fiber pairs in unpolarized light.
readout amplifiers going at full speed, this produces data at the impressive rate of 8 Megabytes per second, or288 Gigabytes for 10 hours of integration!
It is worth noting that all aspects of the MIRC instrument are remote controlled. We plan to implementautomatic alignment procedures in the future to allow the broad CHARA observing community to use MIRCwithout requiring specialized training.
2.3. Laboratory tests
Many of the technologies used in this combiner have never been used for astronomical purposes. Figure 6 showsthe results of rigorous laboratory tests that confirmed critical performance for this novel combiner before shippingto Mt. Wilson. The tests confirmed that we were able to equalize the fiber lengths to within 0.25 mm (or better)following the procedure of Burnett & Jones11 – proven by the almost complete lack of any observed differentialdispersion seen in the fringes across J,H, and K bands.
The lab tests also showed there was minimal cross-talk between the fast and slow guided modes of the PMfiber. To test this, linearly polarized light was injected into one fiber and an analyzer was placed at the outputof the v-groove before detection by the infrared camera. By rotating the input fiber we can align all the fibers toa common axis. Lastly, we showed that high contrast fringes (V ∼ 90%) were possible with all the fibers usingunpolarized light and an in-line, squeeze-style polarization controller (General Photonics). These tests gave usgreat confidence before attempting on-sky tests at CHARA.
Proc. of SPIE Vol. 6268 62681P-7
Downloaded From: https://www.spiedigitallibrary.org/conference-proceedings-of-spie on 7/11/2018Terms of Use: https://www.spiedigitallibrary.org/terms-of-use
3. ON-SKY RESULTS
Commissioning of the MIRC instrument was carried out from UT August 26 to UT September 19, 2005. Weplanned on commissioning only 4 of the 6 CHARA telescopes, since two beams are currently devoted to otherprojects. First fringes with MIRC on the sky were obtained on UT 2005 Sep 04 and first closure phases withCHARA on 2005 Sep 14. The most ambitious of our technical goals was to combine light from all four telescopessimultaneously, and this was achieved first on UT 2005 Sep 18 and again on the subsequent night.
One of the critical reasons for our successes was the sophisticated graphical user interfaces (GUIs) programmedusing python pyGTK that we were developed during the commissioning run in response to unexpected needs.Thureau et al. (these proceedings) give more details about the benefits of using TCP/IP sockets and pythonfor creating flexible, “lightweight,” and attractive GUI interfaces which were critically needed for controlling theinstrument and searching multiple delay lines for fringes.
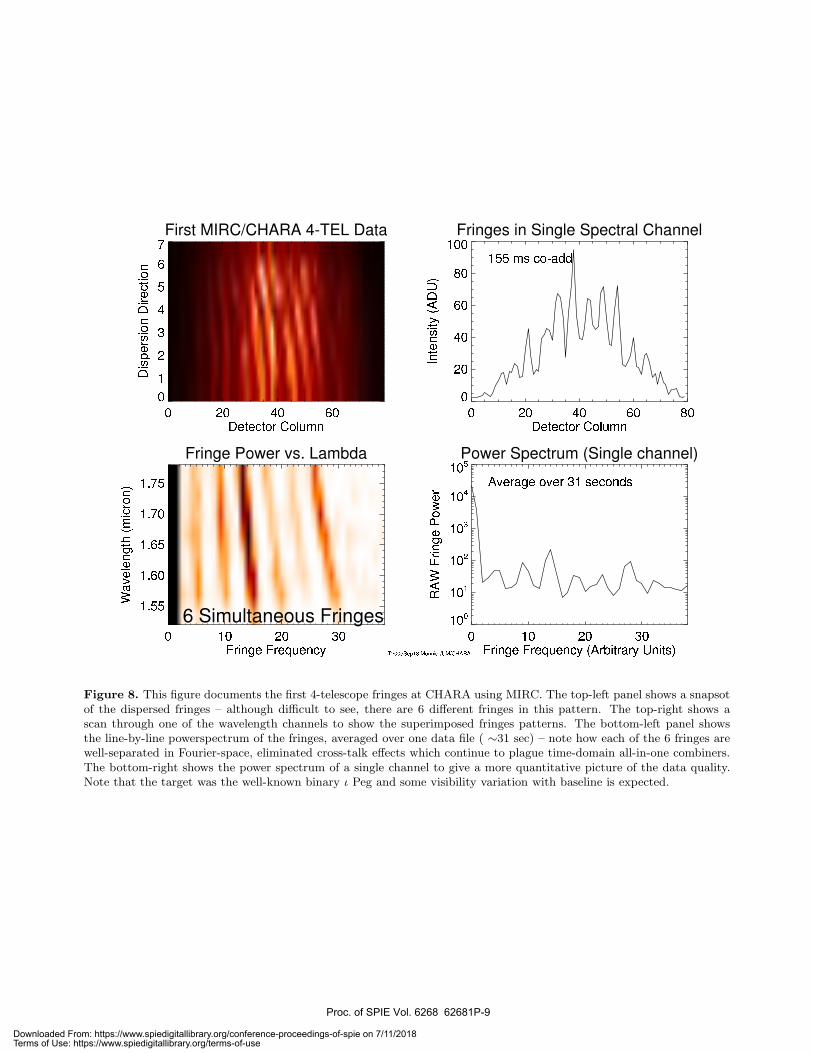
Figure 8 shows the results from our first 4-telescope observing. The fringes from all baselines are detectedand real-time fringe tracking was implemented during observing. This commissioning run did not result in anyastronomically-useful data since we achieved this milestone on the penultimate night of our run. The first scienceruns are planned for June and August of 2006.
H K
98% 98%
Gold OAP 98% 98%
25% 36%
95% 90%
92% 92%
99% 90%
97% 92%
98% 98%
Cylindrical (AR) 97% 97%
Slit 95% 95%
Doublet (AR) 94% 94%
Prism Pair (AR) 92% 92%
Window (AR) 97% 97%
Bandpass Filter 85% 85%
Doublet (AR) 94% 94%
Detector (QE) 60% 60%
7.3% 8.6%
MIRC Throughput Estimate
3 reflections (silver, gold, silver)
22 surfaces (2.5 uncoated)
Silver Pickoff
Fiber Coupling (5cm r0)
Fiber transmission (1m)
Fiber Fresnel
Lenslet transmission
Lenslet Fresnsel
Mirror (silver)
Expected Transmission
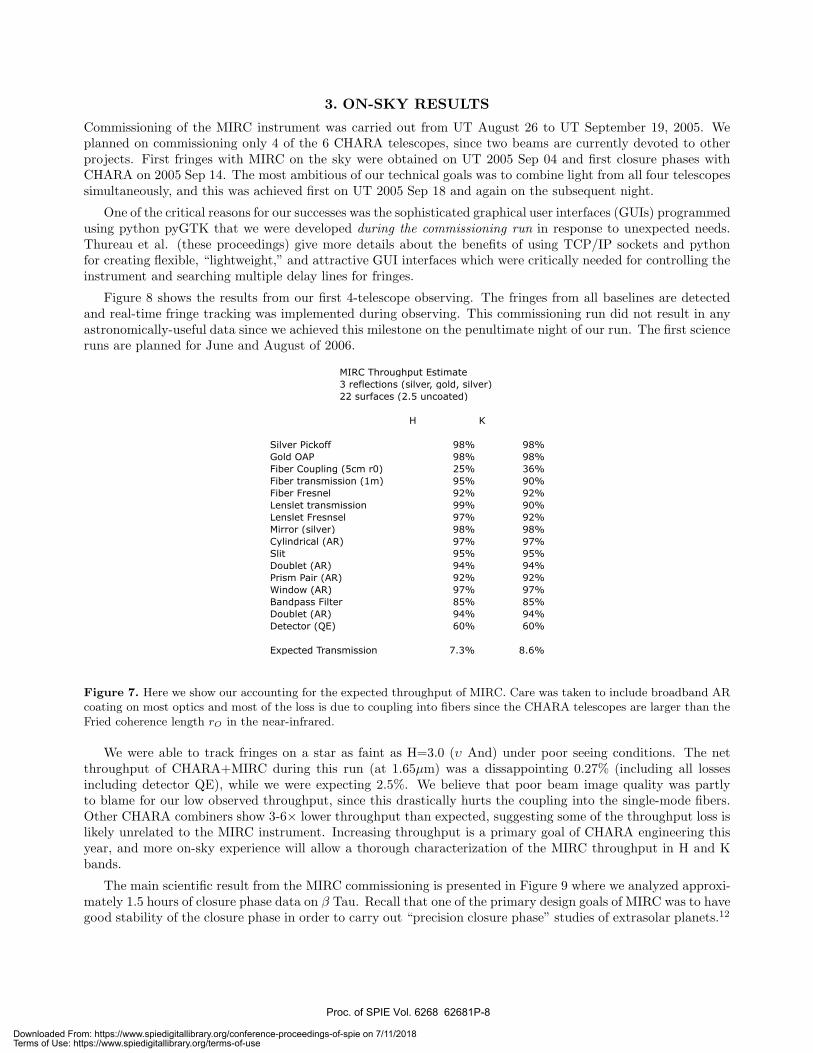
Figure 7. Here we show our accounting for the expected throughput of MIRC. Care was taken to include broadband ARcoating on most optics and most of the loss is due to coupling into fibers since the CHARA telescopes are larger than theFried coherence length rO in the near-infrared.
We were able to track fringes on a star as faint as H=3.0 (υ And) under poor seeing conditions. The netthroughput of CHARA+MIRC during this run (at 1.65µm) was a dissappointing 0.27% (including all lossesincluding detector QE), while we were expecting 2.5%. We believe that poor beam image quality was partlyto blame for our low observed throughput, since this drastically hurts the coupling into the single-mode fibers.Other CHARA combiners show 3-6× lower throughput than expected, suggesting some of the throughput loss islikely unrelated to the MIRC instrument. Increasing throughput is a primary goal of CHARA engineering thisyear, and more on-sky experience will allow a thorough characterization of the MIRC throughput in H and Kbands.
The main scientific result from the MIRC commissioning is presented in Figure 9 where we analyzed approxi-mately 1.5 hours of closure phase data on β Tau. Recall that one of the primary design goals of MIRC was to havegood stability of the closure phase in order to carry out “precision closure phase” studies of extrasolar planets.12
Proc. of SPIE Vol. 6268 62681P-8
Downloaded From: https://www.spiedigitallibrary.org/conference-proceedings-of-spie on 7/11/2018Terms of Use: https://www.spiedigitallibrary.org/terms-of-use
0
S
4
e
D
GC0
C
n
w
U32
C')
a-
0C)
8
>
29 q
dE 1
CQ>
0)
V
-r:
E
np
A
0
Figure 8. This figure documents the first 4-telescope fringes at CHARA using MIRC. The top-left panel shows a snapsotof the dispersed fringes – although difficult to see, there are 6 different fringes in this pattern. The top-right shows ascan through one of the wavelength channels to show the superimposed fringes patterns. The bottom-left panel showsthe line-by-line powerspectrum of the fringes, averaged over one data file ( ∼31 sec) – note how each of the 6 fringes arewell-separated in Fourier-space, eliminated cross-talk effects which continue to plague time-domain all-in-one combiners.The bottom-right shows the power spectrum of a single channel to give a more quantitative picture of the data quality.Note that the target was the well-known binary ι Peg and some visibility variation with baseline is expected.
Proc. of SPIE Vol. 6268 62681P-9
Downloaded From: https://www.spiedigitallibrary.org/conference-proceedings-of-spie on 7/11/2018Terms of Use: https://www.spiedigitallibrary.org/terms-of-use
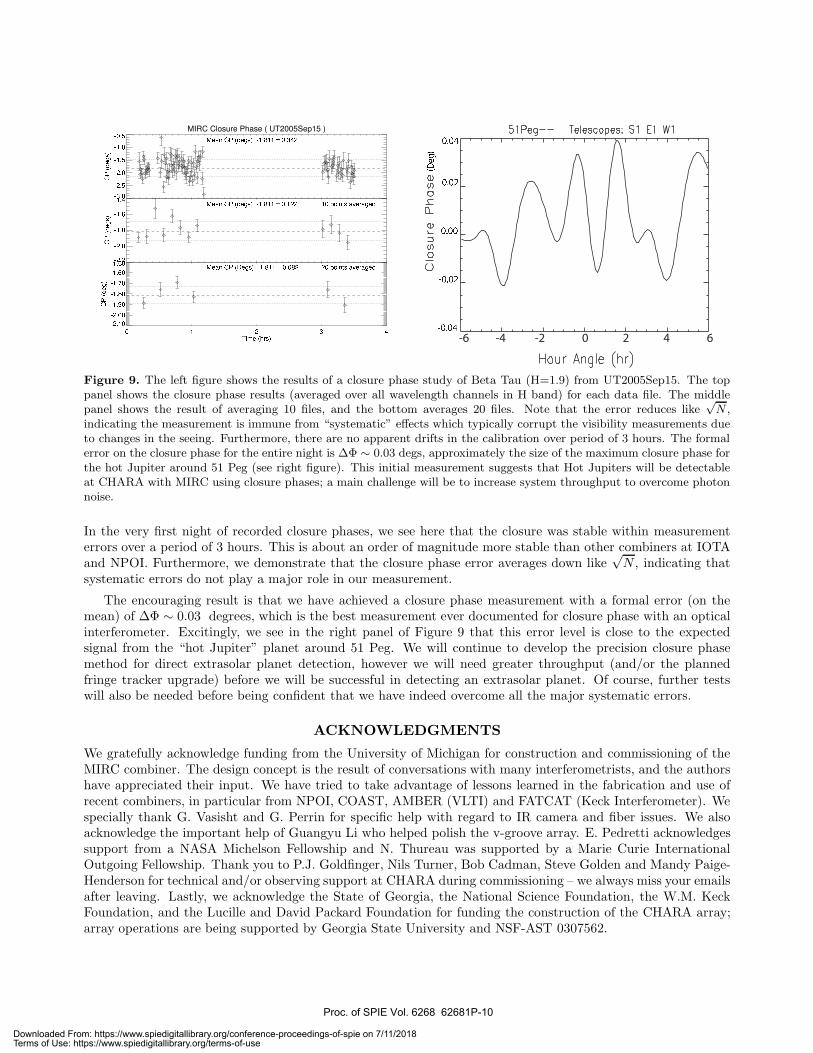
C)
0)
Figure 9. The left figure shows the results of a closure phase study of Beta Tau (H=1.9) from UT2005Sep15. The toppanel shows the closure phase results (averaged over all wavelength channels in H band) for each data file. The middlepanel shows the result of averaging 10 files, and the bottom averages 20 files. Note that the error reduces like
√N ,
indicating the measurement is immune from “systematic” effects which typically corrupt the visibility measurements dueto changes in the seeing. Furthermore, there are no apparent drifts in the calibration over period of 3 hours. The formalerror on the closure phase for the entire night is ∆Φ ∼ 0.03 degs, approximately the size of the maximum closure phase forthe hot Jupiter around 51 Peg (see right figure). This initial measurement suggests that Hot Jupiters will be detectableat CHARA with MIRC using closure phases; a main challenge will be to increase system throughput to overcome photonnoise.
In the very first night of recorded closure phases, we see here that the closure was stable within measurementerrors over a period of 3 hours. This is about an order of magnitude more stable than other combiners at IOTAand NPOI. Furthermore, we demonstrate that the closure phase error averages down like
√N , indicating that
systematic errors do not play a major role in our measurement.
The encouraging result is that we have achieved a closure phase measurement with a formal error (on themean) of ∆Φ ∼ 0.03 degrees, which is the best measurement ever documented for closure phase with an opticalinterferometer. Excitingly, we see in the right panel of Figure 9 that this error level is close to the expectedsignal from the “hot Jupiter” planet around 51 Peg. We will continue to develop the precision closure phasemethod for direct extrasolar planet detection, however we will need greater throughput (and/or the plannedfringe tracker upgrade) before we will be successful in detecting an extrasolar planet. Of course, further testswill also be needed before being confident that we have indeed overcome all the major systematic errors.
ACKNOWLEDGMENTS
We gratefully acknowledge funding from the University of Michigan for construction and commissioning of theMIRC combiner. The design concept is the result of conversations with many interferometrists, and the authorshave appreciated their input. We have tried to take advantage of lessons learned in the fabrication and use ofrecent combiners, in particular from NPOI, COAST, AMBER (VLTI) and FATCAT (Keck Interferometer). Wespecially thank G. Vasisht and G. Perrin for specific help with regard to IR camera and fiber issues. We alsoacknowledge the important help of Guangyu Li who helped polish the v-groove array. E. Pedretti acknowledgessupport from a NASA Michelson Fellowship and N. Thureau was supported by a Marie Curie InternationalOutgoing Fellowship. Thank you to P.J. Goldfinger, Nils Turner, Bob Cadman, Steve Golden and Mandy Paige-Henderson for technical and/or observing support at CHARA during commissioning – we always miss your emailsafter leaving. Lastly, we acknowledge the State of Georgia, the National Science Foundation, the W.M. KeckFoundation, and the Lucille and David Packard Foundation for funding the construction of the CHARA array;array operations are being supported by Georgia State University and NSF-AST 0307562.
Proc. of SPIE Vol. 6268 62681P-10
Downloaded From: https://www.spiedigitallibrary.org/conference-proceedings-of-spie on 7/11/2018Terms of Use: https://www.spiedigitallibrary.org/terms-of-use
REFERENCES1. T. A. ten Brummelaar, H. A. McAlister, S. T. Ridgway, W. G. Bagnuolo, N. H. Turner, L. Sturmann,
J. Sturmann, D. H. Berger, C. E. Ogden, R. Cadman, W. I. Hartkopf, C. H. Hopper, and M. A. Shure,“First Results from the CHARA Array. II. A Description of the Instrument,” ApJ 628, pp. 453–465,July 2005.
2. H. A. McAlister, T. A. ten Brummelaar, D. R. Gies, W. Huang, W. G. Bagnuolo, M. A. Shure, J. Sturmann,L. Sturmann, N. H. Turner, S. F. Taylor, D. H. Berger, E. K. Baines, E. Grundstrom, C. Ogden, S. T.Ridgway, and G. van Belle, “First Results from the CHARA Array. I. An Interferometric and SpectroscopicStudy of the Fast Rotator α Leonis (Regulus),” ApJ 628, pp. 439–452, July 2005.
3. J. D. Monnier, J.-P. Berger, R. Millan-Gabet, and T. A. Ten Brummelaar, “The Michigan Infrared Combiner(MIRC): IR imaging with the CHARA Array,” in New Frontiers in Stellar Interferometry, Proceedings ofSPIE Volume 5491. Edited by Wesley A. Traub. Bellingham, WA: The International Society for OpticalEngineering, 2004., p.1370, W. A. Traub, ed., pp. 1370–+, Oct. 2004.
4. V. Coude du Foresto, S. Ridgway, and J.-M. Mariotti, “Deriving object visibilities from interferogramsobtained with a fiber stellar interferometer,” A&AS 121, pp. 379–392, Feb. 1997.
5. T. ten Brummelaar, “Visible light imaging,” Tech. Rep. Appendix-K, CHARA Array, Georgia State Uni-versity, Atlanta, GA, 1993.
6. S. Ridgway, “Infrared beam combining and detection,” Tech. Rep. Appendix-L, CHARA Array, GeorgiaState University, Atlanta, GA, 1993.
7. T. ten Brummelaar, “Visible light imaging,” Tech. Rep. Appendix-I, CHARA Array, Georgia State Univer-sity, Atlanta, GA, 1993.
8. F. Malbet, R. G. Petrov, I. Tallon-Bosc, K. Hofmann, D. Mourard, T. Forveille, F. Cassaing, F. Reynaud,M. Tallon, P. Mege, and K. Rousselet-Perraut, “System analysis of the AMBER instrument on VLTI,” inInterferometry for Optical Astronomy II. Edited by Wesley A. Traub . Proceedings of the SPIE, Volume4838, pp. 1163-1170 (2003)., pp. 1163–1170, Feb. 2003.
9. M. Gai, L. Corcione, L. Delatge, D. Gardiol, A. Gennai, M. G. Lattanzi, D. Loreggia, G. Massone,S. Menardi, and F. Reynaud, “The FINITO Fringe Sensor for VLTI,” in Beyond conventional adaptiveoptics. ESO Conference and Workshop Proceedings, Vol. 58, ISBN 3923524617, pp. 329–+, 2002.
10. E. Pedretti, R. Millan-Gabet, J. D. Monnier, W. A. Traub, N. P. Carleton, J.-P. Berger, M. G. Lacasse,F. P. Schloerb, and M. K. Brewer, “The PICNIC Interferometry Camera at IOTA,” PASP 116, pp. 377–389,Apr. 2004.
11. J. G. Burnett and J. D. C. Jones, “Cutting optical fibers to equal lengths for broadband stellar interferom-etry,” Appl. Opt. 31, pp. 2977–+, June 1992.
12. J.-L. Beuzit, D. Mouillet, B. R. Oppenheimer, and J. D. Monnier, “Direct detection of exoplanets,” inProtostars and Planets V, 2006.
Proc. of SPIE Vol. 6268 62681P-11
Downloaded From: https://www.spiedigitallibrary.org/conference-proceedings-of-spie on 7/11/2018Terms of Use: https://www.spiedigitallibrary.org/terms-of-use