michigan integrated resource planning parameters · 2 ii. executive summary this michigan...
TRANSCRIPT
MICHIGAN INTEGRATED
RESOURCE PLANNING
PARAMETERS Pursuant to Public Act 341 of 2016, Section 6t
November 21, 2017
1
I. Table of Contents
II. Executive Summary ......................................................................................................... 2
III. Background ..................................................................................................................... 2
IV. Energy Waste Reduction Potential Study ........................................................................ 3
V. Demand Response Potential Study ................................................................................. 5
VI. State and Federal Environmental Regulations, Laws and Rules ..................................... 7 Section 460.6t (1) (c) ...................................................................................................... 7 Section 460.6t (1) (d) .................................................................................................... 12 Section 460.6t (5) (m) ................................................................................................... 13 VII. Planning Reserve Margins and Local Clearing Requirements ...................................... 13 VIII. Modeling Scenarios, Sensitivities and Assumptions ...................................................... 15
IX. Michigan IRP Modeling Input Assumptions and Sources as a Table ............................ 24
X. Additional IRP Requirements and Assumptions ............................................................ 26
Appendix A: Organization Participation List ............................................................................ 28
Appendix B: Map of MISO Local Resource Zones .................................................................. 29
Appendix C: Map of PJM Local Deliverability Areas ............................................................... 30
Appendix D: Public Act 341 of 2016, Section 6t (1) ................................................................ 31
Appendix E: Environmental Regulatory Timeline .................................................................... 32
2
II. Executive Summary
This Michigan Integrated Resource Planning Parameters document was developed as a part
of the implementation of the provisions of Public Act 341 of 2016 (PA 341), Section 6t. This
document includes three integrated resource plan (IRP) modeling scenarios with multiple
sensitivities per scenario for the rate-regulated utilities in Michigan’s Upper Peninsula, and three
IRP modeling scenarios with multiple sensitivities per scenario for the rate-regulated utilities in
Michigan’s Lower Peninsula. None of the scenarios, sensitivities or other modeling parameters
included within this document should be construed as policy goals or even as likely predictions
of the future. Instead, the scenarios, sensitivities and modeling parameters are more aptly
characterized as stressors utilized to test how different future resource plans perform relative to
each other with respect to affordability, reliability, adaptability, and environmental stewardship.
In some instances, scenarios and sensitivities intentionally push the boundaries on what may be
viewed as probable and could be considered as bookends on the range of possible future
outcomes. Utilities may also include separate additional scenarios and sensitivities in their IRPs,
and may use different assumptions or forecasts for the additional scenarios and sensitivities.
However, the assumptions and parameters outlined in this document should be used for the
required scenarios and sensitivities. Including the scenarios will ensure that Michigan’s electric
utilities will consider a wide variety of resources such as renewable energy, demand response,
energy waste reduction, storage, distributed generation technologies, voltage support solutions,
and transmission and non-transmission alternatives, in addition to traditional fossil-fueled
generation alternatives for the future. This IRP parameters document also contains numerous
modeling assumptions and requirements, requires sensitivities for each scenario, identifies
significant environmental regulations and laws that effect electric utilities in the state, and
identifies required planning reserve margins and local clearing requirements in areas of the
state.
The Demand Response Potential Study was completed in September 2017 and the
assessment of Energy Waste Reduction Potential was completed in August 2017. Both studies
have influence on integrated resource planning and are incorporated into the Commission’s
Docket (Case No. U-184181) for the implementation of the provisions of PA 341 Section 6t.
Section 6t (1) requires that the IRP parameters, required modeling scenarios and
sensitivities, applicable reliability requirements, applicable environmental rules and regulations,
and the demand response and energy waste reduction potential studies be re-examined every
five years. The next 120-day proceeding to conduct these assessments and gather input should
commence in July 2022.
III. Background
On December 21, 2016, Governor Rick Snyder signed PA 341 into law, which amended
Public Act 3 of 1939 and became effective on April 20, 2017. The law requires the Michigan
Public Service Commission (MPSC or Commission), with input from the Michigan Agency for
1 http://efile.mpsc.state.mi.us/efile/viewcase.php?casenum=18418&submit.x=0&submit.y=0
3
Energy (MAE), Michigan Department of Environmental Quality (MDEQ), and other interested
parties to set modeling parameters and assumptions for utilities to use in filing integrated
resource plans. PA 341 then requires rate-regulated electric utilities to submit IRPs to the MPSC
for review and approval.
The MPSC, MAE, and MDEQ Staff (Staff) began the collaborative process on March 10,
2017 with state-wide participation from a wide-range of stakeholders (listed in Appendix A). To
address the requirements of PA 341 Section 6t (1), subsections (a) through (e), and to develop
the modeling assumptions, scenarios, and sensitivities pursuant to Section 6t (1), subsection (f),
eight workgroups were formed:
1. Energy Waste Reduction, to address MCL 460.6t (1) subsections (a) and (f) (iii)
2. Demand Response, to address MCL 460.6t (1) subsections (b) and (f) (iii)
3. Environmental Policy, to address MCL 460.6t (1) subsections (c), (d), and (f) (ii)
4. Renewables and PURPA, to address MCL 460.6t (1) subsection (f) (iii)
5. Forecasting, Fuel Prices and Reliability, to address MCL 460.6t (1)
subsections (e) and (f) (i), (iii), (iv) and (v)
6. Transmission, to address MCL 460.6t (1) subsection (f) (iii)
7. Other Market Options and Advanced Technologies, to address MCL 460.6t (1)
subsection (f) (iii)
8. Upper Peninsula (Zone 2), to address MCL 460.6t (1) subsections (f) (i) and (iv)
Stakeholders were invited to participate in and assist with leading the various workgroups.
The workgroups met regularly from late March to mid-June to discuss how to address various
subsections of PA 341 Section 6t. On June 19, each workgroup submitted recommendations to
the Staff for potential inclusion into this IRP parameter document. Further details on the events
that have taken place with stakeholder involvement in the development of the concepts included
in this document are included on the energy legislation implementation website.2
The Commission released an earlier draft of this document with a Commission Order
initiating Case No. U-18418 on July 31, 2017. Interested parties were provided an opportunity
to file comments and reply comments in Case No. U-18418. The Commission has considered
the comments and reply comments and has incorporated several changes herein.
IV. Energy Waste Reduction Potential Study
To comply with PA 341 Section 6t (1) (a) and (f) (iii)
The statewide assessment of energy waste reduction (EWR) potential was built upon existing
studies provided by two, utility-specific 20-year potential studies conducted in 2016, by GDS
Associates, Inc. (GDS). These utility-specific EWR potential studies are considered by MPSC
2 http://www.michigan.gov/mpsc/0,4639,7-159-80741_80743-406248--,00.html
4
Staff to represent potential values which reflect a ‘business as usual’ assessment of achievable,
technical and economic potential consistent with requirements of the prior energy law, Public
Act 295 of 2008 (PA 295).3 In determining a statewide assessment, MPSC Staff was cognizant
of stakeholder feedback and therefore attempted to consider the Lower Peninsula separately
from the Upper Peninsula assessment as discussed below.
Lower Peninsula. In order to develop additional data points which reflect the incremental
EWR potential possible under more aggressive program goals consistent with Public Acts 341
and 342 of 2016, stakeholders first combined the separate utility-specific potential studies into a
Lower Peninsula study, resulting in an assessment of EWR potential under PA 295 era, business
as usual assumptions. From there, stakeholders developed additional modeling scenarios and
sensitivities designed to assess additional cost effective EWR savings available with more
aggressive programs.
The business as usual assessment and supplemental study results4 were combined into one
report and can be found on the energy legislation implementation webpage for the EWR
Potential Study. This study includes the combined business as usual potential results on pages
1 through 85, with the additional potential identified under more aggressive EWR programs,
summarized starting on page 87. The EWR supply curves for the business as usual
assumptions and more aggressive scenarios are found in Appendix G, starting on page 277 of
the report. The modeling scenarios, assumptions, and sensitivities for the supplemental study
are briefly summarized below with details provided on the webpage.5
Scenario #1: Sensitivity on Incentive Levels – GDS revised the basic analysis of Achievable
Potential for the Consumers Energy Company and the DTE Electric Company service areas
using the assumption that the programs would pay 100% of incremental costs6 for all
measures/bundles of measures that would still pass the Utility Cost Test at the higher incentive
level (i.e., if the program’s paid incentives equal to 100% of incremental cost of the measure, as
opposed to using the 50% of incremental cost assumption.)
Scenario #2: Aggressive Investment/Emerging Technologies – assumes higher avoided cost
for energy and capacity (such as due to higher gas prices), incentives at 100% of the measure’s
incremental cost, optimistic market penetration, and inclusion of some emerging technologies
that are presumed to be cost-effective.
Scenario #3: Environmental Regulation – assumes environmental regulations have
increased electric avoided costs reflecting a monetary value for decreasing carbon emissions.
Upper Peninsula. The Upper Peninsula potential study assessment also built upon the
foundation of existing utility-specific potential studies. Efforts were made to incorporate
3 Public Act 295 Energy Optimization programs contained caps on program spending which were removed in the Public Act 342 Energy Waste Reduction programs. 4 See supplemental potential study for the Lower Peninsula, http://www.michigan.gov/documents/mpsc/MI_Lower_Peninsula_EE_Potential_Study_Final_Report_08.11.17_598053_7.pdf 5 For more details on the assumptions for the supplemental EWR study for the Lower Peninsula, see http://www.michigan.gov/documents/mpsc/Scenario_assumptions-_07.09.17_599440_7.docx. 6 For Low-Income measures, the utilities are assumed to pay 100% of the measure cost.
5
assumptions which reflected the additional opportunities for EWR potential of the Upper
Peninsula due to the generally higher cost of electricity in that region.
The analysis utilized historic and forecast data compiled for the load serving entities in that
region for the 20-year period starting in 2016, with estimates for the number of Upper Peninsula
region electric customers, sales by sector (i.e., residential, commercial, industrial), and Upper
Peninsula region peak load data. The analysis also included background data from existing
potential studies from service territories which most closely resembled the rural nature and
dispersed populations found in the service territories in the Upper Peninsula.
The final result of this modest analysis provides a business as usual estimate of EWR
potential under base case assumptions. Additional work would be required to further assess the
potential for EWR under the more aggressive modeling scenario/sensitivities.
Statewide Assessment of EWR Potential. The additional assessments for EWR potential
for the Lower and Upper Peninsulas for the 2017 through 2036 timeframe were completed in
mid-August and together form the basis for the MPSC Staff’s statewide assessment of EWR
potential. These assessments include supply curves for the Lower Peninsula. As previously
mentioned, these studies are available on the MPSC Energy Legislation webpage.7
V. Demand Response Potential Study
To comply with PA 341 Section 6t (1) (b)
To comply with Section 6t, Staff determined that the assessment for use of demand response
programs would best be comprised of two parts: a technical study8 and a market assessment.9
Technical Study. The technical potential study estimates the technical and achievable
potential for reducing on-peak electricity usage through demand response programs for all
customer classes. The study determines demand response potential for the 20-year period
beginning in 2018.
In the technical study, demand response potential is calculated using data and assumptions
for inputs such as customer eligibility, likely participation rates, per customer demand reduction,
program costs, avoided costs, etc. This quantitative measure of demand response potential and
the costs and savings associated with potential resources have been used as an input for the
IRP modeling scenarios.
7 See supplemental potential study for the Lower Peninsula, http://www.michigan.gov/documents/mpsc/MI_Lower_Peninsula_EE_Potential_Study_Final_Report_08.11.17_598053_7.pdf; See also assumptions for supplemental potential study for the Upper Peninsula, http://www.michigan.gov/documents/mpsc/UP_EE_Potential_Study_Final_Report--memorandum_08.09.17_598056_7.docx. 8 Demand Response Potential Study, http://www.michigan.gov/documents/mpsc/State_of_Michigan_-_Demand_Response_Potential_Report_-_Final_29sep2017__602435_7.pdf. 9 Demand Response Market Assessment, http://www.michigan.gov/documents/mpsc/MI_Demand_Response_Market_Assessment_20170929_602432_7.pdf.
6
Demand response programs considered by the study include behavioral programs, time-of-
use pricing, direct load control, interruptible and curtailment, ancillary service, and more.
Programs are modeled by customer class. Pre-existing demand response programs were not
favored over not-yet-existing programs in the calculation of statewide potential.
The study results in two levels of realistically achievable amounts of demand response
potential, called the integrated low case and integrated high case. The low case is the product
of more conservative assumptions for program participation and enabling technology
penetration, while the high case assumes higher participation. For example, the low case
assumes residential time-of-use rates are opt-in for customers, resulting in lower participation
than the high case, where time-of-use rates are opt-out. Full details on all of the assumptions
relied upon are described in the study.
Market Assessment. The market assessment examines the potential for demand response
for large commercial and industrial (LCI) customers through surveys, interviews, and analysis of
the customer class. This approach evaluates the LCI customer’s capability, desire, and
motivation to participate in demand response programs by gathering that information directly
from those customers to determine interest and capability for participating in demand response
programs, identifying any barriers to participation, and evaluating a reasonable and achievable
potential for peak load management in Michigan.
LCI customers are defined as non-residential, non-lighting customers that have a maximum
annual demand of greater than or equal to 1 MW. Given the wide diversity of load profiles in the
LCI class and the constrained timeline for the market assessment, it was best to focus on the
largest (by demand) customers first. Also, LCI customers represent a large portion of statewide
load and have shown to be highly receptive to demand response programs.
By surveying LCI customers to determine the parameters of a demand response program
that would maximize their participation, the market assessment provides better insight on
customers’ energy needs to inform effective program design and better inform the statewide
assessment.
When combined into a comprehensive statewide assessment of demand response potential,
the results of the two studies provide demand response resources, with cost and megawatt load
reduction per program that can compete directly with supply-side options in the IRP modeling
process. The IRP model will choose the most economical way to meet load, whether the
resource increases supply or decreases demand. The potential study provides the data
necessary, including the limits of the demand side resources, to allow all methods to meet load
to compete equally.
Study and Stakeholder Process. MPSC Staff met with the demand response workgroup
in March and April to develop scopes for the two-part study. After combining the ideas and
comments of stakeholders in the workgroup, MPSC Staff issued requests for proposals in May.
Bids were received and evaluated in June, and contracts for the two studies were awarded. The
contractors delivered the final statewide potential study on September 29, 2017. The final study
integrates results of the market assessment.
7
VI. State and Federal Environmental Regulations, Laws and Rules
Appendix E contains a regulatory timeline of the environmental regulations, laws and rules
discussed in this section.
To comply with PA 341 Section 6t (1) (c)
Federal rules and laws:
Clean Air Act – The Clean Air Act is a United States federal law designed to control air
pollution on a national level. The Clean Air Act is a comprehensive law that established the
National Ambient Air Quality Standards (NAAQS), Maximum Achievable Control Technology
Standards (MACT), Hazardous Air Pollutant Standards, and numerous other regulations to
address pollution from stationary and mobile sources.
National Ambient Air Quality Standards – Title 1 of the Clean Air Act requires the United
States Environmental Protection Agency (EPA) to set NAAQS for six criteria pollutants that have
the potential of harming human health or the environment. The NAAQS are rigorously vetted by
the scientific community, industry, public interest groups, and the public. The NAAQS establish
maximum allowable concentrations for each criteria pollutant in outdoor air. Primary standards
are set at a level that is protective of health with an adequate margin of safety. Secondary
standards are protective of public welfare, including protection from damage to crops, forests,
buildings, or the impairment of visibility. The adequacy of each standard is to be reviewed every
five years. The six pollutants are carbon monoxide, lead, ozone, nitrogen dioxide, particulate
matter, and sulfur dioxide.10
Nonattainment areas are regions that fail to meet the NAAQS. Locations where air pollution
levels are found to contribute significantly to violations or maintenance impairment in another
area may also be designated nonattainment. These target areas are expected to make
continuous, forward progress in controlling emissions within their boundaries. Those that do not
abide by the Clean Air Act requirements to reign in the emissions of the pollutants are subject to
EPA sanctions, either through the loss of federal subsidies or by the imposition of controls
through preemption of local or state law. States are tasked with developing strategic plans to
achieve attainment, adopting legal authority to accomplish the reductions, submitting the plans
to the EPA for approval into the State Implementation Plan, and ensuring attainment occurs by
the statutory deadline. States may also submit a plan to maintain the NAAQS into the future
along with contingency measures that will be implemented to promptly correct any future
violation of the NAAQS.
Sulfur Dioxide Nonattainment Areas – In 2010, the EPA strengthened the primary NAAQS
for SO2, establishing a new 1-hour standard of 75 parts per billion (ppb).
A federal consent order set deadlines for the EPA to designate nonattainment areas in
several rounds. Round one designations were made in October 2013, based on violations of
the NAAQS at ambient monitors. A portion of Wayne County was designated nonattainment.
10 The most recent NAAQS can be accessed here: https://www.epa.gov/criteria-air-pollutants/naaqs-table.
8
The area must attain the NAAQS by October 2018. The state’s attainment plan was due to the
EPA by April 2015.
Round two designations were based on modeling of emissions from sources emitting over
2000 tons of SO2 per year. A portion of St. Clair County was designated nonattainment in
September 2016. Attainment must be achieved by September 2021, and the state’s attainment
plan is due to the EPA by March 2018.
Round three designations will address all remaining undesignated areas by December 31,
2017. The EPA sent a letter to Governor Snyder on August 22, 2017, 120 days prior to the
intended designation date, indicating that Alpena County and Delta County are to be designated
as unclassifiable/attainment areas. Remaining areas of Michigan that were not required to be
characterized and for which the EPA does not have information suggesting that the area may
not be meeting the NAAQS, or contributing to air quality violations in a nearby area that does
not meet the NAAQS, are intended to also be designated as unclassifiable/attainment.
Cross-State Air Pollution Rule – The Cross-State Air Pollution Rule (CSAPR) was
promulgated to address air pollution from upwind states that is transported across state lines
and impacts the ability of downwind states to attain air quality standards. The rule was
developed in response to the Good Neighbor obligations under the Clean Air Act for the ozone
standards and fine particulate matter standards. CSAPR is a cap and trade rule which governs
the emission of SO2 and NOx from fossil-fueled electric generating units through an allowance-
based program. Under this program, NOx is regulated on both an annual basis and during the
ozone season (May through September). Each allowance (annual or ozone) permits the
emission of one ton of NOx, with the emissions cap and number of allocated allowances
decreasing over time. Recently, the EPA promulgated the CSAPR Update, which addresses
interstate transport for the 2008 ozone standard and went into effect in May 2017. In the future,
the state will have Good Neighbor obligations for the 2015 ozone standard.
Mercury and Air Toxics Standards – Section 302 of the Clean Air Act requires the EPA to
adopt maximum available control technology standards for hazardous air pollutants. The
Mercury and Air Toxics Standards (MATS) became effective April 16, 2012. The MATS rule
requires new and existing oil and coal-fueled facilities to achieve emission standards for
mercury, acid gases, certain metals, and organic constituents. Existing sources were required
to comply with these standards by April 16, 2015. Some individual sources were granted an
additional year, at the discretion of the Air Quality Division of the MDEQ. In June 2015, the
United States Supreme Court found that the EPA did not properly consider costs in making its
determination to regulate hazardous pollutants from power plants. In December 2015, the DC
Circuit Court of Appeals ruled that MATS may be enforced as the EPA modifies the rule to
comply with the United States Supreme Court decision. The deadline for MATS compliance for
all electric generating units was April 16, 2016.
Clean Air Act Section 111(b), Standards of Performance for Greenhouse Gas
Emissions from New, Modified and Reconstructed Stationary Sources: Electric Utility
Generating Units – New Source Performance Standards (NSPS) are established under Section
111(b) of the Clean Air Act for certain industrial sources of emissions determined to endanger
9
public health and welfare. In October 2015, the EPA finalized a NSPS that established standards
for emissions of carbon dioxide for newly constructed, modified, and reconstructed fossil-fuel
fired electric generating units. There are different standards of performance for fossil fuel-fired
steam generating units and fossil fuel-fired combustion turbines.11
Clean Air Act Section 111(d), Carbon Pollution Emission Guidelines for Existing
Stationary Sources: Electric Utility Generating Units (Clean Power Plan) – Section 111(d)
of the Clean Air Act requires the EPA to establish standards for certain existing industrial
sources. The final Clean Power Plan, promulgated on October 23, 2015, addressed carbon
emissions from electric generating units. The Clean Power Plan established interim and final
statewide goals and tasked states with developing and implementing plans for meeting the
goals. Michigan’s final goal was to reduce carbon dioxide emissions by 31 percent from a 2005
baseline by 2030.12
On February 9, 2016, the United States Supreme Court issued five orders granting a stay of
the Clean Power Plan pending judicial review. On March 28, 2017, President Trump signed an
Executive Order directing the EPA to review the Clean Power Plan and the standards of
performance for new, modified, and reconstructed electric generating units (section 111(b) rule).
As a result, the Department of Justice filed motions to hold those cases in abeyance pending
the EPA’s review of both rules, including through the conclusion of any rulemaking process that
results from that review. The Clean Power Plan does not currently affect Michigan utilities,
however due to the EPA’s 2009 endangerment finding on greenhouse gases, utilities should
address their future anticipated greenhouse gas emissions.
Greenhouse Gas Reporting Program – The Greenhouse Gas Reporting Program (codified
at 40 CFR Part 98) tracks facility-level emissions of greenhouse gas from large emitting facilities,
suppliers of fossil fuels, suppliers of industrial gases that result in greenhouse gas emissions
when used, and facilities that inject carbon dioxide underground. Facilities calculate their
emissions using approved methodologies and report the data to the EPA. Annual reports
covering emissions from the prior calendar year are due by March 31 of each year. The EPA
conducts a multi-step verification process to ensure reported data is accurate, complete and
consistent. This data is made available to the public in October of each year through several
data portals.
Boiler Maximum Achievable Control Technology – The Boiler MACT establishes national
emission standards for hazardous air pollutants from three major source categories: industrial
boilers, commercial and institutional boilers, and process heaters. The final emission standards
for control of mercury, hydrogen chloride, particulate matter (as a surrogate for non-mercury
metals), and carbon monoxide (as a surrogate for organic hazardous emissions) from coal-fired,
biomass-fired, and liquid-fired major source boilers are based on the MACT. In addition, all
11 The 111(b) standards can be found in Table 1 here: https://www.federalregister.gov/documents/2015/10/23/2015-22837/standards-of-performance-for-greenhouse-gas-emissions-from-new-modified-and-reconstructed-stationary. 12 The 111(d) rule can be viewed in full here: https://www.federalregister.gov/documents/2015/10/23/2015-22842/carbon-pollution-emission-guidelines-for-existing-stationary-sources-electric-utility-generating.
10
major source boilers and process heaters are subject to a work practice standard to periodically
conduct tune-ups of the boiler or process heater.
Regional Haze – Section 169 of the federal Clean Air Act sets forth the provisions to improve
visibility, or visual air quality, in 156 national parks and wilderness areas across the country by
establishing a national goal to remedy impairment of visibility in Class 1 federal areas from
manmade air pollution. States must ensure that emission reductions occur over a period of time
to achieve natural conditions by 2064. Air pollutants that have the potential to affect visibility
include fine particulates, nitrogen oxides, sulfur dioxide, certain volatile organic compounds and
ammonia. The 1999 Regional Haze rule required states to evaluate the best available retrofit
technology (BART) to address visibility impairment from certain categories of major stationary
sources built between 1962 and 1977. A BART analysis considered five factors as part of each
source-specific analysis: 1) the costs of compliance, 2) the energy and non-air quality
environmental impacts of compliance, 3) any existing pollution control technology in use at the
source, 4) the remaining useful life of the source, and 5) the degree of visibility improvement that
may reasonably be anticipated to result from use of such technology. For fossil-fueled electric
generating plants with a total generating capacity in excess of 750 MW, states must use
guidelines promulgated by the EPA. In 2005, the EPA published the guidelines for BART
determinations. Michigan has met the initial BART determination requirements. In December
2016, the EPA issued a final rule setting revised and clarifying requirements for periodic updates
in state plans. The next periodic update is due July 31, 2021. There are two Class 1 areas in
Michigan: Seney National Wildlife Refuge and Isle Royal National Park. Michigan also has an
obligation to eliminate the state’s contribution to impairment in Class 1 areas in other states.
Resource Conservation and Recovery Act – The Resource Conservation and Recovery
Act (RCRA) gives the EPA the authority to control hazardous waste from the "cradle-to-grave”,
which includes the generation, transportation, treatment, storage, and disposal of hazardous
waste. RCRA also set forth a framework for the management of non-hazardous solid wastes.
In April 2015, the EPA established requirements for the safe disposal of coal combustion
residuals produced at electric utilities and independent power producers. These requirements
were established under Subtitle D of RCRA and apply to coal combustion residual landfills and
surface impoundments. Michigan electric utilities must comply with these regulations.
Clean Water Act – The Clean Water Act is a United States federal law designed to control
water pollution on a national level.
Clean Water Act Section 316(b) – The EPA promulgated rules under Section 316(b) of the
Clean Water Act establishing standards for cooling water intake structures at new and existing
facilities in order to minimize the impingement and entrainment of fish and other aquatic
organisms at these structures. Section 316(b) applies to existing electric generation facilities
with a design intake flow greater than two million gallons per day that use at least twenty-five
percent of the water withdrawn from the surface waters of the United States for cooling purposes.
In 2001, the EPA promulgated rules specific to cooling water intake structures at new
facilities. Generally, new Greenfield, stand-alone facilities are required to construct the facility
11
to limit the intake capacity and velocity requirements commensurate with that achievable with a
closed-cycle, recirculating cooling system.
Following a previously promulgated version of the rules and judicial remand, the regulations
for existing facilities were promulgated in August 2014. These rules were also challenged and
undergoing judicial review. According to the published rules, any facility subject to the existing
facilities rule must identify which one of the seven alternatives identified in the best technology
available (BTA) standard will be met for compliance with minimizing impingement mortality. The
rules do not specify national BTA standards for minimizing entrainment mortality, but instead
require that the MDEQ establish the BTA entrainment requirements for a facility on a site-specific
basis. These BTA requirements are established after consideration of the specific factors
spelled out in the rule. Facilities with actual flows in excess of 125 million gallons per day must
provide an entrainment study with its National Pollutant Discharge Elimination System (NPDES)
permit application. While the rules do not specify a deadline for compliance of the rules, facilities
will need to achieve the impingement and entrainment mortality standards as soon as practicable
according to the schedule of requirements set by the MDEQ following NPDES permit reissuance.
Steam Electric Effluent Guidelines – The Steam Electric Effluent Guidelines (SEEG),
promulgated under the Clean Water Act, strengthens the technology-based effluent limitations
guidelines and standards for the steam electric power generating industry. The 2015
amendment to the rule established national limits on the amount of toxic metals and other
pollutants that steam electric power plants are allowed to discharge. Multiple petitions for review
challenging the regulations were consolidated in the United States Court of Appeals for the Fifth
Circuit on December 8, 2015. On April 25, 2017 the EPA issued an administrative stay of the
compliance dates in the effluent limitations guidelines and standards rule that have not yet
passed pending judicial review. In addition, the EPA requested, and was granted, a 120-day
stay of the litigation (until September 12, 2017) to allow the EPA to consider the merits of the
petitions for reconsideration of the Rule. On August 11, 2017, the EPA provided notice that it
will conduct a rulemaking to potentially revise the new, more stringent BTA effluent limitations
and Pretreatment Standards for Existing Sources in the 2015 rule that apply to bottom ash
transport water and flue gas desulfurization wastewater. The EPA will provide notice and an
opportunity for comment on any proposed revisions to the rule and will notify the United States
Court of Appeals that it seeks to have challenges to those portions of the rule severed and held
in abeyance pending completion of the rulemaking. On September 18, 2017 the 120-day
administrative stay was lifted postponing certain compliance deadlines. The earliest date for
compliance with SEEG is November 1, 2020, while the latest compliance date of December 31,
2023 remains unchanged.
State Rules and Laws:
Michigan Mercury Rule – The purpose of the Michigan Mercury Rule (MMR) is to regulate
the emissions of mercury in the State of Michigan. Existing coal-fired electric generating units
must choose one of three methods to comply with the emission limits and any new electric
generating unit will be required to utilize Best Available Control Technology. The MMR is
identical to the MATS in its limitations and all compliance dates for this rule have since past.
12
Michigan Environmental Protection Act (MEPA) – Part 17 of Michigan’s Natural
Resources and Environmental Protection Act (NREPA), 1994 PA 451. Under MEPA, the
attorney general or any person may maintain an action for an alleged violation or when one is
likely to occur for declaratory and equitable relief against any person for the protection of the air,
water, and other natural resources and the public trust in these resources from pollution,
impairment, or destruction. MEPA also provides for consideration of environmental impairment
and whether a feasible and prudent alternative exists to any impairment consistent with the
promotion of the public health, safety, and welfare in light of the state’s paramount concern for
the protection of its natural resources from pollution, impairment, or destruction.
Solid Waste Management (Part 115) – Part 115 of the Michigan NREPA regulates coal
combustion residuals (CCR) as a solid waste. It requires any CCR that will remain in place in a
surface impoundment or landfill be subject to siting criteria, permitting and licensing of the
disposal area, construction standards for the disposal area, groundwater monitoring, corrective
action, and financial assurance and post-closure care for a 30-year period. The disposal facility
is required to maintain the financial assurance to conduct groundwater monitoring throughout
the post-closure care period.
The disposal of CCR is currently dually regulated under the RCRA rule published in April
2015, and under Part 115 of the NREPA. However, in December 2016, the Water Infrastructure
Improvements for the Nation Act was passed, which included an amendment to Section 4005 of
RCRA providing a mechanism to allow states to develop a state permitting program for regulation
of CCR units. Upon approval of a state program, the RCRA regulations would be enforced by
states and the CCR units would not be subject to the dual regulatory structure. Michigan is in
the process of developing a permit program for submittal to the EPA.
To comply with PA 341 Section 6t (1) (d)
A list of federal and state environmental regulations, laws and rules formally proposed have
been identified as required by Section 6t (1) (d):
Ozone Nonattainment Areas – The ozone NAAQS was revised by the EPA in 2015 from
75 ppb to 70 ppb. Nonattainment designations were to be made by October 2017. In June
2017, the EPA announced a decision to delay making designations by one year. More recently
on August 2, 2017, the EPA withdrew its plan to delay designations. Michigan is expecting ten
counties, or portions of counties, to be designated nonattainment, including Wayne, Oakland,
Macomb, St. Clair, Livingston, Washtenaw, and Monroe in Southeast Michigan and Muskegon,
Allegan, and Berrien in West Michigan. Deadlines and requirements for ozone nonattainment
areas are dependent on the classification assigned to the nonattainment area. All ozone
nonattainment areas in Michigan are expected to be classified “Marginal”. This classification
would establish an attainment deadline of 2020 or 2021 depending on the date of designation,
and an attainment plan submittal deadline of 2020 or 2021. In addition to the requirement to
attain by the deadline, there will also be more stringent requirements for major source air permits,
including lowest achievable emission rate conditions and offsets for new emissions of the ozone
precursors of nitrogen oxides and volatile organic compounds.
13
To comply with PA 341 Section 6t (5) (m)
“How the utility will comply with all applicable state and federal environmental regulations, laws
and rules, and the projected costs of complying with those regulations, laws and rules.”
In developing its IRP, a utility should present an environmental compliance strategy which
demonstrates how the utility will comply with all applicable federal and state environmental
regulations, laws and rules. Included with this information, the utility should analyze the cost of
compliance on its existing generation fleet going forward, including existing projects being
undertaken on the utilities generation fleet, and include the relevant future compliance costs
within the IRP model. Review and approval of an electric utility’s integrated resource plan by the
Michigan Public Service Commission does not constitute a finding of actual compliance with
applicable state and federal environmental laws. Electric utilities that construct and operate a
facility included in an approved integrated resource plan remain responsible for complying with
all applicable state and federal environmental laws.
VII. Planning Reserve Margins and Local Clearing Requirements
To comply with PA 341 Section 6t (1) (e)
Compliance with Section 6t (1) (e) requires the identification of any required planning reserve
margins and local clearing requirements in areas of the state of Michigan. The majority of
Michigan is part of the Midcontinent Independent System Operator (MISO). MISO is divided into
local resource zones (Zones) with the majority of the Lower Peninsula in Zone 7 and the Upper
Peninsula combined with a large portion of Wisconsin in Zone 2, as shown in Appendix B. The
unshaded portion of the southwest area of the Lower Peninsula is served by the PJM regional
transmission operator. While the PJM has similar reliability criteria to MISO, there are some
differences in terminology and details.
MISO publishes planning reserve margins in its annual Loss of Load Expectation (LOLE)
Study Report each November.13 The MISO LOLE Study Report includes the planning reserve
margin for the next ten years in a table labeled, “MISO System Planning Reserve Margins 2018
through 2027” for the entire footprint.14 MISO also calculates the local reliability requirement of
each Zone in the LOLE Study Report.15 The local reliability requirement is a measure of the
planning resources required to be physically located inside a local resource zone without
considering any imports from outside of the zone in order to meet the reliability criterion of one
day in ten years LOLE. The MISO Local Clearing Requirement is defined as “the minimum
amount of unforced capacity that is physically located within the Zone that is required to meet
13 MISO 2018 – 2019 Loss of Load Expectation Study Report published in October 2017, https://www.misoenergy.org/Library/Repository/Study/LOLE/2018%20LOLE%20Study%20Report.pdf 14 Three of the next ten years planning reserve margins are modeled by MISO and the remaining of the ten years are interpolated and reported in the MISO Loss of Load Expectation Study. 15 MISO models the local reliability requirement for the prompt year, one of the future years in between year 2 and year 5, and one future year in between year 6 and year 10.
14
the LOLE requirement while fully using the Capacity Import Limit for such.”16 The Local Clearing
Requirement for each zone is reported annually with the MISO planning resource auction results
in April.17
For the southwest corner of the Lower Peninsula, in PJM’s territory,18 similar reliability
requirements are outlined in PJM Manual 18 for the PJM Capacity Market.19 PJM outlines
requirements for an Installed Reserve Margin, similar to MISO’s planning reserve margin on an
installed capacity basis, and a Forecast Pool Requirement on an unforced capacity basis, similar
to MISO’s planning reserve margin on an unforced capacity basis. PJM also specifies 27 Local
Deliverability Areas somewhat similar to MISO’s local resource zones. PJM publishes a Reserve
Requirement Study20 annually in October containing the requirements for generator owners and
load serving entities within its footprint for the next ten years.
Electric utilities required to file integrated resource plans under Section 6t are also required
to annually make demonstrations to the MPSC that they have adequate resources to serve
anticipated customer needs four years into the future, pursuant to Section 6w of PA 341. On
September 15, 2017, in Case No. U-18197, the MPSC adopted an order establishing a capacity
demonstration process in an effort to implement the State Reliability Mechanism (SRM)
requirements of Section 6w. This order established SRM-specific planning reserve margin
requirements for each electric provider in Michigan for the period of planning years 2018 through
2021. In an order issued on October 14, 2017, in Case No. U-18444, the MPSC initiated a
proceeding to establish a methodology to determine a forward locational requirement, to
establish a methodology to determine a forward planning reserve margin requirement, and to
establish these requirements for planning year 2022. In addition to planning to meet the
reliability requirements of the regional grid operator (MISO or PJM, as applicable), electric utility
IRP filings should be consistent with the requirements of the State Reliability Mechanism under
Section 6w, as established in Case Nos. U-18197, U-18444, and any subsequent cases initiated
to implement these provisions.
16 Federal Energy Regulatory Commission Electric Tariff, Module E-1, 1.365a. 1.0.0. 17 MISO Planning Resource Auction results, April 2017, https://www.misoenergy.org/Library/Repository/Report/Resource%20Adequacy/Planning%20Year%2017-18/2017-2018%20Planning%20Resource%20Adequacy%20Results.pdf. 18 See Appendix C for a map of PJM Local Deliverability Areas. 19 PJM Manual 18 for the PJM Capacity Market, https://www.pjm.com/~/media/documents/manuals/m18.ashx. 20 PJM Reserve Requirement Study, October 2017, http://www.pjm.com/-/media/committees-groups/committees/mrc/20171026/20171026-item-05-2017-irm-study.ashx.
15
VIII. Modeling Scenarios, Sensitivities and Assumptions
To comply with PA 341 Section 6t (1) (f)
For utilities located in the Michigan portion of MISO Zone 2 and MISO Zone 7, three modeling
scenarios are required. There is a total of four unique scenarios included in this IRP parameters
document; the applicability of each is described within the narrative of each particular scenario.
Northern States Power-Wisconsin and Indiana Michigan Power Company are utilities located in
Michigan that already file multistate IRPs in other jurisdictions. Due to the provisions in PA 341
Section 6t (4) regarding multistate IRPs, Northern States Power-Wisconsin and Indiana
Michigan Power Company are intentionally excluded from the explicit requirement to model the
outlined scenarios. However, the multistate utilities are encouraged to include the provisions
included in each scenario. The Commission may request additional information from multistate
utilities prior to approving an IRP pursuant to Section 6t (4) of PA 341.
Scenario 1. Business as Usual
(Applicability: Utilities located in the Michigan portion of MISO Zone 2 and MISO Zone 7)
The existing generation fleet (utility and non-utility owned) is largely unchanged apart from
new units planned with firm certainty or under construction. No carbon regulations are modeled,
although some reductions are expected due to age-related coal retirements and renewable
additions driven by renewable portfolio standards and goals, as well as economics.
• Natural gas prices utilized are consistent with business as usual projections as projected
in the United States Energy Information Administration’s (EIA) most recent Annual Energy
Outlook reference case.21
• Footprint-wide22 demand and energy growth rates remain at low levels with no notable
drivers of higher growth; however, as a result of low natural gas prices, industrial
production and industrial demand increases.
• Low natural gas prices and low economic growth reduce the economic viability of other
generation technologies.
• Resource assumptions:
o Resources outside MI – Maximum age assumption by resource type as specified
by applicable regional transmission organization (RTO).
o Resources within MI – Thermal and nuclear generation retirements in the modeling
footprint are driven by a maximum age assumption, public announcements, or
economics.
• Specific new units are modeled if under construction or with regulatory approval (i.e.,
Certificate of Necessity (CON) or signed generator interconnection agreement (GIA)).
21 The natural gas price forecast utilized should be consistent with the EIA’s most recent Annual Energy Outlook natural gas spot price at Henry Hub in nominal dollars and also including delivery costs from Henry Hub to the point of delivery. 22 Footprint refers to the Model Region specified in the Michigan IRP Modeling Input Assumptions and Sources, or the State of Michigan plus the applicable RTO region. Larger footprints or Model Regions, if used by the utility, are acceptable.
16
• Generic new resources (market and company-owned) are assumed consistent with
scenario descriptions and considering anticipated new resources currently in the MISO
generation interconnection queue.
• Not less than 35% of the state’s electric needs should be met through a combination of
EWR and renewable energy by 2025, as per MCL 460.1001 (3).
• For all instate electric utilities that are eligible to receive the financial incentive mechanism
for exceeding mandated energy saving targets of 1% per year, EWR should be based
upon the maximum allowed under the incentive of 1.5% and should be based upon an
average cost of MWh saved. The model should include an EWR supply cost curve to
project future program expenditures beyond baseline assumptions without any cap.23
• For all other electric utilities, EWR should not exceed the mandated targets for electric
energy savings of 1% per year and should be based upon an average cost of MWh saved.
• Existing renewable energy production tax credits and renewable energy investment tax
credits continue pursuant to current law.
• Technology costs for thermal units and wind track with mid-range industry expectations.
• Technology costs and limits to the total resource amount available for EWR and demand
response programs will be determined by their respective potential studies.
• Technology costs for solar and other emerging technologies decline with commercial
experience.
• Existing PURPA contracts are assumed to be renewed.
Business as Usual Sensitivities:
1. Fuel cost projections
(a) Increase the natural gas fuel price projections from the base projections to at least
200% of the business as usual natural gas fuel price projections at the end of the
study period.24
2. Load projections
(a) High load growth: Increase the energy and demand growth rates by at least a factor
of two above the business as usual energy and demand growth rates. In the event
that doubling the energy and demand growth rates results in less than a 1.5%
spread between the business as usual load projection and the high load sensitivity
projection, assume a 1.5% increase in the annual growth rate for energy and
demand for this sensitivity.
(b) If the utility has retail choice load in its service territory, model the return of 50% of
its retail choice load to the utility’s capacity service by 2023.
23 For EWR cost supply curves, see the appendices in the supplemental potential study for the Lower Peninsula at this link: http://www.michigan.gov/documents/mpsc/MI_Lower_Peninsula_EE_Potential_Study_Final_Report_08.11.17_598053_7.pdf. 24 For example, 200% of the most recent EIA AEO reference case natural gas price is $10.14/MMBtu ($2016) in 2040.
17
3. Ramp up the utility’s EWR savings to at least 2.5% of prior year sales over the course of
four years, using EWR cost supply curves provided in the Appendix G of the 2017
supplemental potential study for more aggressive potential.25 EWR savings remain high
throughout the study period.
4. Sensitivity allowing only natural gas fired simple cycle combustion turbines to be selected
by the model.
25 For maximum achievable potential levels and respective EWR supply curves, see the supplemental potential study for the Lower Peninsula, http://www.michigan.gov/documents/mpsc/MI_Lower_Peninsula_EE_Potential_Study_Final_Report_08.11.17_598053_7.pdf; See also supplemental potential study for the Upper Peninsula, http://www.michigan.gov/documents/mpsc/UP_EE_Potential_Study_Final_Report--memorandum_08.09.17_598056_7.docx.
18
Scenario 2. Emerging Technologies
(Applicability: Utilities located in the Michigan portion of MISO Zone 2 and MISO Zone 7)
Technological advancement and economies of scale result in a 35% reduction in costs for
demand response, EWR programs, and other emerging technologies.26 For example, costs
identified in the demand response potential study should be reduced by 35% for demand
response resources. No carbon reductions are modeled, but some reductions occur due to coal
unit retirements, and higher levels of renewables, demand response, and energy waste
reduction. Load forecasts and fuel price forecasts remain at levels similar to the Business as
Usual Scenario.
• Technological advancement and economies of scale result in a greater potential for
demand response, energy efficiency, and distributed generation as well as lower capital
cost for renewables.
• Thermal generation retirements in the market are driven by unit age-limits and announced
retirements (consistent with business as usual). Company-owned resource retirements
may be defined by the utility, however, a meaningful analysis of whether coal units should
retire ahead of business as usual dates should be performed. Retirements of all coal
units except the most efficient in the utility’s fleet should be considered, and those coal
units owned by the utility that are not explicitly assumed to retire during the study period
shall be allowed to retire in the model based upon economics. Retirement of older fuel
oil-fired generation should also be considered in this scenario. Units that are not owned
by the utility shall not retire during the study period unless affirmative, public statements
to that effect are made by the owner of the generation asset.
• Specific new generating units are modeled if under construction or with regulatory
approval (i.e., CON or signed GIA).
• Generic new resources (market and company-owned) are assumed consistent with
scenario optimizations considering the current resources in the MISO generation
interconnection queue.
• Prior to and during the modeling process, the utilities shall take into account resources
that include, but are not limited to: small qualifying facilities (20 MW and under),
renewable energy independent power producers, large combined heat and power plants,
and self-generation facilities such as behind-the-meter-generation (btmg) as more fully
described in section IX, Michigan IRP Modeling Input Assumptions and Sources.
• Existing renewable energy production tax credits and renewable energy investment tax
credits continue pursuant to current law.
• Technology costs for thermal units remain stable and escalate at moderate escalation
rates.
• Technology costs for EWR and demand response programs will be reduced 35% from
the level determined by their respective potential studies.
26 Emerging technologies includes, but is not limited to large-scale and small-scale battery storage, large-scale and small-scale solar, and combined heat and power. See Section IX, Michigan IRP Modeling Input Assumptions and Sources in this document for a full list of potential emerging technologies also could be considered to include as resources with reduced costs in this scenario.
19
• Technology costs for energy storage resources decline over time, particularly battery
technologies and others which can enable supply- and demand-side resources.
• Existing PURPA contracts are assumed to be renewed.
Emerging Technologies Sensitivities:
1. Fuel cost projections
(a) Increase the natural gas fuel price projections from the base projections to at least
200% of the business as usual natural gas fuel price projections at the end of the
study period. 27
2. Load projections
(a) High load growth: Increase the energy and demand growth rates by at least a factor
of two above the business as usual energy and demand growth rates. In the event
that doubling the energy and demand growth rates results in less than a 1.5%
spread between the base load projection and the high load sensitivity projection,
assume a 1.5% increase in the annual growth rate for energy and demand for this
sensitivity.
3. Ramp up the utility’s EWR savings to at least 2.5% of prior year sales over the course of
four years, using EWR cost supply curves provided in Appendix G of the 2017
supplemental potential study for more aggressive potential.28 EWR savings remain high
throughout the study period.
4. Increase the use of renewable energy in the utility’s service territory to at least 25% by
2030.
27 For example, 200% of the most recent EIA AEO reference case natural gas price is $10.14/MMBtu ($2016) in 2040. 28 For maximum achievable potential levels and respective EWR supply curves, see the supplemental potential study for the Lower Peninsula, http://www.michigan.gov/documents/mpsc/MI_Lower_Peninsula_EE_Potential_Study_Final_Report_08.11.17_598053_7.pdf; See also supplemental potential study for the Upper Peninsula, http://www.michigan.gov/documents/mpsc/UP_EE_Potential_Study_Final_Report--memorandum_08.09.17_598056_7.docx.
20
Scenario 3. Environmental Policy
(Applicability: Utilities located in MISO Zone 7)
Carbon regulations targeting a 30% reduction (by mass for existing and new sources) from
2005 to 2030 across all aggregated unit outputs are enacted, modeled as a hard cap on the
amount of carbon emissions, driving some coal retirements and an increase in natural gas
reliance. Increased renewable additions are driven by renewable portfolio standards and goals,
economics, and business practices to meet carbon regulations.
• Demand and energy growth rates are modeled at a level equivalent to a 50/50 forecast
and are consistent with the business as usual projections.
• Natural gas prices utilized are consistent with business as usual projections as projected
in the EIA’s most recent Annual Energy Outlook reference case.29
• Current demand response, energy efficiency, and utility distributed generation programs
remain in place and additional growth in those programs would happen if they are
economically selected by the model to help comply with the specified carbon reductions
in this scenario.
• Non-nuclear, non-coal generators will be retired in the year the age limit is reached and
driven by announced retirements. Coal units will primarily be retired based upon carbon
emissions and secondarily based upon economics. Nuclear units are assumed to have
license renewals granted and remain online.
• Specific new units are modeled if under construction or with regulatory approval (i.e.,
CON or signed GIA).
• Generic new resources (market and company-owned) are assumed consistent with
scenario descriptions and considering anticipated new resources currently in the MISO
generation interconnection queue.
• Tax credits for renewables continue until 2022 to model existing policy.
• Technology costs for wind, solar and other renewables decline with commercial
experience and forecasted at levels 35% lower than in the business as usual case.
• Non-carbon dioxide emitting resources will be increased, due to the constraint on
allowable carbon emissions in the model.
• Technology costs and limits to the total resource amount available for EWR and demand
response programs will be determined by their respective potential studies.
• Existing PURPA contracts are assumed to be renewed.
• Not less than 35% of the state’s electric needs should be met through a combination of
EWR and renewable energy by 2025, as per MCL 460.1001 (3).
29 The natural gas price forecast utilized should be consistent with the EIA’s most recent Annual Energy Outlook natural gas spot price at Henry Hub in nominal dollars and also including delivery costs from Henry Hub to the point of delivery.
21
Environmental Policy Sensitivities:
1. Fuel cost projections
(a) Increase the natural gas fuel price projections from the base projections to at least
200% of the business as usual natural gas fuel price projections at the end of the
study period. 30
2. Load projections
High load growth: Increase the energy and demand growth rates by at least a factor
of two above the business as usual energy and demand growth rates. In the event
that doubling the energy and demand growth rates results in less than a 1.5% spread
between the base load projection and the high load sensitivity projection, assume a
1.5% increase in the annual growth rate for energy and demand for this sensitivity.
3. 50% carbon reduction in the utility’s service territory, modeled as a hard cap on the
amount of carbon emissions, by 2030 as a sensitivity.
4. Ramp up the utility’s EWR savings to at least 2.5% of prior year sales over the course of
four years, using EWR cost supply curves provided in the 2017 supplemental potential
study for more aggressive potential.31 EWR savings remain high throughout the study
period.
30 For example, 200% of the most recent EIA AEO reference case natural gas price is $10.14/MMBtu ($2016) in 2040. 31 For maximum achievable potential levels and respective EWR supply curves, see the supplemental potential study for the Lower Peninsula, http://www.michigan.gov/documents/mpsc/MI_Lower_Peninsula_EE_Potential_Study_Final_Report_08.11.17_598053_7.pdf; See also supplemental potential study for the Upper Peninsula, http://www.michigan.gov/documents/mpsc/UP_EE_Potential_Study_Final_Report--memorandum_08.09.17_598056_7.docx.
22
Scenario 4. High Market Price Variant
(Applicability: Utilities located in the Michigan portion of MISO Zone 2)
An increase in economic activity drives higher than expected energy market prices. The
existing generation fleet is largely unchanged apart from new units planned with firm certainty
or under construction. No carbon regulations are modeled, though some reductions are
expected due to age-related coal retirements and renewable additions driven by renewable
portfolio standards and goals, as well as economics.
• Natural gas prices utilized are higher than business as usual projections and are
consistent with projections in the EIA’s most recent Annual Energy Outlook low oil and
gas resource technology case32 where natural gas prices near historical highs drive down
domestic consumption and exports.
• Footprint-wide33 demand and energy growth rates are moderate to robust with notable
drivers of higher growth.
• High natural gas prices and moderate to robust economic growth increase the economic
viability of alternative technologies.
• Thermal generation retirements in the market are driven by unit age-limits, and
announced retirements are driven by age and environmental regulations. Company-
owned resource retirements are defined by the utility.
• Specific new generating units are modeled if under construction or with regulatory
approval (i.e., CON or signed GIA).
• Generic new resources (market and company-owned) are assumed consistent with
scenario optimizations considering the current resources in the MISO generation
interconnection queue.
• Tax credits for renewables continue until 2022 to model existing policy.
• Technology costs for thermal units remain stable and escalate at low to moderate
escalation rates.
• Technology costs for renewables remain stable and escalate at low to moderate
escalation rates.
• Technology costs for energy efficiency and demand response remain stable and escalate
at low to moderate escalation rates.
• Existing PURPA contracts are assumed to be renewed.
High Market Price Variant Sensitivities:
1. Fuel cost projections
(a) Increase the natural gas fuel price projections from the base scenario projections
to at least 150% of the natural gas price forecast at the end of the study period.
32 The natural gas price forecast utilized should be consistent with the EIA’s most recent Annual Energy Outlook natural gas spot price at Henry Hub in nominal dollars and also including delivery costs from Henry Hub to the point of delivery. 33 Footprint refers to the Model Region specified in the Michigan IRP Modeling Input Assumptions and Sources, or the State of Michigan plus the applicable RTO region. Larger footprints or Model Regions, if used by the utility, are acceptable.
23
(b) Reduce natural gas fuel price projections to half of the natural gas fuel projections
used in this scenario.
2. Load projections
(a) High load growth: Increase the energy and demand growth rates by at least a factor
of two above the business as usual energy and demand growth rates. In the event
that doubling the energy and demand growth rates results in less than a 1.5%
spread between the business as usual load projection and the high load sensitivity
projection, assume a 1.5% increase in the annual growth rate for energy and
demand for this sensitivity.
(b) If the utility has retail choice load in its service territory, model the return of 50% of
its retail choice load to the utility’s capacity service by 2023.
3. Grid defection: Reduced load due to the development of residential small cogeneration
units, solar, batteries, and wind could influence more customers going “off-grid” as electric
rates continue to be high in the Upper Peninsula.
4. Ramp up the utility’s EWR savings to at least 2.5% of prior year sales over the course of
four years, using EWR cost supply curves provided in the 2017 supplemental potential
study for more aggressive potential. EWR savings remain high throughout the study
period.34
34 For maximum achievable potential levels, see the supplemental potential study for the Lower Peninsula, http://www.michigan.gov/documents/mpsc/MI_Lower_Peninsula_EE_Potential_Study_Final_Report_08.11.17_598053_7.pdf; See also supplemental potential study for the Upper Peninsula, http://www.michigan.gov/documents/mpsc/UP_EE_Potential_Study_Final_Report--memorandum_08.09.17_598056_7.docx.
24
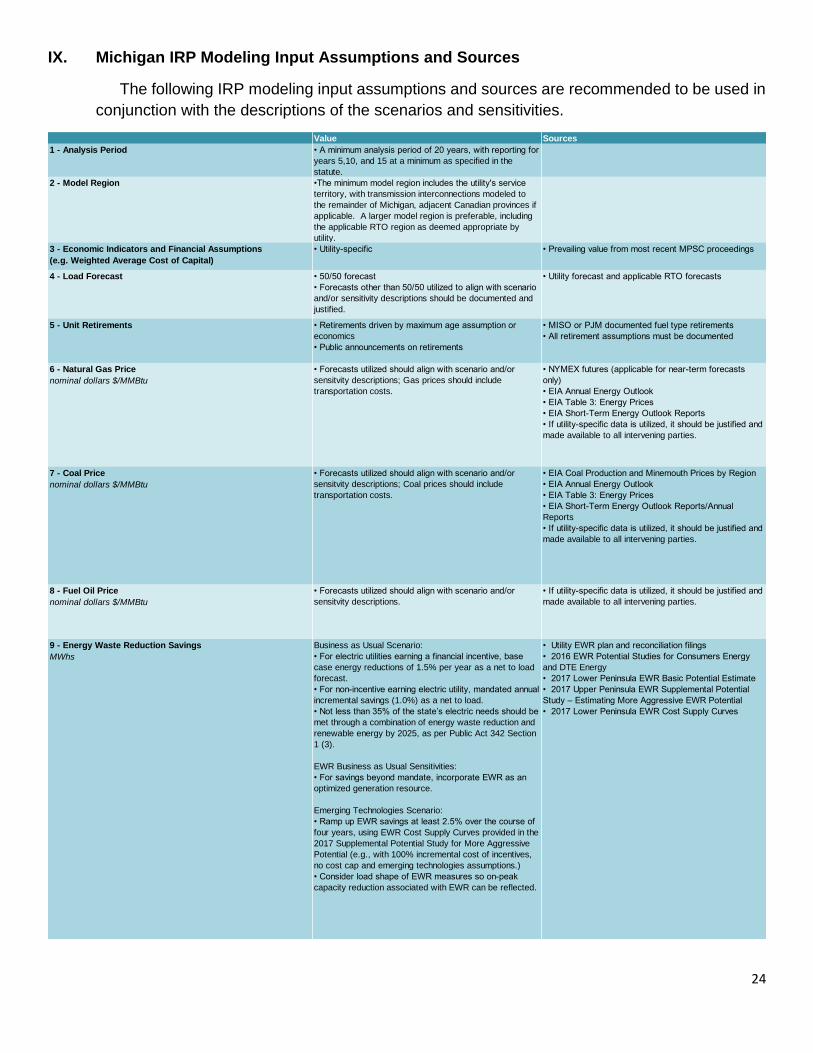
IX. Michigan IRP Modeling Input Assumptions and Sources
The following IRP modeling input assumptions and sources are recommended to be used in
conjunction with the descriptions of the scenarios and sensitivities.
Value Sources
1 - Analysis Period • A minimum analysis period of 20 years, with reporting for
years 5,10, and 15 at a minimum as specified in the
statute.
2 - Model Region •The minimum model region includes the utility's service
territory, with transmission interconnections modeled to
the remainder of Michigan, adjacent Canadian provinces if
applicable. A larger model region is preferable, including
the applicable RTO region as deemed appropriate by
utility.
3 - Economic Indicators and Financial Assumptions
(e.g. Weighted Average Cost of Capital)
• Utility-specific • Prevailing value from most recent MPSC proceedings
4 - Load Forecast • 50/50 forecast
• Forecasts other than 50/50 utilized to align with scenario
and/or sensitivity descriptions should be documented and
justified.
• Utility forecast and applicable RTO forecasts
5 - Unit Retirements • Retirements driven by maximum age assumption or
economics
• Public announcements on retirements
• MISO or PJM documented fuel type retirements
• All retirement assumptions must be documented
6 - Natural Gas Price
nominal dollars $/MMBtu
• Forecasts utilized should align with scenario and/or
sensitvity descriptions; Gas prices should include
transportation costs.
• NYMEX futures (applicable for near-term forecasts
only)
• EIA Annual Energy Outlook
• EIA Table 3: Energy Prices
• EIA Short-Term Energy Outlook Reports
• If utility-specific data is utilized, it should be justified and
made available to all intervening parties.
7 - Coal Price
nominal dollars $/MMBtu
• Forecasts utilized should align with scenario and/or
sensitvity descriptions; Coal prices should include
transportation costs.
• EIA Coal Production and Minemouth Prices by Region
• EIA Annual Energy Outlook
• EIA Table 3: Energy Prices
• EIA Short-Term Energy Outlook Reports/Annual
Reports
• If utility-specific data is utilized, it should be justified and
made available to all intervening parties.
8 - Fuel Oil Price
nominal dollars $/MMBtu
• Forecasts utilized should align with scenario and/or
sensitvity descriptions.
• If utility-specific data is utilized, it should be justified and
made available to all intervening parties.
9 - Energy Waste Reduction Savings
MWhs
Business as Usual Scenario:
• For electric utilities earning a financial incentive, base
case energy reductions of 1.5% per year as a net to load
forecast.
• For non-incentive earning electric utility, mandated annual
incremental savings (1.0%) as a net to load.
• Not less than 35% of the state’s electric needs should be
met through a combination of energy waste reduction and
renewable energy by 2025, as per Public Act 342 Section
1 (3).
EWR Business as Usual Sensitivities:
• For savings beyond mandate, incorporate EWR as an
optimized generation resource.
Emerging Technologies Scenario:
• Ramp up EWR savings at least 2.5% over the course of
four years, using EWR Cost Supply Curves provided in the
2017 Supplemental Potential Study for More Aggressive
Potential (e.g., with 100% incremental cost of incentives,
no cost cap and emerging technologies assumptions.)
• Consider load shape of EWR measures so on-peak
capacity reduction associated with EWR can be reflected.
• Utility EWR plan and reconciliation filings
• 2016 EWR Potential Studies for Consumers Energy
and DTE Energy
• 2017 Lower Peninsula EWR Basic Potential Estimate
• 2017 Upper Peninsula EWR Supplemental Potential
Study – Estimating More Aggressive EWR Potential
• 2017 Lower Peninsula EWR Cost Supply Curves
25
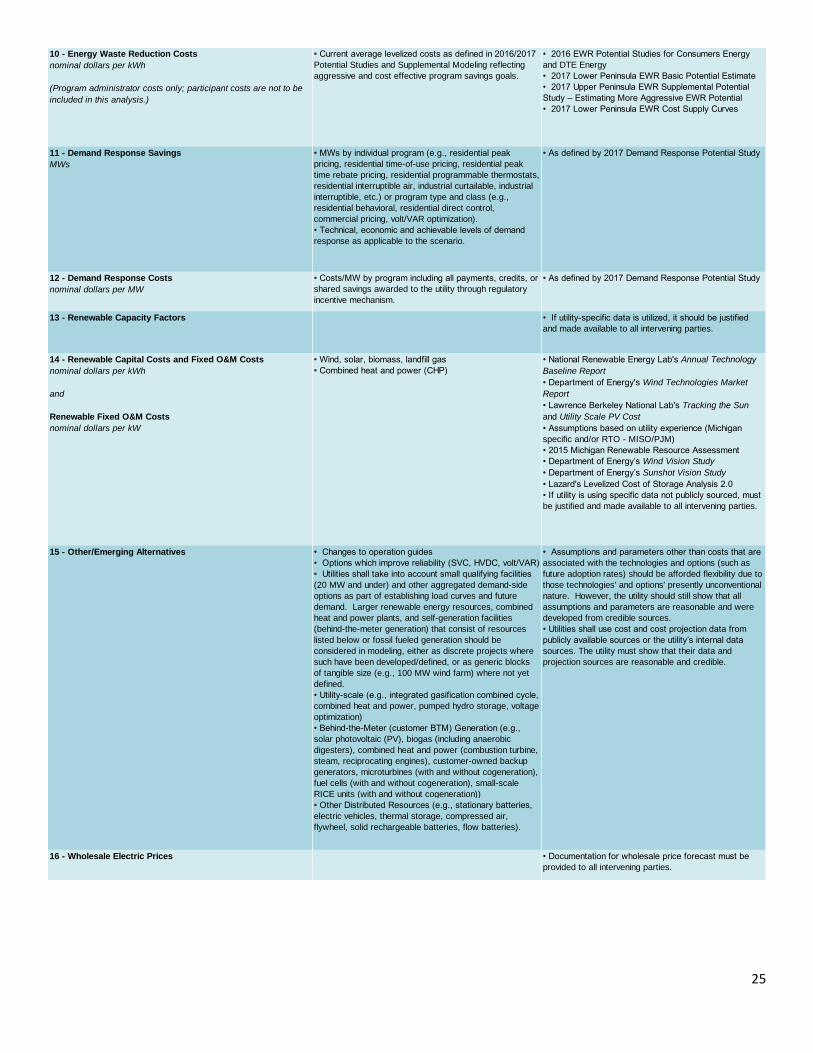
10 - Energy Waste Reduction Costs
nominal dollars per kWh
(Program administrator costs only; participant costs are not to be
included in this analysis.)
• Current average levelized costs as defined in 2016/2017
Potential Studies and Supplemental Modeling reflecting
aggressive and cost effective program savings goals.
• 2016 EWR Potential Studies for Consumers Energy
and DTE Energy
• 2017 Lower Peninsula EWR Basic Potential Estimate
• 2017 Upper Peninsula EWR Supplemental Potential
Study – Estimating More Aggressive EWR Potential
• 2017 Lower Peninsula EWR Cost Supply Curves
11 - Demand Response Savings
MWs
• MWs by individual program (e.g., residential peak
pricing, residential time-of-use pricing, residential peak
time rebate pricing, residential programmable thermostats,
residential interruptible air, industrial curtailable, industrial
interruptible, etc.) or program type and class (e.g.,
residential behavioral, residential direct control,
commercial pricing, volt/VAR optimization).
• Technical, economic and achievable levels of demand
response as applicable to the scenario.
• As defined by 2017 Demand Response Potential Study
12 - Demand Response Costs
nominal dollars per MW
• Costs/MW by program including all payments, credits, or
shared savings awarded to the utility through regulatory
incentive mechanism.
• As defined by 2017 Demand Response Potential Study
13 - Renewable Capacity Factors • If utility-specific data is utilized, it should be justified
and made available to all intervening parties.
14 - Renewable Capital Costs and Fixed O&M Costs
nominal dollars per kWh
and
Renewable Fixed O&M Costs
nominal dollars per kW
• Wind, solar, biomass, landfill gas
• Combined heat and power (CHP)
• National Renewable Energy Lab's Annual Technology
Baseline Report
• Department of Energy's Wind Technologies Market
Report
• Lawrence Berkeley National Lab's Tracking the Sun
and Utility Scale PV Cost
• Assumptions based on utility experience (Michigan
specific and/or RTO - MISO/PJM)
• 2015 Michigan Renewable Resource Assessment
• Department of Energy’s Wind Vision Study
• Department of Energy’s Sunshot Vision Study
• Lazard's Levelized Cost of Storage Analysis 2.0
• If utility is using specific data not publicly sourced, must
be justified and made available to all intervening parties.
15 - Other/Emerging Alternatives • Changes to operation guides
• Options which improve reliability (SVC, HVDC, volt/VAR)
• Utilities shall take into account small qualifying facilities
(20 MW and under) and other aggregated demand-side
options as part of establishing load curves and future
demand. Larger renewable energy resources, combined
heat and power plants, and self-generation facilities
(behind-the-meter generation) that consist of resources
listed below or fossil fueled generation should be
considered in modeling, either as discrete projects where
such have been developed/defined, or as generic blocks
of tangible size (e.g., 100 MW wind farm) where not yet
defined.
• Utility-scale (e.g., integrated gasification combined cycle,
combined heat and power, pumped hydro storage, voltage
optimization)
• Behind-the-Meter (customer BTM) Generation (e.g.,
solar photovoltaic (PV), biogas (including anaerobic
digesters), combined heat and power (combustion turbine,
steam, reciprocating engines), customer-owned backup
generators, microturbines (with and without cogeneration),
fuel cells (with and without cogeneration), small-scale
RICE units (with and without cogeneration))
• Assumptions and parameters other than costs that are
associated with the technologies and options (such as
future adoption rates) should be afforded flexibility due to
those technologies' and options' presently unconventional
nature. However, the utility should still show that all
assumptions and parameters are reasonable and were
developed from credible sources.
• Utilities shall use cost and cost projection data from
publicly available sources or the utility’s internal data
sources. The utility must show that their data and
projection sources are reasonable and credible.
• Other Distributed Resources (e.g., stationary batteries,
electric vehicles, thermal storage, compressed air,
flywheel, solid rechargeable batteries, flow batteries).
16 - Wholesale Electric Prices • Documentation for wholesale price forecast must be
provided to all intervening parties.
26
X. Additional IRP Requirements and Assumptions
1. Utility-specific assumptions for discount rates, weighted average cost of capital and other
economic inputs should be justified and the data shall be made available to all parties.
2. Prices and costs should be expressed in nominal dollars.
3. The capacity import and export limits in the IRP model for the study horizon should be
determined in conjunction with the applicable RTOs and transmission owners resulting from
the most current and planned transmission system topology. Deviations from the most
recently published import and export limits should be explained and justified within the report.
4. Environmental benefits and risk must be considered in the IRP analysis.
5. Cost and performance data for all modeled resources, including renewable and fossil fueled
resources, as well as storage, energy efficiency and demand response options should be the
most appropriate and reasonable for the service territory, region or RTO being modeled over
the planning period. Factors such as geographic location with respect to wind or solar
resources and data sources that focus specifically on renewable resources should be
considered in the determination of initial capital cost and production cost (life cycle/dispatch).
6. Models should account for operating costs and locational, capital and performance
variations. For example, setting pricing for different tranches if justified.
7. Capacity factors should be projected based on demonstrated performance, consideration of
technology improvements and geographic/locational considerations. Additional
requirements for renewable capacity factors are described in the Michigan IRP Modeling
Input Assumptions and Sources in the previous section of this draft.
8. The IRP model should optimize the incremental EWR and renewable energy to achieve the
35% goal. However, the model should not be arbitrarily restricted to a 35% combined goal
of EWR and renewable energy. Exceeding the combined EWR and renewable energy goal
of 35% by 2025 shall not be grounds for determining that the proposed levels of peak load
reduction, EWR and renewable energy are not reasonable and cost effective.
9. For purposes of IRP modeling, forecasted energy efficiency savings should be aggregated
into hourly units, coincident with hourly load forecasts, with indicative estimates of efficiency
cost and savings on an hourly basis. It is this aggregation and forecast of energy efficiency,
to be acquired on an hourly basis that allows EWR to be modeled as a resource in an IRP
for planning purposes.
10. Prior to modeling the Business as Usual, Emerging Technologies, Environmental Policy, or
High Market Price Variant Scenarios, the utilities shall consider and prescreen all of the
technologies, resources, and generating options listed in the Michigan IRP Modeling Input
27
Assumptions and Sources in the previous section of this draft. These findings will then be
presented and discussed via at least one stakeholder meeting with written comments from
stakeholders taken into consideration. The options having potential viability are then
considered in modeling.
11. Consider including transmission assumptions in the IRP portfolio, such as the impact of
transmission and non-transmission alternatives (local transmission, distribution planning,
locational interconnection costs, environmental impacts, right of way availability and cost) to
the extent possible.
12. Consider all supply and demand-side resource options on equal merit, allowing for special
consideration for instances where a project or a resource need requires rapid deployment.
13. In modeling each scenario and sensitivity evaluated as part of the IRP process, the utility
shall clearly identify all unit retirement assumptions and unless otherwise specified in the
required scenarios, the utility has flexibility to allow the model to select retirement of the
utility’s existing generation resources, rather than limiting retirements to input assumptions.
14. Recognize capacity and performance characteristics of variable resources.
15. Recognize the costs and limitations associated with fossil-fueled and nuclear generation.
16. Take into consideration existing power purchase agreements, green pricing and/or other
programs.
17. The IRP should consider any and all revenues expected to be earned by the utility’s asset(s),
as offsets to the net present value of revenue requirements.
18. An analysis regarding how incremental investments would compare to large investments in
specific technologies that might be obsolete in a few years.
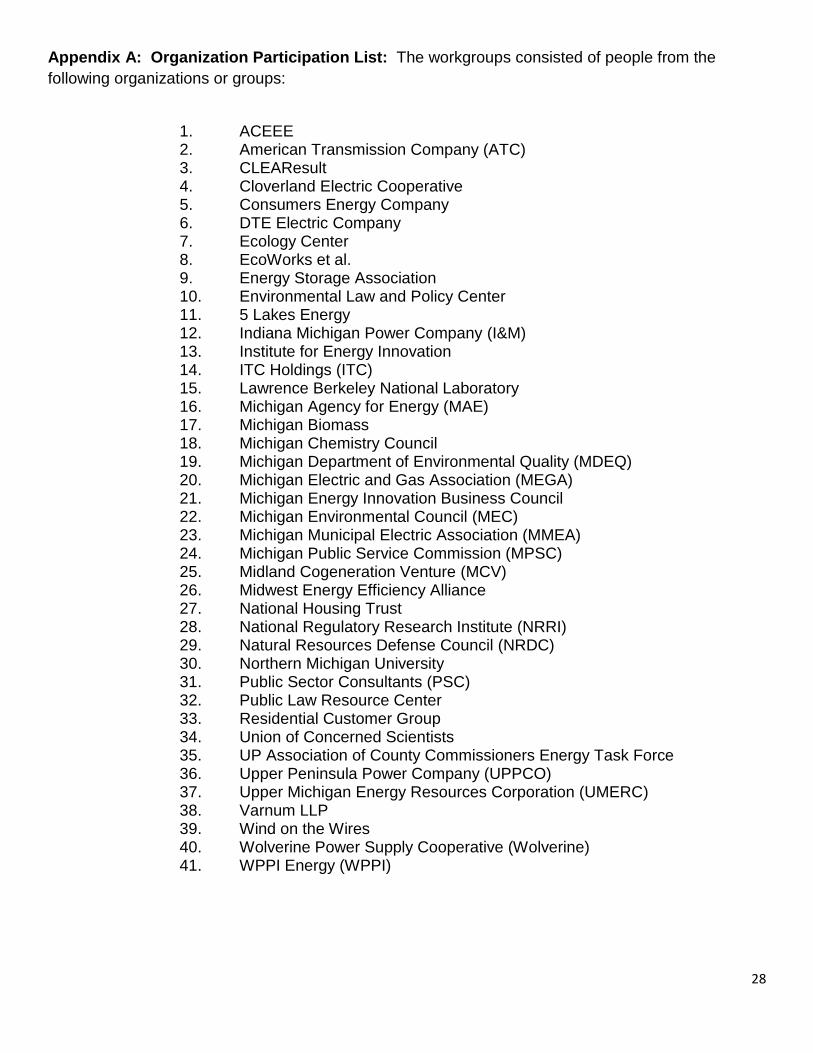
28
Appendix A: Organization Participation List: The workgroups consisted of people from the
following organizations or groups:
1. ACEEE 2. American Transmission Company (ATC) 3. CLEAResult 4. Cloverland Electric Cooperative 5. Consumers Energy Company 6. DTE Electric Company 7. Ecology Center 8. EcoWorks et al. 9. Energy Storage Association 10. Environmental Law and Policy Center 11. 5 Lakes Energy 12. Indiana Michigan Power Company (I&M) 13. Institute for Energy Innovation 14. ITC Holdings (ITC) 15. Lawrence Berkeley National Laboratory 16. Michigan Agency for Energy (MAE) 17. Michigan Biomass 18. Michigan Chemistry Council 19. Michigan Department of Environmental Quality (MDEQ) 20. Michigan Electric and Gas Association (MEGA) 21. Michigan Energy Innovation Business Council 22. Michigan Environmental Council (MEC) 23. Michigan Municipal Electric Association (MMEA) 24. Michigan Public Service Commission (MPSC) 25. Midland Cogeneration Venture (MCV) 26. Midwest Energy Efficiency Alliance 27. National Housing Trust 28. National Regulatory Research Institute (NRRI) 29. Natural Resources Defense Council (NRDC) 30. Northern Michigan University 31. Public Sector Consultants (PSC) 32. Public Law Resource Center 33. Residential Customer Group 34. Union of Concerned Scientists 35. UP Association of County Commissioners Energy Task Force 36. Upper Peninsula Power Company (UPPCO) 37. Upper Michigan Energy Resources Corporation (UMERC) 38. Varnum LLP 39. Wind on the Wires 40. Wolverine Power Supply Cooperative (Wolverine) 41. WPPI Energy (WPPI)
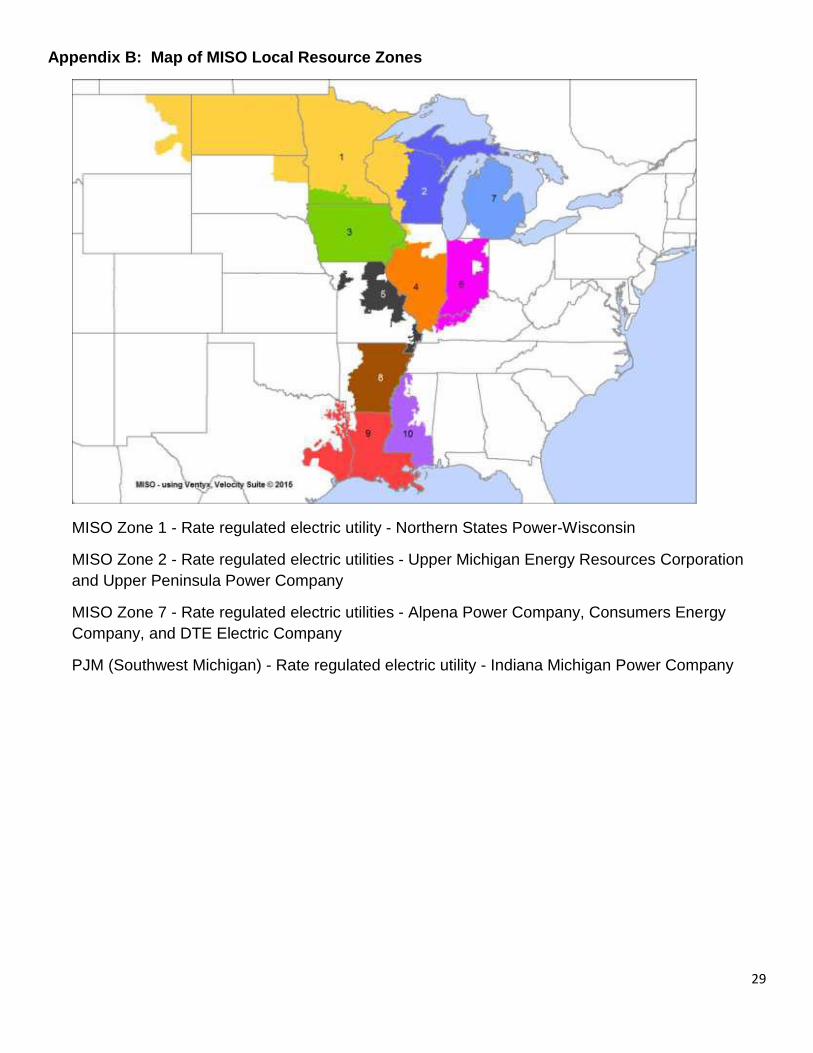
29
Appendix B: Map of MISO Local Resource Zones
MISO Zone 1 - Rate regulated electric utility - Northern States Power-Wisconsin
MISO Zone 2 - Rate regulated electric utilities - Upper Michigan Energy Resources Corporation
and Upper Peninsula Power Company
MISO Zone 7 - Rate regulated electric utilities - Alpena Power Company, Consumers Energy
Company, and DTE Electric Company
PJM (Southwest Michigan) - Rate regulated electric utility - Indiana Michigan Power Company
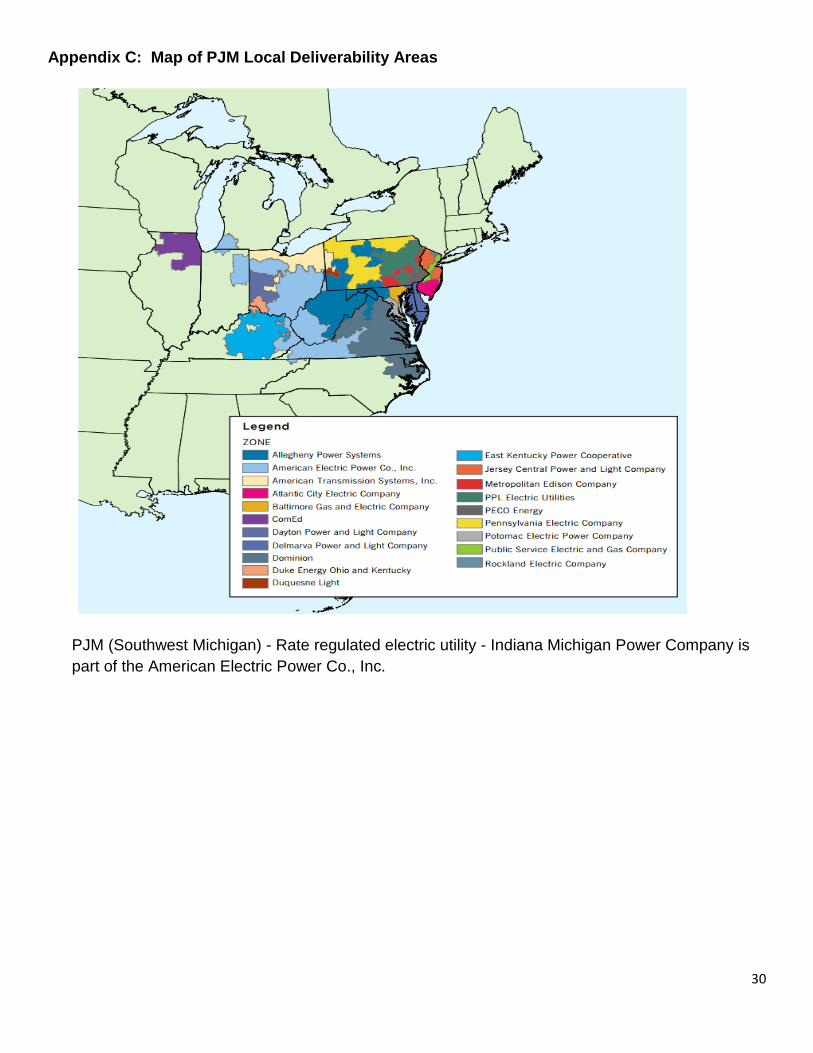
30
Appendix C: Map of PJM Local Deliverability Areas
PJM (Southwest Michigan) - Rate regulated electric utility - Indiana Michigan Power Company is
part of the American Electric Power Co., Inc.
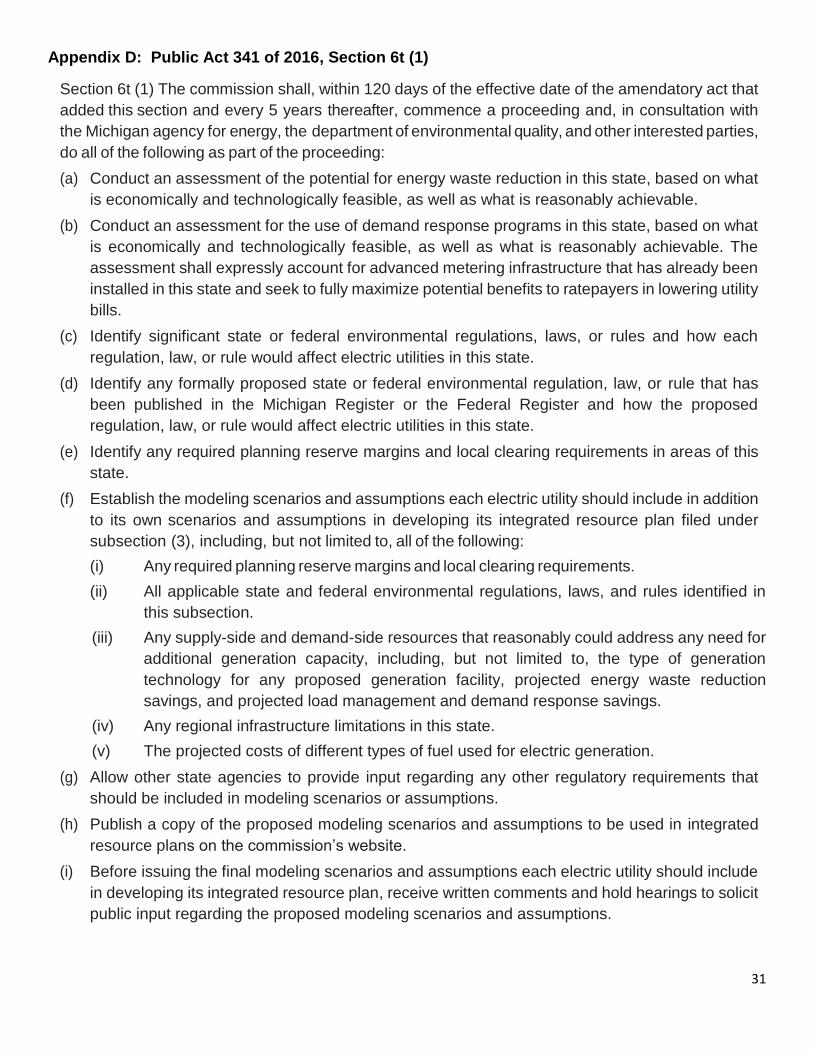
31
Appendix D: Public Act 341 of 2016, Section 6t (1)
Section 6t (1) The commission shall, within 120 days of the effective date of the amendatory act that
added this section and every 5 years thereafter, commence a proceeding and, in consultation with
the Michigan agency for energy, the department of environmental quality, and other interested parties,
do all of the following as part of the proceeding:
(a) Conduct an assessment of the potential for energy waste reduction in this state, based on what
is economically and technologically feasible, as well as what is reasonably achievable.
(b) Conduct an assessment for the use of demand response programs in this state, based on what
is economically and technologically feasible, as well as what is reasonably achievable. The
assessment shall expressly account for advanced metering infrastructure that has already been
installed in this state and seek to fully maximize potential benefits to ratepayers in lowering utility
bills.
(c) Identify significant state or federal environmental regulations, laws, or rules and how each
regulation, law, or rule would affect electric utilities in this state.
(d) Identify any formally proposed state or federal environmental regulation, law, or rule that has
been published in the Michigan Register or the Federal Register and how the proposed
regulation, law, or rule would affect electric utilities in this state.
(e) Identify any required planning reserve margins and local clearing requirements in areas of this
state.
(f) Establish the modeling scenarios and assumptions each electric utility should include in addition
to its own scenarios and assumptions in developing its integrated resource plan filed under
subsection (3), including, but not limited to, all of the following:
(i) Any required planning reserve margins and local clearing requirements.
(ii) All applicable state and federal environmental regulations, laws, and rules identified in
this subsection.
(iii) Any supply-side and demand-side resources that reasonably could address any need for
additional generation capacity, including, but not limited to, the type of generation
technology for any proposed generation facility, projected energy waste reduction
savings, and projected load management and demand response savings.
(iv) Any regional infrastructure limitations in this state.
(v) The projected costs of different types of fuel used for electric generation.
(g) Allow other state agencies to provide input regarding any other regulatory requirements that
should be included in modeling scenarios or assumptions.
(h) Publish a copy of the proposed modeling scenarios and assumptions to be used in integrated
resource plans on the commission’s website.
(i) Before issuing the final modeling scenarios and assumptions each electric utility should include
in developing its integrated resource plan, receive written comments and hold hearings to solicit
public input regarding the proposed modeling scenarios and assumptions.
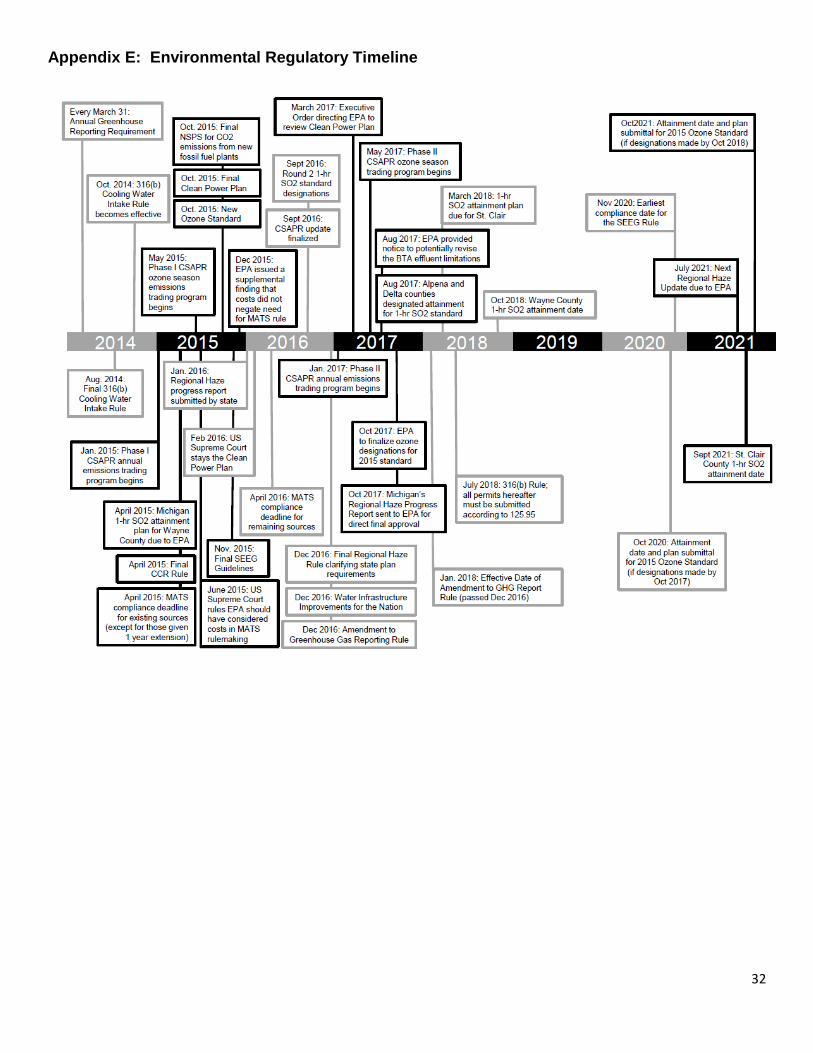
32
Appendix E: Environmental Regulatory Timeline