micra: microstructural image compilation with repeated
TRANSCRIPT

NeuroImage 225 (2021) 117406
Contents lists available at ScienceDirect
NeuroImage
journal homepage: www.elsevier.com/locate/neuroimage
MICRA: Microstructural image compilation with repeated acquisitions
Kristin Koller a , ∗ , Umesh Rudrapatna
a , Maxime Chamberland
a , Erika P. Raven
a ,
Greg D. Parker a , c , Chantal M.W. Tax
a , Mark Drakesmith
a , Fabrizio Fasano
d , David Owen
a ,
Garin Hughes a , Cyril Charron
a , C John Evans a , Derek K. Jones a , b
a Cardiff University Brain Research Imaging Centre (CUBRIC), School of Psychology, Cardiff University, Cardiff, CF24 4HQ, United Kingdom
b Mary MacKillop Institute for Health Research, Australian Catholic University, Melbourne, Australia c Experimental MRI Centre (EMRIC), School of Biosciences, Cardiff University, Cardiff, United Kingdom
d Siemens Healthcare GmbH, Erlangen, Germany
a b s t r a c t
We provide a rich multi-contrast microstructural MRI dataset acquired on an ultra-strong gradient 3T Connectom MRI scanner comprising 5 repeated sets of MRI
microstructural contrasts in 6 healthy human participants. The availability of data sets that support comprehensive simultaneous assessment of test-retest reliability
of multiple microstructural contrasts (i.e., those derived from advanced diffusion, multi-component relaxometry and quantitative magnetisation transfer MRI) in
the same population is extremely limited. This unique dataset is offered to the imaging community as a test-bed resource for conducting specialised analyses that
may assist and inform their current and future research. The Microstructural Image Compilation with Repeated Acquisitions (MICRA) dataset includes raw data and
computed microstructure maps derived from multi-shell and multi-direction encoded diffusion, multi-component relaxometry and quantitative magnetisation transfer
acquisition protocols. Our data demonstrate high reproducibility of several microstructural MRI measures across scan sessions as shown by intra-class correlation
coefficients and coefficients of variation. To illustrate a potential use of the MICRA dataset, we computed sample sizes required to provide sufficient statistical power
a priori across different white matter pathways and microstructure measures for different statistical comparisons. We also demonstrate whole brain white matter
voxel-wise repeatability in several microstructural maps. The MICRA dataset will be of benefit to researchers wishing to conduct similar reliability tests, power
estimations or to evaluate the robustness of their own analysis pipelines.
1
n
l
v
M
t
f
p
o
m
e
s
I
p
d
t
r
2
L
U
o
t
p
i
T
n
B
S
i
o
c
m
s
a
f
q
p
a
h
R
A
1
. Introduction
The primary aim of this work was to collect, and disseminate to the
euroimaging community, the MICRA (Microstructural Image Compi-
ation with Repeated Acquisitions) data set - a unique and rich multi-
ariate (diffusion, relaxometry, magnetisation transfer) microstructural
RI archive that allows variance and co-variance of measures to be es-
imated between tracts, between multiple time-points and between dif-
erent individuals.
To provide just one example of the utility of such a dataset, we
resent estimates of sample size calculations that could inform current
r planned future microstructural imaging experiments. With the move-
ent towards “open science ” practices ( Allen and Mehler, 2019 ; Munafò
t al., 2017 ), there is increasing demand to demonstrate a priori that
tudy designs are adequately powered to answer a targeted question.
n turn, this requires an assessment of test-retest repeatability as in-
ut to the sample size estimations. There is also a trend to complement
iffusion-based microstructural measurements with additional measures
hat have enhanced sensitivity to myelin, including those derived from
elaxometry and magnetisation transfer-based approaches ( Ercan et al.,
018 ; Friedrich et al., 2020 ; Geeraert et al., 2019 ; Jung et al., 2018 ;
∗ Corresponding author. Cardiff University Brain Research Imaging Centre, School
E-mail address: [email protected] (K. Koller).
ttps://doi.org/10.1016/j.neuroimage.2020.117406
eceived 14 March 2020; Received in revised form 2 September 2020; Accepted 21 S
vailable online 10 October 2020
053-8119/© 2020 Published by Elsevier Inc. This is an open access article under th
ipp et al., 2019 ; Metzler-Baddeley et al., 2017 ; Morris et al., 2020 ;
ddin et al., 2019 ). While it is appealing to collect data across the gamut
f available options, each new contrast takes time (and invokes real cost)
o acquire, and it is important to establish that the measurements are re-
roducible in themselves, and to establish their reproducibility so that,
f necessary, one might prioritise certain image contrasts over others.
here is quite an extensive literature on the reproducibility of single
euroimaging measures (e.g., Papinutto et al., 2013 ; Stikov et al., 2015 ;
iswal et al., 2010 ; O’Connor et al., 2017 ; Vollmar et al., 2010 ; Grech-
ollars et al., 2015 ; Pr čkovska et al., 2016 , Tong et al., 2019 ), focus-
ng predominantly on inter-site reproducibility and with some focusing
n within-site reproducibility. However, to the best of our knowledge,
omparison of the reproducibility of multiple microstructural imaging
easures, measured in the same population, does not exist at the time
cale and sampling frequency presented here.
The resource provided here to the community addresses this gap,
llowing for detailed assessment of the reliability of measures derived
rom optimised multi-shell diffusion, multi-component relaxometry and
uantitative magnetisation transfer acquisition protocols. Here we com-
ute reliability statistics (intra-class correlation and coefficient of vari-
tion) across three example tracts and individual measures from each
of Psychology, Cardiff University, Cardiff, CF24 4HQ, UK.
eptember 2020
e CC BY-NC-ND license ( http://creativecommons.org/licenses/by-nc-nd/4.0/ )

K. Koller, U. Rudrapatna, M. Chamberland et al. NeuroImage 225 (2021) 117406
m
p
t
(
l
c
h
t
b
p
t
2
2
m
S
a
p
e
o
2
e
3
p
e
r
i
S
2
Q
a
p
o
(
(
(i
2
c
(
(
s
n
(
a
(
t
(
f
i
(
2
l
O
s
J
a
i
o
S
e
f
a
t
e
Q
i
v
b
c
w
2
2
v
(
m
d
m
t
l
R
icrostructural imaging approach. Although these are illustrative exam-
les, these data could be reprocessed and used to compute other parame-
ers from diffusion, relaxometry and quantitative magnetisation transfer
QMT) models. We provide protocols that can be used for power calcu-
ations highlighting the utility of the resource to researchers wishing to
onduct similar reliability tests/ power calculations. However, this rich,
igh quality data resource, acquired on an ultra-strong-gradient Connec-
om 3T system that may not otherwise be readily accessible, will also
e of value to those developing and evaluating new data-processing ap-
roaches (e.g., denoising, clustering, segmentation, joint-estimation and
ractography algorithms).
. Method
.1. Participants
Six neurologically healthy adults (age range 24–30, 3 males and 3 fe-
ales) were recruited from Cardiff University’s staff and student panels.
creening for safety eligibility to undergo MRI scanning was conducted
nd participants received monetary compensation for participation. All
articipation was contingent upon prior written informed consent and
thical approval for this study was granted by Cardiff University’s School
f Psychology ethics committee.
.2. MRI hardware: ultra-strong gradient 3T
Whole brain MRI data were acquired using an ultra-strong gradi-
nt (300mT/m) 3T Connectom research only MRI scanner, a modified
T MAGNETOM Skyra (Siemens Healthcare, Erlangen, Germany). Com-
ared to standard MRI gradients (45–80mT/m), the Connectom gradi-
nts allow for shorter diffusion times for a given diffusion weighting
esulting in shorter minimum TEs (greater signal to noise ratio) and
ncreased sensitivity to small water displacements ( Jones et al., 2018 ;
etsompop et al., 2013 ).
.3. MRI data acquisition
Each MRI session lasted approximately 45 min (CHARMED = 18 min,
MT = 12 min, McDESPOT = 11 min) and was repeated 5 times within
two-week period. Care was taken to avoid potential diurnal effects by
erforming scans for each participant at approximately the same time
f day (i.e., within 1–2 h of the same scan start time-of-day).
The MRI protocol included the following sequences:
i) Multi-shell diffusion-weighted MRI: single-shot spin echo, echo
planar imaging data were acquired with both anterior-posterior
(AP) and posterior-anterior (PA) phase-encoded directions. The AP-
encoded data comprised of two shells of 20 directions (uniformly-
distributed according to Jones et al., 1999 ) at b = 200 s/mm
2 and
500 s/mm
2 , one shell of 30 directions at b = 1200 s/mm
2 and three
shells of 61 directions at each of b = 2400s/mm
2 , 4000 s/mm
2 and
6000 s/mm
2 , with two leading non-diffusion-weighted images and
a further 11 non-diffusion-weighted images, starting at the 33rd vol-
ume, and repeating every 20th volume thereafter. In the PA-encoded
data, two non-diffusion-weighted images were acquired. The field of
view was 220 × 220 mm in plane, the matrix size was 110 × 110 × 66,
reconstructed to a 110 × 110 × 66 image resulting in 2 × 2 × 2 mm
3
isotropic voxels. The TR and TE were 3000 ms and 59 ms, respec-
tively (for all b-values), and the diffusion gradient duration and sep-
aration were 7 ms and 24 ms, respectively.
ii) Multi-component relaxometry: data were acquired thanks to proto-
type sequences implementing the McDESPOT protocol ( Deoni et al.,
2008 ) with the following parameters: FOV: 220 × 220 × 178.88,
matrix size: 128 × 128 × 104 and 1.72 × 1.72 × 1.72 mm
3 isotropic
voxels, SPGR: TR: 4 ms, TE: 1.9 ms, 8 flip angles (3, 4, 5, 6, 7, 9, 13
and 18°), SPGR-IR: TR: 4 ms, TE: 1.9 ms, TI: 450 ms, Flip angle: 5°,
full k-space acquisition in PE and slice directions, SSFP: TR: 4.6 ms,
TE: 2.3 ms, Flip angles (10, 13.33, 16.67, 20, 23.33, 30, 43.33 and
60°), SSFP180: as SSFP, but with 180° RF phase increments every
TR.
ii) Optimised Quantitative Magnetisation Transfer (QMT, Mougin et al.,
2010 ) data were acquired by using a prototype turbo-flash se-
quence with parameters: FOV: 220 × 220 × 178.88, matrix size:
128 × 128 × 104, resolution: 1.72 × 1.72 × 1.72 mm
3 isotropic vox-
els isotropic, turbo factor 4, radial reordering, non-selective excita-
tion MT pulse duration: 15.36 ms, 11 MT-weighted volumes and 1
vol. without MT-weighting, 11 Frequency offsets (Hz) and 11 flip
angles (degrees): 47,180 (628); 56,360 (332); 12,060, (628); 1000
(332);1000 (333); 2750 (628); 2770 (628); 2790 (628); 2890 (628);
1000 (628); 1000 (628) ( Cercignani and Alexander, 2006 ).
.4. MRI data pre-processing and processing
Multi-shell diffusion-weighted data were pre-processed using a
ustom in-house pipeline comprising tools from both the FSL
Andersson et al., 2003 ; Andersson and Sotiropoulos, 2016 ) and MRTrix
Veraart et al., 2016 ; Vos et al., 2017 ) software packages and in-house
oftware. Specifically, AP- and PA-encoded images were separately de-
oised (MRTrix dwidenoise, Veraart et al., 2016 ) and drift corrected
Vos et al., 2017 ), then merged (with incorporated EPI, susceptibility
nd motion correction; FSL topup ( Andersson et al., 2003 ) and eddy
Andersson et al., 2016 )) corrected for gradient non-linearity distor-
ions ( Glasser et al., 2013 ) with spatio-temporal b-value/vector tracking
Rudrapatna et al., 2018 ), and finally corrected for Gibbs ringing arte-
acts (MRTrix mrdegibbs, Kellner et al., 2016 ). Subsequent processing
nvolved computation of: (i) free-water corrected fractional anisotropy
FA), mean diffusivity (MD) and radial diffusivity (RD) maps ( Hoy et al.,
014 ) from diffusion tensor MRI using the b = 1000 s/mm
2 shell (linear
east squares estimation with outlier rejection, Chang et al., 2005 ). Fibre
rientation Distribution Functions (fODFs) were derived from multi-
hell multi-tissue Constrained Spherical Deconvolution (MSMT-CSD,
eurissen et al., 2014 ). Microstructural parameters were estimated from
ll diffusion shells using the CHARMED model ( Assaf et al., 2004 ) us-
ng a nonlinear regression routine employing the Levenberg–Marquardt
ptimization algorithm.
For McDESPOT data, motion correction was applied to the SPGR and
SFP data using FSL mcFLIRT ( Jenkinson et al., 2002 ) followed by brain
xtraction ( Smith, 2002 ). The QUIT toolbox ( Wood, 2018 ) was utilised
or all subsequent fitting. The DESPOT2-FM model was fitted to estimate
B0 map ( Deoni, 2009 ), which was used as input for a final fitting to
he 3-pool mcDESPOT model ( Deoni et al., 2013 ), modelling myelin,
xtra-cellular and CSF contributions using the ‘qimcdespot’ function in
UIT.
QMT data were processed using the QUIT ( Wood, 2018 ) toolbox us-
ng the Ramani model ( Ramani et al., 2002 ). For QMT, the MT-weighted
olumes were aligned to the non-MT contrast for motion correction and
ias correction with B1 maps were applied by computing the B1 field
orrection based on the field estimate from the fifth MT volume, which
as subsequently applied to all MT volumes (FSL FAST, Zhang et al.,
001 ).
.5. White matter microstructure measures
The following microstructural measures were computed in each
oxel: restricted diffusion signal fraction (RSF) fitted from CHARMED
nonlinear regression routine employing the Levenberg–Marquardt opti-
ization algorithm, Assaf et al., 2004 ), fractional anisotropy (FA), mean
iffusivity (MD) and radial diffusivity (RD) from diffusion tensor MRI;
yelin water fraction (MWF) and longitudinal relaxation rate (R 1 ) from
he McDESPOT pipeline ( Deoni and Kolind, 2015 ), the macromolecu-
ar proton fraction (MMPF) fitted from the QMT pipeline ( Wood, 2018 ;
amani et al., 2002 ) and magnetisation transfer ratio (MTR) computed

K. Koller, U. Rudrapatna, M. Chamberland et al. NeuroImage 225 (2021) 117406
Fig. 1. Microstructural maps including FA (fractional anisotropy), MD (mean diffusivity, units = mm
2 /s), RD (radial diffusivity, units = mm
2 /s), RSF (restricted dif-
fusion signal fraction), R 1 (longitudinal relaxation rate, units = s − 1 ), MWF (myelin water fraction), MMPF (macromolecular proton fraction) and MTR (magnetisation
transfer ratio) computed for one representative participant. All contrasts are registered to diffusion space.
u
r
(
S
r
t
2
(
w
p
T
v
o
s
a
i
/
e
C
t
t
sing home-grown code. Quantitative maps were subsequently linearly
egistered to the space in which the diffusion MRI data were acquired
‘native space’) using FSL FLIRT (see Fig. 1 for illustration of all maps).
elections of models here are illustrative. The magnitude-reconstructed
aw data are also included in the MICRA dataset, enabling researchers
o explore other modelling options.
.6. Virtual dissection of tracts
To assess test-retest repeatability, a white matter projection tract
cortico-spinal), association tract (arcuate fasciculus) and the fornix
ere virtually dissected from whole brain white matter maps for each
Fig. 2. Virtual dissections of the fornix, cortico-spinal tract and arcuate fa
articipant at each time point with probabilistic tractography (MR-
rix iFOD2, 1000 seeds x 5000 streamlines, step size = 0.5 × 2 mm
3
oxel size, angular threshold = 90° x step size/voxel size, fODF thresh-
ld = 0.05, Jeurissen et al., 2014 , Fig. 2 ). The fornix was virtually dis-
ected by placing region of interest masks in the anterior hippocampus
nd fornix body. The CST and the arcuate fasciculus were dissected us-
ng TractSeg ( Wasserthal et al., 2018 ) using code available at https:
/github.com/MIC-DKFZ/TractSeg/ . Tractography was conducted in
ach individual subject’s diffusion space. Track density maps (TDI,
alamante et al., 2010 ) of the resultant tracts were computed and
hresholded to exclude voxels through which streamlines passed less
han 20 percent. As an a priori choice, the analysis was restricted to
sciculus dissections in one representative participant (see Methods).

K. Koller, U. Rudrapatna, M. Chamberland et al. NeuroImage 225 (2021) 117406
Table 1
Test-retest reliability statistics for microstructure measures. Units (mean and SD) for MD
and RD = 10 − 3 mm
2 /s; units for R 1 = s − 1 , CV = averaged within subject, ICC = averaged
across 5 repeated measures.
Metric Tract Mean SD CV (%) ICC ICC pval r
FA 0.47 0.005 1.0 0.93 < 0.0001 0.82
MD 1.00 0.010 0.9 0.94 < 0.0001 0.87
RD 1.00 0.004 0.6 0.96 < 0.0001 0.88
RSF 0.13 0.003 2.1 0.88 < 0.0001 0.65
MMPF Fornix 0.05 0.001 2.6 0.95 < 0.0001 0.85
MWF 0.07 0.003 4.2 0.95 < 0.0001 0.87
R 1 0.77 0.005 0.7 0.97 < 0.0001 0.90
MTR 0.35 0.0004 0.1 0.94 < 0.0001 0.77
FA 0.55 0.003 0.6 0.97 < 0.0001 0.89
MD 0.41 0.002 0.5 0.95 < 0.0001 0.81
RD 0.63 0.001 0.2 0.95 < 0.0001 0.78
RSF 0.27 0.003 1.2 0.86 0.002 0.52
MMPF CST 0.09 0.001 1.5 0.97 0.0003 0.74
MWF 0.16 0.003 1.7 0.97 < 0.0001 0.95
R 1 1.04 0.004 0.4 0.98 < 0.0001 0.91
MTR 0.41 0.002 0.5 0.78 0.01 0.37
FA 0.47 0.005 1.0 0.95 < 0.0001 0.86
MD 0.47 0.005 1.0 0.96 < 0.0001 0.85
RD 0.64 0.003 0.5 0.96 < 0.0001 0.81
RSF Arcuate Fasciculus 0.26 0.004 1.7 0.82 0.005 0.72
MMPF 0.10 0.002 2.1 0.92 < 0.0001 0.79
MWF 0.16 0.002 1.4 0.98 < 0.0001 0.93
R 1 1.07 0.001 0.1 0.97 < 0.0001 0.90
MTR 0.42 0.003 0.6 0.97 < 0.0001 0.92
One-way ANOVAs demonstrated no significant differences between ICC computed for
individual time point pairs or between average ICC and individual time point ICC com-
parisons for the CST (F(9,70) = 0.74, p = .67) and the Fornix (F(9,70) = 0.19, p = .07).
Although initially a difference was suggested for the Arcuate Fasciculus (F(9,70) = 2.2,
p = .03), no comparisons survived correction for multiple comparisons as shown with
Tukey post-hoc correction.
t
a
2
a
t
v
b
d
t
c
p
2
u
e
w
d
v
a
T
o
M
t
S
i
(
r
m
t
E
i
f
f
a
a
t
t
t
P
o
r
2
s
o
t
b
m
(
hree tracts in order to show a demonstration of repeatability in one
ssociation, one projection and one commissural pathway.
.7. Repeatability at the tract-level
Measures were extracted for each vertex in each streamline and aver-
ged along each tract for statistical comparison. The intra-class correla-
ion coefficient (two-way mixed, absolute agreement) and coefficient of
ariation were computed for average assessment of test-retest repeata-
ility ( Table 1 ) across all repeated scans.
Moreover, to ascertain whether there was an effect of time on repro-
ucibility (i.e., do those measurements that are more closely-spaced in
ime agree better than those spaced further apart in time?), intra-class
orrelation coefficients were also computed for individual time point
airs across all scan sessions.
.8. Repeatability at the voxel level
While our strong preference for microstructural comparisons is to
se a ‘tractometry’-based approach, ( Bells et al., 2011 ; Chamberland
t al., 2019 ) to perform individual/ group microstructural comparisons,
e recognise the prevalence of voxel-based analyses. We therefore con-
ucted a separate analysis of the reproducibility of each metric at the
oxel-level within white matter across the whole brain. This was done by
dopting the white matter skeletonisation approach popularised in the
BSS (Tract-Based Spatial Statistics, Smith et al., 2006 , framework, part
f FSL ( Smith et al., 2004 ). First, and as above, the MMPF, R 1 , MTR and
WF maps for a given participant and timepoint were first registered
o the individual’s native diffusion space using FLIRT ( Jenkinson and
mith, 2001 ).
Then, FA maps from all subjects at all time-points were aligned
nto a common space using the nonlinear registration tool FNIRT
Andersson et al., 2007 ; Andersson et al., 2007 ) which uses a b-spline
epresentation of the registration warp field ( Rueckert, 1999 ). Next, the
ean FA image was created and thinned to create a mean FA skele-
on which represents the centres of all tracts common to the group.
ach subject’s aligned FA map was then projected onto this skeleton
n MNI space. The nonlinear warps and skeleton projections generated
or FA were applied to the corresponding non-FA maps (already in dif-
usion space) to create white matter skeletons in MNI space for these
dditional metrics. Prior to analysis, a further thresholding step was
pplied. Specifically, each voxel in the skeletonised data was only re-
ained for further analysis if, in that voxel, all 5 participants at all six
ime-points had an FA > 0.2. This was to provide enhanced assurance
hat the analysis was restricted to white matter. For each metric, the
earson correlation was then conducted across all voxels in the thresh-
lded skeleton between each possible pair of time-points to assess the
epeatability across whole brain white matter.
.9. Demonstration of sample size estimation
To further illustrate the utility of the reproducibility data, we con-
ider the minimum number of subjects needed to reach statistical power
f 0.8 and significance of 𝛼 = 0.05 for two different types of statistical
ests routinely carried out in the neuroimaging literature, as outlined
elow (power calculations were computed using G
∗ Power, see Supple-
entary 2, Faul et al., 2009 ):
i) Independent groups t-test (e.g., for comparing a group of patients to a
group of healthy controls). Here, we evaluate the numbers of subjects
needed to detect a 1% and 5% group difference in each microstruc-
tural metric. This was done for all measures and tracts according to
means and standard deviations presented in Table 1 ( Fig. 4 ). The
minimum n was computed by inputting the percentage change from
the mean and standard deviations into G
∗ Power.

K. Koller, U. Rudrapatna, M. Chamberland et al. NeuroImage 225 (2021) 117406
Fig. 3. Intra-class correlation coefficients (two-way
mixed, absolute agreement) for test-retest repeatability
of microstructure measures measured 5 times in 6 par-
ticipants. ICC = intra-class correlation, CST = cortico-
spinal tract, FA = fractional anisotropy, MD = mean
diffusivity, RD = radial diffusivity, RSF = restricted dif-
fusion signal fraction, MMPF = macromolecular proton
fraction, MWF = myelin water fraction, R 1 = longitu-
dinal relaxation rate, MTR = magnetisation transfer ra-
tio.
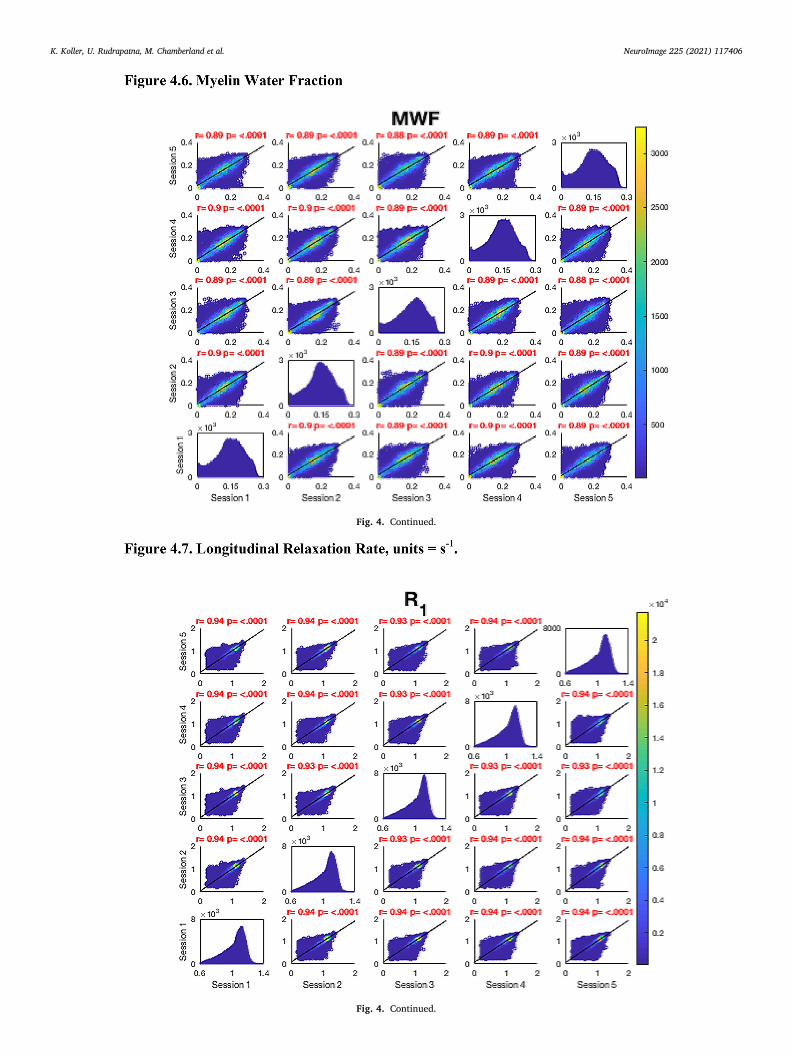
Fig. 4. Voxel-wise whole brain white matter Pearson correlations are presented between individual time points for voxels pooled across all subjects, r = Pearson
correlation coefficient, p < .0001 for all plots. Fig. 4.1 Fractional Anisotropy (FA), Fig. 4.2 Mean Diffusivity (MD), units = 10 − 3 mm
2 /s, Fig. 4.3 Radial Diffusivity
(RD), units = 10 − 3 mm
2 /s, Fig 4.4 Restricted Signal Fraction (RSF), Fig. 4.5 Macromolecular Proton Fraction (MMPF), Fig. 4.6 Myelin Water Fraction (MWF), Fig.
4.7 Longitudinal Relaxation Rate (R 1 ), units = s − 1 , Fig. 4.8 Magnetisation Transfer Ratio. For the 2D scatter plots, the colour scale denotes the number of voxels in
each joint histogram bin. The univariate histograms on the diagonal show the distributions of voxels of a given metric across all voxels (subject to the inclusion
criteria described in ‘Methods’) for each scan.
(
3
a
f
f
ii) Group (2) x Time (2) between-within groups ANOVA (e.g. , for showing
that there is a difference in the longitudinal evolution of a metric between
two groups). This was estimated across all measures and tracts at
small, medium and large effect sizes ( Fig. 5 ). Pearson correlation co-
efficients were used to account for the correlation amongst repeated
measures for sample size estimation ( Table 1 ).
. Results
Microstructural maps computed for one representative participant
re presented in Fig. 1 . Fig. 2 shows a typical reconstruction of the
ornix, arcuate fasciculus and cortico-spinal tracts, which were success-
ully dissected bilaterally for each MRI session for each participant.

K. Koller, U. Rudrapatna, M. Chamberland et al. NeuroImage 225 (2021) 117406
Fig. 4. Continued.
Fig. 4. Continued.

K. Koller, U. Rudrapatna, M. Chamberland et al. NeuroImage 225 (2021) 117406
Fig. 4. Continued.
Fig. 4. Continued.
K. Koller, U. Rudrapatna, M. Chamberland et al. NeuroImage 225 (2021) 117406
Fig. 4. Continued.
Fig. 4. Continued.

K. Koller, U. Rudrapatna, M. Chamberland et al. NeuroImage 225 (2021) 117406
Fig. 4. Continued.
Fig. 5. ICC coefficients for whole brain white matter voxels pooled across all participants. Error bars represent the lower and upper bound confidence intervals.

K. Koller, U. Rudrapatna, M. Chamberland et al. NeuroImage 225 (2021) 117406
Fig. 5. Continued.
F
o
n
a
3
i
w
E
a
w
fi
t
m
I
M
s
1
3
v
v
b
a
A
a
m
t
r
s
t
0
0
(
d
t
t
a
3
p
s
s
n
o
or one participant, calculation of a robust estimate of MWF failed for
ne session, while for another participant, calculation of the MMPF was
ot robust in one session. Thus, these values were not included in the
nalyses.
.1. Repeatability at the tract level
The coefficients of variation (CV) were overall low, ( Table 1 ), rang-
ng from 0.2 to 4.2%. Intra-class correlations ranged from 0.78 to 0.98
ith all demonstrating a high degree of repeatability ( Table 1 , Fig. 3 ).
stimated sample sizes for an independent groups t -test to measure a 1%
nd 5% group difference are presented in Fig. 6 and for a 2 × 2 between-
ithin ANOVA to measure small, medium and large effect sizes in Fig. 7 .
The CV values in Table 1 represent the averaged within-subject coef-
cients of variation. ICC values presented in Table 1 and Fig. 3 represent
he two-way mixed effects, absolute agreement with multiple measure-
ents ( Mcgraw and Wong, 1996 ) estimated by the below equation:
CC =
M S R − M S E M S R +
M S C −M S E 𝑛
S R = mean square for rows; MS E = mean square for error; MS C = mean
quare for columns; n = number of subjects (see Koo and Li, 2016 , pp.
57 for detailed breakdown of equations for ICC).
.2. Repeatability at the voxel level
Fig. 4 shows the analysis of repeatability at the voxel-level, for all
oxels on the white matter skeleton (see Methods). For each metric,
oxelwise whole brain white matter Pearson correlations are presented
etween individual time points for voxels pooled across all subjects, with
colour scale denoting the number of voxels in each joint histogram bin.
dditionally, univariate histograms show the distributions of voxels of
given metric across all voxels.
In terms of the Pearson correlation coefficient, the most reproducible
etric is FA with all pair-wise r > 0.95 (which is unsurprising given that
he FA was used to drive the skeletonisation process). The heatmap rep-
esentation of the joint histograms show that, despite some considerable
catter, the vast majority of data points lie along the line of identity. For
he other metrics: R 1 ( r > 0.93) shows superb reproducibility. RSF ( r >
.85), MMPF ( r > 0.84), MTR ( r > 0.81), MWF ( r > 0.88) and RD ( r >
.84) also show good performance. The lowest reproducibility is for MD
r > 0.62).
To further ascertain whether there was an effect of time on repro-
ucibility (i.e., do those measurements that are more closely-spaced in
ime agree better than those spaced further apart?), intra-class correla-
ion coefficients were computed for individual time point pairs across
ll scan sessions ( Fig. 5 ).
.3. Demonstration of sample size estimation
Returning to the tract-based estimates, Fig. 6 shows estimated sam-
le sizes for statistical designs required to reach a power of 0.8 and
ignificance 𝛼 of 0.05 for independent groups t -test in the fornix, cortico-
pinal tract and arcuate fasciculus for the different metrics. Clearly the
umber of subjects required varies by an order of magnitude depending
n which pathway is examined and which metric is used. A similar het-

K. Koller, U. Rudrapatna, M. Chamberland et al. NeuroImage 225 (2021) 117406
Fig. 6. Estimated sample sizes for statistical designs re-
quired to reach a power of 0.8 and significance 𝜶 of 0.05
for independent groups t -test in three white matter tracts
across several microstructure measures. Sample sizes were
estimated for 1% and 5% group differences according to
means and standard deviations presented in Table 1 . The
standard deviations were assumed to be constant across
groups.
e
a
4
m
t
a
r
r
o
m
t
t
G
i
a
(
a
w
c
a
c
p
s
c
o
r
f
c
R
c
d
m
t
t
i
(
M
f
w
R
t
f
t
f
d
s
i
m
d
q
e
rogeneity of required sample sizes is seen when powering for ANOVA
nalyses ( Fig. 7 ).
. Discussion
We present this paper as an introduction to MICRA – a multi-variate
icrostructural dataset collected on an ultra-strong gradient Connec-
om 3T MRI scanner. We offer the MRI community access to this MRI
rchive as a test-bed for conducting specialised analyses where access to
epeated measures of multi-contrast MRI data may help to inform cur-
ent and future research. As a demonstration of a possible application
f our MRI archive, we explored the reproducibility of microstructural
easures, including intra-class correlations and coefficients of varia-
ion, across multiple white matter tracts. Additionally, we presented es-
imates of samples sizes required for an independent groups t -test and a
roup(2) x Time(2) ANOVA to reach statistical power of 0.8 and signif-
cance of 𝛼 = 0.05 for various effect sizes across white matter measures
nd tracts.
Virtual dissections performed with probabilistic tractography
iFOD2, Jeurissen et al., 2014 , MRTrix) demonstrated the fornix, the
rcuate fasciculus and cortico-spinal tracts in all six participants and
ere replicated for all of the five repeated MRI scans. The overall low
oefficients of variation within participants and the high correlations
mong repeated measures suggest a high degree of consistency of mi-
rostructure measures across repeated tracts and scans.
Sample size estimations performed for an independent group com-
arison ( t -test) across microstructure measures and tracts demonstrated
imilar patterns of required sample sizes for 1% and 5% increase
hanges, with expectedly larger samples required for demonstrations
f 1% change. The differences in the standard deviation of measures are
eflected in the different sample sizes required. Notably, MWF in the
ornix and in the cortico-spinal tract, and MMPF in the Arcuate Fasci-
ulus demonstrated the largest sample sizes required. Conversely, the
SF, MTR, RD and R 1 in the fornix, the MTR, FA, MD, RD and R 1 in the
ortico-spinal tract, and the RD, MTR and R 1 in the arcuate fasciculus
emonstrated the smallest required sample sizes. Power analyses to esti-
ate sample sizes for a 2 × 2 between-within ANOVA demonstrated that
he measures showed a similar pattern for sample size requirement for
he fornix and the cortico-spinal tract. In these tracts, measures requir-
ng the smallest sample size were the MWF and R 1 . Diffusion measures
FA, RD, MD) and the MMPF required larger sample sizes, whereas the
TR and the RSF required the largest sample sizes to reach a given ef-
ect size. In contrast, the arcuate fasciculus demonstrated a pattern in
hich the diffusion measure required larger sample sizes compared to
1 and MTR, with MWF requiring the smallest sample size.
To conclude, we present a rich multivariate archive of microstruc-
ural MRI data acquired on a Connectom 3T MRI scanner. It is important
or researchers to take into consideration that the reproducibility statis-
ics reported here are directly applicable only to scans and analyses that
ollow conditions unique to the present study conducted on a high gra-
ient Connectom MRI scanner. Although this is unique to the present
tudy, the Connectom-acquired diffusion data offers the highest qual-
ty diffusion data available, offering researchers an indication of what
ight be possible in a ‘best case scenario’.
Data from this study demonstrate that microstructure measures
erived from multi-shell diffusion, multi-component relaxometry and
uantitative magnetisation transfer acquired on an ultra-strong gradi-
nt 3T MRI scanner are reliable as demonstrated by low coefficients of

K. Koller, U. Rudrapatna, M. Chamberland et al. NeuroImage 225 (2021) 117406
Fig. 7. Estimated sample sizes for statistical designs to reach
a power of 0.8 and 𝜶 of 0.05 in three white matter tracts for a
Group (2) x Time Point (2) ANOVA. Pearson correlations be-
tween all 5 sessions were averaged by transformation to Fis-
cher’s Z ( Fisher, 1915 ) to obtain an average correlation among
repeated coefficients for each metric ( Table 1 ). Correlation co-
efficients were used to estimate required sample sizes for each
metric.
v
a
C
s
U
s
F
R
o
M
t
v
M
o
&
C
c
r
F
r
D
F
f
A
I
E
a
ariation and high intra-class correlation coefficients across measures
nd tracts.
redit authorship contribution statement
Kristin Koller: Conceptualization, Data curation, Formal analy-
is, Methodology, Writing - original draft, Writing - review & editing.
mesh Rudrapatna: Conceptualization, Data curation, Formal analy-
is, Methodology, Writing - review & editing. Maxime Chamberland:
ormal analysis, Methodology, Writing - review & editing. Erika P.
aven: Data curation, Formal analysis, Funding acquisition, Method-
logy, Writing - review & editing. Greg D. Parker: Formal analysis,
ethodology, Writing - review & editing. Chantal M.W. Tax: Data cura-
ion, Formal analysis, Funding acquisition, Methodology, Writing - re-
iew & editing. Mark Drakesmith: Conceptualization, Data curation,
ethodology, Writing - review & editing. Fabrizio Fasano: Methodol-
gy, Writing - review & editing. David Owen: Software, Writing - review
editing. Garin Hughes: Software, Writing - review & editing. Cyril
harron: Software, Writing - review & editing. C John Evans: Con-
eptualization, Data curation, Formal analysis, Methodology, Writing -
eview & editing. Derek K. Jones: Conceptualization, Formal analysis,
unding acquisition, Methodology, Writing - original draft, Writing -
eview & editing.
ata access
Raw data and processed maps are available on the Open Science
ramework - please visit https://osf.io/z3mkn/ . See Supplementary 1
or outline of data included.
cknowledgments
The data were acquired at the UK National Facility for In Vivo MR
maging of Human Tissue Microstructure funded by the EPSRC (grant
P/M029778/1 ), and The Wolfson Foundation. DKJ, KK, GDP, MC
nd CMW were supported in part by a Wellcome Trust Investigator

K. Koller, U. Rudrapatna, M. Chamberland et al. NeuroImage 225 (2021) 117406
A
g
(
s
f
s
M
Q
i
S
t
R
A
A
A
A
A
B
B
C
C
C
C
C
D
D
D
D
E
F
F
F
G
G
G
H
J
J
J
J
J
J
K
K
L
M
M
M
M
M
O
P
P
R
R
ward (096646/Z/11/Z) and DKJ and MD by a Wellcome Trust Strate-
ic Award (104943/Z/14/Z). CMWT was supported by a Rubicon grant
680-50-1527) from the Netherlands Organisation for Scientific Re-
earch (NWO). ER was supported by a Marshall-Sherfield Fellowship
rom the Marshall Aid Commemoration Commission. We would like to
incerely thank Thomas Witzel for his help in establishing the diffusion
RI sequence on the Connectom and Tobias Wood for his help with the
UIT Toolbox. Finally, we would like to thank each participant for their
nvaluable contribution provided by taking part in this study.
upplementary materials
Supplementary material associated with this article can be found, in
he online version, at doi: 10.1016/j.neuroimage.2020.117406 .
eferences
llen, C., Mehler, D.M.A., 2019. Open science challenges, benefits and
tips in early career and beyond. PLOS Biology 17 (5), e3000246.
https://doi.org/10.1371/journal.pbio.3000246 .
ndersson, J. L. R., Jenkinson, M., & Smith, S. (2007). Non-linear registration aka Spatial
normalisation FMRIB Technial Report TR07JA2 .
ndersson, J.L.R., Skare, S., Ashburner, J., 2003. How to correct susceptibility distortions
in spin-echo echo-planar images: application to diffusion tensor imaging. NeuroImage
20 (2), 870–888. https://doi.org/10.1016/S1053-8119(03)00336-7 .
ndersson, J.L.R., Sotiropoulos, S.N., 2016. An integrated approach to correction for off-
resonance effects and subject movement in diffusion MR imaging. NeuroImage 125,
1063–1078. https://doi.org/10.1016/J.NEUROIMAGE.2015.10.019 .
ssaf, Y., Freidlin, R.Z., Rohde, G.K., Basser, P.J., 2004. New modeling and ex-
perimental framework to characterize hindered and restricted water diffusion
in brain white matter. Magnetic Resonance in Medicine 52 (5), 965–978.
https://doi.org/10.1002/mrm.20274 .
ells, S., Cercignani, M., Deoni, S., Assaf, Y., 2011. “Tractometry ” – comprehensive multi-
modal quantitative assessment of white matter along specific tracts. Proceedings of the
International Society for Magnetic Resonance in Medicine 19 (2009), 678. Retrieved
from http://cds.ismrm.org/protected/11MProceedings/files/678.pdf .
iswal, B.B., Mennes, M., Zuo, X.N., Gohel, S., Kelly, C., Smith, S.M., … Milham, M.P.,
2010. Toward discovery science of human brain function. Proceedings of the Na-
tional Academy of Sciences of the United States of America 107 (10), 4734–4739.
https://doi.org/10.1073/pnas.0911855107 .
Wood, T., 2018. QUIT: Quantitative Imaging Tools. Journal of Open Source Software 3
(26), 656. https://doi.org/10.21105/joss.00656 .
alamante, F., Tournier, J.D., Jackson, G.D., Connelly, A., 2010. Track-
density imaging (TDI): Super-resolution white matter imaging using
whole-brain track-density mapping. NeuroImage 53 (4), 1233–1243.
https://doi.org/10.1016/j.neuroimage.2010.07.024 .
ercignani, M., Alexander, D.C., 2006. Optimal acquisition schemes for in vivo quantita-
tive magnetization transfer MRI. Magnetic Resonance in Medicine 56 (4), 803–810.
https://doi.org/10.1002/mrm.21003 .
hamberland, M. , St-Jean, S. , Tax, C.M.W. , Jones, D.K. , 2019. Obtaining Representative
Core Streamlines for White Matter Tractometry of the Human Brain. Mathematics and
Visualization. Springer, Heidelberg, pp. 359–366 .
hang, L.C., Jones, D.K., Pierpaoli, C., 2005. RESTORE: Robust estimation of ten-
sors by outlier rejection. Magnetic Resonance in Medicine 53 (5), 1088–1095.
https://doi.org/10.1002/mrm.20426 .
eoni, S.C.L., 2009. Transverse relaxation time (T2) mapping in the brain
with off-resonance correction using phase-cycled steady-state free preces-
sion imaging. Journal of Magnetic Resonance Imaging 30 (2), 411–417.
https://doi.org/10.1002/jmri.21849 .
eoni, S.C.L., Kolind, S.H., 2015. Investigating the stability of mcDESPOT myelin water
fraction values derived using a stochastic region contraction approach. Magnetic Res-
onance in Medicine 73 (1), 161–169. https://doi.org/10.1002/mrm.25108 .
eoni, S.C.L., Matthews, L., Kolind, S.H., 2013. One component? Two components? Three?
the effect of including a nonexchanging “free ” water component in multicomponent
driven equilibrium single pulse observation of T1 and T2. Magnetic Resonance in
Medicine 70 (1), 147–154. https://doi.org/10.1002/mrm.24429 .
eoni, S.C.L., Rutt, B.K., Arun, T., Pierpaoli, C., Jones, D.K., 2008. Gleaning multicompo-
nent T1 and T2 information from steady-state imaging data. Magnetic Resonance in
Medicine 60 (6), 1372–1387. https://doi.org/10.1002/mrm.21704 .
rcan, E., Varma, G., Mädler, B., Dimitrov, I.E., Pinho, M.C., Xi, Y., … Vinogradov, E.,
2018. Microstructural correlates of 3D steady-state inhomogeneous magnetization
transfer (ihMT) in the human brain white matter assessed by myelin water imaging
and diffusion tensor imaging. Magnetic Resonance in Medicine 80 (6), 2402–2414.
https://doi.org/10.1002/mrm.27211 .
aul, F., Erdfelder, E., Buchner, A., Lang, A.-G., 2009. Statistical power analyses using
G ∗ Power 3.1: Tests for correlation and regression analyses. Behavior Research Meth-
ods 41 (4), 1149–1160. https://doi.org/10.3758/BRM.41.4.1149 .
isher, R.A., 1915. Frequency Distribution of the Values of the Correlation Coeffi-
cient in Samples from an Indefinitely Large Population. Biometrika 10 (4), 507.
https://doi.org/10.2307/2331838 .
riedrich, P., Fraenz, C., Schlüter, C., Ocklenburg, S., Mädler, B., Güntürkün, O.,
Genç, E., 2020. The Relationship Between Axon Density, Myelination, and Fractional
Anisotropy in the Human Corpus Callosum. Cerebral Cortex (New York, N.Y. : 1991)..
https://doi.org/10.1093/cercor/bhz221 .
eeraert, B.L., Lebel, R.M., Lebel, C., 2019. A multiparametric analysis of white matter
maturation during late childhood and adolescence. Human Brain Mapping 40 (15),
4345–4356. https://doi.org/10.1002/hbm.24706 .
lasser, M.F., Sotiropoulos, S.N., Wilson, J.A., Coalson, T.S., Fischl, B., … Anders-
son, J.L.WU-Minn HCP Consortium, for the W.-M. H, 2013. The minimal prepro-
cessing pipelines for the Human Connectome Project. NeuroImage 80, 105–124.
https://doi.org/10.1016/j.neuroimage.2013.04.127 .
rech-Sollars, M., Hales, P.W., Miyazaki, K., Raschke, F., Rodriguez, D., Wilson, M.,
… Clark, C.A., 2015. Multi-centre reproducibility of diffusion MRI parameters
for clinical sequences in the brain. NMR in Biomedicine 28 (4), 468–485.
https://doi.org/10.1002/nbm.3269 .
oy, A.R., Koay, C.G., Kecskemeti, S.R., Alexander, A.L., 2014. Optimization of a free
water elimination two-compartment model for diffusion tensor imaging. NeuroImage
103, 323–333. https://doi.org/10.1016/J.NEUROIMAGE.2014.09.053 .
enkinson, M., Bannister, P., Brady, M., Smith, S., 2002. Improved optimization for the
robust and accurate linear registration and motion correction of brain images. Neu-
roImage 17 (2), 825–841. https://doi.org/10.1016/S1053-8119(02)91132-8 .
enkinson, M., Smith, S., 2001. A global optimisation method for robust affine
registration of brain images. Medical Image Analysis 5 (2), 143–156.
https://doi.org/10.1016/S1361-8415(01)00036-6 .
eurissen, B., Tournier, J.D., Dhollander, T., Connelly, A., Sijbers, J., 2014.
Multi-tissue constrained spherical deconvolution for improved anal-
ysis of multi-shell diffusion MRI data. NeuroImage 103, 411–426.
https://doi.org/10.1016/j.neuroimage.2014.07.061 .
ones, D.K., Alexander, D.C., Bowtell, R., Cercignani, M., Dell’Acqua, F., McHugh, D.J.,
… Tax, C.M.W., 2018, November 15. Microstructural imaging of the human brain
with a ‘super-scanner’: 10 key advantages of ultra-strong gradients for diffusion MRI.
NeuroImage. https://doi.org/10.1016/j.neuroimage.2018.05.047 .
ones, D.K., Horsfield, M.A., Simmons, A., 1999. Optimal strategies
for measuring diffusion in anisotropic systems by magnetic reso-
nance imaging. Magnetic Resonance in Medicine 42 (3), 515–525.
https://doi.org/10.1002/(SICI)1522-2594(199909)42:3 < 515::AID-MRM14>3.0.CO;
2-Q .
ung, W., Lee, J., Shin, H.G., Nam, Y., Zhang, H., Oh, S.H., Lee, J., 2018, November 15.
Whole brain g-ratio mapping using myelin water imaging (MWI) and neurite ori-
entation dispersion and density imaging (NODDI). NeuroImage. Academic Press Inc
https://doi.org/10.1016/j.neuroimage.2017.09.053 .
ellner, E., Dhital, B., Kiselev, V.G., Reisert, M., 2016. Gibbs-ringing artifact removal
based on local subvoxel-shifts. Magnetic Resonance in Medicine 76 (5), 1574–1581.
https://doi.org/10.1002/mrm.26054 .
oo, T.K., Li, M.Y., 2016. A Guideline of Selecting and Reporting Intraclass Correlation
Coefficients for Reliability Research. Journal of Chiropractic Medicine 15 (2), 155–
163. https://doi.org/10.1016/j.jcm.2016.02.012 .
ipp, I., Jones, D.K., Bells, S., Sgarlata, E., Foster, C., Stickland, R., … Tomassini, V.,
2019. Comparing MRI metrics to quantify white matter microstructural
damage in multiple sclerosis. Human Brain Mapping 40 (10), 2917–2932.
https://doi.org/10.1002/hbm.24568 .
cGraw, K.O., Wong, S.P., 1996. Forming Inferences about Some Intr-
aclass Correlation Coefficients. Psychological Methods 1 (1), 30–46.
https://doi.org/10.1037/1082-989X.1.1.30 .
etzler-Baddeley, C., Foley, S., De Santis, S., Charron, C., Hampshire, A., Caeyen-
berghs, K., Jones, D.K., 2017. Dynamics of white matter plasticity under-
lying working memory training: Multimodal evidence from diffusion MRI
and relaxometry. Journal of Cognitive Neuroscience 29 (9), 1509–1520.
https://doi.org/10.1162/jocn_a_01127 .
orris, S.R., Holmes, R.D., Dvorak, A.V., Liu, H., Yoo, Y., Vavasour, I.M., … Laule, C.,
2020. Brain Myelin Water Fraction and Diffusion Tensor Imaging Atlases for 9 ‐10
Year ‐Old Children. Journal of Neuroimaging. https://doi.org/10.1111/jon.12689 .
ougin, O.E. , Coxon, R.C. , Pitiot, A. , Gowland, P.A. , 2010. Magnetization trans-
fer phenomenon in the human brain at 7 T. NeuroImage 49 (1), 272–281
https://doi.org/https://doi.org/10.1016/j.neuroimage.2009.08.022 .
unafò, M.R., Nosek, B.A., Bishop, D.V.M., Button, K.S., Chambers, C.D., Per-
cie Du Sert, N., … Ioannidis, J.P.A., 2017, January 10. A manifesto for
reproducible science. Nature Human Behaviour. Nature Publishing Group
https://doi.org/10.1038/s41562-016-0021 .
’Connor, D., Potler, N.V., Kovacs, M., Xu, T., Ai, L., Pellman, J., … Milham, M.P., 2017.
The Healthy Brain Network Serial Scanning Initiative: a resource for evaluating inter-
individual differences and their reliabilities across scan conditions and sessions. Gi-
gaScience 6 (2). https://doi.org/10.1093/gigascience/giw011 .
apinutto, N.D., Maule, F., Jovicich, J., 2013. Reproducibility and biases in high field
brain diffusion MRI: An evaluation of acquisition and analysis variables. Magnetic
Resonance Imaging 31 (6), 827–839. https://doi.org/10.1016/j.mri.2013.03.004 .
r čkovska, V., Rodrigues, P., Puigdellivol Sanchez, A., Ramos, M., Andorra, M., Martinez-
Heras, E., … Villoslada, P., 2016. Reproducibility of the Structural Connectome
Reconstruction across Diffusion Methods. Journal of Neuroimaging 26 (1), 46–57.
https://doi.org/10.1111/jon.12298 .
amani, A. , Dalton, C. , Miller, D.H. , Tofts, P.S. , Barker, G.J. , 2002. Pre-
cise estimate of fundamental in-vivo MT parameters in human brain in
clinically feasible times. Magnetic Resonance Imaging 20 (10), 721–731
https://doi.org/https://doi.org/10.1016/S0730-725X(02)00598-2 .
udrapatna, S.U. , Parker, G.D. , Roberts, J. , Jones, D.K. , 2018. Can we correct for interac-
tions between subject motion and gradient-nonlinearity in diffusion {MRI}? In: Pro-
ceedings of the International Society for Magnetic Resonance in Medicine, 25, p. 1206 .

K. Koller, U. Rudrapatna, M. Chamberland et al. NeuroImage 225 (2021) 117406
R
S
S
S
S
S
T
U
V
V
V
W
Z
ueckert, D., 1999. Nonrigid registration using free-form deformations: Application
to breast mr images. IEEE Transactions on Medical Imaging 18 (8), 712–721.
https://doi.org/10.1109/42.796284 .
etsompop, K., Kimmlingen, R., Eberlein, E., Witzel, T., Cohen-Adad, J., Mc-
Nab, J.A., … Wald, L.L., 2013. Pushing the limits of in vivo diffu-
sion MRI for the Human Connectome Project. NeuroImage 80, 220–233.
https://doi.org/10.1016/j.neuroimage.2013.05.078 .
mith, S.M., 2002. Fast robust automated brain extraction. Human Brain Mapping 17 (3),
143–155. https://doi.org/10.1002/hbm.10062 .
mith, S.M., Jenkinson, M., Johansen-Berg, H., Rueckert, D., Nichols, T.E.,
Mackay, C.E., … Behrens, T.E.J., 2006. Tract-based spatial statistics: Voxel-
wise analysis of multi-subject diffusion data. NeuroImage 31 (4), 1487–1505.
https://doi.org/10.1016/j.neuroimage.2006.02.024 .
mith, S.M., Jenkinson, M., Woolrich, M.W., Beckmann, C.F., Behrens, T.E.J., Johansen-
Berg, H., … Matthews, P.M., 2004. Advances in functional and structural
MR image analysis and implementation as FSL. NeuroImage, 23. Neuroimage
https://doi.org/10.1016/j.neuroimage.2004.07.051 .
tikov, N., Boudreau, M., Levesque, I.R., Tardif, C.L., Barral, J.K., Pike, G.B., 2015. On
the accuracy of T1 mapping: Searching for common ground. Magnetic Resonance in
Medicine 73 (2), 514–522. https://doi.org/10.1002/mrm.25135 .
ong, Q., He, H., Gong, T., Li, C., Liang, P., Qian, T., … Zhong, J., 2019.
Reproducibility of multi-shell diffusion tractography on traveling subjects:
A multicenter study prospective. Magnetic Resonance Imaging 59, 1–9.
https://doi.org/10.1016/j.mri.2019.02.011 .
ddin, M.N., Figley, T.D., Solar, K.G., Shatil, A.S., Figley, C.R., 2019. Comparisons be-
tween multi-component myelin water fraction, T1w/T2w ratio, and diffusion ten-
sor imaging measures in healthy human brain structures. Scientific Reports 9 (1).
https://doi.org/10.1038/s41598-019-39199-x .
eraart, J., Novikov, D.S., Christiaens, D., Ades-aron, B., Sijbers, J., Fieremans, E., 2016.
Denoising of diffusion MRI using random matrix theory. NeuroImage 142, 394–406.
https://doi.org/10.1016/J.NEUROIMAGE.2016.08.016 .
ollmar, C., O’Muircheartaigh, J., Barker, G.J., Symms, M.R., Thompson, P., Kumari, V., …
Koepp, M.J., 2010. Identical, but not the same: Intra-site and inter-site reproducibility
of fractional anisotropy measures on two 3.0 T scanners. NeuroImage 51 (4), 1384–
1394. https://doi.org/10.1016/J.NEUROIMAGE.2010.03.046 .
os, S.B., Tax, C.M.W., Luijten, P.R., Ourselin, S., Leemans, A., Froeling, M., 2017. The
importance of correcting for signal drift in diffusion MRI. Magnetic Resonance in
Medicine 77 (1), 285–299. https://doi.org/10.1002/mrm.26124 .
asserthal, J., Neher, P., Maier-Hein, K.H., 2018. TractSeg - Fast and ac-
curate white matter tract segmentation. NeuroImage 183, 239–253.
https://doi.org/10.1016/j.neuroimage.2018.07.070 .
hang, Y., Brady, M., Smith, S., 2001. Segmentation of Brain MR Images Through
a Hidden Markov Random Field Model and the Expectation-Maximization Al-
gorithm, 20. IEEE TRANSACTIONS ON MEDICAL IMAGING Retrieved from
http://citeseerx.ist.psu.edu/viewdoc/download?doi = 10.1.1.200.3832&rep = rep1&
type = pdf .