micro air vehicle (mav) propulsion -...
TRANSCRIPT

Multi-Disciplinary Engineering Design Conference
Kate Gleason College of Engineering Rochester Institute of Technology
Rochester, New York 14623
© 2005 Rochester Institute of Technology
Project Number: 6002
MICRO AIR VEHICLE (MAV) PROPULSION
Zach Kilcer Project Manager
Mechanical Engineering
Dr. Jeffrey Kozak Project Advisor
Mechanical Engineering Dept.
Joseph Olles Chief Engineer
Mechanical Engineering
William Strong Mechanical Engineering
Sean Dittrich Mechanical Engineering
Brian Stumper Mechanical Engineering
Douglas Brown
Electrical Engineering
ABSTRACT This paper discusses the design of a Micro Air Vehicle (MAV) propulsion system with emphasis on propeller and power system optimization. Specifications established by conferring with the MAV Airframe Team were used to design a baseline propulsion system with an electrical system optimized for a commercial motor and propeller. Several types of propellers, including ducted and shrouded propellers of less than a 15 cm span, are investigated for Reynolds numbers ranging from 3000 to 100000. Custom propellers were designed, evaluated, and manufactured using XFOIL, XFLR5 and JavaProp. The final design achieved the MAV teams design requirements and exceeded the thrust-to-weight ratio of last years design by 22%.
INTRODUCTION Over the past decade, the aerospace industry has taken increasing interest in Micro Air Vehicle (MAV) technology. MAVs are broadly defined as aircraft that weigh less than 100g and have a maximum linear dimension smaller than 15cm [1]. Initially rooted in Defense related reconnaissance applications, the development of MAV technology, stimulated by the annual International MAV competition, has been pursued at the university level for several years. Students of the MAV Team at the Rochester Institute of Technology (RIT) have led local research and development efforts for the past four years and are currently focusing on improving the 2005 MAV design.
This year two separate design groups are working in unison to design a MAV airframe with an optimal propulsion system to demonstrate at the 2006 International Micro Air Vehicle Competition (IMAVC). The bulk of this paper will focus on the design, evaluation, and implementation of the optimal propulsion system used in the 2006 MAV design. The term propulsion system refers to; in particular the propeller, onboard electronics, motor, and shroud/duct of an MAV. Improvements in thrust-to-weight ratio, size, and overall weight, when compared to the 2004 MAV design, are achievable by optimizing the core components of the propulsion system. NOMENCLATURE
A1 − Propeller disc area Aplate – Flat plate area
Aexit − Exit area c – Chord CD – Drag coefficient CL – Lift coefficient CT – Thrust coefficient Di – Diameter Dif – Fairing diameter D – Drag FD – Drag force FT – Thrust force J – Advance ratio Le – Length

Proceedings of the Multi-Disciplinary Engineering Design Conference Page 2
Paper Number 6002
n – Angular velocity (rev./sec.) Pw – Power Re – Reynolds number S – Wing span T – Thrust U∞ – Free stream velocity V1 – Velocity at propeller disk Vexit – Exit velocity Wt – Weight
ρ − Air density φ – Ratio of propeller disk areas
INITIAL DESIGN
Propulsion Configuration During the initial design phase three (3) propulsion configurations were studied which included: a duct, a shroud, and a propeller. A propeller in a puller configuration, as used in last years MAV design, was selected as a baseline to compare the performance of the shrouded and ducted propellers. A puller configuration refers to the propeller oriented such that it “pulls” the rest of the vehicle during flight and is considered standard in MAV technology. Ducted propellers are qualified as propellers which are surrounded by a fairing of constant circular airfoil profile. Shrouds follow similar definition though lack the airfoil profile. While all of these propulsion systems are proven technologies with respect to full scale aircraft, the affects at the MAV scale have yet to be fully investigated. However, an extensive literature review was able to identify a key advantage of each configuration. Both ducted and shrouded propellers, shown in figures 1 and 2 respectively, reduce loses due to tip vortices which effectively increases the performance of the propulsion system. However, a duct or shroud configuration will increase overall weight and drag of an MAV.
Figure 1. Custom Shroud and Propeller Manufactured with Carbon Fiber
Figure 2. Custom ABS Plastic Ducts Electronic System Design papers authored by participants in the 2004 and 2005 Micro Air Vehicle competition [2] were reviewed to study component utilization and electronic system architecture. After reviewing the selected papers it was determined the basic electronic components required for a MAV propulsion system are a battery, electronic motor, and a control system consisting of an RF receiver and speed controller. The common configuration used for a MAV electronic system is shown below in Figure 3. The sub-systems highlighted in solid black lines are essential for a barebones propulsion system. The sub-systems highlighted in dashed-gray lines are future requirements of the RIT MAV airframe team.
RF ReceiverSpeed
Controller
VideoTransmitter
Servo Motors
ElectronicMotor
RF Transmitter
Control System
BatteryVideo
Receiver
VideoCamera
RF ReceiverSpeed
Controller
VideoTransmitter
Servo Motors
ElectronicMotor
RF Transmitter
Control System
BatteryVideo
Receiver
VideoCamera
Figure 3. Block diagram of the electronic system After reviewing the architecture of the electronic system, components were selected to optimize weight, efficiency, performance, and power for the MAV. A commercial off-the-shelf (COTS) coreless motor and six inch propeller, which satisfied the initial design constraints for the propulsion system, were used in the design of the electronic system. Special design considerations such as the power, weight, and size of two (2) servos, a video camera, and a video transmitter required for the airframe were also incorporated into the design. Once all the specifications were defined a power system was designed to minimize overall weight and size while

Proceedings of the KGCOE Multi-Disciplinary Engineering Design Conference Page 3
Copyright © 2005 by Rochester Institute of Technology
maximizing power. Shown below in Table 1 is the power budget for the electronic system.
Table 1. Propulsion System Power Budget.
Component Voltage [V] Current [A]
Batteries (x3) 11.1 +1.500
Speed controller 11.1-5.0 -0.025
RF receiver 11.1-5.0 -0.025
Electric motor 11.1 -0.980
Servo motors (x2) 11.1-5.0 -0.200
Video camera 11.1-5.0 -0.100
Video transmitter 11.1-5.0 -0.120
Power Surplus 11.1 +0.050
BASELINE DESIGN The baseline system was designed to meet the performance goals for the 2006 IMAVC and the design requirements set forth by the MAV propulsion team during Senior Design 1. Manufacturer data for motor / propeller combinations along with feasibility testing of propeller configurations and the electronic system design assisted in the development of the baseline design of the propulsion system. Shown below in Table 2 are the design specifications derived for the system. The baseline design consisted of a commercial six inch propeller in a puller configuration with a coreless motor including all the electronic components required to meet the flight specifications. The camera, video transmitter and servo motors were considered when defining the battery life. Table 2. Expected Performance Specifications for the Baseline Propulsion System.
Factor Specification
Max Thrust 86g
Max Weight 81g
Thrust-to-weight ratio 1.00
Size (max dimension) 6”
Battery Life 12 min
Flight Range 600m
Number of Receiver Channels 5
Auxiliary Power 5.0W
Estimated Surplus Power 0.50W
ANALYTIC VALIDATION While the baseline configuration is a known solution to the MAV propulsion issue, the shrouded and ducted designs needed some analytic validation of concept prior to the allocation of time and resources to the empirical investigation thereof. As a start the thrust of the baseline configuration was calculated using the Momentum Theory Eq (1).
FT = ρ V1 A1 (Vexit - U∞) (1)
This in turn was compared against a thrust estimate of the shrouded propeller configuration which also utilized Momentum Theory, Eq. (1). As the shroud configuration introduces a drag inducing external structure, the required estimate of its negative influence was calculated using the flat plate model below in Eq (2).
FD = (1/2) CD ρ U∞
2Aplate (2)
The thrust of the duct design, with respect to the puller configuration, used a power/thrust ratio equation based on Momentum Theory provided below in Eq (3). Pw/T = (1/4)[3 U∞ + (U∞
2 + 4 φ T /(ρ A1))]
1/2 (3)
Drag was calculated using the CD equation for a biplane wing given in Eq (4) – (9); an assumption motivated by H. Muttray (1941) who found an annular airfoil compared with that of the area of a biplane [5].
CD = FD/((1/2) ρ V02 π Dif Le) (4)
S = 2 Di Le (5)
c = Di (6)
CD = k S CL
2/(π c
2) = k 2 Le CL
2/(π Di) (7)
CT = FT /(ρ n
2 Di
4) (8)
J = U∞ /(n Di) (9)
In summary, these results validated the literature reviewed for ducted and shrouded designs. As anticipated, they provided the rational to proceed with implementation and experimentation.
EXPERIMENTATION & OPTIMIZATION After the initial design phase, including analytic evaluation of design, over eighty (80) different propeller and propulsion configurations were tested using the electronic system from the initial baseline design. Each new design was tested statically to determine a reference point of performance parameters which included; maximum required voltage, current, thrust, motor RPM, and inlet/exit velocity. After the results were recorded modifications were made to improve on the tested design. After several iterations, selected designs were tested in the wind tunnel to measure dynamic performance parameters and examine simulated “in- flight” behavior.

Proceedings of the Multi-Disciplinary Engineering Design Conference Page 4
Paper Number 6002
Static Testing The static test was designed to compare the static thrust of different propulsion configurations. The static test stand, shown in Figure 4, consists of a base, a connecting arm mounted to the base, and a load cell mounted vertically at the free end of the connecting arm. Static thrust measurements were acquired by measuring the amount of force applied to a load cell using a multi-meter and a corresponding load cell amplifier. Voltage and current measurements were obtained using a multi-meter to measure the voltage applied to the motor and a power supply to source current at a fixed voltage. The speed of the motor and the inlet/exit velocity produced by the propulsion system were acquired using a stroboscope and an anemometer respectively. These measurements were taken for each propulsion configuration to assess baseline, static performance.
Figure 4. Static Test Setup Dynamic Testing The drag of each propulsion system was acquired by using the wind tunnel to simulate in-flight conditions. To measure drag, the wind tunnel was equipped with a dynamic test fixture and a load cell. Before any tests began the drag of the dynamic test fixture was acquired by measuring the force applied to the load cell for fixed wind tunnel velocities ranging from 0mph to 30mph. The selection of wind tunnel speeds were agreed upon by the Airframe Team as a representative range for MAV operation. Each test started by calibrating the compression and tension ratios of the load cell using an instrumentation amplifier, a multi-meter, and calibrated weights. Once the test stand was calibrated, a given propulsion system under examination was placed into the wind tunnel as
shown in Figure 5. The wind tunnel was operated over its full range to calculate the drag of the windmilling propulsion system. The drag value obtained during the test served as a baseline value for each system. Then, using a power supply, a second multi-meter and a stroboscope, the drag of the entire operational propulsion system was determined for motor speeds of 25%, 50%, 75%, and 100% (referenced as RPM1, RPM2, RPM3, and RPM4 respectively) over the full wind tunnel operating range.
Figure 5. Dynamic Test Setup Using the RIT Wind Tunnel.
Propeller In addition to the investigation of ducts and shrouds to increase performance, another major avenue of research was custom propeller development. Custom propellers, tailored specific for the RIT MAV, holds considerable design potential since commercially available propellers are not optimized for flight conditions specific to the RIT MAV. In design, the major variables which affect the ability of a propeller to produce thrust are: motor power, propeller diameter, propeller rotational speed, vehicle cruise speed, vehicle drag, number of propeller blades, propeller airfoil profile and air pressure. Other variables of interest are propeller tip shape, pitch angle, airfoil profile, radial location of the profile on the propeller blade, and material. Initial propeller design methodology involved evaluating a comprehensive list of profile geometries for the highest thrust at expected cruise velocities. Assumptions of propeller rotational speeds were made using available manufacturer data for similarly sized commercial propellers. Thrust was predicted for multiple airfoil profiles over a wide range of pitch angles and radial blade locations using XFLR5, a low Reynolds Number

Proceedings of the KGCOE Multi-Disciplinary Engineering Design Conference Page 5
Copyright © 2005 by Rochester Institute of Technology
airfoil performance software application. Some profiles were expected to have consistently superior performance under the predicted flight conditions. However, this did not occur in practice. While no clear trend in profile geometry existed, it was apparent the pitch angle and radial location were essential for optimization. The amount of data generated by this process was significant and therefore determined not feasible for producing a propeller in the project time frame. The assimilation of results from a study on MAV propeller design at Sejong University, South Korea discussed in [8] vastly reduced the amount of initial design research required, and enabled us to move into the production and testing phase. The method discussed in the paper used an initial ARA-D 6% airfoil profile to compare against other profiles. In summary, the paper demonstrated the greatest performance could be achieved with a slightly flattened ARA-D 6% profile. This method was adopted for its similarity to the current MAV team’s carbon fiber lay-up manufacturing process. With a proven method of development, set values for propeller size, rotational speed, vehicle cruise speed, number of blades, propeller material and required thrust were determined. The only development parameter which varied for optimization was the airfoil profile. Propellers were manufactured laying sheets of carbon fiber over a rapid prototype mold. This method restricted the manufacture of profiles with a substantially large thickness greater than 6% of the chore length. Therefore only thin profiles were examined. An initial design was created using JavaProp, an internet-based propeller profile design program. As discussed in published literature [8] the ARA-D 6% profile served as a reference. Airfoil pitch-angle and chord length were accounted for by the program requiring no manual intervention. The resulting performance characteristics of the ARA-D 6% profile were generated using XFLR5. With a final design established a prototype propeller was manufactured to verify the results obtained during the simulation. New propellers were designed in a iterative process using the conclusions derived from the data measured during such tests.
RESULTS Propeller Predicted thrust values have corroborated the concluded superiority of the ARA-D 6% profile from the University of South Korea study [8]. Initial custom propeller prototypes have produced roughly
50 grams of thrust in static testing, with larger propeller chord sizes giving better performance than smaller chord propeller blades. These values come within 5 grams of thrust from the best performing commercial propeller of the same size and demonstrate the team’s ability to fabricate custom designed propellers. Composite prototypes have also demonstrated a weight reduction of roughly 2 grams when compared to their commercial counterparts. These results, however, are for static testing alone and there is no comparison of thrust values at predicted cruise velocities where airspeed will affect performance considerably. Propeller theory predicts that at cruise velocities a smaller chord propeller blade will have better performance than larger chorded blades.
Electronic System The electronic system designed for the baseline propulsion system was evaluated during a series of tests to confirm compliance with the original design specifications. The functionality of each component including the motor, battery, receiver, and speed controller was confirmed. Shown below in Table 3 is a test matrix comparing the measured performance parameters of the electrical system with respect to the original design specifications. All of the design specifications were achieved with one exception, the lifetime of the battery. Battery lifetime is defined as the duration of time the battery can maintain a voltage above 8.4V while supplying a load current of 1.5A. The battery used during the test had a manufacturer specification of 300mAh. However, the average charge the batteries were able to store during the test was slightly lower than the manufacturer specified, resulting in a slightly lower battery life.
Table 3. Comparison of Specified vs. Measured Performance Parameters of the Electronic System
Parameter Specification Measured
Max Receiver Range 600m +600m
Max Battery Life 12 min 10.5 min
Max Battery Current 1.5A 3.0A
Receiver Channels 5 5
Auxiliary Power 5.0W 6.0W
Surplus Power 0.5W 1.5W
Max Motor Current 1.00A 0.98A
The entire system was tested by wiring all of the components together. The batteries were connected to the speed controller and the speed controller was connected to the motor and RF receiver as illustrated earlier in Figure 3. An RF transmitter, set on channel 46, was powered ‘on’ to confirm proper operation of the battery and motor. Two servomotors where then connected to the RF receiver to confirm proper operation of the additional channels. Finally, the functionality of the speed controller was verified by

Proceedings of the Multi-Disciplinary Engineering Design Conference Page 6
Paper Number 6002
varying the throttle on the RF transmitter from ‘low’ to ‘high’.
Static Tests Multiple propulsion configurations were tested statically. Using the total propulsion component weights, shown in Table 4, along with the thrust measurements acquired, thrust to weight ratios were calculated, shown in Tables 4 and 5, and plotted as shown in Figures 6 and 7 respectively.
Table 4. Propulsion Component Weights Component Weight [g]
Batteries (3) 21.2
Speed Controller 4
RF Receiver 12
Motor 16.1
Propeller Thrust to Wight Ratios
0.000
0.200
0.400
0.600
0.800
1.000
1.200
1.400
1.600
1 2 3 4 5 6 7 8 9 10 11 12 13 14 15 16 17 18 19 20 21 22 23
Propeller #
T:W
t
<Ø4" Ø4" Ø4.5" Ø5"Ø4.75" Ø6"
Figure 6. Thrust to Weight Ratios of Propeller Only Propulsion Configuration
Table 5. Propeller Number and Description Correlating to Fig. 6
Propeller# Description
1 2.5" Dia 6-Blade Prop
2 U-80 (80mm Dia)
3 Custom Carbon Prop 80mm Dia
4 GWS-4025
5 GWS-6030 (Mod 4")
6 GWS-6030 (Mod 4")
7 MA064OT 3-Blade prop (Mod 4")
8 GWS EP-9070x3 (Mod 4")
9 APC 4.75x4.5" (Mod 4")
10 APC 4.75x4.75 (Mod 4")
11 APC 4.5x4.1 (Mod 4")
12 Custom Carbon Prop 4"
13 Custom Carbon Prop 4" (2nd Iteration)
14 GWS EP-4540
15 APC LP04541
16 GWS EP 4530
17 LP 04747c (4.75x4.75c)
18 LP 04745c (4.75x4.50c)
19 GWS EP-5043
20 GWS EP-7060 (Mod 5")
21 GWS EP-5030
22 MA064OT 3-Blade prop
23 GWS 6030
Propulsion Thrust to Weight Ratios
0.000
0.100
0.200
0.300
0.400
0.500
0.600
0.700
0.800
0.900
1.000
1 2 3 4 5 6 7
Propulsion #
T:W
t
Shroud Duct
Figure 7. Thrust to Weight Ratios of Shroud/Duct Propulsion Configurations Table 6. Propulsion Number and Description Correlating to Fig. 7
Propulsion# Description
1 Shrouded 2.5" Dia 6-Blade Prop
2 Shrouded U-80
3 Concave Duct GWS-EP-9070 3-blade (Mod 4")
4 Concave Duct 0640 1510 3-blade (Mod 4")
5 Concave Duct GWS EP-9070 3-blade (Mod 4")
6 Concave Duct GWS-6030 (Mod 4")
7 Convex Duct GWS-EP-6030 (Mod 3.5")
As shown in Figure 6, the thrust to weight ratios exceeded 1:1 as the propeller diameter increased. The smallest diameter to produce a ratio higher than one occurred at the 4.5” diameter. The propeller that produced the most thrust was a 6” diameter propeller reaching a ratio of 1.58. Propellers with a diameter greater than 6” were not investigated since the maximum linear dimension of the MAV could not exceed 6”. Though shrouded and ducted propulsion systems did in fact create more static thrust, they could not compensate for the weight of the additional structural elements, shown in Figure 7. The bodies of these propulsion configurations required complex compound curves which the team could only manufacture with ABS plastic based rapid prototyping.
Proceedings of the KGCOE Multi-Disciplinary Engineering Design Conference Page 7
Copyright © 2005 by Rochester Institute of Technology
Upon examination of the static results, the top configurations were selected for further analysis in the wind tunnel, or dynamic testing, based on their thrust to weight ratios.
Dynamic Tests The first task was to determine the “in-tunnel” influence of the dynamic test stand. Placed alone in the wind tunnel, drag values were measured for the entire velocity range to determine CD values relative to Re. Upon analysis of the measured values it is apparent that CD is predominantly constant and asymptotic to a value of 1.26 for the given range. Considering that the portion of the fixture exposed to the free stream is cylindrical, it is possible to correlate the data to published results which state a cylinder will have a CD=1.2. In an effort to understand the error inherent in the setup, the displacement of the test stand was calculated for the relevant test speeds. The results showed a maximum displacement of only .0167 inch at maximum speed, which is negligible for the given application. The windmilling drag values show that, although a baseline configuration incurs less drag at extremely low Re, the ducted and shrouded propeller drag were less at Re closer to MAV operating range. As seen from the graph in Figure 8, all of the curves approach asymptotic CD values with increasing Re.
CD vs Re
0
0.1
0.2
0.3
0.4
0.5
0.6
0 20000 40000 60000 80000 100000 120000 140000
Re
CD
Base Prop Shroud Prop Concave Duct Convex Duct
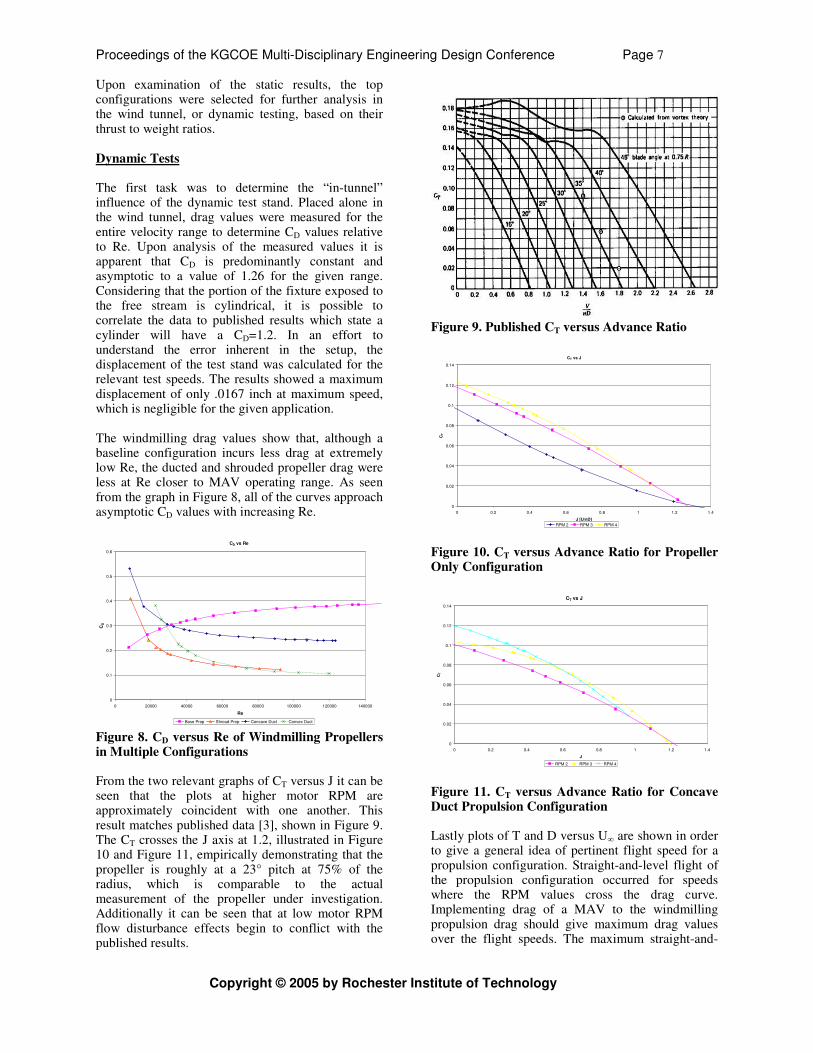
Figure 8. CD versus Re of Windmilling Propellers in Multiple Configurations From the two relevant graphs of CT versus J it can be seen that the plots at higher motor RPM are approximately coincident with one another. This result matches published data [3], shown in Figure 9. The CT crosses the J axis at 1.2, illustrated in Figure 10 and Figure 11, empirically demonstrating that the propeller is roughly at a 23° pitch at 75% of the radius, which is comparable to the actual measurement of the propeller under investigation. Additionally it can be seen that at low motor RPM flow disturbance effects begin to conflict with the published results.
Figure 9. Published CT versus Advance Ratio
CT vs J
0
0.02
0.04
0.06
0.08
0.1
0.12
0.14
0 0.2 0.4 0.6 0.8 1 1.2 1.4
J [U/nD]
CT
RPM 2 RPM 3 RPM 4
Figure 10. CT versus Advance Ratio for Propeller Only Configuration
CT vs J
0
0.02
0.04
0.06
0.08
0.1
0.12
0.14
0 0.2 0.4 0.6 0.8 1 1.2 1.4
J
CT
RPM 2 RPM 3 RPM 4
Figure 11. CT versus Advance Ratio for Concave Duct Propulsion Configuration Lastly plots of T and D versus U∞ are shown in order to give a general idea of pertinent flight speed for a propulsion configuration. Straight-and-level flight of the propulsion configuration occurred for speeds where the RPM values cross the drag curve. Implementing drag of a MAV to the windmilling propulsion drag should give maximum drag values over the flight speeds. The maximum straight-and-

Proceedings of the Multi-Disciplinary Engineering Design Conference Page 8
Paper Number 6002
level flight speeds can be seen at the highest RPM value, RPM 4, on the T and D versus U∞ plots. The difference in maximum speed ranges from roughly 12.5 m/s for the propeller only configuration to 8.5 m/s for the convex duct propulsion configuration, shown in Figures 12 and 13 respectively. The shroud and concave duct show a slight decrease in maximum flight speed, but are able to fly at lower RPM values with respect to the puller, or propeller only, configuration. Data supporting this claim is provided Figures 14 and 15 respectively.
T & D vs U∞
0
5
10
15
20
25
30
35
40
45
0.0 2.0 4.0 6.0 8.0 10.0 12.0 14.0 16.0
U∞ [m/s]
T [
g]
0
5
10
15
20
25
30
35
40
45
D [
g]
RPM 2 RPM 3 RPM 4 Drag
Figure 12. Thrust and Drag versus Flight Speed for Propeller Only Configuration
T & D vs U∞
0
5
10
15
20
25
30
0 2 4 6 8 10 12 14
U∞ [m/s]
T [
g]
0
5
10
15
20
25
30
D [
g]
RPM 4 RPM 3 RPM 2 Drag Figure 13. Thrust and Drag versus Flight Speed for Convex Duct Propulsion Configuration
T & D vs U∞
0
5
10
15
20
25
30
0 2 4 6 8 10 12 14 16
U∞ [m/s]
T [
g]
0
5
10
15
20
25
30
D [
g]
RPM 4 RPM 3 RPM 2 RPM 1 Drag Figure 14. Thrust and Drag versus Flight Speed for the Shroud Propulsion Configuration
T & D vs. U∞
0
5
10
15
20
25
30
35
40
45
0 2 4 6 8 10 12 14 16
U∞ [m/s]
T [
g]
0
5
10
15
20
25
30
35
40
45
D [
g]
RPM 4 RPM 3 RPM 2 RPM 1 Drag
Figure 15. Thrust and Drag versus Flight Speed for Concave Duct Propulsion Configuration
FINAL DESIGN The components used in the final design were selected after the last optimization phase. The results from the static and dynamic tests were used to determine the optimal propeller and propulsion configuration to use with the power system. The final design included a 4.5” propeller (see Ref 14 in Table 5) in a puller configuration. Shown below in Table 2 are the performance parameters for the final design with respect to the original specifications. Table 7. Measured Performance of the Final Design Compared with the Original Specifications
Parameter Specification Measured
Max Thrust 86g 67g
Max Weight 81g 55g
Thrust-to-Weight 1.00 1.22
Size (max dimension) 6” 4.5”
Battery Life 12 min 10.5 min
Flight Range 600m +600m
Number of Receiver Channels
5 5
Auxiliary Power 5.0W 6.0W
Surplus Power 0.50W 1.5W
The design of the MAV electronic system discussed complied with the original design specifications for the Airframe team’s requirement. However, the estimated flight time they provided was based on an inaccurate assumption about the average flight speed which in practice was determined to be higher than anticipated. Accordingly, this higher speed translates into a shorter total flight time needed for the competition event. As a result, the power available for operation is in excess of what is required providing for a factor of safety. The baseline motor/propeller configuration was selected due to the Airframe Teams concerns about the stability and aerodynamic issues associated with implementing a duct or shroud. To meet the design

Proceedings of the KGCOE Multi-Disciplinary Engineering Design Conference Page 9
Copyright © 2005 by Rochester Institute of Technology
specifications given from the MAV team, in terms of durability, custom propellers have been fabricated from a carbon fiber composite with a rigid surface that will not shatter upon impact while at full speed. The team was able to achieve a T:Wt ratio of 1 or greater from propellers ranging 4.5 to 6 inches in diameter. Manufactured propellers were only produced for diameters of 4” to demonstrate feasibility. Further iterations are required to improve propeller performance.
FUTURE WORK Future work will focus on the continued development of a propeller tailored for the needs of the MAV team. Upon creating a more effective propeller, dynamic tests will be performed to evaluate simulated in-flight performance. Additionally, drag values of an MAV airframe will be found and integrated into the current plots to illustrate closer estimated flight speeds. Improvements in flight time and overall weight can be realized by researching new battery technologies as they develop. Investigation of the concept of shrouding and ducting propellers has thoroughly demonstrated enough promise for further investigation. The increase in static thrust with little change in estimated flight speed is motivation enough for future work. That research should focus on the examination of duct fairing body length and profiles of duct fairings as a means to further increase performance. Additionally, improved manufacturing methods, notably composite based structures, should be examined to address the weight issue inherent in the duct and shroud designs. Future propeller designs will be enhanced when a more accurate estimate of cruise velocity and airframe drag is made available. Additional benefits can be realized by evaluating propeller designs using XROTOR software instead of XFOIL to incorporate rotation into performance analysis.
ACKNOWLEDGMENTS
The MAV Propulsion Team would like to sincerely thank all the corporate sponsors, RIT faculty, and
MAV team members that supported this project. Financial support was provided by Boeing and Impact Technologies to purchase components and equipment used during this project. Professional insight and guidance was provided by Dr. Kevin Kochersberger, Dr. Agamemnon Crassidis, Professor Wellen, and Dave Hathaway. Manufacturing and prototyping support was provided by Kevin Egan, Andrew Streett, and Shane Healey. Finally, thank you Dr. Jeffrey Kozak, our team sponsor and advisor, for the technical recommendations and project guidance.
REFERENCES [1] McMichael, J., Francis, M.: Micro Air Vehicles - Toward a New Dimension in Flight, Defense Advanced Research Projects Agency, 1997. [2] “Micro Air Vehicle Design Papers,” 8
th Annual
MAV Competition, University of Arizona, April, 2004. [3] von Mises, Richard. Theory of Flight. New York: Dover, 1959. [4] Eppler, Richard and Hepperle, Martin. “A Procedure for Propeller Design by Inverse Methods.” International Conference of Inverse Design Concepts in Engineering Sciences. Oct. 1984: 445-460. [5] Küchmann, Dietrich and Weber, Johanna. Aerodynamics of Propulsion. London: McGraw-Hill, 1953. [6] Kondor S., Amitay M., Parekh D., Fung P., Glezer A., 2001 “Active Flow Control Application on a Mini Ducted Fan UAV” AIAA-2001-2440, AIAA Applied Aerodynamics Conference, 19th, Anaheim, CA, June 11-14. [7] Foa, J. V. Elements of Flight Propulsion, John Wiley & Sons, 1960. [8] Lee, Ki-Hak, Et Al, 2004, “Implementation of the Numerical Optimization for the MAV Propeller”AIAA-2004-4428, Multidisciplinary Analysis& Optimization Conference, Albany, NY, Aug. 30-Sept. 1.