micro array data analysis clustering and classification methods
TRANSCRIPT

8/8/2019 Micro Array Data Analysis Clustering and Classification Methods
http://slidepdf.com/reader/full/micro-array-data-analysis-clustering-and-classification-methods 1/12
Page 1
Copyright Russ B. Altman
Microarray data analysis:clustering and classification
methods
Russ B. AltmanBMI 214CS 274
Copyright Russ B. Altman
Microarrays: DNA BasePairing
CA
G
TC
G
A
T
5’ 3’
5’3’
C A G TG T C A
5’
5’ 3’
3’
Copyright Russ B. Altman
Microarrays:Experimental Protocol
Known DNA sequences
Glass slide
Cells of Interest
Isolate mRNA
Reference sampleCopyright Russ B. Altman
TypicalDNAarray
forYeast
Copyright Russ B. Altman
Affymetrix chip technology
Instead of putting down intact genes on the chip,these chips put down N-mers of a certain length(around 20) systematically onto a chip bysynthesizing the N-mers on the spots.
Labelled mRNA is then added to the chip and a*pattern* of binding (based on which 20-mersare in the mRNA sequence) is seen.
Bioinformatics is used to deduce the mRNAsequences that are present
Copyright Russ B. Altman
Affymetrix fabrication
8/8/2019 Micro Array Data Analysis Clustering and Classification Methods
http://slidepdf.com/reader/full/micro-array-data-analysis-clustering-and-classification-methods 2/12
Page 2
Copyright Russ B. Altman
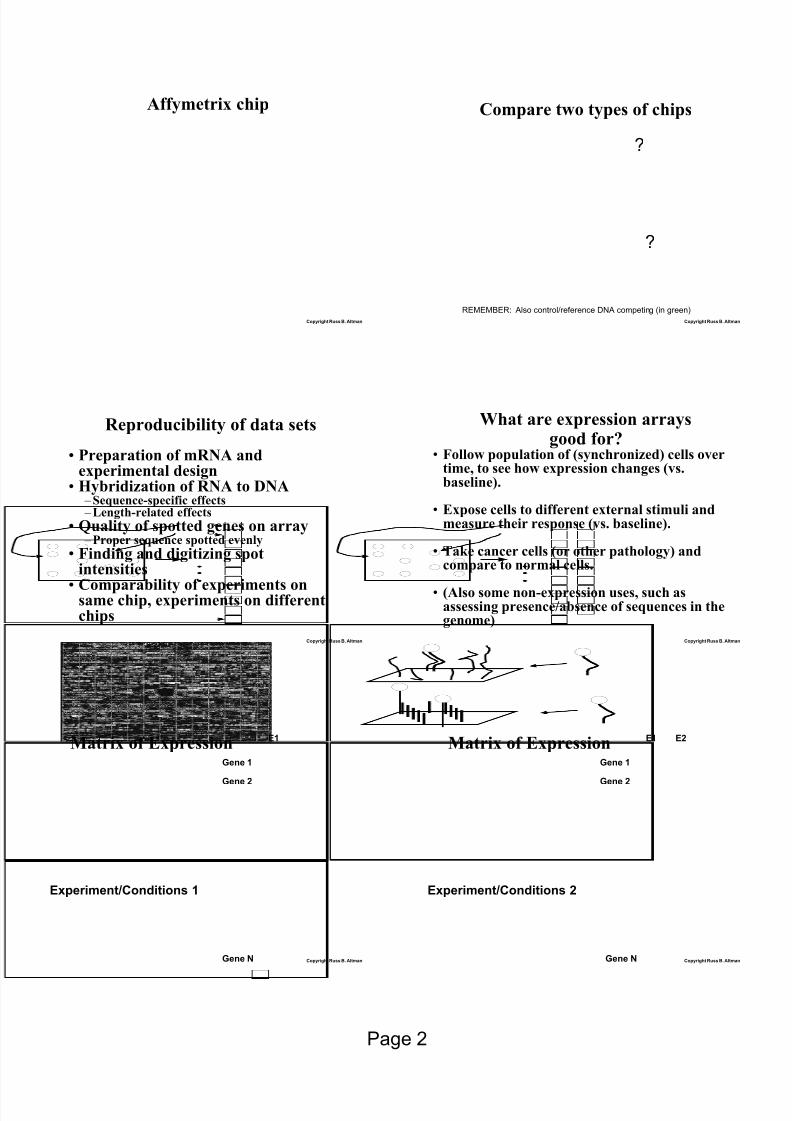
Affymetrix chip
Copyright Russ B. Altman
Compare two types of chips
?
?
REMEMBER: Also control/reference DNA competing (in green)
Copyright Russ B. Altman
Reproducibility of data sets
• Preparation of mRNA andexperimental design
• Hybridization of RNA to DNA – Sequence-specific effects – Length-related effects
• Quality of spotted genes on array – Proper sequence spotted evenly
• Finding and digitizing spotintensities
• Comparability of experiments onsame chip, experiments on differentchips
Copyright Russ B. Altman
What are expression arraysgood for?
• Follow population of (synchronized) cells overtime, to see how expression changes (vs.baseline).
• Expose cells to different external stimuli andmeasure their response (vs. baseline).
• Take cancer cells (or other pathology) andcompare to normal cells.
• (Also some non-expression uses, such asassessing presence/absence of sequences in thegenome)
Copyright Russ B. Altman
Matrix of ExpressionGene 1
Gene 2
Gene N
Experiment/Conditions 1
E1
Copyright Russ B. Altman
Matrix of ExpressionGene 1
Gene 2
Gene N
Experiment/Conditions 2
E1 E2

8/8/2019 Micro Array Data Analysis Clustering and Classification Methods
http://slidepdf.com/reader/full/micro-array-data-analysis-clustering-and-classification-methods 3/12
Page 3
Copyright Russ B. Altman
Matrix of ExpressionGene 1
Gene 2
Gene N
Experiment/Conditions 3
E1 E2 E3
Copyright Russ B. Altman
Reorder Rows for Clustering
Gene 1
Gene 2
Gene N
E1 E2 E3
Gene 1
Gene 2
Gene N
E1 E2 E3
Copyright Russ B. Altman
Why do we care aboutclustering expression data?
If two genes are expressed in the same way, theymay be functionally related.
If a gene has unknown function, but clusters withgenes of known function, this is a way to assign itsgeneral function.
We may be able to look at high resolutionmeasurements of expression and figure out which
genes control which other genes.
E.g. peak in cluster 1 always precedes peak incluster 2 => ?cluster 1 turns cluster 2 on?
Copyright Russ B. Altman
Copyright Russ B. Altman
Average of clustered waveforms
Copyright Russ B. Altman
Typical“waveforms”
observed(note: not
lots of bumps)

8/8/2019 Micro Array Data Analysis Clustering and Classification Methods
http://slidepdf.com/reader/full/micro-array-data-analysis-clustering-and-classification-methods 4/12
Page 4
Copyright Russ B. Altman
Cluster Analysis Result
Copyright Russ B. Altman
Methods for Clustering
• Hierarchical Clustering
• Self Organizing Maps
• K-means
• Trillions of others.
Copyright Russ B. Altman
Need a distance metrix for two n-dimensional vectors (e.g., for n
expression measurements)1. Euclidean Distance
D(X, Y) = sqrt [(x 1-y 1)2 + (x 2-y2)2 …(x n-yn)2 ]
2. Correlation coefficient
R(X,Y) = cov(xy)/sd(x)sd(y)= 1/n * SUM [ (x i-xo)/σ x * (y i-yo)/σ y ]
Where = σ x = sqrt (E(x 2) - E(x) 2)
and E(x) = expected value of x = average of x3. Other choices for distance too…
Copyright Russ B. Altman
Hierarchical ClusteringUsed in Eisen et al
(Nodes = genes or groups of genes. Initially all nodes arerows of data matrix)
1. Compute matrix of all distances (they usedcorrelation coefficient)
2. Find two closest nodes.3. Merge them by averaging measurements (weighted)4. Compute distances from merged node to all others
5. Repeat until all nodes merged into a single node
Copyright Russ B. Altman
Hierarchical Clustering E1 E2 E3
Copyright Russ B. Altman
How many clusters? E1 E2 E37
4
8/8/2019 Micro Array Data Analysis Clustering and Classification Methods
http://slidepdf.com/reader/full/micro-array-data-analysis-clustering-and-classification-methods 5/12
Page 5
Copyright Russ B. Altman
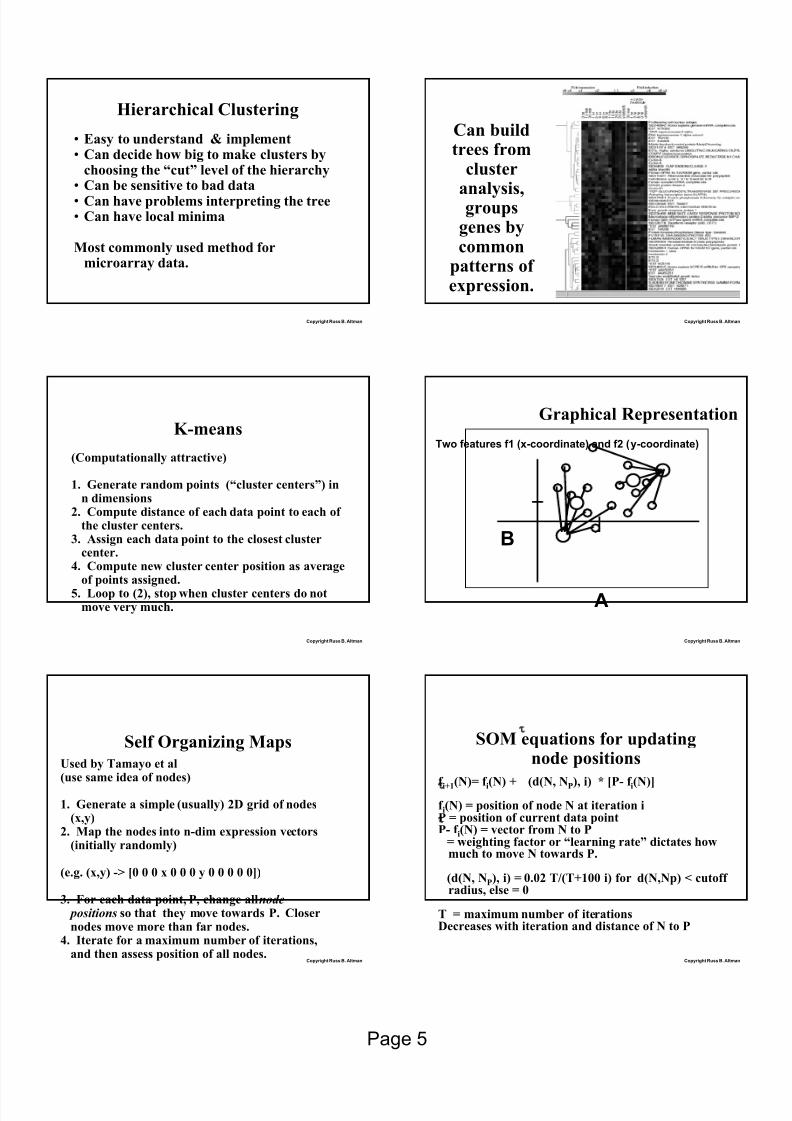
Hierarchical Clustering
• Easy to understand & implement• Can decide how big to make clusters by
choosing the “cut” level of the hierarchy• Can be sensitive to bad data• Can have problems interpreting the tree• Can have local minima
Most commonly used method formicroarray data.
Copyright Russ B. Altman
Can buildtrees from
cluster
analysis,groupsgenes bycommon
patterns of expression.
Copyright Russ B. Altman
K-means
(Computationally attractive)
1. Generate random points (“cluster centers”) inn dimensions
2. Compute distance of each data point to each of the cluster centers.
3. Assign each data point to the closest clustercenter.
4. Compute new cluster center position as averageof points assigned.
5. Loop to (2), stop when cluster centers do notmove very much.
Copyright Russ B. Altman
Graphical Representation
A
B
Two features f1 (x-coordinate) and f2 (y-coordinate)
Copyright Russ B. Altman
Self Organizing MapsUsed by Tamayo et al(use same idea of nodes)
1. Generate a simple (usually) 2D grid of nodes(x,y)
2. Map the nodes into n-dim expression vectors(initially randomly)
(e.g. (x,y) -> [0 0 0 x 0 0 0 y 0 0 0 0 0])
3. For each data point, P, change all node positions so that they move towards P. Closernodes move more than far nodes.
4. Iterate for a maximum number of iterations,and then assess position of all nodes.
Copyright Russ B. Altman
SOM equations for updatingnode positions
f i+1 (N)= f i(N) + τ (d(N, N P), i) * [P- f i(N)]f i(N) = position of node N at iteration iP = position of current data pointP- f i(N) = vector from N to Pτ = weighting factor or “learning rate” dictates how
much to move N towards P.
τ (d(N, N P), i) = 0.02 T/(T+100 i) for d(N,Np) < cutoff radius, else = 0
T = maximum number of iterationsDecreases with iteration and distance of N to P
8/8/2019 Micro Array Data Analysis Clustering and Classification Methods
http://slidepdf.com/reader/full/micro-array-data-analysis-clustering-and-classification-methods 6/12
Page 6
Copyright Russ B. Altman
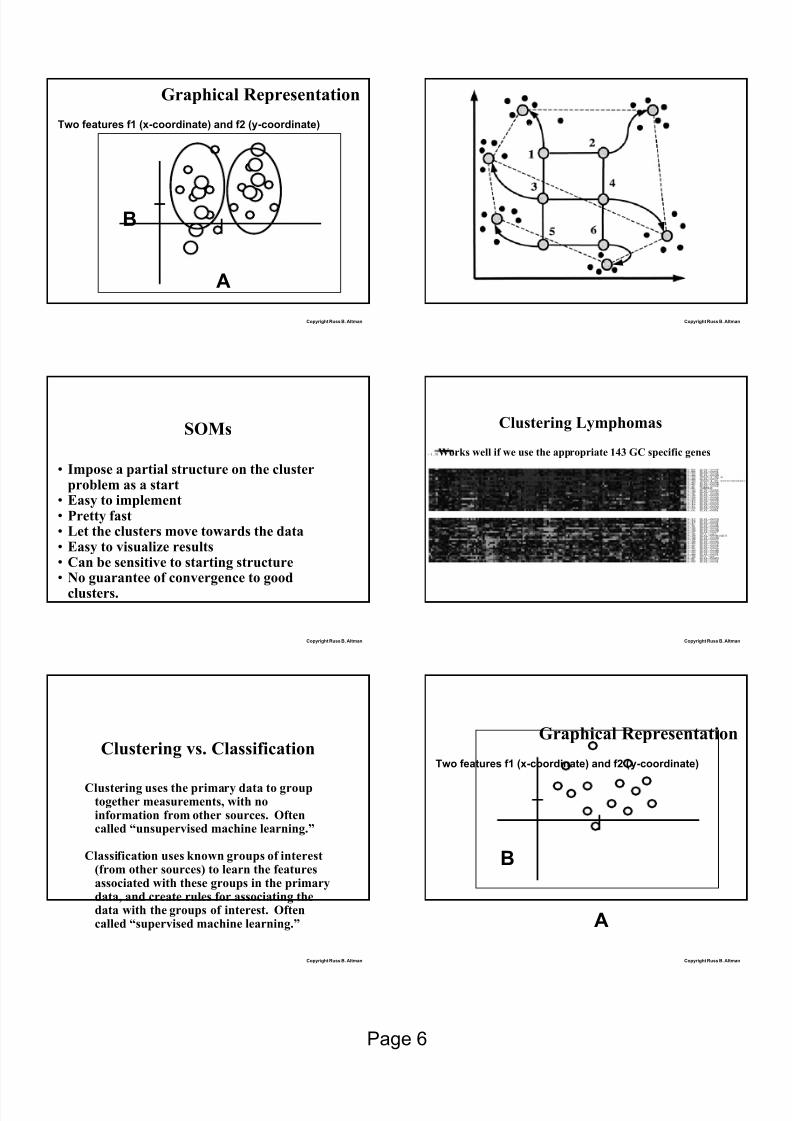
Graphical Representation
A
B
Two features f1 (x-coordinate) and f2 (y-coordinate)
Copyright Russ B. Altman
Copyright Russ B. Altman
SOMs
• Impose a partial structure on the clusterproblem as a start
• Easy to implement• Pretty fast• Let the clusters move towards the data• Easy to visualize results• Can be sensitive to starting structure• No guarantee of convergence to good
clusters.
Copyright Russ B. Altman
Clustering Lymphomas
Works well if we use the appropriate 143 GC specific genes
Copyright Russ B. Altman
Clustering vs. Classification
Clustering uses the primary data to grouptogether measurements, with noinformation from other sources. Oftencalled “unsupervised machine learning.”
Classification uses known groups of interest(from other sources) to learn the featuresassociated with these groups in the primarydata, and create rules for associating thedata with the groups of interest. Oftencalled “supervised machine learning.”
Copyright Russ B. Altman
Graphical Representation
A
B
Two features f1 (x-coordinate) and f2 (y-coordinate)

8/8/2019 Micro Array Data Analysis Clustering and Classification Methods
http://slidepdf.com/reader/full/micro-array-data-analysis-clustering-and-classification-methods 7/12
Page 7
Copyright Russ B. Altman
Clusters
A
B
Two features f1 (x-coordinate) and f2 (y-coordinate)
Copyright Russ B. Altman
Apply external labels for classification
A
B
RED group and BLUE group now labeled
Copyright Russ B. Altman
Tradeoffs
Clustering is not biased by previousknowledge, but therefore needsstronger signal to discovery clusters.
Classification uses previous knowledge,so can detect weaker signal, but maybe biased by WRONG previousknowledge.
Copyright Russ B. Altman
Methods for Classification
Linear Models
Logistic Regressian
Naïve Bayes
Decision Trees
Support Vector Machines
Copyright Russ B. Altman
Linear ModelEach gene, g, has list of n measurements at each
condition, [f1 f2 f3…fn].
Associate each gene with a 1 if in a group of interest,otherwise a 0.
Compute weights to optimize ability to predictwhether genes are in group of interest or not.
Predicted group = SUM [ weight(i) * fi]
If fi always occurs in group 1 genes, then weight ishigh. If never, then weight is low.
Assumes that weighted combination works.Copyright Russ B. Altman
Linear Model
A
B
PREDICT RED if high value for A and low value for B,(high weight on x coordinate, negative weight on y)

8/8/2019 Micro Array Data Analysis Clustering and Classification Methods
http://slidepdf.com/reader/full/micro-array-data-analysis-clustering-and-classification-methods 8/12
Page 8
Copyright Russ B. Altman
Logistic Regressionp = probability of being in group of interestf = vector of expression measurements
log(p/(1-p) = β f
or
p = e β f /(1+e β f )
Use optimization methods to find β that maximizesthe difference between two groups. Then, can useequation to estimate membership of a gene in agroup.
Copyright Russ B. Altman
Classifying Lymphomas
Copyright Russ B. Altman
Bayes Rule for ClassificationBayes’ Rule: p(hypothesis|data) =
p(data|hypothesis)p(hypothesis)/p(data)
p(group 1| f) = p(f|group1) p(group1)/p(f)
p(group 1|f) = probability that gene is in group 1give the expression data
p(f) = probability of the data
p(f|group 1) = probability of data given that geneis in group 1
p(group 1) = probability of group 1 for a givengene (prior)
Copyright Russ B. Altman
Naïve BayesAssume all expression measurements for a gene are
independent.
Assume p(f) and p(group1) are constant.
P(f|group 1) = p(f1&f2…fn|group1)= p(f1|group1) * p(f2|group1)…* p(fn|group1)
Can just multiply these probabilities (or add theirlogs), which are easy to compute, by counting upfrequencies in the set of “known” members of
group 1.
Choose a cutoff probability for saying “Group 1member.”
Copyright Russ B. Altman
Naïve Bayes
A
B
If P(Red|x=A) * P(Red| y = 0) = HIGH, so assign to RED
Copyright Russ B. Altman
Decision Trees
Consider an n-dimensional graph of all datapoints (f, gene expression vectors).
Try to learn cutoff values for each fi thatseparate different groups.

8/8/2019 Micro Array Data Analysis Clustering and Classification Methods
http://slidepdf.com/reader/full/micro-array-data-analysis-clustering-and-classification-methods 9/12
Page 9
Copyright Russ B. Altman
Decision TreesIf x < A and y > B => BLUE
If Y < B OR Y >B and X > A => RED
A
B
Copyright Russ B. Altman
Support Vector Machines
Draw a line that passes close to the members of two different groups that are the most difficultto distinguish.
Label those difficult members the “supportvectors.” (Remember, all points are vectors).
For a variety of reasons (discussed in thetutorial, and the Brown et al paper to somedegree), this choice of line is a good one forclassification, given many choices.
Copyright Russ B. Altman
Support Vectors and Decision Line
A
B
(One point left out)
Copyright Russ B. Altman
Support Vectors and Decision Line
A
B
(Bad point put back in…Can penalize boundary line for bad predictions
PENALTY based ondistance from line
Copyright Russ B. Altman
Choose boundary line that isclosest to both support vectors
1/||w||
Copyright Russ B. Altman
Notes about SVMsIf the points are not easily separable in n dimensions,
can add dimensions (similar to how we mapped lowdimensional SOM grid points to expressiondimensions).
Dot product is used as measure of distance betweentwo vectors. But can generalize to an arbitraryfunction of the features (expression measurements)as discussed in Brown and associated Burgestutorial.

8/8/2019 Micro Array Data Analysis Clustering and Classification Methods
http://slidepdf.com/reader/full/micro-array-data-analysis-clustering-and-classification-methods 10/12
Page 10
Copyright Russ B. Altman Copyright Russ B. Altman
Copyright Russ B. Altman
Other informatics issues• Low level image processing of spots to assess
amount of fluorescence.
• Need to deal with missing values (due toexperimental artifacts, etc…)
• Need to decide how much of a change issignificant (e.g. “2-fold increase” inexpression).
• Creation of databases with the info (SMD)
Copyright Russ B. Altman
TypicalDNAarray
forYeast
Copyright Russ B. Altman
Estimate Missing Values.
Complete data set Data set with missingvalues estimated byKNNimpute algorithm
Data set with 30% entriesmissing (missing valuesappear black)
Copyright Russ B. Altman
0.150.16
0.17
0.18
0.19
0.2
0.210.22
0.23
0.24
0.25
0 5 10 15 20
Percent of entries missing
N o r m a
l i z e d R M S e r r o r
filled withzeros
row average
SVDimpute
KNNimpute

8/8/2019 Micro Array Data Analysis Clustering and Classification Methods
http://slidepdf.com/reader/full/micro-array-data-analysis-clustering-and-classification-methods 11/12
Page 11
Copyright Russ B. Altman
Choosing best “indicator” genes
Which gene or genes “predicts” the class thebest.
Might be a good candidate for a biomarker.
Allows you to focus attention on smallnumber of genes, instead of large numberrequired to get perfect discriminationbetween groups.
Copyright Russ B. Altman
0
0.5
1
1.5
2
2.5
1 2 3 4 5 6 7
Principal Component
Variance
Principal Component Analysis of Conditionsin Microarray Experiment
Copyright Russ B. Altman
PCA--first two components
Copyright Russ B. Altman
PCAand clustersreported in
originalliterature
Copyright Russ B. Altman
Independent Components Analysis
Find projection where distribution maximizes ameasure of non-normality.
Use kurtosis as measure of non-normality.
Morekurtotic
Lesskurtotic
Copyright Russ B. Altman
Look for interesting genes
w’ A* After + w’ B*Before
w A* After + w B*Before

8/8/2019 Micro Array Data Analysis Clustering and Classification Methods
http://slidepdf.com/reader/full/micro-array-data-analysis-clustering-and-classification-methods 12/12
Copyright Russ B. Altman
“Interesting” Projections
max variance = PCAmax kurtosismax non-Gaussianity
Normal = not interesting (PJHuber ‘85, Jone & Sibson‘87)
max information
Copyright Russ B. Altman
ICA
MOTIFFINDING
PROGRAM
non-sites sites
500bp 5’ ORF
remainder
Copyright Russ B. Altman
Discovered MSE Promoter
>YLL004W ORC3 1 74 ATTTGTGTCAT
>YML066C x 1 336 TTTTGTGTCAT
>YFR028C CDC14 1 35 TTCTGTGACTT
>YNL018C x 2 r444 TTTTGTGGCAC
r484 ATTTGTGACGT
>YJL212C x 1 r3 TTCTGTGACGT
>YNL174W x 1 283 ATCTGTGACAT
>YBR069C VAP1 1 350 TTTTGTGGCAT
>YDR191W HST4 1 384 TTTAGTGACAT
>YHR124W NDT80 2 414 TTTTGTGTCAC
r212 TTTTGTGTCAT
Consensus: TTTTGTGACAT
the regulatory elementthat recognizes this
promoter...multiple elements
Copyright Russ B. Altman
Imagine other arraytechnologies
Protein chips to assess interaction of proteins (lay down proteins, and thenlabel others, and look for bindingevents).
Copyright Russ B. Altman
Reproducibility of data setshttp://bioinformatics.oupjournals.org/cgi/reprint/18/3/405.pdf
• Preparation of mRNA and
experimental design• Hybridization of RNA to DNA
– Sequence-specific effects – Length-related effects
• Quality of spotted genes on array – Proper sequence spotted evenly
• Finding and digitizing spotintensities
• Comparability of experiments onsame chip, experiments on differentchips