micro-climate control in a grow-cell: system development...
TRANSCRIPT
Micro–Climate Control in a Grow–Cell:System Development and Overview
.
Ioannis Tsitsimpelis ∗ C. James Taylor ∗
∗ Engineering Department, Lancaster University, LA1 4YR, UK(e-mail: [email protected])
Abstract: The research behind this article aims to reduce the operational costs and energyconsumption of closed–environment growing systems, or grow–cells. Essentially a sealed buildingwith a controlled environment, and insulated from outside lighting, grow–cells are configured tosuit the particular crop being produced. There are numerous research questions relating to theirdesign and operation, including their energy requirements, air movement, dehumidification,internal racking design, different ways to deploy artificial LED lighting, and the monitoringof crop reaction to these. The present article briefly reviews the concept and describes somepreliminary work in relation to a demonstration system deing developed by the authors andcollaborating industry partner. This prototype consists of a 12m×2.4m shipping container witha commercial heating/ventilation system. Multi–layer growing trays are circulated by means ofa novel conveyor system. The article describes the development of the conveyor control system,summarises research into LED light selection, and introduces the thermal modelling approach.The latter is illustrated using experimental data from a laboratory scale test chamber.
Keywords: Modeling and Control of Agriculture; Plant Factories; Optimal Control inAgriculture; Distributed Control of Environmental Systems; Modeling and Identification
1. INTRODUCTION
The research behind this article aims to reduce theoperational costs and energy consumption of closed–environment growing systems, or grow–cells. Essentiallya sealed building with LED lighting and a controlled en-vironment, grow–cells are configured to suit the particularcrop being produced. When compared to greenhouses, theenergy requirements, water consumption and carbon emis-sions are potentially lowered in an optimally designed sys-tem. Other conceptual benefits include crop growth in cli-matic conditions which previously were not suitable; cropsare grown under sterile conditions, eliminating the need forpesticides; and grown closer to the final consumer, reduc-ing transportation costs. There is also considerable scopefor investigation of a range of biological and horticulturalissues, for example crop delivery date and flavour, by on–line regulation of the lighting and micro-climatic systems.For these reasons, there is now considerable academic andindustrial interest in the development of practical grow–cell systems [e.g. Foresight, 2011].
However, challenging research questions remain relatingto their design and operation, including their energy re-quirements, air movement, dehumidification, internal rack-ing design, different ways to deploy artificial lighting,including stationary or moving, and the monitoring of
? This project is supported by the European Regional DevelopmentFund and by the Centre for Global Eco–Innovation, Lancaster Uni-versity, UK. The statistical tools used in the article have been as-sembled as the CAPTAIN Toolbox [Taylor et al., 2007] for Matlab R©(http://www.engineering.lancs.ac.uk/tdc).
crop reaction to all these. Furthermore, numerous researchproblems are concerned with heating agricultural buildingsin general, and for supplying nutrients to plants, hence avast scientific literature exists describing models and con-trollers. Taking the problem of temperature regulation asa key exemplar, one recurring theme is that heat transferhas a complex and spatially heterogeneous nature [e.g.Price et al., 1999]. Typical causes of imperfect mixinginclude multiple flow regions, stagnant zones and short–circuiting to the exhaust outlet. There are broadly twotypes of model describing these dynamics: computationalfluid dynamics and data–based (statistical) models: seeFoucquier et al. [2013] for a recent review.
The desired climatic conditions may differ from zone tozone, hence the ultimate goal is to act on the heatingand ventilation devices in such a way, that the designrequirement for each zone is reached. Agbi et al. [2012],for example, applies data–based methods to multi–zonethermal systems in buildings. The present project alsofocuses on the data–based approach, since it generallyleads to relatively straightforward, dominant mode modelssuitable for control system design.
In this context, past research at Lancaster University hasdeveloped a true digital control approach to control systemdesign. Here, a data–based model identification and pa-rameter estimation stage, is followed by non–minimal statespace control system design and robustness evaluation,using a digital, sampled–data standpoint throughout [seee.g. Taylor et al., 2013, and the references therein]. Theapproach has already been shown to work well for micro–
Preprints of the 19th World CongressThe International Federation of Automatic ControlCape Town, South Africa. August 24-29, 2014
Copyright © 2014 IFAC 4417

Fig. 1. Grow–cell unit.
climate variables within a lumped parameter setting [e.g.Lees et al., 1996, Taylor et al., 2004, Stables and Tay-lor, 2006]. However, the present research aims to utilisemeasurements from neighbouring zones as state variables,an approach that yields nonlinear state–dependent controlalgorithms [Taylor et al., 2011]. Similar methods havebeen recently applied in other discipline areas [Taylor andRobertson, 2013, Taylor and Aerts, 2013].
This article reviews the grow–cell concept (section 2) anddescribes preliminary work in relation to a demonstrationunit deing developed by the authors and collaboratingindustry partner (Fig. 1). The prototype is based on a12m × 2.4m shipping container, with a refrigeration unitand heat exchanger. Multi–layer growing trays under LEDlights are circulated by means of a novel conveyor system.Hence, the article also describes the conveyor control pro-gram and summarises research into LED light selection(section 3). Finally, the thermal modelling approach isbriefly illustrated using experimental data from a labo-ratory scale test chamber (section 4).
2. BACKGROUND
Future food supply and optimization of agriculture wasalready a concern by the early 20th century. Ball [1921],for example, observed that ‘smart’ land manipulation bymerging know–how from various scientific fields wouldcompensate for the rapid increase of population and thelack of remaining lands suitable for cultivation. Withregard to growing plants in controlled environments, anearly citation is Davis and Hoagland [1928]. In more recenttimes, the central idea around future food productionhas not changed but the standards required are muchmore challenging [Foresight, 2011]. In this context, arguedbenefits that arise from developing artificial environmentgrowth facilities include:
• Flexibility to grow crops at any geographical location.With compact facilities, thermally insulated, insu-lated from external lighting, and equipped with aHeating–Ventilation–Air–Conditioning (HVAC) sys-tem that is sized according to the crop type and localclimatic conditions, grow–cells potentially permit anytype of crop growth to take place.
• Effective management of land usage. Within a grow–cell, multiple tier configurations can be realised withrespect to a plant’s potential spatial occupation char-acteristics. Therefore, it is feasible to grow a requiredcrop mass at a much smaller physical scale than wouldbe possible using conventional methods.
• Pricing of end–product and food waste management.Transportation and storage costs, as well as temporalavailability, all contribute to the final price of acrop. Moreover, its freshness and nutritional valueis inevitably changed during transportation. Usinggrow–cells, local production can be encouraged, withreduced transportation related CO2 emissions.
It is clear, however, that to help realise such benefits, thereis a requirement for multidisciplinary research into variousdesign, optimization and control issues. The underlyingchallenges when compared to conventional greenhousesare energy usage and optimised crop production. Bothdepend on a number of factors, including climate controlperformance, correct sizing of the air–conditioning unitdepending on the geographical location, the influcence ofLED light on crop growth and morphology manipulation,insulation of the building envelope, and so on. For instance,if a particular plant species optimal light recipes are de-fined through LED growth trials, it will be possible to ac-celerate and maximize vegetation and flowering processes.In order to investigate some of these issues, the presentauthors and partners have developed a pilot system, asdiscussed below.
3. DESIGN ASPECTS
The grow–cell concept is generally based on a modularsystem, in which multiple units can be aligned and stackedas the facility grows in size. However, the single–unitprototype considered in this article consists of a commer-cially available shipping container, initially using an in–built refrigeration unit for environmental regulation, i.e.with a heat exchanger, and industry standard temperatureand humidity control system. A quarter of the unit hasbeen partitioned off in order to facilitate monitoring, dataacquisition, control equipment and power supplies. Theremaining space is split into two 1.2m × 9m components.One side is the growing space, in which the growing traysare circulated by means of a conveyor. Each layer of theconveyor is fitted with LED grow lights and single pointirrigation. For initial research purposes, the other side isleft empty to allow for easy access.
3.1 Conveyor System
The significance of spatial variability has always been animportant issue for controlled environment growth facili-ties [van Bavel, 1979]. Since the eventual grow–cell productis intended to be fully occupied, there are potential ben-efits in moving the plants around the environment. Thisapproach can partially compensate for the imperfect mix-ing alluded to above. Moreover, since it will be physicallyimpossible for the end–user to walk inside the growingarea of a commerical system, relocation of the plants atspecified time intervals to allow for single point inspectionand/or delivery of plants to the growing area entrance, willbe an essential feature.
19th IFAC World CongressCape Town, South Africa. August 24-29, 2014
4418
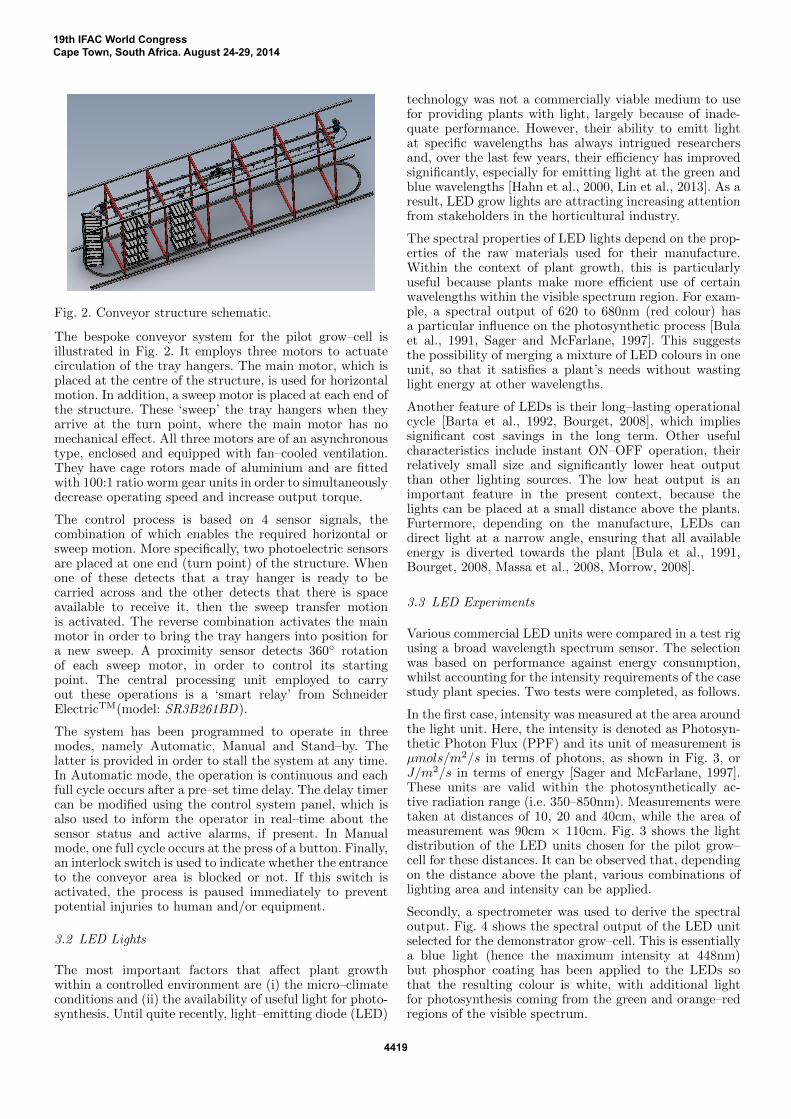
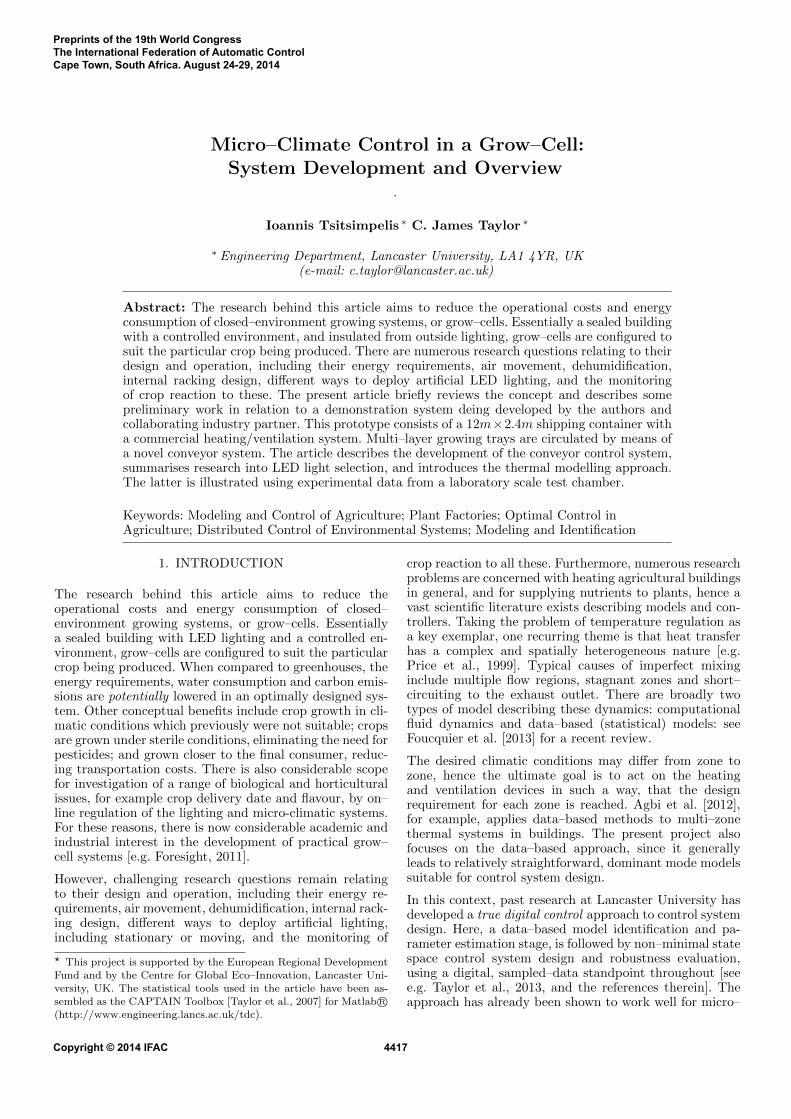
Fig. 2. Conveyor structure schematic.
The bespoke conveyor system for the pilot grow–cell isillustrated in Fig. 2. It employs three motors to actuatecirculation of the tray hangers. The main motor, which isplaced at the centre of the structure, is used for horizontalmotion. In addition, a sweep motor is placed at each end ofthe structure. These ‘sweep’ the tray hangers when theyarrive at the turn point, where the main motor has nomechanical effect. All three motors are of an asynchronoustype, enclosed and equipped with fan–cooled ventilation.They have cage rotors made of aluminium and are fittedwith 100:1 ratio worm gear units in order to simultaneouslydecrease operating speed and increase output torque.
The control process is based on 4 sensor signals, thecombination of which enables the required horizontal orsweep motion. More specifically, two photoelectric sensorsare placed at one end (turn point) of the structure. Whenone of these detects that a tray hanger is ready to becarried across and the other detects that there is spaceavailable to receive it, then the sweep transfer motionis activated. The reverse combination activates the mainmotor in order to bring the tray hangers into position fora new sweep. A proximity sensor detects 360◦ rotationof each sweep motor, in order to control its startingpoint. The central processing unit employed to carryout these operations is a ‘smart relay’ from SchneiderElectricTM(model: SR3B261BD).
The system has been programmed to operate in threemodes, namely Automatic, Manual and Stand–by. Thelatter is provided in order to stall the system at any time.In Automatic mode, the operation is continuous and eachfull cycle occurs after a pre–set time delay. The delay timercan be modified using the control system panel, which isalso used to inform the operator in real–time about thesensor status and active alarms, if present. In Manualmode, one full cycle occurs at the press of a button. Finally,an interlock switch is used to indicate whether the entranceto the conveyor area is blocked or not. If this switch isactivated, the process is paused immediately to preventpotential injuries to human and/or equipment.
3.2 LED Lights
The most important factors that affect plant growthwithin a controlled environment are (i) the micro–climateconditions and (ii) the availability of useful light for photo-synthesis. Until quite recently, light–emitting diode (LED)
technology was not a commercially viable medium to usefor providing plants with light, largely because of inade-quate performance. However, their ability to emitt lightat specific wavelengths has always intrigued researchersand, over the last few years, their efficiency has improvedsignificantly, especially for emitting light at the green andblue wavelengths [Hahn et al., 2000, Lin et al., 2013]. As aresult, LED grow lights are attracting increasing attentionfrom stakeholders in the horticultural industry.
The spectral properties of LED lights depend on the prop-erties of the raw materials used for their manufacture.Within the context of plant growth, this is particularlyuseful because plants make more efficient use of certainwavelengths within the visible spectrum region. For exam-ple, a spectral output of 620 to 680nm (red colour) hasa particular influence on the photosynthetic process [Bulaet al., 1991, Sager and McFarlane, 1997]. This suggeststhe possibility of merging a mixture of LED colours in oneunit, so that it satisfies a plant’s needs without wastinglight energy at other wavelengths.
Another feature of LEDs is their long–lasting operationalcycle [Barta et al., 1992, Bourget, 2008], which impliessignificant cost savings in the long term. Other usefulcharacteristics include instant ON–OFF operation, theirrelatively small size and significantly lower heat outputthan other lighting sources. The low heat output is animportant feature in the present context, because thelights can be placed at a small distance above the plants.Furtermore, depending on the manufacture, LEDs candirect light at a narrow angle, ensuring that all availableenergy is diverted towards the plant [Bula et al., 1991,Bourget, 2008, Massa et al., 2008, Morrow, 2008].
3.3 LED Experiments
Various commercial LED units were compared in a test rigusing a broad wavelength spectrum sensor. The selectionwas based on performance against energy consumption,whilst accounting for the intensity requirements of the casestudy plant species. Two tests were completed, as follows.
In the first case, intensity was measured at the area aroundthe light unit. Here, the intensity is denoted as Photosyn-thetic Photon Flux (PPF) and its unit of measurement isµmols/m2/s in terms of photons, as shown in Fig. 3, orJ/m2/s in terms of energy [Sager and McFarlane, 1997].These units are valid within the photosynthetically ac-tive radiation range (i.e. 350–850nm). Measurements weretaken at distances of 10, 20 and 40cm, while the area ofmeasurement was 90cm × 110cm. Fig. 3 shows the lightdistribution of the LED units chosen for the pilot grow–cell for these distances. It can be observed that, dependingon the distance above the plant, various combinations oflighting area and intensity can be applied.
Secondly, a spectrometer was used to derive the spectraloutput. Fig. 4 shows the spectral output of the LED unitselected for the demonstrator grow–cell. This is essentiallya blue light (hence the maximum intensity at 448nm)but phosphor coating has been applied to the LEDs sothat the resulting colour is white, with additional lightfor photosynthesis coming from the green and orange–redregions of the visible spectrum.
19th IFAC World CongressCape Town, South Africa. August 24-29, 2014
4419

10cm
2 4 6 8 10
2
4
6
8
9*10
cm p
oint
s of
mea
sure
men
t
20cm
2 4 6 8 10
2
4
6
8
11*10cm points of measurement
40cm
2 4 6 8 10
2
4
6
8
50100150200250
0
100
20
40
60
Fig. 3. Light distribution of selected LED unit.
300 400 500 600 700 8000
0.5
1
Wavelength(nm)
Rel
ativ
e In
tens
ity
Fig. 4. Spectral output of selected LED unit.
In total, 220 lights will be utilised in the demonstratorgrow–cell, in order to cover the overall growing area. Thisimmediately indicates a significant amount of power con-sumption. In order to reduce excess energy consumptionand subsequent operational costs, a variable power supplysystem is being developed to drive the lights. Fig. 5 showsthe intensity variation when increasing the output voltagefrom 35 to 48VDC. The measurements were taken at20cm below the center of the light. As shown, very littleincrease is observed between 42VDC and 48VDC (11%).This clearly indicates that excessive power consumptioncan be prevented while still having adequate light quantityfor the plants. For example, if all the lights were to operateat 42VDC at a daily photoperiod of 12 hours, it would bepossible to save 42KWh per day.
Hence, it is possible to save approximately 15W per unitwhen lights operate at 42VDC while still having a lightoutput of 159µmols/m2/s. Extrapolating from this, Fig. 6shows the potential carbon dioxide footprint reduction peryear (CO2 factor: 0.517 Kg CO2/KWh), when all the lightsare used for a 12 hour daily photoperiod. It can be seen,for example, that 8 to 14 tons per year can be removedfrom the total footprint if the lights are operated withinthe range of 39 to 42VDC.
3.4 Temperature/Humidity Monitoring
Within the prototype unit, temperature and humiditydata will be collected using an array of sensors. Morespecifically, 32 portable temperature and humidity loggersare being equally distributed in order to capture the
36 38 40 42 44 46 480
50
100
150
200
PPF
VoltsDC
Fig. 5. Light intensity vs voltage increase.
36 38 40 42 44 46 480
5
10
15
20
Co2
(to
ns)
VoltsDC
Fig. 6. CO2 savings per year vs voltage increase.
gradients within the growing airspace. For the chosenEasylog USB sensors (Lascar Electronics Inc), there is astorage capacity of 16382 readings, with a user selectedsampling rate up to 1 sample per second. However, asampling rate of 5 minutes is selected in order to allow forthe sensors to collect data for the full growth cycle of thecase study plant species. The accuracy of these particularsensors is ±0.3C and ±2% RH. Similar portable sensorshave been used by e.g. Herberger and Ulmer [2012]. Inaddition, temperature and humidity information will becollected from the existing commercial refrigeration unit,and an additional portable sensor will be used to captureambient conditions.
4. EXPERIMENTAL DATA
Whilst the grow–cell test unit is under development, theauthors are investigating data collection issues and ther-mal modelling for two related case studies, one laboratory,the other agricultural:
• Lancaster University forced ventilation test chamber.With widespread application to e.g. animal houses,supermarket freezers and air–conditioning systems,the Lancaster environmental control test facility in-cludes an array of 30 thermocouples and airflowsensors in an enclosed 1m by 1m by 2m airspace.Actuators include two axial fans and a heating sys-tem, with National Instruments data–logging hard-ware/software [Stables and Taylor, 2006].
• Fodder crop farm. Sensors were distributed arounda small building used for growing animal fodder.A commercial HVAC system with inlet ducting atthe ceiling is complemented by underfloor heating,whilst irregation occurs every two hours by means ofspray nozzles. Although the details are beyond thescope of the present article, one purpose was to gainexperience of and to evaluate the above data–loggingand monitoring system for a straightforward practicalexample [Tsitsimpelis, 2013].
19th IFAC World CongressCape Town, South Africa. August 24-29, 2014
4420
With regard to the fodder barn, Fig. 7 compares the HVACinlet and outside temperatures, highlighting the bang–bang nature of the commercial control system. The resultsalso show wide temperature distributions within the build-ing, with some well mixed zones and other stagnant zones,as alluded to above. By contrast, the Lancaster chamberallows for a wide range of planned experiments in orderto either suppress or activate deadzones and other inher-ent nonlinearities in the system e.g. to evaluate differentmodelling approaches.
An illustrative experiment for the Lancaster chamber isshown in Fig. 8. Here, the voltage input associated withthe outlet fan is varied at random times between severalrandomly chosen magnitudes (middle subplot), whilst theheater input follows a standard pseudo–random binarysignal (i.e. on–off). Temperature data were collected ata sampling rate of 60s from 30 locations within the testchamber, as shown in the upper subplot of Fig. 8. A visualinspection of all the responses suggests that it is possibleto derive broadly two zones of relatively similar responses,i.e. a group of 10 thermocouples near the top of thechamber, and the remaining thermocouples representingthe middle and lower part of the chamber. This resultmay suggest that the chamber can be divided into two(relatively) well–mixed ‘conceptual’ zones for the purposesof modelling [Agbi et al., 2012].
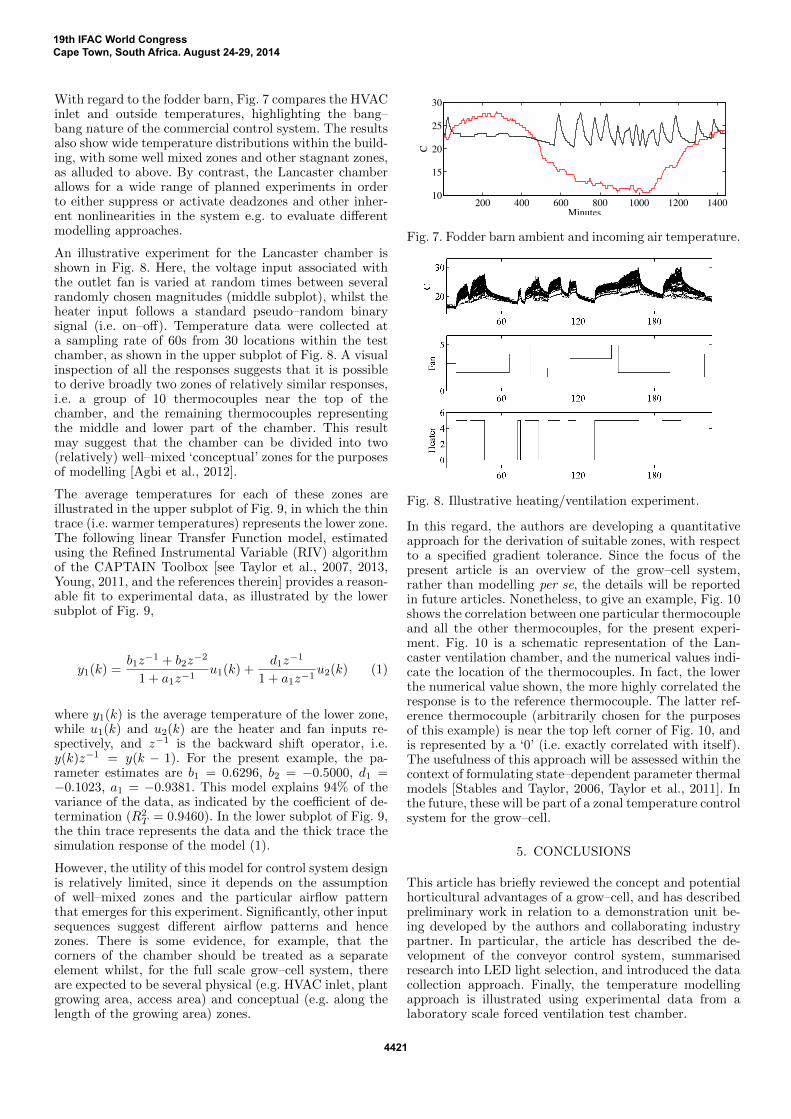
The average temperatures for each of these zones areillustrated in the upper subplot of Fig. 9, in which the thintrace (i.e. warmer temperatures) represents the lower zone.The following linear Transfer Function model, estimatedusing the Refined Instrumental Variable (RIV) algorithmof the CAPTAIN Toolbox [see Taylor et al., 2007, 2013,Young, 2011, and the references therein] provides a reason-able fit to experimental data, as illustrated by the lowersubplot of Fig. 9,
y1(k) =b1z
−1 + b2z−2
1 + a1z−1u1(k) +
d1z−1
1 + a1z−1u2(k) (1)
where y1(k) is the average temperature of the lower zone,while u1(k) and u2(k) are the heater and fan inputs re-spectively, and z−1 is the backward shift operator, i.e.y(k)z−1 = y(k − 1). For the present example, the pa-rameter estimates are b1 = 0.6296, b2 = −0.5000, d1 =−0.1023, a1 = −0.9381. This model explains 94% of thevariance of the data, as indicated by the coefficient of de-termination (R2
T = 0.9460). In the lower subplot of Fig. 9,the thin trace represents the data and the thick trace thesimulation response of the model (1).
However, the utility of this model for control system designis relatively limited, since it depends on the assumptionof well–mixed zones and the particular airflow patternthat emerges for this experiment. Significantly, other inputsequences suggest different airflow patterns and hencezones. There is some evidence, for example, that thecorners of the chamber should be treated as a separateelement whilst, for the full scale grow–cell system, thereare expected to be several physical (e.g. HVAC inlet, plantgrowing area, access area) and conceptual (e.g. along thelength of the growing area) zones.
200 400 600 800 1000 1200 140010
15
20
25
30
Minutes
C
Fig. 7. Fodder barn ambient and incoming air temperature.
Fig. 8. Illustrative heating/ventilation experiment.
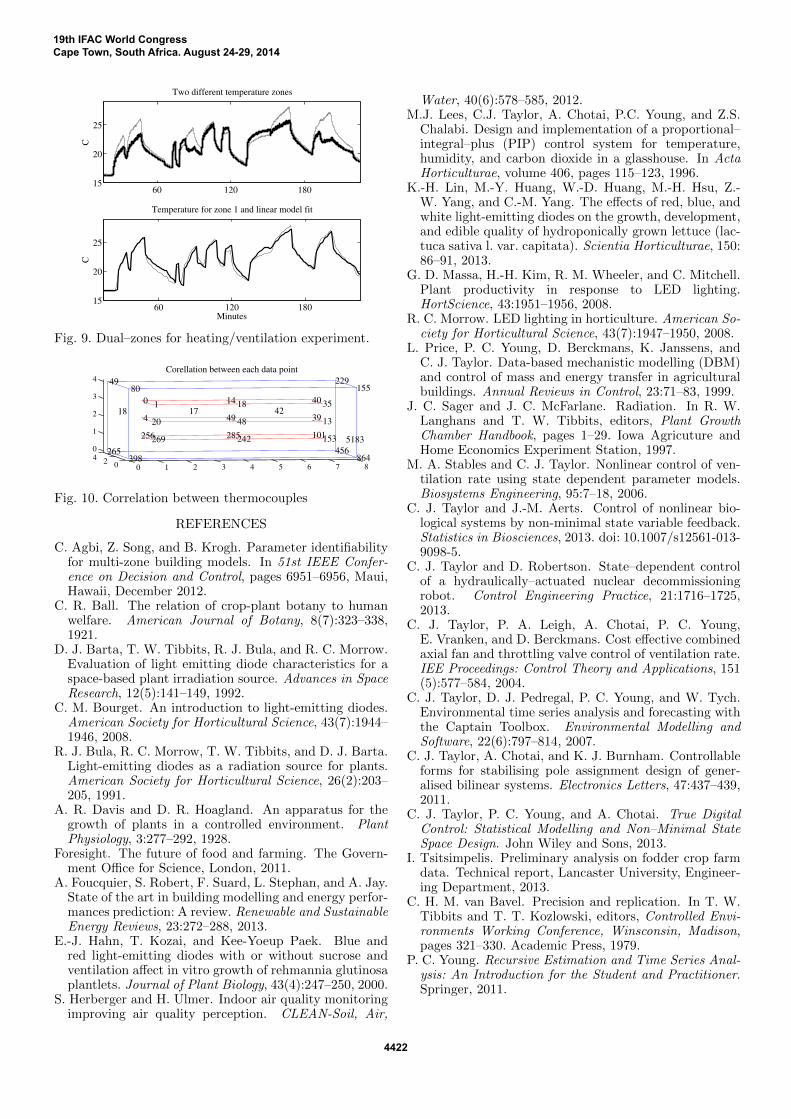
In this regard, the authors are developing a quantitativeapproach for the derivation of suitable zones, with respectto a specified gradient tolerance. Since the focus of thepresent article is an overview of the grow–cell system,rather than modelling per se, the details will be reportedin future articles. Nonetheless, to give an example, Fig. 10shows the correlation between one particular thermocoupleand all the other thermocouples, for the present experi-ment. Fig. 10 is a schematic representation of the Lan-caster ventilation chamber, and the numerical values indi-cate the location of the thermocouples. In fact, the lowerthe numerical value shown, the more highly correlated theresponse is to the reference thermocouple. The latter ref-erence thermocouple (arbitrarily chosen for the purposesof this example) is near the top left corner of Fig. 10, andis represented by a ‘0’ (i.e. exactly correlated with itself).The usefulness of this approach will be assessed within thecontext of formulating state–dependent parameter thermalmodels [Stables and Taylor, 2006, Taylor et al., 2011]. Inthe future, these will be part of a zonal temperature controlsystem for the grow–cell.
5. CONCLUSIONS
This article has briefly reviewed the concept and potentialhorticultural advantages of a grow–cell, and has describedpreliminary work in relation to a demonstration unit be-ing developed by the authors and collaborating industrypartner. In particular, the article has described the de-velopment of the conveyor control system, summarisedresearch into LED light selection, and introduced the datacollection approach. Finally, the temperature modellingapproach is illustrated using experimental data from alaboratory scale forced ventilation test chamber.
19th IFAC World CongressCape Town, South Africa. August 24-29, 2014
4421
60 120 18015
20
25
CTwo different temperature zones
60 120 18015
20
25
C
Minutes
Temperature for zone 1 and linear model fit
Fig. 9. Dual–zones for heating/ventilation experiment.0 1 2 3 4 5 6 7 8024
0
1
2
3
428
30
inlet20
29
27
18
16
14
17
15
1326
12
10
8
Data points Numbering
11
9
725
6
4
2
5
3
122
24
outlet19
21
23
0 1 2 3 4 5 6 7 80240
1
2
3
4155
864
5183456
229
153
13
35
101
39
4042
242
48
18
Corellation between each data point
285
49
1417
269
20
1
256
4
0 80
398
18
49
265
Fig. 10. Correlation between thermocouples
REFERENCES
C. Agbi, Z. Song, and B. Krogh. Parameter identifiabilityfor multi-zone building models. In 51st IEEE Confer-ence on Decision and Control, pages 6951–6956, Maui,Hawaii, December 2012.
C. R. Ball. The relation of crop-plant botany to humanwelfare. American Journal of Botany, 8(7):323–338,1921.
D. J. Barta, T. W. Tibbits, R. J. Bula, and R. C. Morrow.Evaluation of light emitting diode characteristics for aspace-based plant irradiation source. Advances in SpaceResearch, 12(5):141–149, 1992.
C. M. Bourget. An introduction to light-emitting diodes.American Society for Horticultural Science, 43(7):1944–1946, 2008.
R. J. Bula, R. C. Morrow, T. W. Tibbits, and D. J. Barta.Light-emitting diodes as a radiation source for plants.American Society for Horticultural Science, 26(2):203–205, 1991.
A. R. Davis and D. R. Hoagland. An apparatus for thegrowth of plants in a controlled environment. PlantPhysiology, 3:277–292, 1928.
Foresight. The future of food and farming. The Govern-ment Office for Science, London, 2011.
A. Foucquier, S. Robert, F. Suard, L. Stephan, and A. Jay.State of the art in building modelling and energy perfor-mances prediction: A review. Renewable and SustainableEnergy Reviews, 23:272–288, 2013.
E.-J. Hahn, T. Kozai, and Kee-Yoeup Paek. Blue andred light-emitting diodes with or without sucrose andventilation affect in vitro growth of rehmannia glutinosaplantlets. Journal of Plant Biology, 43(4):247–250, 2000.
S. Herberger and H. Ulmer. Indoor air quality monitoringimproving air quality perception. CLEAN-Soil, Air,
Water, 40(6):578–585, 2012.M.J. Lees, C.J. Taylor, A. Chotai, P.C. Young, and Z.S.
Chalabi. Design and implementation of a proportional–integral–plus (PIP) control system for temperature,humidity, and carbon dioxide in a glasshouse. In ActaHorticulturae, volume 406, pages 115–123, 1996.
K.-H. Lin, M.-Y. Huang, W.-D. Huang, M.-H. Hsu, Z.-W. Yang, and C.-M. Yang. The effects of red, blue, andwhite light-emitting diodes on the growth, development,and edible quality of hydroponically grown lettuce (lac-tuca sativa l. var. capitata). Scientia Horticulturae, 150:86–91, 2013.
G. D. Massa, H.-H. Kim, R. M. Wheeler, and C. Mitchell.Plant productivity in response to LED lighting.HortScience, 43:1951–1956, 2008.
R. C. Morrow. LED lighting in horticulture. American So-ciety for Horticultural Science, 43(7):1947–1950, 2008.
L. Price, P. C. Young, D. Berckmans, K. Janssens, andC. J. Taylor. Data-based mechanistic modelling (DBM)and control of mass and energy transfer in agriculturalbuildings. Annual Reviews in Control, 23:71–83, 1999.
J. C. Sager and J. C. McFarlane. Radiation. In R. W.Langhans and T. W. Tibbits, editors, Plant GrowthChamber Handbook, pages 1–29. Iowa Agricuture andHome Economics Experiment Station, 1997.
M. A. Stables and C. J. Taylor. Nonlinear control of ven-tilation rate using state dependent parameter models.Biosystems Engineering, 95:7–18, 2006.
C. J. Taylor and J.-M. Aerts. Control of nonlinear bio-logical systems by non-minimal state variable feedback.Statistics in Biosciences, 2013. doi: 10.1007/s12561-013-9098-5.
C. J. Taylor and D. Robertson. State–dependent controlof a hydraulically–actuated nuclear decommissioningrobot. Control Engineering Practice, 21:1716–1725,2013.
C. J. Taylor, P. A. Leigh, A. Chotai, P. C. Young,E. Vranken, and D. Berckmans. Cost effective combinedaxial fan and throttling valve control of ventilation rate.IEE Proceedings: Control Theory and Applications, 151(5):577–584, 2004.
C. J. Taylor, D. J. Pedregal, P. C. Young, and W. Tych.Environmental time series analysis and forecasting withthe Captain Toolbox. Environmental Modelling andSoftware, 22(6):797–814, 2007.
C. J. Taylor, A. Chotai, and K. J. Burnham. Controllableforms for stabilising pole assignment design of gener-alised bilinear systems. Electronics Letters, 47:437–439,2011.
C. J. Taylor, P. C. Young, and A. Chotai. True DigitalControl: Statistical Modelling and Non–Minimal StateSpace Design. John Wiley and Sons, 2013.
I. Tsitsimpelis. Preliminary analysis on fodder crop farmdata. Technical report, Lancaster University, Engineer-ing Department, 2013.
C. H. M. van Bavel. Precision and replication. In T. W.Tibbits and T. T. Kozlowski, editors, Controlled Envi-ronments Working Conference, Winsconsin, Madison,pages 321–330. Academic Press, 1979.
P. C. Young. Recursive Estimation and Time Series Anal-ysis: An Introduction for the Student and Practitioner.Springer, 2011.
19th IFAC World CongressCape Town, South Africa. August 24-29, 2014
4422