micro-controller based mobile weather monitor system
TRANSCRIPT

American Journal of Embedded Systems and Applications 2018; 6(1): 23-29
http://www.sciencepublishinggroup.com/j/ajesa
doi: 10.11648/j.ajesa.20180601.14
ISSN: 2376-6069 (Print); ISSN: 2376-6085 (Online)
Micro-controller Based Mobile Weather Monitor System
Abubakar Ibrahim Musa1, *
, Sulaiman Muhammad Bashir2
1National Centre for Petroleum Research and Development (Energy Commission of Nigeria), Abubakar Tafawa Balewa University Bauchi,
Nigeria 2Department of Electrical and Electronics Engineering, Abubakatar Tafawa Balewa University, Bauchi, Nigeria
Email address:
*Corresponding author
To cite this article: Abubakar Ibrahim Musa, Sulaiman Muhammad Bashir. Micro-controller Based Mobile Weather Monitor System. American Journal of
Embedded Systems and Applications. Vol. 6, No. 1, 2018, pp. 23-29. doi: 10.11648/j.ajesa.20180601.14
Received: May 1, 2018; Accepted: June 4, 2018; Published: June 15, 2018
Abstract: Stored data and records of weather parameter like temperature, atmospheric pressure, relative humidity, wind
speed measured remotely by using appropriate sensors is important in environmental, weather monitoring and many industrial
processes. A device for weather monitoring through measuring, processing and recording is developed to monitor and display
the atmospheric temperature, atmospheric pressure, relative humidity, solar radiation and wind speed. The aim is to design and
implement mobile weather monitoring system that can be remotely used. The materials that were used including: Anemometer
(wind speed sensor), DHT11 (temperature and relative humidity sensor), MPX5100AP (pressure sensor), LDR (Light
Dependent Resistor) for light intensity 16x2 LCD (Liquid Cristal Display), a microcontroller, and a Memory Card (MMC). At
the end, a weather monitoring system was implemented and it was used to monitor five weather parameters and store in the
memory Card.
Keywords: Weather Monitoring. Sensors, Mobile, Microcontroller, Light Intensity, Atmospheric Temperature,
Atmospheric Pressure, Relative Humidity, Solar Radiation and Wind Speed Memory Card (MMC)
1. Introduction
Weather Monitoring System (WMS) is a device help to
keep track of weather parameters. Before now, people have
been carrying out the same objectives using different devices,
such as satellite, radar until the modern method which is the
application of microcontrollers. The device has units as
microcontroller, Liquid Crystal Display, power source and
parameters from sensors will be processed by microcontroller
display on LCD and store in external memory for future
purposes. Weather monitoring system is having much
usefulness particularly in Communication, Transportation
and Agriculture. In Agriculture for example, weather plays a
major role in determining the success of agricultural pursuits.
Most field crops are dependent solely upon weather to
provide life-sustaining water and energy. Livestock are also
dependent upon weather for their comfort and food supplies.
The connections among weather, climate, and food
production have long been recognized and studied. Over the
last several decades, it has become increasingly clear that
human activities such as fossil- fuel combustion and
deforestation are changing the Earth’s climate (IPCC 2013).
It is likewise clear that these changes have affected and will
continue to affect human society, natural ecosystems, and
managed ecosystems (IPCC 2013). An extensive body of
evidence shows that climate change will continue to have
direct and indirect effects on food production throughout the
next century [2].
Climate and weather have demonstrable effects on food
prices, transportation infrastructure, and the costs and
operations of food distributors, affecting food access and
stability. Food access is strongly influenced by additional
factors outside of the food system, such as household
income. The adaptive capacity of food access to changes in
climate is potentially very high but varies enormously
between high-income and low income countries and
individuals, between urban and rural populations, and the
ways in which each of these develops in the future [1].

24 Abubakar Ibrahim Musa and Sulaiman Muhammad Bashir: Micro-controller Based Mobile Weather Monitor System
The proper knowledge of weather will help us to know the
type of crops that can grow in a particular area at a particular
time. In this 21st century, weather monitoring holds great
importance and have uses in several areas ranging from
keeping track of agricultural field weather conditions to
industrial conditions monitoring. Weather monitoring would
help in keeping track of different climatic behaviours
including atmospheric temperature, atmospheric pressure,
relative humidity, wind speed, and wind direction, light
intensity, rain gauge and many more. The art of weather
monitoring and weather forecasting began with early
civilizations using reoccurring astronomical and
meteorological events to help them monitor seasonal changes
in the weather. Around 650 B.C., the Babylonians tried to
predict short-term weather changes based on the appearance
of clouds and optical phenomena such as haloes. By 300
B.C., Chinese astronomers had developed a calendar that
divided the year into 24 festivals, each festival associated
with a different type of weather [15].
Around 340 B.C., the Greek philosopher Aristotle wrote a
book titled “Meteorological”, a philosophical treatise that
included theories about the formation of rain, clouds, hail,
wind, thunder, lightning, and hurricanes. In addition, topics
such as astronomy, geography, and chemistry were also
addressed. Aristotle made some remarkably acute
observations concerning the weather, along with some
significant errors, and his four-volume text was considered
by many to be the authority on weather theory for almost
2000 years. Although many of Aristotle’s claims were
erroneous, it was not until about the 17th century that many
of his ideas were overthrown [16]
Throughout the centuries, attempts have been made to
produce forecasts based on weather lore and personal
observations. However, by the end of the Renaissance, it had
become increasingly evident that the speculations of the
natural philosophers were inadequate and that greater
knowledge was necessary to further our understanding of the
atmosphere. In order to do this, instruments were needed to
measure the properties of the atmosphere, such as moisture,
temperature, and pressure. The first known design in western
civilization is hygrometer, an instrument to measure the
humidity of air, was described by Nicholas Cusa (German) in
the mid-fifteenth century. Galileo Galilei (Italian) invented an
early thermometer in 1592 or shortly thereafter; and
Evangelista Torricelli (Italian) invented the barometer for
measuring atmospheric pressure in 1643 [17]
2. Literature Review
A lot of research works were conducted in the areas of
weather monitoring over the past decades. Some of the
research works are hereby reviewed, taking into
consideration their major components used, their sizes and
their costs. Various researchers used different transceivers
in transmitting parameters from transmitting unit to
receiving unit. Among them are those that used RF module,
Bluetooth, Short Message Service (SMS) and ZigBee
Technology.
Edgar et al. worked on portable weather system for
measuring and monitoring temperature, relative humidity and
pressure based on Bluetooth communication. The system was
divided into subsystems; main control, weather measure
control and Bluetooth control. Main control is responsible for
initializing and prioritizing of processor tasks. Weather
control is responsible for calibrating and controlling the
sensor in the system. It also computes the relative humidity,
average temperature, pressure and altitude. Bluetooth control
is responsible for calibrating and handling Bluetooth
communication. It looks for Bluetooth devices in its vicinity
to establish communication and data transfer [3].
Nhivekar and Mudholker developed data logger and
remote monitoring system for multiple parameter
measurement applications. They used ATMEGA32
microcontrollers with two physical parameter sensors (LM
35 and module SY – HS 220, temperature and relative
humidity sensor respectively). LCD 16 by 2 to display the
received data by the microcontroller, multi media memory
card (MMC) give non volatile storage for the system, then
TTL to RS 232 converter to interface the microcontroller to
mobile phone and personal computer with the help of
graphical user interface (GUI) software. [4]
Iswanto et al worked on Weather Monitoring System with
remote radio frequency wireless communication. They used
speed sensor opto-coupler for wind sensor, LM35 for
temperature sensor, LDR for light intensity, LCD, ATmega16
as microcontroller and RS232 (serial level converter) as well
as Rf-1020U as transmitter and receiver. Their aim was to
design and construct a system that will measure temperature,
wind speed and light intensity but their major challenge is the
distance it can cover. [5]
Nandar et al. implemented a microcontroller based
wireless weather station, aimed at developing simple,
inexpensive and reliable wireless weather station. They used
MPX4115A as pressure sensor, DHT11 as temperature and
relative humidity sensor and potentiometer as wind direction
sensor, LCD, RF module and PIC18F452 as microcontroller
[6].
Neha et al developed a wireless weather monitoring
system using global system for mobile-communication
(GSM). The system was divided into two parts: Transmitter
and Receiver’s part. The transmitter unit consists of weather
sensors, microcontroller, and GSM while the receiver’s unit
consists of a personal computer (PC) interfaced with GSM
through PC serial port. The data from the sensors are
collected by the microcontroller and transmit to the receiver’s
section through wireless medium. These parameters are
viewed at the PC using graphical user interface (GUI)
programme in the receiver’s side [7].
Jemilehin and Obiyemi also worked on weather
monitoring by developing a mobile based online weather
monitoring system with disaster alert. The system can be
used to remotely monitor weather variation for proper
management of climate related disaster through the use of
early warning system. They harnesses the wide network

American Journal of Embedded Systems and Applications 2018; 6(1): 23-29 25
capability of the internet to stream weather information from
weather station to a remote online server via a GSM modem,
where the information is harvested by the mobile phone
applications assigned for it. The setup was divided into three
sections: the Node, the Storage/Server, and the mobile
application [8].
Setu et al, make use of ZigBee technology to develop
weather monitoring system. In their work, they divided the
system into two sections; transmitter and receiver section.
The transmitter section consists of weather sensors,
microcontroller and ZigBee/transmitter while the receiver
section consists of ZigBee interfaced with personal computer
through PC serial port. The system monitors temperature
wind speed, and humidity, the data from the sensors are
collected by the microcontroller and transmitted to the
receiver section through wireless medium. The transmitted
data will be received at the receiver section and displayed on
the PC using program in the receiver side [9].
Shailaja and Manchiryal proposed weather monitoring
system in Hazardous zones survey. The fundamental point of
this proposed framework is to plan a remote climate station
which will monitor climate parameters despite the hazardous
conditions using ZigBee innovation and send the data to that
concern using GSM, SMS strategy [10].
Kirankumar in his work developed a low-cost wireless
weather monitoring system using ZigBee wireless module
and the parameters measured are temperature, humidity and
light intensity. His argument was that the node of wireless
sensors network are just two; ZigBee and Bluetooth and on
extensive study of the two, ZigBee technology is more
reliable for both indoor and outdoor sensors network. He
divided the system into two parts: transmitting and receiving
part. The major components at the transmitter part are the
microcontroller (AT 89C52) ZigBee/Transceiver while the
major component at the receiver part are ZigBee/Transceiver,
Max 232, and personal computer [11]
Nisha et al also worked on this field using the same
technology titled ZigBee based weather monitoring system.
The system consists of transmitting as well as receiving
section. Transmitting section consists of sensors
(temperature, humidity, rain-gauge, wind direction and sun
intensity), Micro controller (ARM LPC2148), LCD 16 by 2
and Max 232. The receiver’s section consists of
ZigBee/Receiver and the personal computers, so the data
received can be monitored on PC [12].
Kalyani and Snehlata also used the same technology. They
titled their work as a survey on weather monitoring system in
agriculture zone using ZigBee. They developed a wireless
sensor network based on ZigBee/IEEE802.15.4 standard that
can be used to check and monitor the weather parameters
through wireless sensors devices during some weather hazard
and make the data known to farmers using GSM/SMS
techniques. The weather parameters that were measured are
temperature, humidity, and wind speed and wind direction
[13].
Tanmay et al. developed a weather monitoring system
using Wi-Fi. They used readily available sensors for
temperature, pressure and humidity measurement whereas
wind-speed, wind direction and rainfall were measured
using rotary encoder, opto-coupler, tipping bucket
technique respectively. The measured data were processed
using microcontroller-based system and made available
wirelessly on the server for storage and access continuously
[14].
3. Method
For the design and development of the system, the
methodology used involves the software, and hardware
implementation. The actual implementation of the system
involves the following steps:
(i). System Definition: Broad definition of system
hardware including microcontroller, and its interface
with display, Anemometer (wind speed sensor),
DHT11 (temperature and relative humidity sensor),
MPX5100AP (pressure sensor), LDR (Light
Dependent Resistor) for light intensity 16x2 LCD
(Liquid Cristal Display), MMC Memory/Storage, etc.
(ii). Circuit Design: Selection of ATMEGA328
microcontroller and other interfacing devices as per
system definition. Design of hardware circuit and its
testing on laboratory kits with some simple
microcontroller software routine;
(iii). Generation of schematic diagrams;
(iv). Hardware Modifications: Making any hardware
changes found necessary after the initial hardware
test, to produce a revised circuit board schematic
diagram and layout;
(v). Software Design: Developing algorithm for the
system.
(vi). Integration and Final Testing: Integrating the entire
hardware and software modules and its final testing
for data logging operation.
The complete design is divided into two parts: Hardware
Implementation and Software implementation. The system
overview includes the power supply, input components,
controller, as well as output components.
At modular level of this project implementation the
microcontroller processes input data from the various
measuring devices, stored it and displayed it on the LCD.
External memory was connected to the microcontroller for
sufficient storage space, so that the received data can be
stored after been processed.
GSM module connected to the microcontroller received
command signals for transmitting the weather variables been
measured to remote location(s) via the internet. Furthermore,
provision was made such that personal computer (PC) can be
interfaced with the microcontroller to display the received
data.

26 Abubakar Ibrahim Musa and Sulaiman Muhammad Bashir: Micro-controller Based Mobile Weather Monitor System
Figure 1. Different capacity of memory card.
Figure 2. Anemometer (wind speed sensor).
Figure 3. System Block Diagram.
The control unit algorithm is as follows;
(i). Start the microcontroller.
(ii). Configuration and initialization of port i.e. set port
direction (input/output pin).
(iii). Display the start-up message on the LCD i.e. name,
num. title etc
(iv). Get the sensors value.
(v). Convert sensors value from analog to digital
(vi). Check sampling time for saving
(vii). If yes Display the sensors value on LCD, save data
on Memory Card, go back to 4, read sensors
(viii). If no display sensors value on LCD, go back to read
sensors
(ix). End
Figure 4. System flowchart.
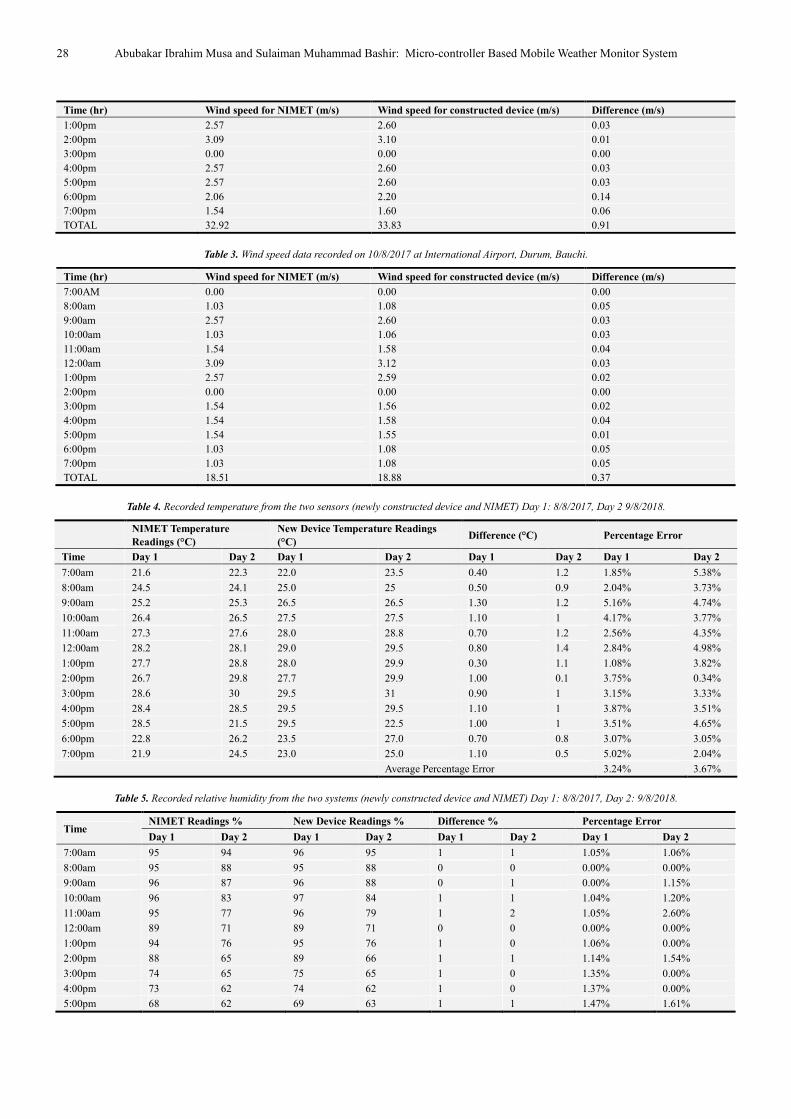
4. Result and Discussion
The constructed device was tested by mounting it for a
period of one month alongside the standard existing system
at two different locations; Abubakar Tafawa Balewa
University Bauchi and NIMET at international airport
Durum, Bauchi. Sample of the recorded parameters have
been summarized as shown in the following tables. For each
of the tables, percentage error in measurement were
evaluated. As a result of that, the low percentage error
obtained served as strong indicator of high accuracy of the
newly constructed device.

American Journal of Embedded Systems and Applications 2018; 6(1): 23-29 27
Figure 5. Model Circuit Diagram.
Table 1. Wind speed data recorded on 9/8/2017 at International Airport, Durum, Bauchi.
Time (hrs) NIMET value (m/s) Constructed device (m/s) Difference (m/s)
7:00am 2.75 2.60 0.03
8:00am 1.54 1.60 0.06
9:00am 2.06 2.10 0.04
10:00am 2.06 2.10 0.04
11:00am 3.09 3.10 0.01
12:00am 2.06 2.10 0.04
1:00pm 0.00 0.00 0.00
2:00pm 0.00 0.00 0.00
3:00pm 3.60 3.65 0.05
4:00pm 1.54 1.54 0.00
5:00pm 1.54 1.55 0.01
6:00pm 2.06 2.10 0.04
7:00pm 1.54 1.60 0.06
TOTAL 23.66m/s 24.04m/s 0.38m/s
Table 2. Wind speed data recorded on 9/8/2017 at International Airport, Durum, Bauchi.
Time (hr) Wind speed for NIMET (m/s) Wind speed for constructed device (m/s) Difference (m/s)
7:00am 2.57 2.67 0.10
8:00am 4.12 4.20 0.08
9:00am 3.60 3.70 0.10
10:00am 3.60 3.70 0.10
11:00am 2.57 2.70 0.13
12:00am 2.06 2.16 0.10
PB0/ICP1/CLKO/PCINT014
PB1/OC1A/PCINT115
PB3/MOSI/OC2A/PCINT317
PB2/SS/OC1B/PCINT216
PD6/AIN0/OC0A/PCINT2212
PD5/T1/OC0B/PCINT2111
PD4/T0/XCK/PCINT206
PD3/INT1/OC2B/PCINT195
PD2/INT0/PCINT184
PD1/TXD/PCINT173
PD0/RXD/PCINT162
PB4/MISO/PCINT418
PB5/SCK/PCINT519
PB7/TOSC2/XTAL2/PCINT710
PB6/TOSC1/XTAL1/PCINT69
PC6/RESET/PCINT141
PC5/ADC5/SCL/PCINT1328
PC4/ADC4/SDA/PCINT1227
PC3/ADC3/PCINT1126
PC2/ADC2/PCINT1025
PC1/ADC1/PCINT924
PC0/ADC0/PCINT823
AVCC20
AREF21
PD7/AIN1/PCINT2313
U1
ATMEGA328P
C1
22pF
C2
22pFX1CRYSTAL
R1
10k
D3LED-GREEN
VI1
VO3
GN
D2
U27805
R5100r
C82200u
RV2
10k
B112V
D7
14
D6
13
D5
12
D4
11
D3
10
D2
9D
18
D0
7
E6
RW
5R
S4
VS
S1
VD
D2
VE
E3
LCD1LM016L
SW1
SW-SPST
MMC Card
CS
DI
DO
CLK
80
27
%RH
>
°C
DATA2
VDD1
GND4
U3
DHT11
1.0 LDR1LDR
R2220R
Q3BC547
R910k
R10
10k
R1147K
AK
D6PHOTODIODE
D7LED
R121K
BAT13V
X2CRYSTAL
VBAT3
X11
X22
SCL6
SDA5
SOUT7
U4
DS1307
R3
10k
R4
10k
28 Abubakar Ibrahim Musa and Sulaiman Muhammad Bashir: Micro-controller Based Mobile Weather Monitor System
Time (hr) Wind speed for NIMET (m/s) Wind speed for constructed device (m/s) Difference (m/s)
1:00pm 2.57 2.60 0.03
2:00pm 3.09 3.10 0.01
3:00pm 0.00 0.00 0.00
4:00pm 2.57 2.60 0.03
5:00pm 2.57 2.60 0.03
6:00pm 2.06 2.20 0.14
7:00pm 1.54 1.60 0.06
TOTAL 32.92 33.83 0.91
Table 3. Wind speed data recorded on 10/8/2017 at International Airport, Durum, Bauchi.
Time (hr) Wind speed for NIMET (m/s) Wind speed for constructed device (m/s) Difference (m/s)
7:00AM 0.00 0.00 0.00
8:00am 1.03 1.08 0.05
9:00am 2.57 2.60 0.03
10:00am 1.03 1.06 0.03
11:00am 1.54 1.58 0.04
12:00am 3.09 3.12 0.03
1:00pm 2.57 2.59 0.02
2:00pm 0.00 0.00 0.00
3:00pm 1.54 1.56 0.02
4:00pm 1.54 1.58 0.04
5:00pm 1.54 1.55 0.01
6:00pm 1.03 1.08 0.05
7:00pm 1.03 1.08 0.05
TOTAL 18.51 18.88 0.37
Table 4. Recorded temperature from the two sensors (newly constructed device and NIMET) Day 1: 8/8/2017, Day 2 9/8/2018.
NIMET Temperature
Readings (°C)
New Device Temperature Readings
(°C) Difference (°C) Percentage Error
Time Day 1 Day 2 Day 1 Day 2 Day 1 Day 2 Day 1 Day 2
7:00am 21.6 22.3 22.0 23.5 0.40 1.2 1.85% 5.38%
8:00am 24.5 24.1 25.0 25 0.50 0.9 2.04% 3.73%
9:00am 25.2 25.3 26.5 26.5 1.30 1.2 5.16% 4.74%
10:00am 26.4 26.5 27.5 27.5 1.10 1 4.17% 3.77%
11:00am 27.3 27.6 28.0 28.8 0.70 1.2 2.56% 4.35%
12:00am 28.2 28.1 29.0 29.5 0.80 1.4 2.84% 4.98%
1:00pm 27.7 28.8 28.0 29.9 0.30 1.1 1.08% 3.82%
2:00pm 26.7 29.8 27.7 29.9 1.00 0.1 3.75% 0.34%
3:00pm 28.6 30 29.5 31 0.90 1 3.15% 3.33%
4:00pm 28.4 28.5 29.5 29.5 1.10 1 3.87% 3.51%
5:00pm 28.5 21.5 29.5 22.5 1.00 1 3.51% 4.65%
6:00pm 22.8 26.2 23.5 27.0 0.70 0.8 3.07% 3.05%
7:00pm 21.9 24.5 23.0 25.0 1.10 0.5 5.02% 2.04%
Average Percentage Error 3.24% 3.67%
Table 5. Recorded relative humidity from the two systems (newly constructed device and NIMET) Day 1: 8/8/2017, Day 2: 9/8/2018.
Time NIMET Readings % New Device Readings % Difference % Percentage Error
Day 1 Day 2 Day 1 Day 2 Day 1 Day 2 Day 1 Day 2
7:00am 95 94 96 95 1 1 1.05% 1.06%
8:00am 95 88 95 88 0 0 0.00% 0.00%
9:00am 96 87 96 88 0 1 0.00% 1.15%
10:00am 96 83 97 84 1 1 1.04% 1.20%
11:00am 95 77 96 79 1 2 1.05% 2.60%
12:00am 89 71 89 71 0 0 0.00% 0.00%
1:00pm 94 76 95 76 1 0 1.06% 0.00%
2:00pm 88 65 89 66 1 1 1.14% 1.54%
3:00pm 74 65 75 65 1 0 1.35% 0.00%
4:00pm 73 62 74 62 1 0 1.37% 0.00%
5:00pm 68 62 69 63 1 1 1.47% 1.61%
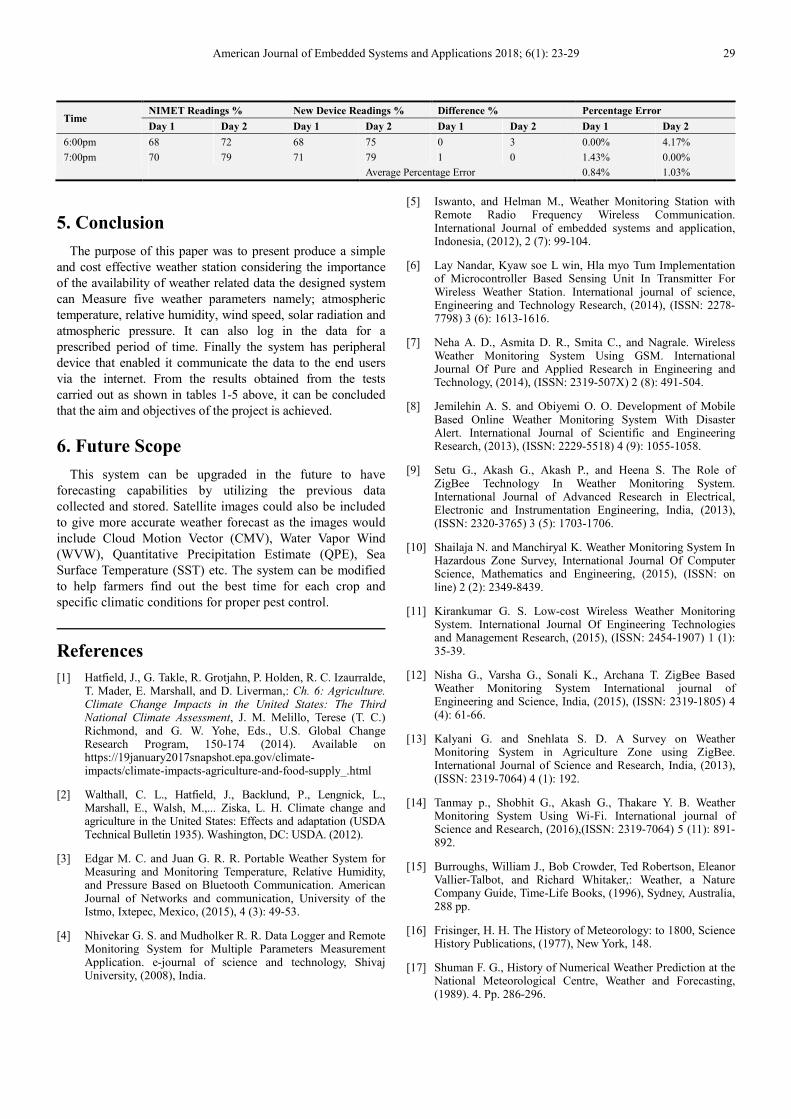
American Journal of Embedded Systems and Applications 2018; 6(1): 23-29 29
Time NIMET Readings % New Device Readings % Difference % Percentage Error
Day 1 Day 2 Day 1 Day 2 Day 1 Day 2 Day 1 Day 2
6:00pm 68 72 68 75 0 3 0.00% 4.17%
7:00pm 70 79 71 79 1 0 1.43% 0.00%
Average Percentage Error 0.84% 1.03%
5. Conclusion
The purpose of this paper was to present produce a simple
and cost effective weather station considering the importance
of the availability of weather related data the designed system
can Measure five weather parameters namely; atmospheric
temperature, relative humidity, wind speed, solar radiation and
atmospheric pressure. It can also log in the data for a
prescribed period of time. Finally the system has peripheral
device that enabled it communicate the data to the end users
via the internet. From the results obtained from the tests
carried out as shown in tables 1-5 above, it can be concluded
that the aim and objectives of the project is achieved.
6. Future Scope
This system can be upgraded in the future to have
forecasting capabilities by utilizing the previous data
collected and stored. Satellite images could also be included
to give more accurate weather forecast as the images would
include Cloud Motion Vector (CMV), Water Vapor Wind
(WVW), Quantitative Precipitation Estimate (QPE), Sea
Surface Temperature (SST) etc. The system can be modified
to help farmers find out the best time for each crop and
specific climatic conditions for proper pest control.
References
[1] Hatfield, J., G. Takle, R. Grotjahn, P. Holden, R. C. Izaurralde, T. Mader, E. Marshall, and D. Liverman,: Ch. 6: Agriculture. Climate Change Impacts in the United States: The Third National Climate Assessment, J. M. Melillo, Terese (T. C.) Richmond, and G. W. Yohe, Eds., U.S. Global Change Research Program, 150-174 (2014). Available on https://19january2017snapshot.epa.gov/climate-impacts/climate-impacts-agriculture-and-food-supply_.html
[2] Walthall, C. L., Hatfield, J., Backlund, P., Lengnick, L., Marshall, E., Walsh, M.,... Ziska, L. H. Climate change and agriculture in the United States: Effects and adaptation (USDA Technical Bulletin 1935). Washington, DC: USDA. (2012).
[3] Edgar M. C. and Juan G. R. R. Portable Weather System for Measuring and Monitoring Temperature, Relative Humidity, and Pressure Based on Bluetooth Communication. American Journal of Networks and communication, University of the Istmo, Ixtepec, Mexico, (2015), 4 (3): 49-53.
[4] Nhivekar G. S. and Mudholker R. R. Data Logger and Remote Monitoring System for Multiple Parameters Measurement Application. e-journal of science and technology, Shivaj University, (2008), India.
[5] Iswanto, and Helman M., Weather Monitoring Station with Remote Radio Frequency Wireless Communication. International Journal of embedded systems and application, Indonesia, (2012), 2 (7): 99-104.
[6] Lay Nandar, Kyaw soe L win, Hla myo Tum Implementation of Microcontroller Based Sensing Unit In Transmitter For Wireless Weather Station. International journal of science, Engineering and Technology Research, (2014), (ISSN: 2278-7798) 3 (6): 1613-1616.
[7] Neha A. D., Asmita D. R., Smita C., and Nagrale. Wireless Weather Monitoring System Using GSM. International Journal Of Pure and Applied Research in Engineering and Technology, (2014), (ISSN: 2319-507X) 2 (8): 491-504.
[8] Jemilehin A. S. and Obiyemi O. O. Development of Mobile Based Online Weather Monitoring System With Disaster Alert. International Journal of Scientific and Engineering Research, (2013), (ISSN: 2229-5518) 4 (9): 1055-1058.
[9] Setu G., Akash G., Akash P., and Heena S. The Role of ZigBee Technology In Weather Monitoring System. International Journal of Advanced Research in Electrical, Electronic and Instrumentation Engineering, India, (2013), (ISSN: 2320-3765) 3 (5): 1703-1706.
[10] Shailaja N. and Manchiryal K. Weather Monitoring System In Hazardous Zone Survey, International Journal Of Computer Science, Mathematics and Engineering, (2015), (ISSN: on line) 2 (2): 2349-8439.
[11] Kirankumar G. S. Low-cost Wireless Weather Monitoring System. International Journal Of Engineering Technologies and Management Research, (2015), (ISSN: 2454-1907) 1 (1): 35-39.
[12] Nisha G., Varsha G., Sonali K., Archana T. ZigBee Based Weather Monitoring System International journal of Engineering and Science, India, (2015), (ISSN: 2319-1805) 4 (4): 61-66.
[13] Kalyani G. and Snehlata S. D. A Survey on Weather Monitoring System in Agriculture Zone using ZigBee. International Journal of Science and Research, India, (2013), (ISSN: 2319-7064) 4 (1): 192.
[14] Tanmay p., Shobhit G., Akash G., Thakare Y. B. Weather Monitoring System Using Wi-Fi. International journal of Science and Research, (2016),(ISSN: 2319-7064) 5 (11): 891-892.
[15] Burroughs, William J., Bob Crowder, Ted Robertson, Eleanor Vallier-Talbot, and Richard Whitaker,: Weather, a Nature Company Guide, Time-Life Books, (1996), Sydney, Australia, 288 pp.
[16] Frisinger, H. H. The History of Meteorology: to 1800, Science History Publications, (1977), New York, 148.
[17] Shuman F. G., History of Numerical Weather Prediction at the National Meteorological Centre, Weather and Forecasting, (1989). 4. Pp. 286-296.