microbial analysis of soil and water samples from koel...
TRANSCRIPT

Microbial Analysis of Soil and Water Samples from
Koel River in Rourkela, Odisha
PROJECT SUBMITTED IN PARTIAL FULFILLMENT OF THE REQUIREMENT OF
MASTER OF SCIENCE IN LIFE SCIENCE
By
PRIYA MONALISHA BURH
Roll No – 409LS2035
Under the guidance of
Dr. BISMITA NAYAK
DEPARTMENT OF LIFE SCIENCE
NATIONAL INSTITUTE OF TECHNOLOGY
ROURKELA -769008, ODISHA

DEPARTMENT OF LIFE SCIENCE
NATIONAL INSTITUTE OF TECHNOLOGY,
ROURKELA-769008
...............................................................................................................................
Dr. (Miss) Bismita Nayak, M.Sc., Ph.D., Ref. No.
Assistant Professor. Date: ............................
CERTIFICATE
This is to certify that the thesis entitled “Microbial analysis of
Soil and Water samples from Koel River in Rourkela, Odisha”
submitted to National Institute of Technology, Rourkela for the
partial fulfillment of the Master degree in Life science is a faithful
record of bonafide and original research work carried out by Priya
Monalisha Burh under my supervision and guidance.
Dr. (Miss) Bismita Nayak
Advisor
.................................................................................................................
Phone no.: 0661-2462682 Email: [email protected]

DECLARATION
I, Miss. Priya Monalisha Burh, M. Sc. Life Science, 4th
semester, Department of Life Science,
NIT, Rourkela declare that my project work titled ― Microbial Analysis of Soil and Water
Samples from Koel River in Rourkela, Odisha” is original and no part of this work report has
been submitted for any other degree or diploma. All the given information and works are true to
my sense and knowledge.
(Miss. Priya Monalisha Burh)
Date:
Place:
ACKNOWLEDGEMENT
This project is by far the most significant accomplishment in my life and it would have
been impossible without people who supported me and believed in my caliber.
I would like to extend my gratitude and sincere thanks to my honorable supervisor Dr.
Bismita Nayak, Assistant Professor, Department of Life Science. She is not only a great teacher
with deep vision but also most importantly a kind person. I sincerely thank for her exemplary
guidance and encouragement. Her trust and support inspired me in the most important moments of
making right decisions and I am glad to work under her supervision.
I express my sincere thanks to our Head of the Department, Dr S.K Patra; I owe my
sincere gratitude & thankfulness to Dr. Surajit Das and Dr. Sujit Kumar Bhutia, faculty of
Department of Life Science, NIT Rourkela for showing sustained interest and providing help
throughout the period of my work.
I express my heartfelt thanks to PhD scholars, especially Pradipta Ranjan Rout for his
active cooperation and sincere help.
I am genuinely appreciative of all my batch mates for their suggestions and moral support
during my work.
Last, but not the least, I would like to thank the Almighty GOD and my parents, whose
dedicated and untiring efforts towards me has brought me at this stage of my life.
Priya Monalisha Burh
409LS2045

Miss. Priya Monalisha Burh Roll no. 409ls2045
4th Semester, M. Sc. Life science
N.I.T Rourkela

TABLE OF CONTENTS
Sl.no Content Page no
1. Introduction 1-5
2. Review of literature
2.1 Sediment characteristics
2.2 Characteristics of soil
2.3 Bacterial enumeration
2.4 Phytoplankton analysis
6-14
6-7
8-11
11-12
12-14
3. Objective 15
4. Materials and methods
4.1 Collection of sample
4.2 Physiochemical analysis
4.3 Analysis of Sedimentary Texture
4.4 Total count of Bacteria
4.5 Biochemical Analysis
4.6 Identification of phytoplankton
16-35
16
17
17-18
18-20
20-34
34-35
5. Results and Discussions 36-52
6. Conclusion 53

7. References 54-56
LIST OF SYMBOLS AND ABREVIATIONS USED
-
+
%
°
µl
C
CFU
gm
hr
ISSS
l
LB
Min
ml
NA
No.
ppm
TNTC
USDA
Negative
Positive
Percentage
Degree
Microlitre
Centigrade
Colony Forming Unit
Gram
Hour
International Soil Science Society
Litre
Luria Bertani
minute
milli litre
Nutrient Agar
Number
Parts per million
Too numerous to count
United State Department of Agriculture

LIST OF TABLES
Table no Title page no
1 Size limits of USDA and ISSS Scheme 7
2 Size limits of sediment particle size of detrial particles 7
3 Size of soil particles in mm 17
4 Result interpretation chart for HI Carbohydrate Kit 25
5 Result interpretation chart for Hilmvic Biochemical test kit 27
6 Result interpretation chart for HI ASSORTED Biochemical test kit 29
7 pH of water from three different sites 36
8 Texture of soil for site-I 37
9 Texture of soil for site-II 38
10 Bacterial count for water sample 39
11 Bacterial count for soil sample 39-40
12 Biochemical test result for K1,K2,K3 isolates(part-A) 43-44
13 Biochemical test result for K1,K2,K3 isolates(part-B) 44
14 Name of organism and their abundance 48

LIST OF FIGURES
Fig no Title Page
no
1 Site map of Koel River 1
2 Pie chart showing percentage of water on earth 4
3
a)
b)
c)
d)
e)
Different types of soil
Sandy soil
Clay soil
Loamy soil
Peaty sol
Chalky soil
10-11
10
10
11
11
11
4
Koel river 16
5 Trigon plot 18
6 Trigon plot for site-I 37
7 Trigon plot for site-II
38
8 Isolation of pure culture by streak plate method
40-41
9 Biochemical test kit result 42-43
10 Stained picture of Staphylococcus 45
11 Staphylococcus colony 47
12 Collection of phytoplankton 47
13 Phytoplankton net 47
14 Collected phytoplankton 48
15 Spirogyra 49

16 Oscillatoria 50
17 Nostoc 51
18 Scenedesmus dimorphs 52

ABSTRACT
Koel River from its early existence plays a significant role in molding the physical, economic
and social development of Rourkela. It is acknowledged as one of the important elements in
environmental aspect for its crucial function as water resources. As this project entitled
―Microbial analysis of Soil and Water samples from Koel River in Rourkela, Odisha‖ deals with
the water and soil quality of Koel River, the water and soil quality here were found out to be
less polluted. The texture of the soil was analyzed to be clayey type which is appropriate for
irrigation. The microorganisms isolated from the soil were of staphylococcus strain and were
gram positive, aerobic, coccus shaped bacteria. The phytoplankton species identified from this
river were Spirogyra, Oscillatoria ,Chromolina ovalis, Tetrapedia gothica, Diatoms,
Scendusmus dimorphus, Chrysococcus cornuta, Penium sylvanigra of which Spirogyra and
Oscillatoria were dominant, followed by diatoms, scendusmus dimorphus as sub dominant and
the rest two, i.e., Chrysococcus cornuta, Penium sylvanigra come under rare species. This
project aims to find out the water and soil quality of Koel River and as it is flowing through an
industrial area, to find out if it is getting affected by the Industrial pollutants.

1. INTRODUCTION
Koel River originates from the Palamu Tiger Reserve and flows in the western portion of
Palamu. The river splits into two-the North Koel River and the South Koel River. South Koel
River runs across Jharkhand and Odisha states in India. The south Koel originates on the Ranchi
plateau a few miles east of Ranchi. It enters Odisha and joins Sankh River at Vedveyas near
Rourkela from where it is named Brahmani.
Classification of rivers:
Rivers can generally be classified as either alluvial, bedrock, or some mix of the two.
Alluvial rivers:
Have channels and floodplains that are self-formed in unconsolidated or weakly
consolidated sediments. They erode their banks and deposit material on bars and
their floodplains.
Fig1: Site map of Koel River
Bedrock Rivers
Form when the river down cuts through the modern sediments and into the underlying
bedrock. This occurs in regions that have experienced some kind of uplift (thereby steepening
river gradients) or in which a particular hard litho logy causes a river to have a steepened reach
that has not been covered in modern alluvium. Bedrock Rivers very often contain alluvium on
their beds; this material is important in eroding and sculpting the channel. Rivers that go through
patches of bedrock and patches of deep alluvial cover are classified as mixed bedrock-alluvial.
Classification based on age of rivers:
Youthful River: a river with a steep gradient that has very few tributaries and flows
quickly. Its channels erode deeper rather than wider. E.g. the Brazos , Trinity and
Ebro rivers.
Mature river: a river with a gradient that is less steep than those of youthful rivers
and flows more slowly. A mature river is fed by many tributaries and has more
discharge than a youthful river. Its channels erode wider rather than deeper. E.g.
the Mississippi, Saint, Danube, Ohio, Thames and Paraná rivers.
Old River: a river with a low gradient and low erosive energy. Old rivers are
characterized by floodplains E.g. the Yellow Ganges, Tigris, Euphrates, Indus
and rivers.
Rejuvenated river: a river with a gradient that is raised by tectonic uplift.
Uses:
Rivers have been used as a source of water for obtaining food, transport, defensive
measure, hydropower to drive machinery, for bathing, as a means of disposing
waste.
Have been used for navigation since thousands of years. Riverine navigation
provides cheap means of transport.
Since river boats are often not regulated, they contribute a large amount to global
green house gas emission.

They also provide a rich source of food, like fish and other edible aquatic life and are a major
source of fresh water which can be used for drinking and irrigation purpose.
Soil is a natural body consisting of layers (soil horizons) of mineral constituents of
variable thicknesses, which differ from the parent materials in their morphological, physical,
chemical, and mineralogical characteristics (Birkeland and Peter, 1999). It's composed of
particles of broken rock that have been altered by chemical and environmental processes that
include weathering and erosion. Soil differs from its parent rock due to interactions between
the lithosphere, hydrosphere, atmosphere, and the biosphere (Chesworth, 2008). It is a mixture of
mineral and organic constituents that are in solid, gaseous and aqueous states (Voroney et al.,
2006). Soil is also known as earth: it is the substance from which our planet takes its name. Little
of the soil composition of planet Earth is older than the Tertiary and most no older than
the Pleistocene (Buol et al., 1973). In engineering, soil is referred to as regolith, or loose rock
material.
Water covers 70.9% of the Earth's surface ("CIA- The world fact book". Central
Intelligence Agency), and is vital for all known forms of life ("United Nations". Un.Org. 2005-
03-22). On Earth, it is found mostly in oceans and other large water bodies, with 1.6% of water
below ground in aquifers and 0.001% in the air as vapor, clouds (formed of solid and liquid
water particles suspended in air), and precipitation (Water Vapor in the Climate System, Special
Report, [AGU], December 1995 ). Oceans hold 97% of surface water, glaciers and polar ice
caps 2.4%, and other land surface water such as rivers, lakes and ponds 0.6%. A very small
amount of the Earth's water is contained within biological bodies and manufactured products.
Liquid water is found in bodies of water, such as an ocean, sea, lake, river, stream, canal, pond,
or puddle. The majority of water on Earth is sea water. Water is also present in the atmosphere in
solid, liquid, and vapor states. It also exists as groundwater in aquifers. Water plays an important
role in the world economy, as it functions as a solvent for a wide variety of chemical substances
and facilitates industrial cooling and transportation. Approximately 70% of freshwater is
consumed by agriculture. (Baroni et al., 2007).

A river is a natural watercourse, usually freshwater, flowing towards an ocean, a lake,
a sea, or another river. Small rivers may also be called by several other names, including stream,
creek, brook, rivulet, tributary and rill; there is no general rule that defines what can be called a
river, although in some countries or communities a stream may be defined by its size. A river is
part of the hydrological cycle. Water within a river is generally collected from precipitation
through surface runoff, groundwater recharge, springs, and the release of stored water in
natural ice and snow packs (e.g., from glaciers). Potamology is the scientific study of rivers.
A fresh water ecosystem consists of natural vegetation, plants, minerals, micro-
organisms, fish, some algae growth, plenty of sunshine and a natural undisturbed, unpolluted
environment. A fresh water spring flows naturally through the mountains and rolling hills and
can be enjoyed by many for drinking purposes. A good sign of any fresh water is abundant life
and natural growing vegetation. Fish, insects, algae, and a rich natural growing plant system is
all part of the natural fresh water and all thrive and survive as long as the water isn't polluted or
disturbed.
Fig2: pie chart showing percentage of water on earth

Phytoplankton is the autotrophic component of the plankton community. The name
comes from the Greek words (phyton), meaning "plant", and (planktos), meaning "wanderer" or
"drifter". Most phytoplankton is too small to be individually seen with the unaided eye.
However, when present in high enough numbers, they may appear as a green discoloration of the
water due to the presence of chlorophyll within their cells (although the actual colour may vary
with the species of phytoplankton present due to varying levels of chlorophyll or the presence of
accessory pigments such as phycobiliproteins, xanthophylls, etc.). Extracellular organic
substances are known to serve as nutrients for bacteria, algae, and invertebrates (Collier et al.
1953; Wright and Hobbie 1966).
The aim of this project is to find out the soil and water quality of Koel River and to find
out if it is getting affected by the industrial pollutants, since the river flows through Rourkela
which is the industrial capital of Odisha.

2. REVIEW OF LITERATURE
2.1 Sediment Characteristics:
Regardless of the source of particular sediment, certain physical characteristics are
important in describing what the sediment "looks like." Primary among these are size, sorting,
shape and color. The physical measurement and statistical treatment of grain-size data are basic
tools in the investigation of marine sediments.
Texture is the general physical appearance or character of sediment. It is used to describe
the geometric aspects and mutual relationships among the component particles or crystals and as
emphasized by Lewis (1984), is one of the three basic descriptors of a sedimentary deposit, the
other being structure and composition. Within the sedimentary realm of Earth Science, the term
―Texture‖ usually includes the fundamental attributes of: (a) size, (b) shape and (c) arrangement
or fabric, also defines texture as essentially the minogeometry of sediment a definition which
emphasizes the characteristic of individual grains and grain-to-grain relations, versus large scale
features of the deposit, such as sedimentary structures, bedding character or stratigraphic
sequence.
Much of the importance of texture, as with composition and structure, lies in its inherent
role as a mean of description and communication. Just as we might describe lacustrine deposit as
black, organic-rich sediment or finely laminated siliciclastic-dominated sediment, we also
routinely use the textural aspects of the material for classification and communication. Fine sand,
well sorted silt, poorly sorted mud, matrix supported gravel all convey an explicit and
quantitative meaning. Secondly in addition to fundamental description, classification and
communication, careful study of the various textural parameters can lead to important clues
about: - (i) source (provenance), (ii) the mechanism responsible for the transport of the material,
(iii) past physical and chemical environmental and chemical environmental and limnological
conditions at the depositional site within the basin, and (iv) paleoclimatic and paleohydrological
conditions within the surrounding water shed. Thirdly, knowledge of the texture of a lacustrine
deposit is important because of its influence on other key properties of the sediment.

Size limits of sediment particle size in the United State Department of Agriculture (USDA) and
International Soil Science Society (ISSS) Schemes (Table1). Another well known classification
of ―detrial particles‖ was published by C.K.Wentworth in 1922 (Table2).
Table.1.Size limits of sediment particle size in USDA and ISSS scheme
USDA Scheme ISSS Scheme
Name of particle size Diameter Range
(µm)
Name of particle size
Diameter Range
(µm)
Very coarse sand 2000-1000 Coarse sand 2000-200
Coarse sand 1000-500 Fine sand 200-20
Medium sand 500-250 Silt 20-2
Fine sand 250-100 Clay
< 2
Very Fine sand 100-50
Silt 50-2
Clay < 2
Coarse Fragments
Gravels 2000-75,000µm(2-75mm)
Cobbles 75,000-25,400µm(75-254mm)
Stones > 254,000µm(>254mm)
Table.2. Size limits of sediment particle size of detrial particles
Name Diameter in mm
Boulder ›256
Cobble 64 - 256
Pebble 2 - 64
Sand 0.0625 - 2
Silt 0.0039 – 0.0625
Clay size particle 0.0039
2.2 Characteristics of soil:
Soil colour:
Soil colour does not affect the behavior and use of soil; however it can indicate the
composition of the soil and give clues to the conditions that the soil is subjected to (Brady et al.,
2006). Soil can exhibit a wide range of colour; gray, black, white, reds, browns, yellows and
under the right conditions green (Brady et al., 2006). Varying horizontal bands of colour in the
soil often identify a specific soil horizon. The development and distribution of color in soil
results from chemical and biological weathering, especially redox reactions. As the primary
minerals in soil parent material weather, the elements combine into new and colorful
compounds. Aerobic conditions produce uniform or gradual color changes, while reducing
environments result in disrupted color flow with complex, mottled patterns and points of color
concentration.
Soil texture
It refers to sand, silt and clay composition. Soil content affects soil behavior, including
the retention capacity for nutrients and water (Brown, 2003). Sand and silt are the products of
physical weathering, while clay is the product of chemical weathering. Clay content has retention
capacity for nutrients and water. Clay soils resist wind and water erosion better than silt and
sandy soils, because the particles are more tightly joined to each other. In medium-textured soils,
clay is often translocated downward through the soil profile and accumulates in the subsoil. Soil
texture is the capacity of soils to store water and nutrients increases when their clay percentage
increases since clay has a large surface area/unit volume and they can absorb large amounts of
nutrients and water. A soil with sandy texture has difficulty in retaining water and thus nutrients
are not made available to the plants growing in such a soil. A clayey soil is poorer in aeration
(due to stagnation of water) thus debilitating the plant growth. Loamy soil (a mixture of clay and
sand) is the best textured soil for crop cultivation since it has all the beneficial aspects not found
in the sandy and clayey soil. Thus we can see how texture affects the plant growth. Importance:
Soil texture is one of the most important properties of soil particularly when dealing with water

movement through the soil. Soil mechanical and engineering properties are also influenced by
soil texture.
Soil structure:
It is the arrangement of soil particles into aggregates. These may have various
shapes, sizes and degrees of development or expression (Soil Survey Division Staff, 1993). Soil
structure affects aeration, water movement, resistance to erosion and plant root growth. Structure
often gives clues to texture, organic matter content, biological activity, past soil evolution,
human use, and chemical and mineralogical conditions under which the soil formed. If the soil is
too high in clay, adding gypsum, washed river sand and organic matter will balance the
composition. Adding organic matter to soil that is depleted in nutrients and too high in sand will
boost the quality (http://www.usaweekend.com).
Soil resistivity
It is a measure of a soil's ability to retard the conduction of an electric current. The
electrical resistivity of soil can affect the rate of galvanic of metallic structures in contact with
the soil. Higher moisture content or increased electrolyte concentration can lower the resistivity
and increase the conductivity thereby increasing the rate of corrosion. Soil resistivity values
typically range from about 2 to 1000 Ω m, but more extreme values are not unusual (Edwards,
1998).
Types of soil:
Soil is basically of 5 types, these are:-
Sandy Soil: Sandy soil is light and dry in nature. It does not have moisture content
and warms up quickly in the spring. Thus, it is good for the production of early crops.
Sandy soil is fit for cultivation any time of the year and is comparatively easier to
manage. Since it absorbs water quickly, the plants rooted in it need to be watered
frequently.(fig a)
Clay Soil: Clay soil is also called ‗late‘ soil, because its wet nature makes it apt for
planting seeds in late autumn. The soil serves as an excellent retort for the dry season,

as it has a high water retention quality. It is necessary to drain clay soil frequently, for
improving its texture. The soil becomes unmanageable during rainy season, as it
becomes ‗sticky‘. On the other hand, during draught, it becomes ‗rock solid‘ (fig b).
Loam Soil: Given the tag of being the perfect soil, Loamy soil is a combination of all
the three - sandy soil, clay soil and silt soil, in the ratio of 40:40:20. It is suitable for
any and every kind of crops. An amalgamation of three soils, loam soil has best of the
characteristic of all. It has high nutrients content, warms up quickly in summers and
rarely dries out in the dry weather. It has become the ideal soil for cultivation.(fig c)
Peaty Soil: Peaty soils are acidic in content, which makes them sour. This is the most
exceptional feature of Peaty soils. Usually found in low-lying areas, these soils
require proper drainage, as the place is accustomed to a lot of water clogging. Though
peaty soils have less nutrient content, they warm up quickly in the spring, making
them excellent if right amount of fertilizers are added.(fig d)
Chalky Soil: Chalky soil is alkaline in nature and usually poor in nutrients. It requires
nourishment, in the form of additional nutrients and soil improvers, for better quality.
The soil becomes dry in summers, making it very hard, and would require too much
of watering for the plants to grow. The only advantage which such a soil has is its
lime content. When deep-rooted, Chalky soil becomes excellent for plant growth and
favors good growing conditions as well.(fig e)
Fig a: Sandy soil Fig b: Clay soil

2.3 Bacterial enumeration
Advances in microbial methods have demonstrated that microorganisms globally are the
dominating organisms both concerning biomass and diversity. Their functional and genetic
potential may exceed that of higher organisms. Studies of bacterial diversity have been hampered
by their dependence on phenotypic characterization of bacterial isolates. Molecular techniques
have provided the tools for analyzing the entire bacterial community including those which we
are not able to grow in the laboratory. Reassociation analysis of DNA isolated directly from the
bacteria in pristine soil and marine sediment samples revealed that such environments contained
Fig c: loamy soil Fig d: Peaty soil
Fig e: Chalky soil
Fig3 (a-e): Different types of soils

in the order of 10, 000 bacterial types. The diversity of the total bacterial community was
approximately 170 times higher than the diversity of the collection of bacterial isolates from the
same soil. The culturing conditions therefore select for a small and probably skewed fraction of
the organisms present in the environment. Environmental stress and agricultural management
reduce the bacterial diversity. With the reassociation technique it was demonstrated that in
heavily polluted fish farm sediments the diversity was reduced by a factor of 200 as compared to
pristine sediments. Here we discuss some molecular mechanisms and environmental factors
controlling the bacterial diversity in soil and sediments.
A study undertaken in a tundra area in southwestern Alaska showed that there were
considerably greater numbers of bacteria in the soil than in the water. The highest plate count
of a soil sample was 15,000,000 per gm, while of water it was 4,400 per ml. These
counts were made of samples incubated a t 20°C. Progressively lower counts were obtained a t
37", 3‘-5', 45", and 55%. While fewer kinds of bacteria were found in the soil, the difference
between soil and water was not great. It was noted that mesophiles predominated both in
numbers and in kinds, followed by psychrophiles and thermophiles, in that order. (Fournelle.H.J,
1958).
2.4. Phytoplankton analysis
Phytoplankton obtain energy through the process of photosynthesis and must therefore
live in the well-lit surface layer (termed the euphotic zone) of an ocean, sea, lake, or other body
of water. Phytoplankton accounts for half of all photosynthetic activity on Earth. Thus
phytoplanktons are responsible for much of the oxygen present in the Earth's atmosphere – half
of the total amount produced by all plant life. Their cumulative energy fixation in carbon
compounds (primary production) is the basis for the vast majority of oceanic and also
many freshwater food webs (chemosynthesis is a notable exception). Since the 20th century,
phytoplankton has declined by roughly 1% yearly, possibly linked to warming oceanic
temperatures - as of 2010 this means a decline of 40% relative to 1950. As a side note, one of the
more remarkable food chains in the ocean – remarkable because of the small number of links – is
that of phytoplankton feeding krill (a type of shrimp) feeding baleen whales.

Plankton abundance in relation to physicochemical features of Mancharibele reservoir in
Bangalore district was studied by Sukumaran and Das (2002). Zooplankton population was
found to comprise of four major groups, which include protozoa, rotifera, cladocerans and
copepods. Protozoa were represented by Arcella, Centrophyxis and Difflugia species. However,
the numbers were found to be less. Rotifers were found to be the second dominant group and
were represented by a large number of species and genera. Cladocerans density was less when
compared to rotifers and six species were observed. Copepods were found to be represented
mainly by Diaptomus and Cyclops. They were found to be the dominant group among the
zooplankton. The optimal temperature requirement varied for different groups of zooplankton
suggesting their abundance indifferent seasons. The high chloride content and temperature were
also found to favor zooplankton abundance.
A study on plankton and a few physicochemical features of Milghatta and
Hutcharayangere tanks in the Malnad region of Karnataka was done by Sukumaran et al., (1984).
The zooplankton encountered includes Protozoa (3.54%), Rotifera (2.23%), Cladocera (3.15%),
and Copepods (15.41%) in Milghatta tank. The population in the Hutcharayankere tank was very
low compared to that of Milghatta tank. In Hutcharayankere tank, Copepods where the dominant
groups (16.54% of the total plankton), whereas other groups were rare in occurrence. Since the
tanks were low in nutrients these tanks were oligotrophic and hence less productive. The low
nutrient content in these tanks to the red soil present in the region, which had low nutrient and
organic matter, and also due to aquatic vegetation that takes up nutrients.
Sunkad and Patil (2004) assessed the water quality of Fort lake Belgaum, Karnataka.
Zooplanktons were represented by four groups, which include Rotifers, Cladocerans, Copepods
and Ostracods. Rotifers were found to contribute to the zooplankton richness of the Fort Lake
accounting 52.38% followed by copepod 26.5%, Cladocerans 16.45% and Ostracods 4.67%. The
dominance of rotifers in the lake was due to the continuous supply of food material which in turn
indicates the eutrophic nature of the lake. The level of phosphates in the lake was high (7.2 to
13.6 mg/L) due to the entry of sewage into the lake and hence supported the cause of
eutrophication. Hence the lake was highly unsuitable for drinking water purposes.
Microcystis is common in plankton of mesotrophic to hypertrophic lakes, rivers and
ponds and may dominate as nuisance blooms in slow-flowing or stratified waters (Paerl, 1991). It
is known that M. aeruginosa needs water with high retention times and low salinity to develop

(Paerl et al., 1984). It is unlikely that this species develops close to the mouth of the river, where
considerable salinity values are easily reached.
From average phytoplankton density values, River Minho may be considered as
eutrophic, according to Margalef (1983).However, if we consider the Trophic State Index (TSI;
Carlson, 1977) the TSI values for chlorophyll a obtained at the INAG (Portuguese Water
Institute) site classify River Minho as mesotrophic. In fact the TSI chlorophyll a values vary in
average between 3.5.6 in Valenqa (n=34), 39.7 in Monqiio (n=32) and 46.1 in Melgaqo (n=19).
These values were calculated from data obtained between 199.5 and 1998 (Vasconcelos et al.,
2000).
The phytoplankton community of the international section of river Minho was studied
during the spring-summer periods 1989 and 1999. Samples were collected not on a regular basis
from S. Gregdrio (mostly in the upstream international section) to Caminha, at the Minho
estuary. According to our results, eutrophication seems to decrease from upstream to
downstream sites. The occurrence of cyanobacteria blooms, especially of Microcjstis
aeruginosa, in the Minho River mainly in August suggests that they may be formed in Spanish
reservoirs and then float downstream into the studied section. These data clearly show that the
monitoring of cyanobacteria in Minho River is important. Data can he used to prevent human
health risks, as this water is used for drinking, recreation and shellfish. A total of 79
phytoplankton species were recorded in the international section of River Minho, without taking
into account other phytoplankton organisms which could not be identified to species level. The
groups more represented were Chlorophyta and Bacillariophyta, although Cyanobacteria were
also present in significant numbers. The species richness seemed higher in the medium section
(two sites) of the studied area (Monqio-Valenga), although this may be a spurious effect of more
samples being analyzed for these two sites than for the others. Nevertheless, the upstream site
Melgago, presented a significant number of diatom species when compared to that of
chlorophytes harvest.

3. OBJECTIVE
This project deals with the Microbial Analysis of Soil and Water of Koel River. The Koel
river is the source of water supply to the nearby sectors (sector-1 & 2), colonies and institute
including NIT, Rourkela. So I was greatly interested in working on this river. During rainy
season fishery becomes the main occupation of the people of Mitkundri Village (the village
situated along the shore of the river) while during the rest of the season of the year, the water of
this river is used for irrigation and vegetation purpose, the soil too here is very productive.
The research project was conducted with following aims and objectives:
To check the quality of river, whether it is safe for drinking purpose or is prone to
pollution leading to some water borne diseases.
To know about the type of soil found here and the microorganisms loaded here from
which we can know the kind of vegetation it can support.
To identify the phytoplanktons, which are the primary producers of freshwater ecosystem
and the type of phytoplankton species dominant here.

4. MATERIALS AND METHODS
4.1 Collection of sample:
Soil and Water: Samples were collected in the month of January of from the coastal side of
Koel River from different areas of the river. The samples were collected from top 4cm soil
profile where most of the microbial activity takes place, and thus where most of the bacterial
population is concentrated. Soil samples were collected (approx 100g) in clean, dry and sterile
polythene bags using sterilized spatula and water sample were collected in 50ml sterilized falcon
tubes, reducing the chances of contamination as far as possible, and were carried to the
laboratory for further analysis.
Fig4: Koel River
4.2 Physiochemical analysis:
pH:
Principle: pH is defined as logarithm to the base 10 of the inverse of the hydrogen ion
concentration (or preferably H+ ion activity). It is also the negative logarithm to the base 10 of
H+ ion activity. pH is very important in determining the alkalinity and acidity of soil and it also
determines the capacity of sediments for the growth of phytoplankton, availability of nutrients,
bacterial activity and physical condition of sediment.
Procedure:
The pH electrode is placed inside the beakers where samples are collected and the constant value
is recorded.
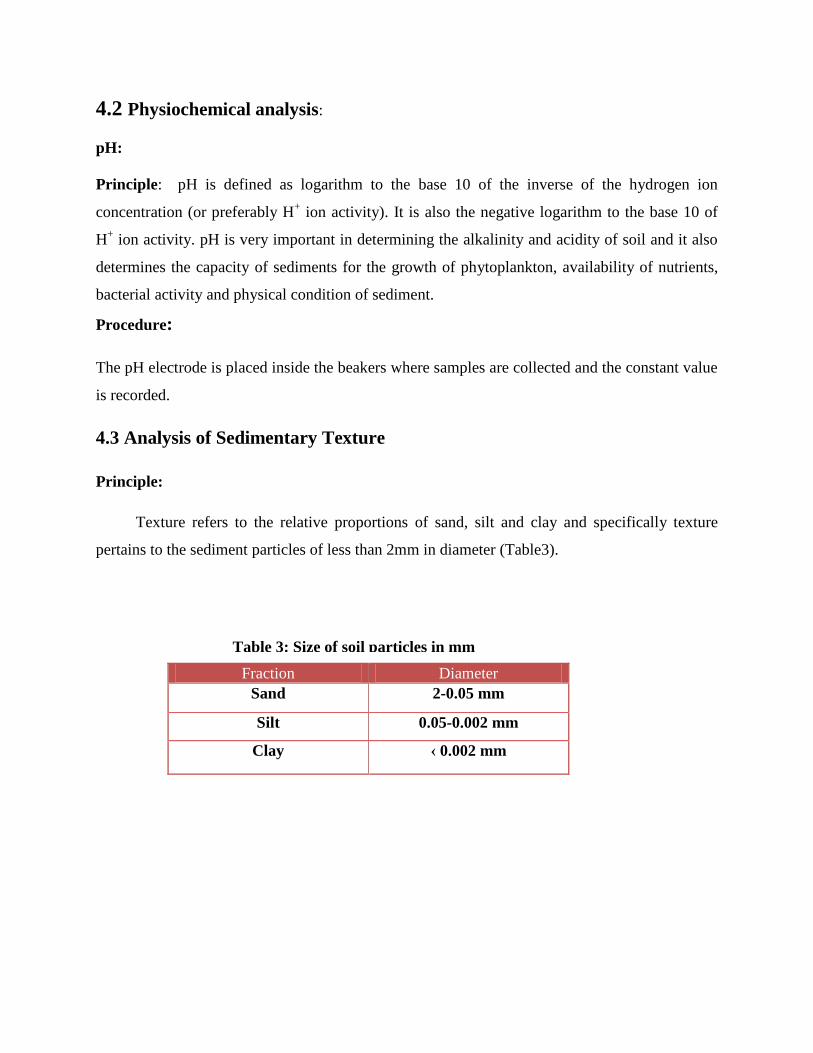
4.3 Analysis of Sedimentary Texture
Principle:
Texture refers to the relative proportions of sand, silt and clay and specifically texture
pertains to the sediment particles of less than 2mm in diameter (Table3).
Fraction Diameter
Sand 2-0.05 mm
Silt 0.05-0.002 mm
Clay ‹ 0.002 mm
Table 3: Size of soil particles in mm

Procedure:
The soil samples are dried in hot air oven and then ground to remove the clumps.Then the
samples are sieved through sieves of different mesh size. Then the relative percentage of sand,
silt and clay is determined and is plotted in the the trigon graph.
Calculation:-
Sand%=sand wt/total wtx100
Silt % =silt wt/total wtx100
Clay%=clay wt/total wtx100
Gravel%=gravel wt/total wtx100
4.4 Total count of Bacteria:
Principle: Microorganisms present in water are very high in number. The exact number cannot
be found out when their discrete colonies are not growing in the medium. The principle of this
Fig5: Trigon plot

method is that when micro-organisms are grown through this method possibly all live propagules
will grow and develop individual colony. In this method a known amount of sample is added to a
known volume of sterilized distilled water so that volume of microbial suspension is transferred
to additional flasks containing 9ml to get 10 fold serially diluted suspension of 10-1
up to 10
-3
Adequate amount of 0.1ml of suspension is poured into the surface of medium and is spread by
‗L‘ rod. The bacteria can thus be isolated and counted by calculating C.F.U. i.e, Colony Forming
Unit.
C.F.U. = no of colonies/inoculums size (ml) X dilution factor C.F.U/ml
If the C.F.U. has a range of 30-300 in a plate it is considered as normal. Below 30 it
is called TLTC (too low to count) and TFTC (too few to count).above 300 it is called TNTC (too
numerous to count).
Procedure (from water sample):
Requirements for the preparation of media:
NA: 4.48g
Agar: 1g
Distill water: 250ml
Four different test tubes were taken and 9 ml of sterile distilled water was added in four
test tubes and 10ml of water was added in one test tube.1ml of water was collected from koel
river and was added to 9ml sterile distilled water flask.1ml of the suspension from the above
solution was taken and added to 9ml of distilled water containing test tube.1ml of solution from
10-1
dilution was transferred into flask containing 9ml of distilled water to get dilution of 10-
2.similarly 1ml of solution was serially transferred from 10
-2 to 3
rd test tube containing 9ml water
to get dilution of 10-3
.The process was followed repeatedly to get a dilution of 10-4
. 100ml of
solution each from 10-4
to 10-3
dilutions were taken and spread into two different petriplates
containing nutrient agar medium. The petriplates were then incubated at 37oc for 24hrs.the
colonies were taken observed and counted.

Procedure (from soil sample):
Five different test tubes were taken and 9 ml of sterile distilled water was added in four
test tubes and 10ml of water was added in one test tube.1g of soil sample was collected from the
coastal sides of Koel River and was mixed in 10ml of sterile distilled water. 1ml of the
suspension from the above solution was taken and added to 9ml of distilled water containing test
tube.1ml of solution from 10-1
dilution was transferred into flask containing 9ml of distilled
water to get dilution of 10—2
. Similarly 1ml of solution was serially transferred from 10-2
to 3rd
test tube containing 9ml water to get dilution of 10-3
.The process was followed repeatedly to get
a dilution of 10-4
. 100ml of solution each from 10-4
to 10-3
dilutions were taken and spread into
two different petriplates containing nutrient agar medium. The petriplates were then incubated at
37oc for 24hrs.the colonies were taken observed and counted.
Bacterial Enumeration: Water samples were diluted to 10-1
and sediment samples was diluted
upto 10-3
dilution, 0.1ml of each dilution were inoculated in triplicate plates of 12 different
specified media. After incubations all plates were incubate at 370C in the incubator for 48 hours.
After the incubation different cultures were seen on the Petri plates. Counting was done for each
plate. Different microorganisms were identified on the basis of their colour and growth. Three
microorganisms were selected for pure culture. Pure culture is obtained by streak plate method.
The strains were K1, K2 & K3.Broth culture was prepared in the nutrient broth. Biochemical
test was by the specific media. Results were interpreted. Casein hydrolysis and Starch hydrolysis
was done by streak plate method. And incubation was done by stab and streak culture method.
Citrate utilization, urease test and litmus milk reaction was done by preparing broth culture in
test tube. The entire Biochemical test were analyzed and interpreted.
4.5 Biochemical analysis
GRAM STAIN
The most important differential stain used in bacteriology is the Gram stain, named after
Dr. Christian Gram. It divides bacterial cells into two major groups, gram-positive and gram-
neegative, which makes it an essential tool for classification and differentiation of
microorganisms. The Gram stain reaction is based on the difference in the chemical composition
of bacterial cell walls. Gram-positive cells have a thick peptidoglycan layer

Whereas the peptidoglycan layer in gram negative cells is much thinner and surrounded by outer
lipid-containing layers. Peptidoglycan is mainly a polysaccharide composed of two chemical
subunits found only in the bacterial cell wall. These subunits are N-acetylglucosamine and N-
acetylmuramic acid. As adjacent layers of peptidoglycan are formed, they are cross linked by
short chains of peptides by means of a transpeptidase enzyme, resulting in the shape and rigidity
of the cell wall. Early experiments have shown that if the gram positive cell is denuded of its cell
wall by the action of lusozyme or penicillin, the gram-positive cell will stain gram negative.
PRIMARY STAIN
Crystal violet is used first and stains all cells purple. Its function is to impart its color to
all cells in order to establish a colour contrast.
MORDANT
Gram‘s iodine, this reagent is not only a killing agent, but also serves as a mordant a substance
that increases the cells‘ affinity for a stain. It does this by binding to the primary stain, thus
forming an insoluble complex. The resultant crystal-violet-iodine complex serves to intensify the
colour of the stain. At this point, all cells will appear purple black.
DECOLORIZING AGENT
Ethyl alcohol, 95%- This reagent serves as a dual function as a protein-dehydrating agent
and as a lipid solvent. Its action is determined by two factors, the concentration of lipids and the
thickness of peptidoglycan layer in bacterial cell walls. In gram negative cells, the alcohol
increases the porosity of the cell wall by dissolving the lipid in the outer layers. Thus the CV-1
complex can be more easily removed from the thinner and less highly cross linked Peptidoglycan
layer. Therefore, the washing out effect of the alcohol facilitates the release of the unbound CV-1
complex, leaving the call colourless or unstained. The much thicker peptidoglycan layer in gram
positive cells is responsible for the more stringent retention of the CV-1 complex, as the pores
are made smaller due to the dehydrating effect of the alcohol. Thus the tightly bound primary
stain complex is difficult to remove, and the cells remain purple.

COUNTERSTAIN
Safranin is used to stain red those cells that have been previously decolourized. Since
only gram negative cells undergo decolourization, they may now absorb the counterstain. Gram
positive cells retain the purple colour of the primary stain.
PROCEDURE
One clean glass slide was taken.
A smear was prepared by placing a drop of water on the slide and then transferring
microorganism to the drop of water with a sterile cooled loop. It was mixed and spread
by means a circular motion of the inoculating loop.
Smear was air dried and heat fixed.
Smear was gently flooded with crystal violet for 1min.
Gently washed with tap water.
Smear was gently flooded with Gram‘s iodine and left for 1 min.
Gently washed with tap water.
Decolourized with 95% ethyl alcohol reagent. It was added drop by drop until no further
violet colour comes out.
Gently washed with tap water.
Counterstained with safranin for 45 seconds.
Gently washed with tap water.
It was dried with bibulous paper and examined under oil immersion.
HI CARBOHYDRATE KIT
This kit is a standardized colorimetric identification system utilizing thirty five
carbohydrate utilization tests. Tests are based on the principle of pH change and substrate
utilization.
a) Carbohydrate fermentation test
Colour of the medium changes from red colour to yellow colour due to acid production,
if the test is positive.

b) ONPG test
Medium changes from colourless to yellow is the positive test.
Detects β-galactosidase activity.
c) Esculin hydrolysis
Colour of the medium changes from cream to black if the test is positive.
d) Citrate utilization
Colour of the medium changes from yellowish green to blue if the test is positive.
Detects capability of organism to utilize citrates as a sole carbon source.
e) Malonate utilization
Colour of the medium changes from light green to blue if the test is positive.
Detects capability of organism to utilize malonate as a sole carbon source.
Preparation of inoculum:
1) The organisms to be identified were first isolated and purified. Only pure cultures were used.
2) Kit was opened aseptically aseptically. Each well was inoculated with 50µl of the prepared
inoculum by surface inoculation method.
3) The kit can also be inoculated by stabbing each individual well with a loopful of inoculum.
INCUBATION:
Temperature of incubation 35±2oc. Duration of incubation 18-24 hours.
HI MOTILITY TEST
This kit is a satndardized colorimetric identification system utilizing seven conventional
biochemical tests including motility and four carbohydrate utilization tests. The tests are based
on the principal of pH change and substrate utilization.

INTERPRETATION OF TEST:
a) Motility
Motility is seen as movement of bluish green growth from 1st well to 2
nd well.
b) Indole test
1-2 drop of kovac‘s reagent was added.
Development of reddish pink colour within 10sec indicates positive reaction.
c) Nitrate reduction test
2 drops of sulphanilic acid and 1-2 drops of N, N-Dimethyl-1-Napthylamine reagent were
added.
Immediate development of pinkish red colour on addition of reagent indicates positive
reaction.
Preparation of inoculum:
The organisms to be identified were first isolated and purified. Only pure cultures were
used.
Kit was opened aseptically. 1st well was inoculated by stabbing and 2
nd well was not
inoculated.
Remaining strip was inoculated by stabbing each individual well with a loopful of
inoculums.
INCUBATION:
Temperature of incubation is 35-37oc and duration of incubation is 18-24 hours.
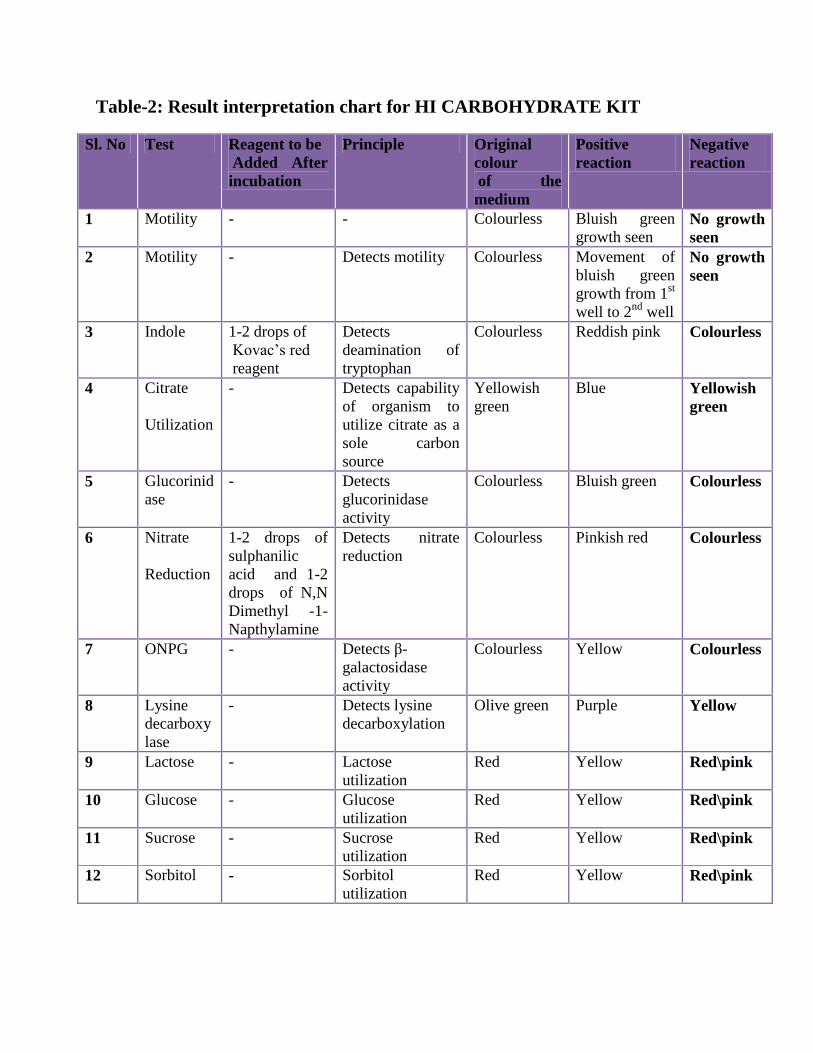
Table-2: Result interpretation chart for HI CARBOHYDRATE KIT
Sl. No Test Reagent to be
Added After
incubation
Principle Original
colour
of the
medium
Positive
reaction
Negative
reaction
1 Motility - - Colourless Bluish green
growth seen No growth
seen
2 Motility - Detects motility Colourless Movement of
bluish green
growth from 1st
well to 2nd
well
No growth
seen
3 Indole 1-2 drops of
Kovac‘s red
reagent
Detects
deamination of
tryptophan
Colourless Reddish pink Colourless
4 Citrate
Utilization
- Detects capability
of organism to
utilize citrate as a
sole carbon
source
Yellowish
green
Blue Yellowish
green
5 Glucorinid
ase
- Detects
glucorinidase
activity
Colourless Bluish green Colourless
6 Nitrate
Reduction
1-2 drops of
sulphanilic
acid and 1-2
drops of N,N
Dimethyl -1-
Napthylamine
Detects nitrate
reduction
Colourless Pinkish red Colourless
7 ONPG - Detects β-
galactosidase
activity
Colourless Yellow Colourless
8 Lysine
decarboxy
lase
- Detects lysine
decarboxylation
Olive green Purple Yellow
9 Lactose - Lactose
utilization
Red Yellow Red\pink
10 Glucose - Glucose
utilization
Red Yellow Red\pink
11
Sucrose
-
Sucrose
utilization
Red
Yellow
Red\pink
12 Sorbitol - Sorbitol
utilization
Red Yellow Red\pink

HilMvic Biochemical test kit
HilMvic biochemical test Kit can be used for used for screening pathogenic organisms
from urine, enteric specimens and other relevant clinical samples. It can also be used for
validating known laboratory strains.
Principle: Each HilMvic kit is a standard colorimetric identification system utilizing four
conventional biochemical tests and eight carbohydrate utilization tests. The tests are based on the
principle of pH change and substrate utilization. On incubation organisms undergo metabolic
changes which are indicated as a colour change in the media that can be either interpreted
visually or after addition of the reagent.
a) INDOLE TEST
1-2 drops of Kovac‘s reagent was added. Development of reddish pink colour within 10
seconds indicates positive reaction.
b) METHYL RED TEST
1-2 drops of Methyl red reagent was added. Reagent remains red colour if the test is
positive.
c) VOGES PROSKAEUR’S TEST
2-3 drops of Barrit reagent A & 1-2 drops of Barrit reagent B were added. Pinkish red
colour development within 5-10 minutes indicates a positive test.
Preparation of inoculum:
The organisms to be identified were first isolated and purified. Only pure culture was
used.
Kit was opened aseptically. Each well was inoculated with 50µl of the prepared inoculm
by surface inoculation method.
The kit can also be inoculated by stabbing each individual well with a loopful of
inoculum.
INCUBATION:
Temperature of incubation 35±37oc. Duration of incubation 18-24 hours.

Table-3: Result interpretation chart For Hilmvic Biochemical Test Kit
Sl.no Test Reagents
added
after
incubation
Principle Original
colour of the
medium
Positive
reaction
Negative reaction
1 Indole 1-2 drops
of kovac‘s
red reagent
Detects
deaminatio
n of
tryptophan
Colourless Reddish
pink Colourless
2 Methyl
red
1-2 drops
of Methyl
red reagent
Detects
acid
production
Colourless Red Yellow
3 Voges
proskaeur‘
s
1-2 drops
of Barrit
reagent A
& 1-2
drops of
Barrit
reagent B.
Detects
acetoin
production
Colourless Pinkish
red Colourless \slight
copper
4 Citrate
utilization
- Detects
capability
of
organism
to utilize
citrate as a
sole carbon
source
Yellowish
green
Blue Yellowish green
5 Glucose - Glucose
utilization
Red yellow Red
6 Adonitol - Adonitol
utilization
Red yellow Red
7 Arabinose - Arabinose
utilization
Red yellow Red
8 Lactose - Lactose
utilization
Red yellow Red
9 Sorbitol - Sorbitol
utilization
Red yellow Red
10 Mannitol - Mannitol
utilization
Red yellow Red
11 Rhamnose - Rhamnose
utilization
Red yellow Red
12 Sucrose - Melibiose
utilization
Red yellow Red

HI ASSORTED BIOCHEMICAL TEST KIT
This kit is a test system that can be used for identification of gram negative rods. Hi
Assorted Biochemical test kit cab is used for screening pathogenic organisms from urine, enteric
specimens & other relevant clinical samples. It can also be used for validating known laboratory
strains.
Principle:
Each Hi Assorted test kit is standardized calorimetric identification system utilizing
seven conventional biochemical test and five carbohydrate utilization tests. The tests are based
on the principle of pH change and substrate utilization. On incubation organisms undergo
metabolic changes which are indicated by a colour change in the media that can be either
interpreted visually or after addition of the reagent.
INTERPRETATION OF RESULT:
Phenylalanine deamination test:
2-3 drops of TDA reagent was added. Development of dark green colour within one
minute indicates a positive reaction.
Nitrate reduction test:
1-2 drops of sulphanilic acid and 1-2 drops of N,N-Dimethyl-1-Napthylanine reagent.
Immediate development of pinkish red colour on addition of reagent indicates positive reaction.
Preparation of inoculum:
The organisms to be identified were first isolated and purified. Only pure culture was
used.
Kit was opened aseptically. Inoculate each well with 50µl of the prepared inoculm by
surface inoculation method.
The kit can also be inoculated by stabbing each individual well with a loopful of
inoculum.

INCUBATION:
Temperature of incubation 35±37oc. Duration of incubation 18-24 hours.
Table-4: Result interpretation chart for HI ASSORTED BIOCHEMICAL
TEST KIT
Sl.
no
Test Reagents to
be added
after
incubation
Principle Original
colour of
the
medium
Positive
reaction
Negative
reaction
1 Citrate
utilization
- Detects capability
of organism to
utilize citrate as a
sole carbon source
Yellowish
green
Blue Yellowish
green
2 Lysine
decarboxylase
- Detects lysine
decarboxylation
Olive
green
Purple yellow
3 Ornithin
decarboxylase
- Detects ornithin
decarboxylation
Olive
green
purple Yellow
4 Urease - Detects urease
activity
Orangish
yellow
Pink Orangish
yellow
5 Phenylalanine
deamination
2-3 drops of
TDA reagent
Detects pH
enylalanine
deamination
activity
Colourless Green Colourless
6 Nitrate
reduction
1-2 drops of
sulphanilic
acid and 1-2
drops of N,N-
Dimethyl-1-
Napthylamine
Detects Nitrate
reduction
Colourless Pinkish
red Colourless
7 H2S
production
- Detects H2S
production
Orangish
yellow
Black Orangish
yellow
8 Glucose - Glucose utilization Red Yellow Red\pink
9 Adonitol - Adonitol
utilization
Red Yellow Red\pink
10 Lactose - Lactose utilization Red Yellow Red\pink
11 Arabinose - Arabinose Red Yellow Red\pink
12
Sorbitol - utilization
Sorbitolutilization
Red Yellow Red\pink
EXTRACELLULAR ENZYMATIC ACTIVITIES OF MICROORGANISM
Starch hydrolysis
Starch is a high molecular-weight, branching polymer composed of glucose molecule
linked together by glycosidic bonds. The degradation of this macromolecule first requires the
presence of the extracellular enzyme amylase for its hydrolysis into shorter polysaccharides,
namely dextrins,and ultimately into maltose molecules. The final hydrolysis of this disaccharide,
which is catalyzed by maltase, yields low molecular weight, soluble glucose molecules that can
be transported into the cell and used for energy production through the process of gycolysis. In
this experimental procedure starch agar is used to demonstrate the hydrolytic activities of these
exoenzymes. The medium is composed of nutrient agar supplemented with starch, which serves
as the polysaccharide substrate. The detection of the hydrolytic activity following the growth
period is made by performing the starch test to determine the presence or absence of starch in the
medium. Starch in the presence of iodine will impart a blue black colour to the medium,
indicating the absence of starch splitting enzymes and representing a negative result. If the starch
has been hydrolyzed, a clear zone of hydrolysis will surround the growth of the organism. This is
a positive result.
Casein hydrolysis
Casein, the major milk protein, is a macromolecule composed of amino acid subunits
linked together by peptide bonds (CO-NH). Before there assimilation into the cell, proteins must
undergo step-by-step degradation into peptones, polypeptides, dipeptides, and ultimately in to
their building blocks, amino acids. This process is called peptonisation, or proteolysis, and it is
mediated by extracellular enzymes called proteases. The function of these proteases is to cleave
the peptide bond CO-NH by introducing water in to the molecule. The reaction than liberates the
amino acids. The low molecular weight soluble amino acids can now be transported through the
cell membrane into the intracellular amino acid pool for use in the synthesis of structural and
functional cellular proteins. In this experimental procedure, milk agar is used to demonstrate the
hydrolytic activity of these exoenzymes. The medium is composed of nutrient agar supplemented
with milk that contains the protein substrate casein. Similar to other proteins, milk protein is a
colloidal suspension that gives the medium its colour and opacity, because it deflects light rays

rather than transmitting them. Following inoculation and incubation of the agar plate cultures,
organisms secreting proteases will exhibit a zone of proteolysis, which is demonstrated by a clear
area surrounding the bacterial growth. This loss of opacity is the result of a hydrolytic reaction
yielding soluble, no colloidal amino acids, and it represents a positive reaction. In the absence of
protease activity, the medium surrounding the growth of the organism remains opaque, which is
a negative reaction.
Gelatin hydrolysis
Gelatin is an incomplete protein because it lacks essential amino acid tryptophan; its
value in identifying bacterial species is well established. Gelatin is a protein produced by
hydrolysis of collagen, a major component of connective tissue and tendons in humans and other
animals. Below temperature of 25oC, gelatin will maintain its gel properties and exist as a solid
at temperatures above 25oC, gelatin is liquid. Liquefaction is accomplished by some
microorganisms capable of producing a proteolytic extracellular enzyme called gelatinase, which
acts to hydrolyze this protein to amino acids. Once this degradation occurs, even very low
temperatures of 40C will not restore the gel characteristic. Gelatin deep tubes were used to
demonstrate the hydrolytic activity of gelatinase. The medium consists of nutrient supplemented
with 12% gelatin this high gelatin concentration results in a stiff medium and also serves as the
substrate for the activity of gelatinase. Following inoculation and incubation for 48hours, the
cultures were placed in a refrigerator at 40C for 30 minutes. Cultures that remain liquefied
produce gelatinase and demonstrate rapid gelatin hydrolysis. All culture was re-incubate for a
additional 5 days. Again they were refrigerated for 30 minutes and observed for liquefaction.
Cultures that remain liquefied were indicative of slow gelatin hydrolysis.
Carbohydrate Fermentation
Many organism use carbohydrates differently to obtain energy depending on their
enzyme complement. Some organisms are capable of fermenting sugars such as glucose an
aerobically while others use the aerobic pathway.
The purpose of this test is to determine whether an organism can ferment a specific
carbohydrate with production of acid. In this test lactose is used. The indicator is bromothymol
blue which turns yellow when pH is low.

Citrate Utilization:
This is the test for the ability of bacteria to convert citrate (an intermediate of the Krebs
cycle) into oxaloacetate (another intermediate of the Kerbs cycle). In this media, citrate is the
only carbon source available to the bacteria. If it cannot use citrate then it will not grow. If it can
use citrate, then the bacteria will grow and the media will turn a bright blue as a result of an
increase in the pH of the media. To inoculate this slant, transfer loop is used.
Indole production:
This test is done to determine if bacteria can breakdown the amino acid tryptophan into
indole. SIM media or TSB (Tryptic Soy Broth) is inoculated using a transfer needle. After
incubating the bacteria for at least 48 hours, Kovac‘s reagent is added to the media to detect if
indole has been made by the bacteria. The development of a red/pink layer on top of the media is
a positive result (the bacteria can breakdown tryptophan to form indole). Failure to see a red
layer is a negative result (indole was not formed from tryptophan).
MRVP (methyl red-Vogues Proskauer):
This test is used to determine two things. The MR portion (methyl red) is used to
determine if glucose can be converted to acidic products like lactate, acetate, and formate. The
VP portion is used to determine if glucose can be converted to acetone.
These tests are performed by inoculating a single tube of MRVP media with a transfer
loop and then allowing the culture to grow for 3-5 days. After the culture is grown, about half of
the culture is transferred to a clean tube. One tube of culture will be used to conduct the MR test,
the second tube serves as the VP test.
A. MR (methyl red) test: Methyl red is added to the MR tube. A red colour indicates a
positive result (glucose can be converted into acidic end products such as lactate, acetate,
and formate). A yellow colour indicates a negative result; glucose is converted into
neutral end products.

B. VP (Vogues Proskauer) test: First alpha-napthol (also called Barritt‘s reagent A) and
then potassium hydroxide (also called Barritt‘s reagent B) are added to the VP tube. The
culture should be allowed to sit for about 15 minutes for color development to occur. If
acetone was produced then the culture turns a red color (positive result); if acetone was
not produced then the culture appears yellowish to copper in color (a negative result).
Triple sugar Iron (TSI) and Hydrogen sulphide production (H2S):
Looks at fermentation of glucose, lactose, and sucrose and checks if hydrogen sulphide is
produced in the process. Basically a pH indicator will change the colour of the media in response
to fermentation. Where that colour change occurs in the tube will indicate what sugar or sugars
were fermented. The presence of a black colour indicates that H2S was produced. In this media,
H2S reacts with the ferrous sulphate in the media to make ferrous sulphide, which is black. To
inoculate, use a needle to stab agar and then uses a loop to streak the top slated region. In
addition to TSI media, SIM media can be used to determine if H2S is produced. A black colour in
the SIM medium following inoculation and incubation indicates that H2S is made by the bacteria.
Urease:
This test is used to detect the enzyme urease, which breaks down urea into ammonia.
Ammonia is a base and thus will raise the pH of the media if it is present. This change in pH is
indicated by a pH indicator called phenol red which is present in the media. A colour change
from yellow to bright pinkish-red is positive; lack of colour change is a negative result.
Inoculation in liquid media is done by transfer loop.
Catalase:
This test is can be used to detect the enzyme catalase. This enzyme is responsible for
protecting bacteria from hydrogen peroxide (H2O2) accumulation, which can occur during
aerobic metabolism. If hydrogen peroxide accumulates, it becomes toxic to the organism.
Catalase breaks H2O2 down into water and O2. To perform the catalase test simply smear a small
amount of the test organism onto the lid of a petri plate/culture dish. Then add a drop of
hydrogen peroxide to the smear. If bubbles become visible (these would be the O2 bubbling up)

then the test is positive and you can conclude that the organism makes catalase. A lack of
bubbles indicates the absence of catalase. Most aerobic organisms make catalase.
Oxidase test:
To perform this test simply swab some of your test culture into one of the boxes on an
oxidase dry slide. If a colour change to purple or blue is evident at 30 seconds-1 minute then the
result is positive. It is important that the test is read by one minute to ensure accurate results
(avoid false negatives and false positives). This laboratory test is based on detecting the
production of the enzyme cytochrome oxidase by Gram-negative bacteria. It is a hallmark test
for the Neiserria. It is also used to discriminate between aerobic Gram-negative organisms like
Pseudomonas aeruginosa and other Enterobacteriaciae.
Motility test:
The motility test is not a biochemical test since we are not looking at metabolic properties
of the bacteria. Rather, this test can be used to check for the ability of bacteria to migrate away
from a line of inoculation thanks to physical features like flagella. To perform this test, the
bacterial sample is inoculated into SIM or motility media using a needle. Simply stab the media
in as straight a line as possible and withdraw the needle very carefully to avoid destroying the
straight line. After incubating the sample for 24-48 hours observations can be made. Check to
see if the bacteria have migrated away from the original line of inoculation. If migration away
from the line of inoculation is evident then you can conclude that the test organism is motile
(positive test). Lack of migration away from the line of inoculation indicates a lack of motility
(negative test result).
4.6 Identification of phytoplankton:
Water was collected from the surface with minimal disturbance with the help of
phytoplankton net (20 μm) (fig: 17) and immediately fixed with 5% formalin. The preserved
samples were kept in refrigerator until analysis. Before identification water samples were
allowed to settle for 24 hours and the supernatant was decanted until a concentrate 10 ml was
achieved. Few drops of concentrated sample were taken in a common glass slide and observed

under sedverg rafter chamber under light microscope For identification of common diatoms
examination of raw (without acid cleaned) material in a water mount was done as stated earlier.
Several keys and illustration were consulted to confirm identification.
5. RESULTS AND DISCUSSIONS
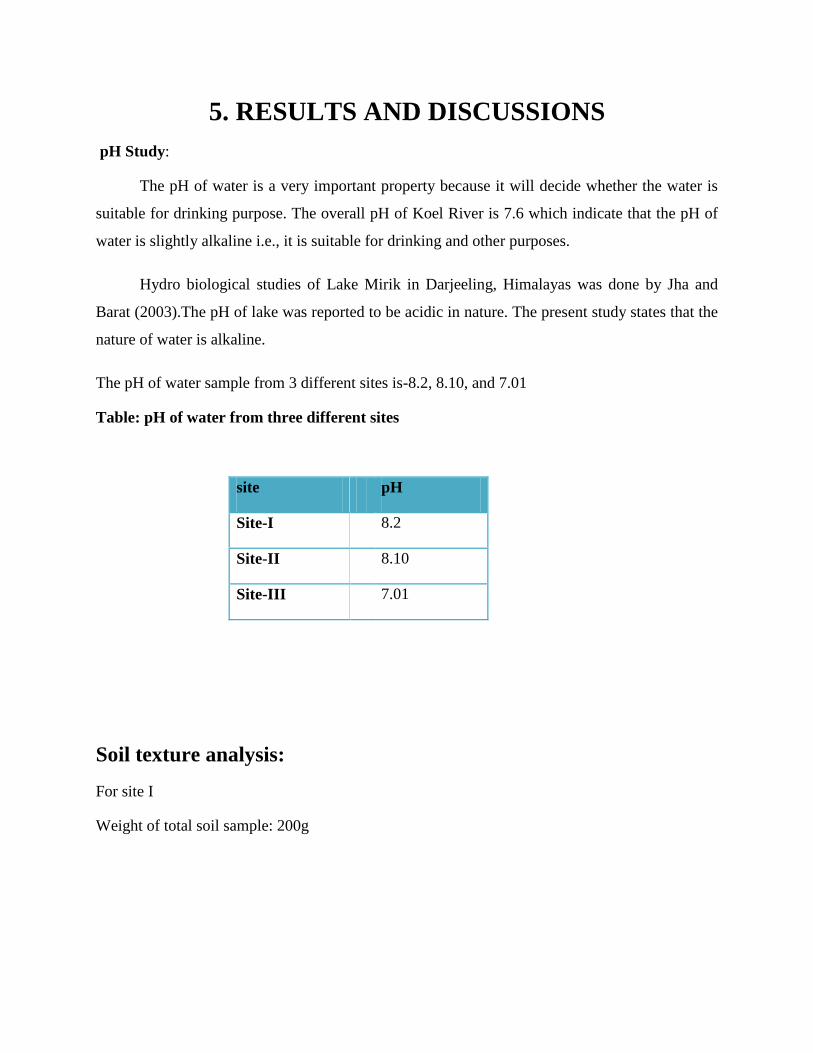
pH Study:
The pH of water is a very important property because it will decide whether the water is
suitable for drinking purpose. The overall pH of Koel River is 7.6 which indicate that the pH of
water is slightly alkaline i.e., it is suitable for drinking and other purposes.
Hydro biological studies of Lake Mirik in Darjeeling, Himalayas was done by Jha and
Barat (2003).The pH of lake was reported to be acidic in nature. The present study states that the
nature of water is alkaline.
The pH of water sample from 3 different sites is-8.2, 8.10, and 7.01
Table: pH of water from three different sites
site pH
Site-I 8.2
Site-II 8.10
Site-III 7.01
Soil texture analysis:
For site I
Weight of total soil sample: 200g

Soil texture wt %
Gravel 2.2g 1.1
Sand 30.4g 15.2
Silt 17.4g 8.7
Clay 152.2g 76.1
Fig6: Trigon plot for site -I
Table9: soil texture for site -I

For site II
Wt of total soil sample: 100g
Soil texture wt %
Gravel 5.3g 5.3
Sand 25g 25
Silt 11g 11
Clay 61.5g 61.5
Fig7: Trigon plot for site-II
Table10: soil texture for site-II

The texture of soil reported in table and table indicate that the percentage of clay soil is
more and from the above two Trigon graphs it is clear that the soil is of clayey type.
Bacterial count
Table11: Bacterial count for water sample;
Site Dilution No. of
colonies
Inoculum size CFU/ml
I 10-1
TNTC 0.1
10-2
80x4 0.1 0.32x10⁶
10-3
79x4
0.1
0.316x10⁷
II 10-1
110x4 0.1 0.4x10⁵
10-2
80x4 0.1 0.32x10⁶
10-3
70x4 0.1 0.28x10⁷
Table12: Bacterial count for soil sample:
Site Dilution No. of
colonies
Inoculation
size
CFU/g
I 10-1
TNTC 0.1
10-2
232 0.1 2.32x10⁵

10-3
150 0.1 1.5x10⁶
II 10-1
110 0.1 1.1x10⁴
10-2
106 0.1 1.06x10⁵
10-3
98 0.1 9.8x10⁵
(b) (a)

(d) (c)
(e) (f)
Fig8 (a-f): Plates showing isolation of pure culture by streak plate method

Bacterial colony counts and MPN counts of soil (moist) and water samples collected
in September 1957 and June 1958 have been consolidated by sampling period. In general,
the soil is a much more productive source of microorganisms than is water. The coliforms
were an exception: they were present in all 16 water samples, and in only 5 of the 16 soil
samples. The upper limit of the coliform count in soil (1,400 per gm.), occurring in soil
sample number 4 (September 1957) ,was very high, whereas the other 5 soil samples taken at
that time were negative for these organisms(Fourvelle,1958). The present study shows high
bacterial count in 10-1
being too numerous to count, the number decreasing further with dilution
factor 10-2
to 10-3
.
Biochemical test:
After Gram‘s staining, the two isolates K1, K2 and k3 are identified as gram positive
staphylococcus type of bacterium. Biochemical test results of two pure culture strains isolated
from fertilizer berth namely K1, K2 and K3 are tabulated below and figures were presented in
figure9.
(a) (b)

Table-13: Biochemical test results of K1, K2 and K3 isolates (part A)
Sl.no TEST K1 K2 K3
1 Lactose + - +
2 Xylose - - -
3 Maltose - + +
4 Fructose + - +
5 Dextrose + + +
6 Galactose + - -
7 Raffinose - - -
8 Trihalose - + +
9 Melibiose - - -
10 Sucrose - + +
11 L-Arabinose - - -
12 Mannose - -
13 Inulin - - -
14 Sodium gluconate - - -
15 Glycerol + - +
16 Salicin - - +
17 Dulcitol - - -
18 Arabitol - - -
19 Inositol - - -
20 Sorbitol - - -
21 Mannitol + - +
22 Adonitol - - -
23 α –Methyl-D-glucoside - - -
Fig9 (a-b): Biochemical test kit result
(c) (d)

24 Rhammose - - -
25 Cellobiose - - -
26 Melezitose - - +
27 α –Methyl-D-Mannoside - - -
28 Xylitol - - -
29 ONPG + - +
30 Esculin + - +
31 D-Arabinose + - -
32 Citrate utilization + + +
33 Malonate + + +
34 Sorbose - - -
35 control - - -
+: Positive
- : Negative
Gram staining:
The strains were identified as gram positive
Sl no TEST K1 K2 K3
1 ONPG + + +
2 Lysine utilisation - - -
3 Ornithine utilisation + + +
4 Urease + + +
5 Phenylalaninedeamination - + +
6 Nitrate reduction - - +
7 H2S production + - -
8 Citrate production + + +
9 Voges proskauer‘s + - +
10 Methyl red + - +
11 Indole - - -
12 Malonate + + +
Table-14: Biochemical test results of K1, K2and K3 isolates (part-B)

The number of Gram-negative rods isolated from the soil approximated the number of spore
formers taken (120/102). However, considerably more of the Gram-negative forms were found
in water (240/70) and the difference appears to be significant. Boyd and Boyd (1963) found
that Gram negative bacteria were predominant in arctic lake water. The present study reports
the gram positive bacteria were predominant in Koel River.
Identification of bacteria:
STRAIN1ExitSTRAIN1
FORCED MODE
1. Staphylococcus cohnii subsp. urealyticus ~ 81% (acc: 40%)
■■■■■■■■■■■■■■■■■■■■■■■■■■■■■■■■■■■■■■■■■■■■■■■
2. Staphylococcus felis ~ 81% (acc: 40%)
■■■■■■■■■■■■■■■■■■■■■■■■■■■■■■■■■■■■■■■■■■■■■■■
3. Staphylococcus pseudointermedius ~ 76% (acc: 40%)
■■■■■■■■■■■■■■■■■■■■■■■■■■■■■■■■■■■■■■■■■■■■■■■
4. Staphylococcus carnosus subsp. carnosus ~ 76% (acc: 40%)
■■■■■■■■■■■■■■■■■■■■■■■■■■■■■■■■■■■■■■■■■■■■■■■RESULTSS
STRAIN2
Library
1. Staphylococcus saprophyticus subsp. saprophyticus ~ 83% (acc: 40%)
■■■■■■■■■■■■■■■■■■■■■■■■■■■■■■■■■■■■■■■■■■■■■■■
Fig10: Stained picture of Staphylococcus

2. Staphylococcus auricularis ~ 80% (acc: 40%)
■■■■■■■■■■■■■■■■■■■■■■■■■■■■■■■■■■■■■■■■■■■■■■■
3. Staphylococcus aureus subsp. anaerobius ~ 78% (acc: 40%)
■■■■■■■■■■■■■■■■■■■■■■■■■■■■■■■■■■■■■■■■■■■■■■■
4. Staphylococcus warneri ~ 78% (acc: 40%)
■■■■■■■■■■■■■■■■■■■■■■■■■■■■■■■■■■■■■■■
STRAIN3
1. Staphylococcus simiae ~ 74% ( acc: 36%)
■■■■■■■■■■■■■■■■■■■■■■■■■■■■■■■■■■■■■■■■■■■■■■■
2. Staphylococcus nepalensis ~ 73% (acc: 36%)
■■■■■■■■■■■■■■■■■■■■■■■■■■■■■■■■■■■■■■■■■■■■■■■
3. Staphylococcus piscifermentans ~ 72% (acc: 36%)
■■■■■■■■■■■■■■■■■■■■■■■■■■■■■■■■■■■■■■■■■■■■■■■
4. Staphylococcus aureus subsp. aureus ~ 66% (acc: 38%)
■■■■■■■■■■■■■■■■■■■■■■■■■■■■■■■■■■■■■■■■■■■■■■■
The microorganisms play a vital role in determining the quality of soil. The microorganisms
identified from a small amount of sample are of staphylococcus sp.
Staphylococcus (family: Staphylococcaceae, Genus: Staphylococcus)
Staphylococcus (from the Greek: staphyle, "bunch of grapes" and kókkos, "granule") is a genus
of Gram-positive bacteria. Under the microscope they appear round (cocci), and form in grape-
like clusters.
The Staphylococcus (fig10) genus includes at least forty species. Of these, nine have two
subspecies and one has three subspecies. Most are harmless and reside normally on the skin and
mucous membranes of humans and other organisms. Found worldwide, they are a small
component of soil microbial flora.

Collection of phytoplankton:
Fig12: Collection of phytoplankton
with the help of phytoplankton net
Fig13: Phytoplankton net
Fig11: Staphylococcus colony

Identification of phytoplankton
Table14: Name of organism and their abundance
Sl no Name of organism abundance
1 Spirogyra D
2 oscillatoria D
3 Chromolina ovalis D
4 Diatoms SD
5 Scendusmus dimorphus SD
6 Nostoc R
7 Chrysococcus cornuta R
8 Penium sylvanigra R
D: Dominant
SD: Sub Dominant
R: Rare
Fig14: Collected Phytoplankton

Spirogyra (Family: Zygnemataceae, Genus: spirogyra)
Spirogyra is a genus of filamentous green algae of the order Zygnematales, named
for the helical or spiral arrangement of the chloroplasts that is diagnostic of the genus. It is
commonly found in freshwater areas, and there are more than 400 species of Spirogyra in the
world. Spirogyra measures approximately 10 to 100μm in width and may stretch centimeters
long. This particular algal species, commonly found in polluted water, is often referred to as
"pond scum"(fig15).
2. Oscillatoria (Family: Oscillatoriaceae, Genus: Oscillatoria)
Oscillatoria is a genus of filamentous cyanobacterium which is named for
the oscillation in its movement. Filaments in the colonies can slide back and forth against each
other until the whole mass is reoriented to its light source. It is commonly found in watering-
troughs waters, and is mainly blue-green or brown-green. Oscillatoria is an organism that
reproduces by fragmentation. Oscillatoriaforms long filaments of cells which can break into
fragments called hormogonia. The hormogonia can grow into a new, longer filament. Breaks in
the filament usually occur where dead cells (necridia) are present. Oscillatoria uses
Fig15: Spirogyra
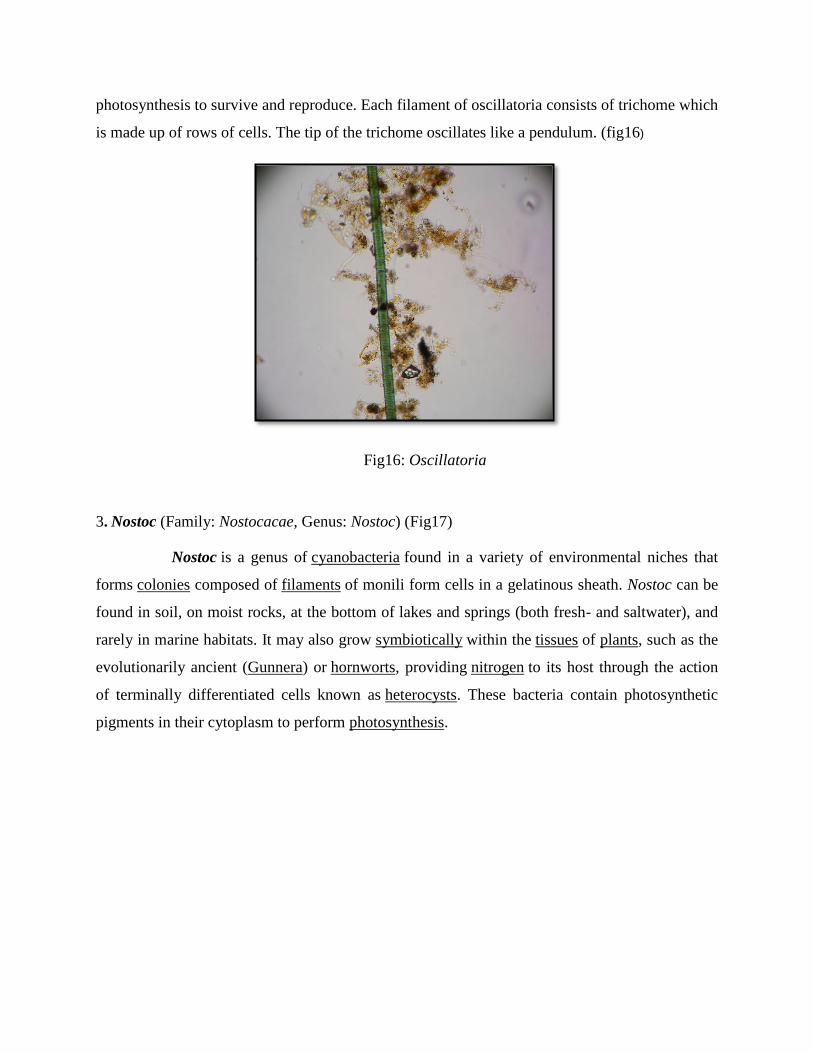
photosynthesis to survive and reproduce. Each filament of oscillatoria consists of trichome which
is made up of rows of cells. The tip of the trichome oscillates like a pendulum. (fig16)
3. Nostoc (Family: Nostocacae, Genus: Nostoc) (Fig17)
Nostoc is a genus of cyanobacteria found in a variety of environmental niches that
forms colonies composed of filaments of monili form cells in a gelatinous sheath. Nostoc can be
found in soil, on moist rocks, at the bottom of lakes and springs (both fresh- and saltwater), and
rarely in marine habitats. It may also grow symbiotically within the tissues of plants, such as the
evolutionarily ancient (Gunnera) or hornworts, providing nitrogen to its host through the action
of terminally differentiated cells known as heterocysts. These bacteria contain photosynthetic
pigments in their cytoplasm to perform photosynthesis.
Fig16: Oscillatoria

4. Diatoms (class: Bacillariophyceae)
Diatoms are a major group of algae, and are one of the most common types
of phytoplankton. Most diatoms are unicellular, although they can exist as colonies in the shape
of filaments or ribbons (e.g. Fragillaria), fans (e.g. Meridion), zigzags (e.g. Tabellaria), or
stellate colonies (e.g.Asterionella). Diatoms are producers within the food chain. A characteristic
feature of diatom cells is that they are encased within a unique cell wall made of silica (hydrated
silicon dioxide) called a frustule. These frustules show a wide diversity in form, but usually
consist of two asymmetrical sides with a split between them, hence the group
name. Fossil evidence suggests that they originated during, or before, the early Jurassic Period.
Diatom communities are a popular tool for monitoring environmental conditions, past and
present, and are commonly used in studies of water quality.
5. Scenedesmus dimorphus (class: chlorophyceae)
Scenedesmus dimorphus is a freshwater unicellular algae in the class Chlorophyceae. The name
means "having two forms. (fig18)
Fig17: Nostoc
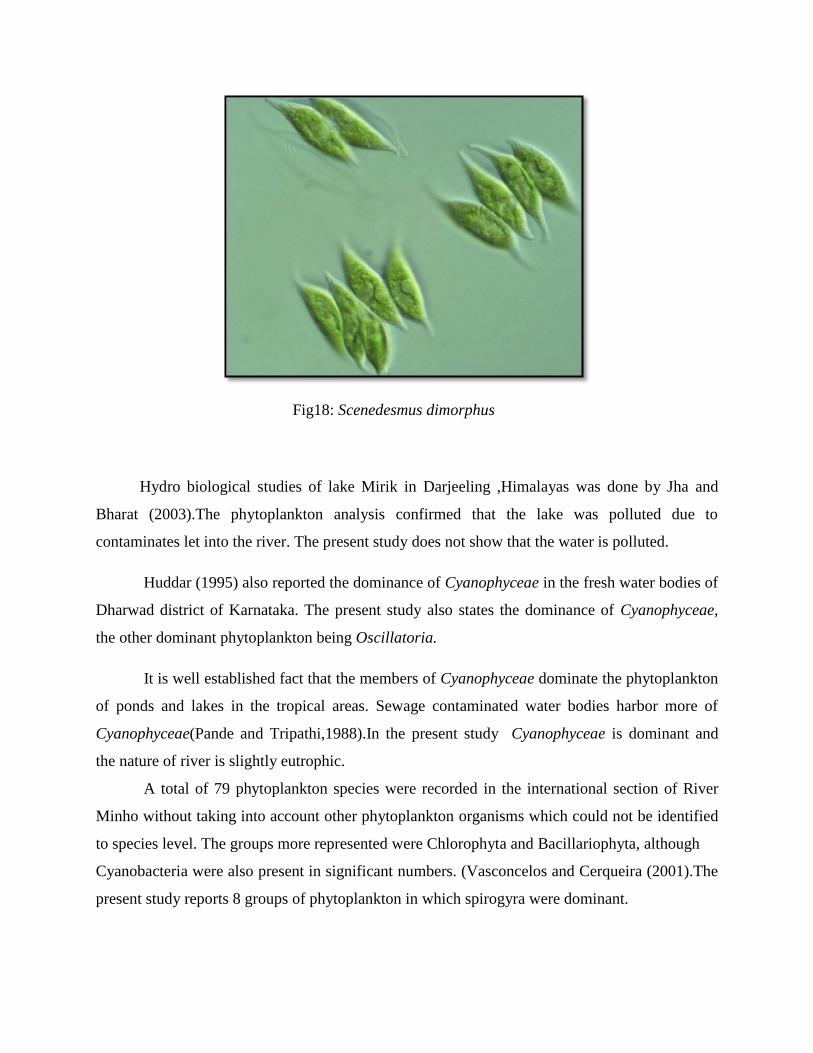
Hydro biological studies of lake Mirik in Darjeeling ,Himalayas was done by Jha and
Bharat (2003).The phytoplankton analysis confirmed that the lake was polluted due to
contaminates let into the river. The present study does not show that the water is polluted.
Huddar (1995) also reported the dominance of Cyanophyceae in the fresh water bodies of
Dharwad district of Karnataka. The present study also states the dominance of Cyanophyceae,
the other dominant phytoplankton being Oscillatoria.
It is well established fact that the members of Cyanophyceae dominate the phytoplankton
of ponds and lakes in the tropical areas. Sewage contaminated water bodies harbor more of
Cyanophyceae(Pande and Tripathi,1988).In the present study Cyanophyceae is dominant and
the nature of river is slightly eutrophic.
A total of 79 phytoplankton species were recorded in the international section of River
Minho without taking into account other phytoplankton organisms which could not be identified
to species level. The groups more represented were Chlorophyta and Bacillariophyta, although
Cyanobacteria were also present in significant numbers. (Vasconcelos and Cerqueira (2001).The
present study reports 8 groups of phytoplankton in which spirogyra were dominant.
Fig18: Scenedesmus dimorphus
CONCLUSION
The water of Koel River is alkaline as observed from the experiments. The soil was found out to
be of clay type. Isolated bacteria were identified to be Staphylococcus cohnii subsp. urealyticus,
Staphylococcus saprophyticus subsp. saprophyticus, Staphylococcus simiae. The abundant
phytoplankton is Spirogyra followed by Oscillatoria. These organisms can be used to maintain
the quality of water supply from Koel River. The microbial studies can be utilized for the
prevention of any pathogenic diseases caused by the microbes of this river. Regular check up of
the aquatic life can help in maintaining ecological balance of Koel River. The analysis of soil
texture can be helpful for the farmers in their irrigation and vegetation purpose.

REFERENCES
1. Baroni, L. Cenci, L. Tettamanti, M. Berati, M. (2007). "Evaluating the environmental
impact of various dietary patterns combined with different food production systems".
European Journal of Clinical Nutrition 61, 2, 279–286.
2. Birkeland, Peter W. ―Soils and Geomorphology‖, 3rd Edition. New York, Oxford
University Press, 1999.
3. Boyd.W.L and Boyd.J.W (1963). ―A bacteriological study of an Arctic Coastal
Lake‖. Ecology 44, 705-10.
4. Buol S.W., Hole .F. D. and McCracken, R. J. (1973), ―Soil Genesis and
Classification‖, First Edition. Ames, IA: Iowa State University Press.
5. Chesworth Edited by Ward (2008), ―Encyclopedia of soil science‖, Dordrecht,
Netherland.
6. Collier, A., Ray.S.M. Magnitzky A. W and. BELL J. 0. (1953). ―Effect of dissolved
organic substances on oysters‖. U.S. Fish Wildlife Serv., Fishery Bull. 54, 167-185.
7. Das S.K. (2002), ―Primary production and Zooplankton biodiversity in brackish water
shrimp culture pond‖.J.Ecobiol, 14, 4, 267-271.
8. Fournelle.H.J. (1958), “Soil and Water Bacteria in the Alaskan Subarctic Tundra‖.
9. http://www.usaweekend.com
10. Huddar. B.D. (1995). ―Hydro Biological studies in Lentic fresh water bodies of
Hugli‖ Ph.D., Thesis submitted to Karnataka University, Dharwad. 267 pages.

11. Jha, P., and Barat, S., (2003). Hydro biological study of lake Mirik in Darjeeling,
Himalayas. J. Environ. Biol, 24, 3, 339-344.
12. Lomborg and Bjorn (2001). The Skeptical Environmentalist. Thesis submitted to
Cambridge University. 22pages.
13. Margalef. R. (1983). Limnologia. Ed. Omega, Barcelona.
14. Paerl, H.W. (1991). Growth and reproductive strategies of fresh water blue green
algae (Cyanobacteria). 261-315.
15. Paerl, H.W., P.T. Bland, H.H. Blackwell, & N.D. Bowles, (1984). The sects of
salinity. 46 pages.
16. Pande, S.N., and Tripathi, A.K. (1988) Studies on algae of polluted ponds of Kanpur
(India) VIII .Role of Blue Green Algae Phykos.27, 38-43.
17. Poteiztiul of blue-green algal (Microcystis aeruginosa) bloom. Univ. N.C. Sea Grant
Program Working Paper, 4-1.
18. River definition from Merriam-Webster, Accessed February, 2010.
19. Sukumaran, P.K., Raghavan, S.L. & Rahman, M.F., (1984). ―Observations of
physiochemical conditions of water and plankton of two tanks in Malnad region of
Karnataka‖. J. Inland Fish. Soc. India. 16, 1 & 2, 53-55.
20. Sunkad, B.N., and Patil, H.S., (2004) ―Water Quality Assessment of fort Lake of
Belgaum (Karnataka) with special reference to Zooplankton‖. J.Environ.Biol.25, 1,
99-102.
21. Vasconcelos .V. and Cerqueira .M. (2001). ―Phytoplankton Community of River
Minho‖. (International Section). Lemnetica. 20, 1, 135-141.
22. Vasconcelos, V.M., M.M. Cerqueira & M.Coelho (2000).Plano de Bacia do Rio
Minho, Diagnostico, Inventario e analise do situacao no Rio minhn. Fitoplancton e
zooplacton. 46 pages.
23. "CIA- The world fact book". Central Intelligence Agency. Retrieved 2008-12-20.
24. "United Nations". Un.org. 2005-03-22. Retrieved 2010-07-25.
25. Voroney, R.P., (2006). ‖The Soil Habitat in Soil Microbiology, Ecology and
Biochemistry‖.
26. Water Vapor in the Climate System, Special Report, [AGU], December 1995.
27. Wright, R. T., and J. E. Hobbie. (1966). ―Use of glucose and acetate by bacteria and
algae in aquatic ecosystems‖. Ecology, 47, 447-464.