microbial removal evaluation for nok’s hollow fiber ... · microbial removal evaluation for...
TRANSCRIPT

Microbial Removal Evaluation For
NOK’s Hollow Fiber Membrane Technology
Date:
September 20, 2002
Prepared for:
NOK Incorporated
Plymouth, Michigan, USA
Project Manager:
Philip C. Olsen Midwest Water Engineering, LLC
East Bethel, Minnesota, USA
Principle Investigator:
Debra E. Huffman Ph.D. University of South Florida St. Petersburg, Florida, USA
1
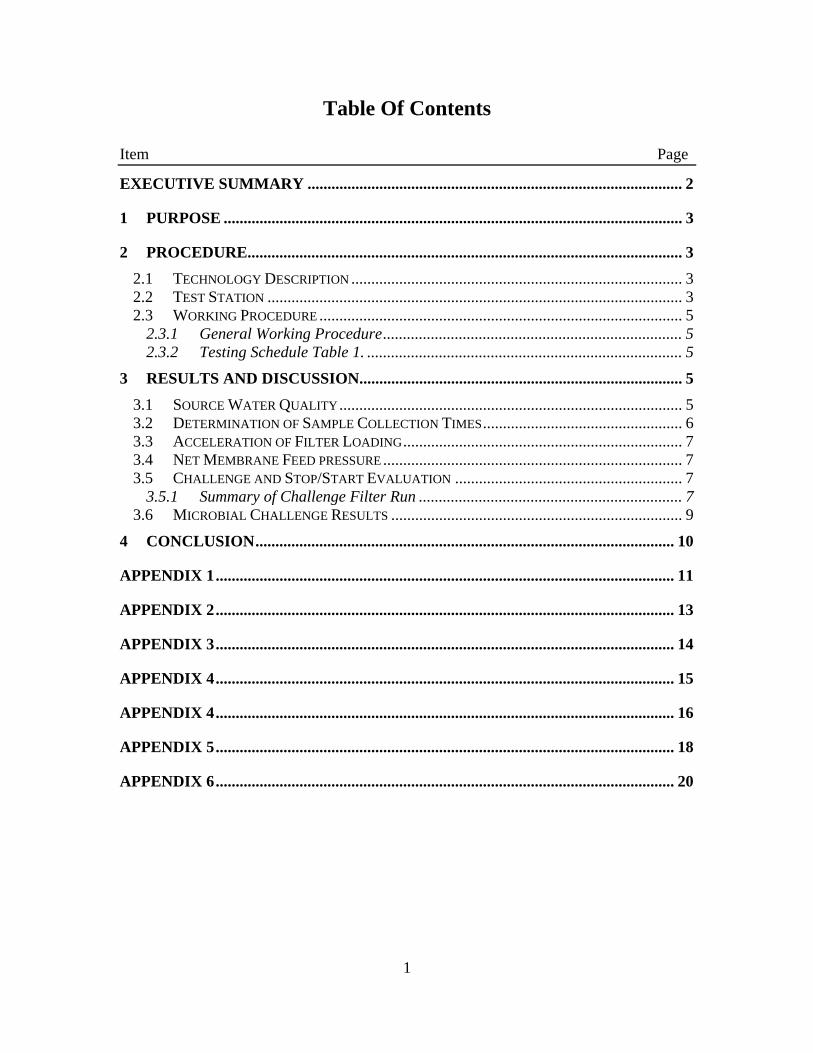
Table Of Contents Item Page
EXECUTIVE SUMMARY .............................................................................................. 2
1 PURPOSE ................................................................................................................... 3
2 PROCEDURE............................................................................................................. 3 2.1 TECHNOLOGY DESCRIPTION ................................................................................... 3 2.2 TEST STATION ........................................................................................................ 3 2.3 WORKING PROCEDURE ........................................................................................... 5
2.3.1 General Working Procedure........................................................................... 5 2.3.2 Testing Schedule Table 1. ............................................................................... 5
3 RESULTS AND DISCUSSION................................................................................. 5 3.1 SOURCE WATER QUALITY...................................................................................... 5 3.2 DETERMINATION OF SAMPLE COLLECTION TIMES.................................................. 6 3.3 ACCELERATION OF FILTER LOADING...................................................................... 7 3.4 NET MEMBRANE FEED PRESSURE ........................................................................... 7 3.5 CHALLENGE AND STOP/START EVALUATION ......................................................... 7
3.5.1 Summary of Challenge Filter Run .................................................................. 7 3.6 MICROBIAL CHALLENGE RESULTS ......................................................................... 9
4 CONCLUSION......................................................................................................... 10
APPENDIX 1................................................................................................................... 11
APPENDIX 2................................................................................................................... 13
APPENDIX 3................................................................................................................... 14
APPENDIX 4................................................................................................................... 15
APPENDIX 4................................................................................................................... 16
APPENDIX 5................................................................................................................... 18
APPENDIX 6................................................................................................................... 20
2
Microbial Removal Evaluation For NOK’s Hollow Fiber
Membrane Technology
-Executive Summary- NOK hollow fiber membrane technology (average pore size of 1 micron) was tested in accordance to the Draft NSF Mechanical Microbiological Reduction Protocol with slight modifications. The test unit evaluated at the University of South Florida (USF) maintained greater than 6 log10 reduction in Klebsiella terrigena bacteria in the effluent water compared to the influent water throughout the duration of testing. No Klebsiella terrigena were detected in any of the effluent water samples collected. Removal efficiency was based upon the limit of sensitivity of the assay, which was 6 log10. Viable Cryptosporidium parvum oocysts were reduced by greater than 4 log10 at the limit of sensitivity of the assay. These removal efficiencies exceed the Environmental Protection Agency (EPA) Guide Standard and Protocol (USEPA GS&P) performance criteria for removal of bacteria and protozoa. Bacteriophage PRD-1 (utilized as a surrogate for enteric viruses) was reduced by 0.3 to 1.1 log10 over the course of the filter testing.

3
1 Purpose To evaluate microbial removal performance of the NOK hollow fiber (HF) membrane technology using the current NSF task force draft protocol with modifications.
2 Procedure 2.1 Technology Description Microbial removal performance of NOK’s 0.1 micron polysulfone HF membrane technology was evaluated with their membrane material potted within a 10” cartridge with a 222 O-ring seal installed within an appropriate filter housing.. Hydraulic configuration provides for collection of filtered water within the lumen of each HF strand. Total membrane area within cartridge was 2.2 m2 and pore size was 0.1 µm. Inside/outside diameter of hollow fiber strands was 0.2/0.4 mm. Filtrate flow through the cartridge was established at a continuous 2.0 + 0.1 gallons per minute (gpm). Initial head loss @ 2 gpm = 7.6 pounds per square inch (psi). While maximum specified terminal head loss for the NOK membrane is 0.9 MPa (130.5 psi), original equipment manufacturers of water treatment systems suggested that terminal head loss for this performance evaluation be identified as 30 psi over initial head-loss measured at the start of the filter run. Given that start-up pressure was measured at 7.6 psi, terminal head loss was defined as 37.6 psi for this evaluation. One cartridge/housing was evaluated for Klebsiella terrigena, Cryptosporidium parvum and bacteriophage PRD-1 removal. 2.2 Test Station A test station (refer to Figure 1) was constructed to control/measure the following operational and challenge test variables: • Chlorine removal from source water (St. Petersburg tap water). • Suspended particle removal (> 5 micron) from de-chlorinated source water. • Fine control of membrane inlet pressure and filtrate flow rate. • Introduction of test organisms into the de-chlorinated, filtered source water at a
controlled and non-pulsating flow rate of 150 mL per minute (mL/Min). • Production and continuous mixing of filter plugging slurry (FPS). • Injection of FPS in de-chlorinated, filtered source water at a controlled and non-
pulsating flow rate of less than 1 gpm. • Measurement of flow rates for:
o Filtrate o FPS feed o Test organism solution feed
• Measurement of pressure for: o Tap water feed o Booster pump inlet/outlet

4
o Filtered/De-chlorinated water feed o FPS feed o Membrane inlet (outlet was subjected to 2 feet of head pressure, or 0.9 psi)
FIGURE 1
Test Station for NOK Membrane Technology Microbial Contaminant Removal Evaluation
= Pressure Gauge
= Metering Valve
Tap Water
5 - Micron Filter
Activated Carbon
Pump
Sample Tap
Injection Venturi
Microbes
Stir Plate
Flow Meter
Surry Tank
Pump Nozzle
Check Valve
Flow Meter
To Waste (atmosphere)
Flow Meter
NOK Membrane
Sample Tap
Sample Tap

5
2.3 Working Procedure 2.3.1 General Working Procedure General working procedure can be found in Appendix 1. 2.3.2 Testing Schedule Table 1.
Table 1 - Testing schedule and Procedure Filter #834
Day Date Procedure Microbiological Test Wednesday 8/21/02 Filter Testing Initiated 1:16 PM Wednesday 8/21/02 1:17:10 PM 150 mL/Min
Injection of Seeded Challenge Solution Klebsiella/Cryptosporidium PRD-1
Wednesday 8/21/02 1:50:00 ATD added to influent stream
Wednesday 8/21/02 2:17:40 50% head loss Injection of Seeded Challenge Solution
Klebsiella/Cryptosporidium PRD-1
Wednesday 8/21/02 2:37:10 75% head loss Start-Stop initiated
Klebsiella/Cryptosporidium PRD-1
Wednesday 8/21/02 2:51:00 90% headloss Injection of Seeded Challenge Solution
Klebsiella/Cryptosporidium PRD-1
Wednesday 8/21/02 End of Challenge Study
3 Results and Discussion 3.1 Source Water Quality
De-chlorinated St. Petersburg municipal drinking water was used for during this performance evaluation. Measured water quality parameters were as follows:
Parameter Concentration Hardness 122 mg/L Alkalinity 110 mg/L Arsenic 3.3 µg/L Barium 0.01 mg/L Fluoride 0.73 mg/L Iron 0.03 mg/L Nitrate 0.06 mg/L pH 7.37 Sodium 6.4 mg/L

6
Free Chlorine Residual The absence of free chlorine was verified at a sample point located between the activated carbon filter and the five-micron filter (refer to figure 1). Sample analysis was conducted with the use of a HACH digital colorimeter model # 46700-00. Colorimeter was factory calibrated to 0.00 to 1.50 A (absorbance) + 2%. Two-point linier calibration was performed previous to analysis. 3.2 Determination of Sample Collection Times
To determine the length of time required between the point in time challenge microbes are injected into the test station and samples can be drawn from filter influent and effluent streams for performance evaluation a NaCL tracer test was conducted. The tracer test included the use of a sodium chloride brine solution injected into the membrane influent stream at the same injection point the challenge microbes. The brine solution was introduced into the membrane influent stream at the same continuous flow rate established for injection of microbes (150 ml/min). Previous to brine injection background total dissolved solids were measured. Total dissolved solids were measured with a conductivity meter from the membrane test station effluent sample collection point effluent stream upon the start of brine injection and thereafter at ten second intervals. Resultant data are represented in Figure 2. Based upon these data, sample collections during microbial challenges were taken from the test station effluent stream no sooner than 2 minutes after the start of microbe injection within the influent stream.
FIGURE 2
Seed Injection Tracer Test
0
200
400
600
800
1000
0 20 40 60
Time (seconds)
Tota
l Dis
solv
ed S
olid
s (T
DS)
TDS
7
3.3 Acceleration of Filter Loading
In order to conduct microbial challenge testing within a finite time period, the duration of the filter run was accelerated with the use of Arizona Test Dust. This task was accomplished by mixing the test dust with membrane filtrate within an atmospheric tank subjected to continuous mixing. The resultant turbid solution was injected into the test station influent stream at a flow rate of < 1 gpm to accelerate test membrane loading. Total flow rate through the NOK membrane during test dust feed was controlled at 2 gpm. 3.4 Net Membrane Feed pressure Pressure differential across the NOK membrane was determined by comparing measured values of inlet pressure (pressure gauge) against outlet pressure (calculated from vertical rise of the 5/8” inside diameter x 3’ long effluent hose. Friction loss @ 2 gpm through the effluent hose was negligible and not accounted for. Measured deviation was - 0.5 psi at 25-psi line pressure. National Institute of Standards and Technology (NIST) gauge measurement was 25 psi; test station gauge measurement was 25.5. The effluent pressure was subtracted from the inlet pressure to calculate net pressure differential. Accuracy of the inlet pressure gauge was compared against a NIST traceable gauge and the net pressure differential was adjusted to account for measured deviation.
Measured inlet pressure at start-up = 9.0 psi Effluent Vertical Head = 2’ = - 0.9 psi Pressure Gauge Deviation = - 0.5 psi Net Pressure differential = 7.6 psi
3.5 Challenge and Stop/Start Evaluation
3.5.1 Summary of Challenge Filter Run (refer to Figure 3) The first microbial challenge was conducted at the beginning of the filter run when pressure differential across the filter was 7.6 psi. For testing purposes, this point of the filter-run was defined as "zero head loss". Terminal head loss was defined as 30 psi greater than the initial pressure measurement (refer to 2.1). Accordingly, expression of resultant performance data within figure 3 suggest a filter run characterized as a starting pressure drop of 0 psi and terminating at 30 psi. Whereas actual measurements were 7.6 psi and 37.6 psi, respectively. After the 0 head-loss challenge, Arizona Test Dust (ATD) was introduced to minimize the period of time required to reach the next scheduled microbial challenge defined at 50% of terminal head-loss, or 15 psi). After the 50% head-loss challenge, more ATD was added until 75% head-loss was achieved where the flow of water through the membrane was stopped for approximately 2

8
seconds and then resumed at the targeted flow rate of 2 gpm. Samples were collected of the filter effluent stream immediately after resumption of flow. This sample was analyzed for the presence of challenge organisms to determine if any break-though occurred as a result of a stop-start hydraulic episode. It was noted that it was very difficult to control the filter's pressure differential in response to ATD injections as terminal head loss approached. This was especially problematic as ATD was injected into the filter influent stream to increase pressure differential from approximately 20 psi to 22.5 psi (75% head-loss) for the stop-start evaluation. Pressure differential increased to almost 90% of terminal head loss before filter effluent samples could be taken. It should also be noted that pressure differential significantly decreased after the stop-start episode. It is believed this is attributed by particles, previously held within membrane filter pores solely as function of pressure differential between the influent and effluent side of the membrane, being released when influent/effluent pressure were equalized during cessation of flow. Shortly after the stop-start evaluation 90% head-loss was achieved and the last microbial challenge was conducted and the test completed.
FIGURE 3
Summary of Challenge Filter Run
0
5
10
15
20
25
30
0 10 20 30 40 50 60 70 80 90
Time (minutes)
Net
Filt
er H
ead-
Loss
(PS
I)
0102030405060708090100
Per
cent
Hea
d Lo
ss o
f D
efin
ed T
erm
inal
(%)
Delta P
Stop/Start Evaluation (22.5 psi)
90% Head-Loss Challenge (27.0 psi)
0% Head-Loss Challenge (0 psi)
50% Head-Loss Challenge (15 psi)
9
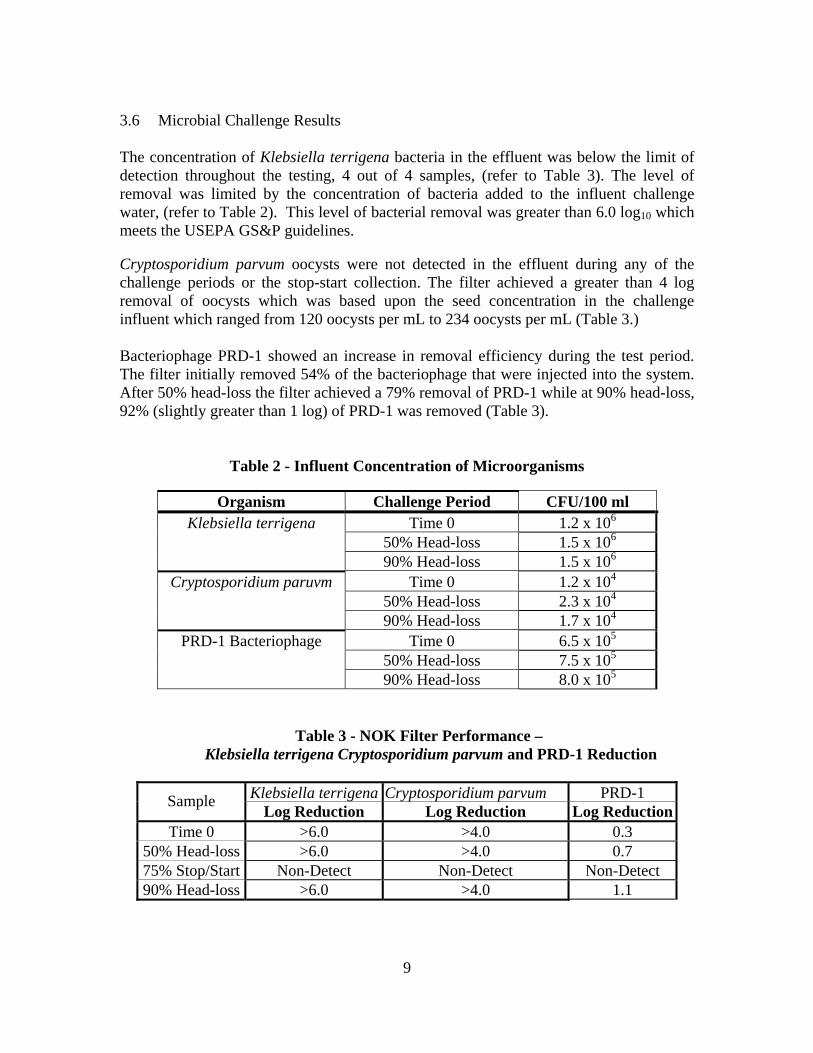
3.6 Microbial Challenge Results The concentration of Klebsiella terrigena bacteria in the effluent was below the limit of detection throughout the testing, 4 out of 4 samples, (refer to Table 3). The level of removal was limited by the concentration of bacteria added to the influent challenge water, (refer to Table 2). This level of bacterial removal was greater than 6.0 log10 which meets the USEPA GS&P guidelines. Cryptosporidium parvum oocysts were not detected in the effluent during any of the challenge periods or the stop-start collection. The filter achieved a greater than 4 log removal of oocysts which was based upon the seed concentration in the challenge influent which ranged from 120 oocysts per mL to 234 oocysts per mL (Table 3.) Bacteriophage PRD-1 showed an increase in removal efficiency during the test period. The filter initially removed 54% of the bacteriophage that were injected into the system. After 50% head-loss the filter achieved a 79% removal of PRD-1 while at 90% head-loss, 92% (slightly greater than 1 log) of PRD-1 was removed (Table 3).
Table 2 - Influent Concentration of Microorganisms
Organism Challenge Period CFU/100 ml Klebsiella terrigena Time 0 1.2 x 10⁶
50% Head-loss 1.5 x 10⁶ 90% Head-loss 1.5 x 10⁶
Cryptosporidium paruvm Time 0 1.2 x 10⁴ 50% Head-loss 2.3 x 10⁴ 90% Head-loss 1.7 x 10⁴
PRD-1 Bacteriophage Time 0 6.5 x 10⁵ 50% Head-loss 7.5 x 10⁵ 90% Head-loss 8.0 x 10⁵
Table 3 - NOK Filter Performance – Klebsiella terrigena Cryptosporidium parvum and PRD-1 Reduction
Klebsiella terrigena Cryptosporidium parvum PRD-1 Sample
Log Reduction Log Reduction Log ReductionTime 0 >6.0 >4.0 0.3
50% Head-loss >6.0 >4.0 0.7 75% Stop/Start Non-Detect Non-Detect Non-Detect 90% Head-loss >6.0 >4.0 1.1
10
4 Conclusion The NOK hollow fiber membrane, as configured within a 2 ½ inch x 10 inch cartridge and appropriate filter housing, was capable of meeting the microbial requirements set forth in the USEPA GS&P for bacteria and protozoa. The NOK HF membrane consistently reduced the bacterial load by greater than 6.0 log10 while achieving greater than 4.0 log10 reduction in Cryptosporidium parvum oocysts. NOK did not predict significant log10 reductions for viruses but desired to quantify actual removal capabilities. Further, there was no evidence of any of the above organisms in the effluent stream after subjecting the membrane to the hydraulic shock caused by instantaneous cessation and resumption of flow across the membrane.
11
Appendix 1
General procedure for USF Trials
Acceleration of test filter loading. In order to conduct microbial challenge testing within a finite time period, filter runs were accelerated with the use of Arizona Fine test dust. This task was accomplished by mixing the test dust with membrane filtrate within an atmospheric tank subjected to continuous mixing. The resultant turbid solution was injected into the test station influent stream at a flow rate of < 1 gpm to accelerate test filter loading. Total flow rate through the NOK filter during test dust feed was controlled at 2 gpm. Specifications and particle distribution analysis of the Arizona Fine Test Dust (fraction 0-5), lot number 5057C are included in Appendix 6.
1. 2. Challenge testing was performed using bacteria Klebsiella terregina ATCC 33257
Cryptosporidium parvum oocysts and PRD-1 (provided by the University of Arizona).
Lab and analytical procedures used are found in the following appendices: Appendix 2 “Protocol for testing NOK unit, Microbiological Challenge Test” Appendix 3 “Bacterial challenge testing procedure”
Appendix 4 “PRD testing procedure” Appendix 5 “Protozoan challenge testing procedure”
3. The microbial challenge was carried out in the microbiological laboratory at the
University of South Florida in St. Petersburg, Florida
4. The test water was de-chlorinated, filtered (5 micron nominal) St. Petersburg tap water
5. Bacteria, oocysts and bacteriophage were added to the challenge water
immediately before the filter was challenged with the microorganisms.
6. The filter was challenged with approximately 1/2 liter of seeded water injected into the influent stream at a flow rate of 150 + 5 ml/min through a venturi system. Injection rate was established by controlling pressure differential across the venturi. Air was prevented from entering the microbe injection stream.
7. All filter influent and effluent samples were collected in sterile one-liter
containers. The effluent samples were tested as followed: • 3x 100 ml for detection of Klebsiella terregina

12
• 2x 1 ml for detection of PRD-1 • 2x 100 mL for detection of Cryptosporidium parvum
If sample was expected to contain high levels of microorganisms, the sample was
diluted to achieve countable numbers microbes in each plate ( 20-300 organisms)/ plate or membrane).
13
Appendix 2
Protocol for testing “NOK” unit Microbiological challenge test
1. General
1.1. Install the unit according to operating procedure. 1.2. Prepare 1 liter of challenge water
2. Challenge procedure
2.1. Pass influent challenge water through the unit for 3 minutes 2.2. Collect influent and effluent samples for detection of Klebsiella terregina,
C. parvum and PRD-1 according to test procedure ( Appendices 4,5,6) 3. Equipment
3.1. General microbiological laboratory equipment. 3.2. Sterile 5, 10, 50 ml pipettes. 3.3. 10-50 ml sterile containers. 3.4. Specific equipment for Klebsiella terregina, C. paruvm and PRD-1 is
described in assay method. 4. Procedure
4.1. Prepare 1 liter of challenge Bacteria & protozoa and bacteriophage preparation 4.2. Pass ½ liter of the above challenge water thought the system 4.3. Collect influent (50mL) and effluent samples (1 liter) at the following sample
points:
Time 0 50% Ηead-loss 75% Head-loss/ Stop-Start 90% Head-loss Assay samples directly upon completion of collection
14
Appendix 3 Bacterial challenge test procedure
Klebsiella terregina General The following is a general protocol that was follow during testing 1. Procedure
1.1. Bacteria 1.1.1. Klebsiella Terrgina ATCC 33257
1.2. Materials 1.2.1. Bacterial growth medium
1.2.1.1.Tryptic soy agar (TSA) – Used for growth of stock challenge bacteria. 1.2.1.2.M Endo Less agar – Used as selective media for detection of
Klebsiella terrgina. 1.2.2. Buffer solution
1.2.2.1.For bacterial stock suspension and bacterial dilution. PBS pH 7.2-7.4
1.2.2.2.Challenge water as required according to the protocol. 1.2.3. Equipment
1.2.3.1.Standard microbiological laboratory sterile equipment: 1.2.3.2.Tube 1.2.3.3.containers, pipettes, forceps 1.2.3.4.10 µl loops 1.2.3.5.petri dish 50mm diameter ( m Endo les), 90mm diameter ( TSA) 1.2.3.6.filtration funnel 1.2.3.7.standard membrane 0.45µ for bacterial detection in water.
1.3. Procedure
1.3.1. Preparation of stock bacteria 1.3.1.1.One day before the challenge inoculate the bacteria over night at 35-
37° 1.3.1.2.C±1 on TSA plate.
1.3.2. Preparation of bacterial challenge 1.3.2.1.Prepare the required volume of bacterial suspension at density of 0.25-
.3 O.D (at 625mn) in saline. 1.3.2.2.Harvesting few over night colonies into the tube containing saline. 1.3.2.3.Mix well the suspension to avoid bacterial aggregates.
1.3.3. Remove approximately 20 ml of TW into a sterile tube. 1.3.4. Add to the above tube 1.5 ml suspension / Liter TW. Mix well
1.3.4.1.This yield 1-3.0E+05 CFU/ml 1.3.5. Pour the tube contents into the TW and mix well.
15
1.4. Bacterial density confirmation 1.4.1. Make dilution of the challenge water sample to achieve
20-200 CFU\plate. 1.4.2. Inoculate 100µl of the appropriate dilution on m-Endo les agar. 1.4.3. Inoculate with sterile loop 10 µl of the challenge water sample directly on
the selective culture media. 1.4.4. Incubate for 24-48 hours at 35°C and read the results. 1.4.5. Count CFU on plate calculate CFU/ml from the plates that yield CFU at
the required stage. 2. Challenge test sample
2.1. collect the required volume according to the test procedure. 2.2. filter the sample effluent through 0.45µ membrane.
2.2.1. When small volume sample is tested (less then 15 ml) add sterile Phosphate buffer prior to filtration to the sample tube or to the filtration funnel.
2.3. Transfer the membrane to m Endo less agar. 2.4. incubate the all plates at 35°C±1 for 24 -48 2.5. Count CFU/ plate.
3. Calculation
CFU/ ml in the challenge = average CFU/plate on Bacterial concentration conformation X dilution factor inoculated volume Total bacterial load in challenge (TBL)= Challenge volume (ml) X CFU/ ml in the challenge Log reduction Log 10 (TBL/ average CFU in 100 ml effluent) X (challenge volume in ml/100)
16
Appendix 4 Bacteriophage challenge test procedure
PRD-1 1. EQUIPMENT Standard sterile laboratory equipment:
• Pipettes • 90 mm diameter petri dishes • Glass autoclaveble 20 ml tubes • Disposable tubes • Fine pipettes, tipes 10µl-1000µl sterile • water bath at 47-49°C
2. MEDIA AND SOLUTION
• Tryptic soy broth (TSB)- • Tryptic soy agar (TSA)- 90 mm plates with about 15 ml solid TSA • 3 ml melted TSA in 20 ml tubes at 47-49 °C in water bath • Phosphate buffer pH 7.2±0.2 sterile.
3. BACTERIA AND PHAGE
• S. typhimurium - Host bacteria • PRD-1 bacteriophage stock.
4. PROCURED 4.1 Preparation of host bacteria
4.1.1 stage 1 This stage is done one day previous to the test. Inoculate 1 colony of S. typhimurium in 10-15 ml TSB. Incubate the suspension at 35°C±2 over night. 4.1.2 stage 2 This stage is done about 3-4 hours prior the assay. •Diluted the over night suspension: 1 ml suspension to about 20 ml fresh TSB. •Incubate the diluted bacteria at 35°C.
4.2 Preparation of PRD-1 seeded water
•Add to the tested challenge water the required volume of PRD-1 bacteriophage to achieve the required concentration of not less then 1 X 10⁴ PRD-1 /ml. •The calculation is to be done according to the following:
Required volume PRD-1 stock to be added to the water = (A/B) X C A= PRD-1 concentration required in the seeded water B=PRD-1 titer in stock C= Seeded water volume.
17
4.3 Sample Testing
4.3.1 add 100µl of S. typhimurium suspended culture stage 2 to TSA melted tube. Leave the inoculated TSA tube in the water bath (not to exceed 3 min.) This stage is to be done immediately before the assay.
4.3.2 Sample Dilution
•Each plate contains 1 ml tested sample. •In order to achieve accuracy in the results counting each PRD-1 inoculated plate should yield 20-300 plaque forming unite (PFU)/plate. •Samples that may be loaded with higher PFU/ ml are to be diluted. All dilution are done in sterile phosphate buffer pH 7.2±0.2 •Samples that the PFU/ml is unknown are to be tested in few dilutions. •All dilution are to be done immediately before the assay.
4.3.3 Controls
• Influent- influent PRD concentration evaluation. •Fresh PRD stock is to be diluted to the appropriate concentration and tested in each test as a QC control for the laboratory procedure.
4.3.4 Each sample/ dilution is tested in duplicate
•Add 1 ml tested sample (in the appropriate dilution) to the TSA inoculated tube. • Mix well immediately, using vortex, and pure the content over TSA plate. • Rock the TSA plate to achieve complete cover of the plate surface. • allow plate to solidify • Incubate the plates inverted at 35-37°C for 18-24 hours.
5. RESULTS 5.1 Count PFU/plate. 5.2 Calculate PFU/plate for each sample from the dilutions that yielded 20-200
PFU/plate. 5.3 Calculate PFU/ml in the sample according to: PFU/ml sample = average PFU/plate X dilution factor 5.4 Calculate log PRD-1 reduction:
Log reduction = LOG 10 (average PFU per ml in challenge water
average PFU per ml in challenge water)
18
Appendix 5 Microbiological Examination of water:
Cryptosporidium parvum 1. EQUIPMENT Standard sterile laboratory equipment:
• Pipettes • Hoeffler Manifold • 0.22 micron nitrocellulose filters
2. BUFFER SOLUTION
• Phosphate buffer pH 7.2±0.2 sterile
3. PROCEDURE 3.1 Preparation manifold
• Nitocellulose membranes are wetted in phosphate buffer • Wetted filters are placed onto manifold • Sterilized manifold weights are placed on top of filter membranes • Samples are filtered through under vacuum pressure
3.2 Preparation of Cryptosporidium parvum seeded water
•Add to the tested challenge water the required volume of oocysts to achieve the required concentration of not less then 1 X 10⁴ /100 ml •The calculation is to be done according to the following:
Required volume oocyst stock to be added to the water = (A/B) X C
A= oocyst concentration required in the seeded water B= oocyst titer in stock C= Seeded water volume. 4.0 Sample Testing
• Add either 10 or 100 mL of C. parvum suspended culture to filter membrane in Hoeffler manifold
• Each sample is tested in duplicate • Rinse membrane filter housing with 10 mL of phosphate buffer pH 7.2±0.2 • Stain each membrane filter using 2mL of anti-Cryptosporidium fluorescent
antibody (Waterborne Inc., Louisiana) for 30 minutes • Rinse antibody with 10 ml of Phosphate Buffered Saline • Mount filter on a glass microscope slide • Examine using and Olympus BH2 Epifluorescent microscope
19
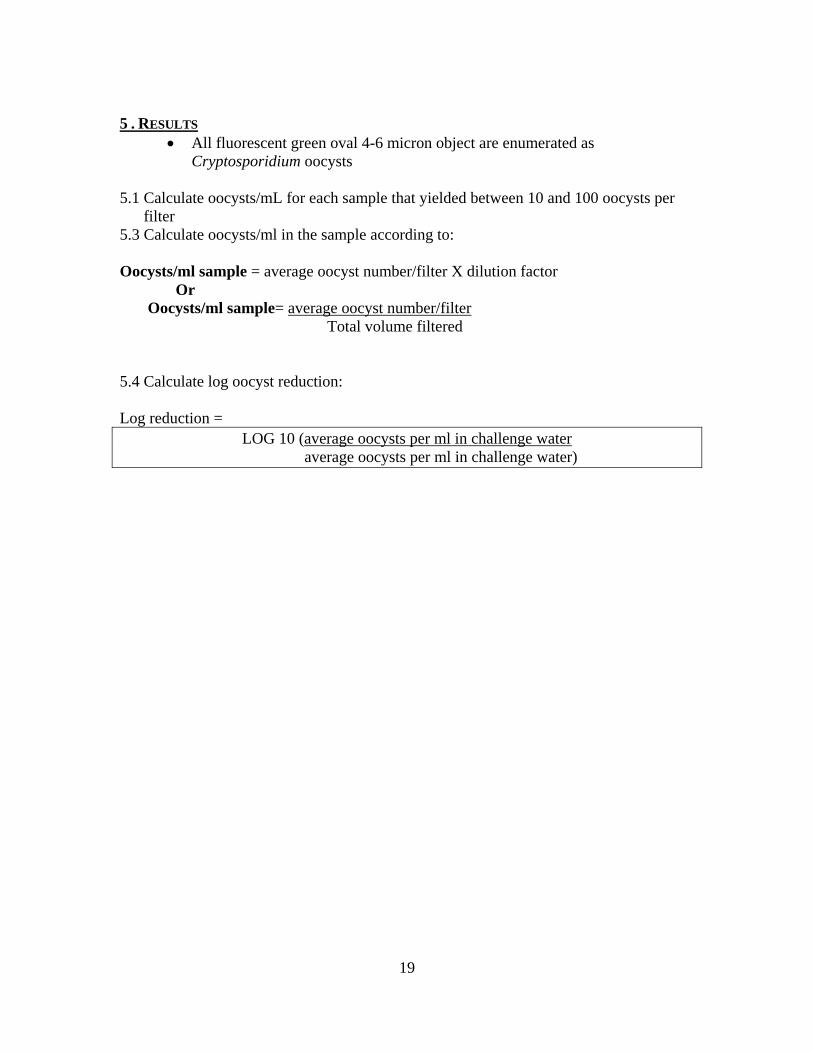
5 . RESULTS
• All fluorescent green oval 4-6 micron object are enumerated as Cryptosporidium oocysts
5.1 Calculate oocysts/mL for each sample that yielded between 10 and 100 oocysts per
filter 5.3 Calculate oocysts/ml in the sample according to: Oocysts/ml sample = average oocyst number/filter X dilution factor Or Oocysts/ml sample= average oocyst number/filter Total volume filtered 5.4 Calculate log oocyst reduction: Log reduction =
LOG 10 (average oocysts per ml in challenge water average oocysts per ml in challenge water)

20
Appendix 6
Size Distribution Analysis of 0-5 Fraction Arizona Dust Test
-Intentionally left blank-
Originals provided with hard copy