microbiota of southern hairy-nosed wombats signatures of
TRANSCRIPT
Page 1/24
Signatures of Landscape and Captivity in the GutMicrobiota of Southern Hairy-nosed Wombats(Lasiorhinus Latifrons)Raphael Eisenhofer ( [email protected] )
The University of Adelaide https://orcid.org/0000-0002-3843-0749Kristofer M Helgen
Australian Museum Research InstituteDavid Taggart
University of Adelaide School of Animal and Veterinary Sciences
Research Article
Keywords: Landscape and Captivity, Hairy-nosed Wombats, microbiota
Posted Date: September 23rd, 2020
DOI: https://doi.org/10.21203/rs.3.rs-81023/v1
License: This work is licensed under a Creative Commons Attribution 4.0 International License. Read Full License
Version of Record: A version of this preprint was published on January 6th, 2021. See the publishedversion at https://doi.org/10.1186/s42523-020-00068-y.
Page 2/24
AbstractBackground
Herbivorous mammals co-opt microbes to derive energy and nutrients from diets that are recalcitrant tohost enzymes. Recent research has found that captive management—an important conservation tool formany species—can alter the gut microbiota of mammals. Such changes could negatively impact theability of herbivorous mammals to derive energy from their native diets, and ultimately reduce host�tness. To date, nothing is known of how captivity in�uences the gut microbiota of the Southern Hairy-nosed Wombat (SHNW), a large herbivorous marsupial that inhabits South Australia. Here, using 16SrRNA gene sequencing, we characterized the faecal microbiota of SHNWs in captivity and from three wildpopulations, two from degraded habitats and one from an intact native grass habitat.
Results
We found that captive SHNWs had gut microbiota that were compositionally different and less diversecompared to wild SHNWs. There were major differences in gut microbiota community membershipbetween captive and wild, both in statistically signi�cant changes in relative abundance of microbes, andin the presence/absence of microbes. We also observed differences in microbial composition betweenthe wild populations, with the largest difference associated with native vs. degraded habitat.
Conclusions
These results suggest that captivity has a major impact on the gut microbiota of SHNWs, and thatdifferent wild populations harbour distinct microbial compositions. Such �ndings warrant further work todetermine what impacts these changes have on the �tness of SHNWs, and whether they could bemanipulated to improve future management of the species.
BackgroundThere is increasing recognition that host-associated communities of microorganisms (microbiota) playkey roles in animal health and should be a considered factor in wildlife management practices [1]. Thegut microbiota has been demonstrated to in�uence host health through interactions with the immunesystem, behaviour, digestion, and essential nutrient synthesis (reviewed in [2–4]). For instance,herbivorous mammals can harbor microbes that detoxify plant defence compounds [5], increasing theirdietary niche breadth. Additionally, it has long been understood that the fermentation of plant compoundsby the gut microbiota, for example within the complex compartmentalized digestive systems of foregutfermenters like ruminant mammals, can make substantial contributions to the daily energy requirementsof herbivores. It has been estimated that short-chain fatty acids (SCFA) produced by the gut microbiota ofSouthern Hairy-nosed Wombats (SHNWs), a hindgut fermenter, account for >60% of the daily energyrequirement of the host [6]. Loss or disruptions of these host-associated microbiota and functions couldtherefore have major implications for the health and �tness of animals.
Page 3/24
Captive breeding is an important wildlife management tool for many species. However, captivity candrastically modify the natural mammalian gut microbiota through various factors including changes indiet and antibiotic treatment [7–10] (reviewed in [1]). Diet is known to have a major in�uence on the gutmicrobiota of mammals [11]. [12] demonstrated that a change in diet can shift gut microbiota diversityand composition in laboratory mice (Mus musculus) and that, while these shifts were reversible in asingle generation by dietary changes, they could not be restored by dietary intervention alone aftermultiple generations. Such microbial ‘extinctions’ were only reversible by reintroduction of both themissing microbes and diet. [13] showed that white-throated woodrats (Neotoma albigula) brought intocaptivity and fed their natural diet retained more of their native microbiota when compared to animals fedan arti�cial diet. Determining which mammals experience effects of captivity on their gut microbiota is animportant �rst step in developing management practices to retain native gut microbial diversity.
Animals of the same species living in geographically different populations can also have distinct gutmicrobiota compositions, which may be locally adaptive. Black howler monkeys (Alouatta pigra) werefound to have habitat-speci�c gut microbiota signatures [14]. Monkeys living in degraded forestsharboured lower gut microbial diversity and fewer microbes capable of producing butyrate, a SCFA energysource for the host. Similar trends were found in another study on two populations of Udzungwa redcolobus monkey (Procolobus gordonorum) [15]. The gut microbiota of animals living within the samepopulation can also differ substantially. Koalas (Phascolarctos cinereus) from the same population werefound to have distinct gut microbiota signatures associated with the consumption of different Eucalyptusspecies [16], and emerging evidence suggests that the gut microbiota of koalas can in�uence dietselection [17]. Identifying inter- and intra-population gut microbiota signatures could therefore yieldimportant information from which to make wildlife management decisions, such ascoordination/matching of individuals and locations to maximise translocation success.
To date, little is known about the gut microbiota of the Southern Hairy-nosed Wombat (SHNW)(Lasiorhinus latifrons). The SHNW is a large, sedentary, semi-fossorial marsupial herbivore, found insemiarid grassland habitats across southern South Australia, west of the Murray River to the south-eastern corner of Western Australia [18–20]. It is a grazer and a hindgut fermenter, with microbially-facilitated digestion occurring especially in an expansive colon [6,21,22]. Animals are subjected to annualextremes in water and nutrient availability, with limited access to water or food during summer andautumn months. Feed becomes prevalent after rainfall, which typically occurs in winter and spring, unlessthe region is in drought [23,18,24]. The species displays signi�cant physiological and behaviouraladaptations for water and energy conservation in this harsh environment, including a low basalmetabolic rate, ever-growing cheek teeth well-adapted to mechanically reducing food into smallparticulates, long gut retention times, production of dry faecal pellets, and a relatively inactive, burrowinglifestyle [25,23,22,26,27,24]. The home range of this species is very small (2-4 ha) for an animal of theirsize and centered around their preferred warrens [28]. In intact habitats, animals feed mostly on nativeperennial grasses - Austrostipa spp., forbs and chenopods (saltbush -- Atriplex, Enchylaena and Rhagodiaspp., and bluebush -- Maireana spp.) and it is recognized as an important ecosystem engineer [29,24].When native vegetation is unavailable, as in degraded habitats, a variety of introduced weed species are
Page 4/24
eaten [24]. The species is also of conservation concern, with a formerly broad geographic range insouthern Australia fragmented by agriculture, livestock production, and other land-use changes, and iscurrently listed by the IUCN as “Near-threatened.” It is also closely related to the critically endangerednorthern hairy-nosed wombat (Lasiorhinus krefftii; [30]). Nothing is known about whether habitat typein�uences the gut microbiota of SHNWs, or whether different populations of SHNWs have distinct gutmicrobiota.
To better understand whether factors such as captivity or habitat type in�uence the gut microbiota ofSHNWs, we collected and characterised the microbial composition of fresh faecal samples from onecaptive and three wild populations in South Australia (two of which represent degraded, and one intacthabitat). We hypothesised that 1) captivity results in both the reduction of diversity and a substantialchange in gut microbial composition, and 2) different wild populations harbour distinct gut microbialcompositions.
MethodsStudy sites and habitat
Captive
Captive SHNWs accessed for this study were held by an experienced wildlife carer in the Adelaide Hills,approximately 10km south-west of Adelaide, South Australia. These were rescue animals brought in fromacross the state, with most being hand-reared from a young age. The animals were housed in separate,custom-built enclosures containing burrows, and fed Barastoc Complete Performer (primarily cooked and�aked barley and lupins, lucerne and cereal chaff). The diet was bolstered in the wintertime withsun�ower, oats, carrots, and sweet potato. Animals had access to water ad-lib.
Degraded habitat - Kooloola Station and Brook�eld Conservation Park
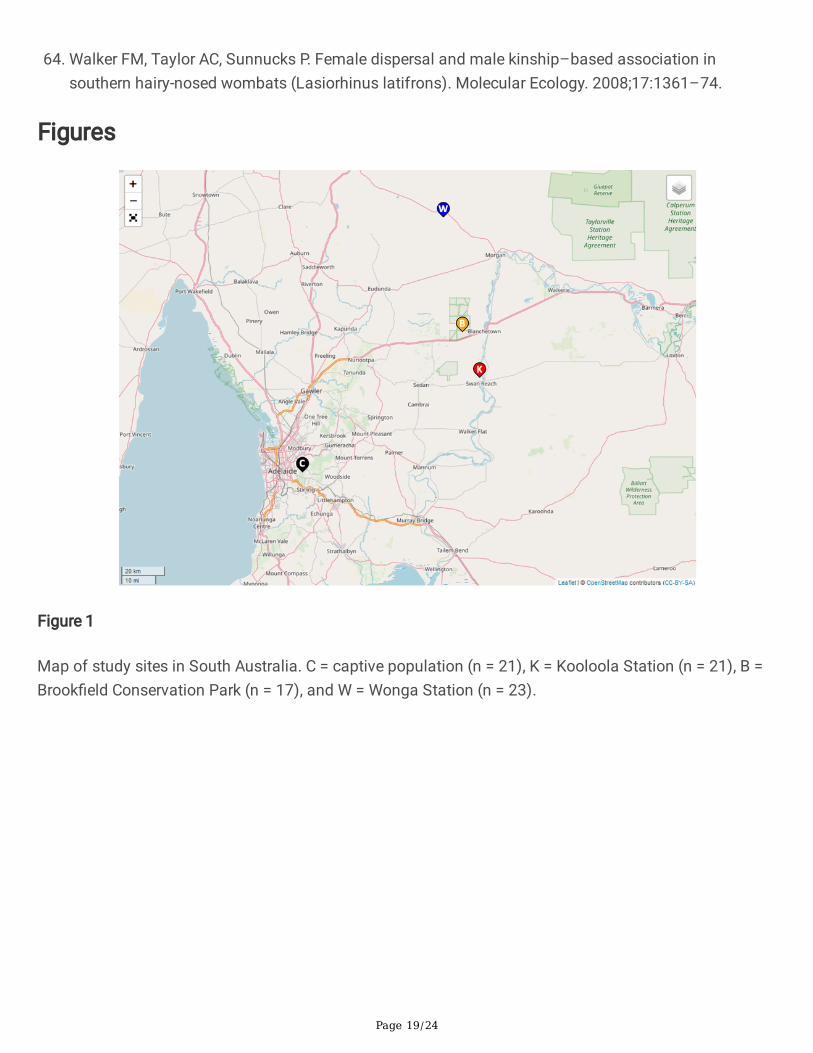
Wild SHNWs from degraded habitat were located at Kooloola Station and Brook�eld Conservation Park(Figure 1). Both sites were historic sheep grazing properties and are located approximately 2.5 hrs drivenorth east of Adelaide, in South Australia’s Murraylands region. The annual rainfall in this area is~270mm (Bureau of Meteorology -- BOM, 2018). The area consists of remnant mallee eucalypt woodlandwith a chenopod and grassland understory composed of a variety of introduced weeds, native grassesand chenopods. The diet of wombats in this area is made up largely of introduced weed speciesincluding: thread iris (Moraea setifolia), wards weed (Carrichtera annua) and burr medic (Medicagominima), along with remnant chenopods and a few native grass species [31]. Except immediately afterrain, no free water is available at these sites.
Intact habitat - Wonga Station
Wild SHNWs from intact habitat were located at Wonga Station, a sheep grazing property of ~130,000acres, located about 3.5 hours drive north east of Adelaide, in South Australia’s Murraylands region
Page 5/24
(Figure 1). This area receives ~290 mm of rainfall annually (BOM, 2018). The vegetation on this propertyis predominantly composed of intact, native grassland habitat interspersed with remnant mallee eucalyptwoodland. Active weed management is undertaken at this site. Native grasses and forbs, the dominantcomponent of wombat diet in this region, �ourish at this site and include many Stipia, Hyalosperma,Silene, Rytidiosperma and Sida spp, and a wide variety of Chenopodiaceae (saltbush - Atriplex,Enchylaena and Rhagodia spp, and bluebush - Maireana spp) among others [31]. Except immediatelyafter rain, no free water is available at this site.
Sample collection
Once faeces have been deposited by an animal, the microbes inside can continue to grow and distort thetrue representation of the microbial community as it was inside the host. To counteract this potentiallyconfounding variable, faecal samples are best collected fresh and preserved. Freezing is a commonlyused preservative method, but is di�cult to use in a �eldwork context. Instead, we opted for preservationof faecal samples by immersion in 95% ethanol, which has been demonstrated to reliably preserve faecalmicrobial community composition at room temperature [32]. We collected samples in the evening/earlymorning when SHNWs are most active, offering the best opportunity to collect fresh faecal samples.
The entrance and soil mound area around SHNW warrens were searched for fresh faecal pellets. Oldpellets and fresh pellets were qualitatively distinguished by gently squeezing with a freshly gloved hand.Once found, fresh pellets were placed on a piece of aluminium foil and cut in half using the cutting edgeof a spatula. The pellet cores were extracted using the opposite end of the spatula and placed in 2 mLplastic screw-top tubes pre�lled with 1.5 mL of 95% ethanol, before being shaken vigorously to ensuremixing of sample with ethanol. Gloves were changed between samples, and spatulas weredecontaminated using 5% bleach (sodium hypochlorite) followed by an ethanol wash.
Samples from Kooloola Station were collected in the evening of 13 March 2019; Brook�eld samples werecollected in the morning of 14 March 2019 (mean overnight temperature of 7.2°C; Eudunda weatherstation, Bureau of Meteorology). Samples from Wonga Station were collected overnight and into themorning of 19 June 2019 (mean overnight temperature of 1°C; Eudunda weather station, Bureau ofMeteorology). Scat samples from captive animals were collected between 13 May 2019 and 5 June 2019,with some individuals being sampled at up to three different time points. A soil sample from each wildstudy site was also collected for analysis.
DNA extraction
All DNA extractions were performed in freshly decontaminated Perspex hoods in a pre-PCR laboratory toprevent contamination with amplicons [33]. DNA was extracted using the QIAGEN DNeasy PowerSoil kit(formerly MO BIO PowerSoil) according to the manufacturer’s protocol. To reduce contamination, allbuffers and tubes needed for the various steps were aliquoted prior to opening any sample tubes. Faecalsamples were centrifuged at 10,000 g for 5 minutes before pouring the ethanol off. Because SHNWfaeces are very dry, only ~150 mg from each sample was used. To minimise batch effects samples in
Page 6/24
extraction groups were randomized, and to account for laboratory related contamination extraction blankcontrols from each extraction group was included and carried through to DNA sequencing [33].
Amplicon library preparation, quanti�cation, and DNA sequencing
All samples were PCR-ampli�ed and uniquely barcoded for High-Throughput Sequencing (HTS) usingprimers targeting the V4 region of the bacterial 16S rRNA gene [34]. We used forward primer: 515F(AATGATACGGCGACCACCGAGATCTACACTATGGTAATTGTG-TGCCAGCMGCCGCGGTAA) and barcodedreverse primer 806R (CAAGCAGAAGACGGCAT-ACGAGATnnnnnnnnnnnnAGTCAGTCAGCCGGACTACHVGGGTW TCTAAT) – the 12 n’s represent uniquebarcode sequences. The PCR reactions were prepared in a pre-PCR laboratory in a 5% bleached-cleanedand UV irradiated hood. Single reactions [35] of 2.5 µL X10 HiFi buffer, 0.1 µL Platinum™ Taq DNAPolymerase (ThermoFisher), 19.2 µL dH2O, 0.2 µL 100 mM dNTP mix, 0.5 µL each of 10 µM forward andreverse primer and 1 µL DNA. DNA was ampli�ed using an initial denaturation at 94 °C for 3 min, followedby 35 cycles of denaturation at 94 °C for 45 sec, annealing at 50 °C for 1 min, elongation at 68°C for 90sec, with �nal adenylation for 10 min at 68 °C, in line with the Earth Microbiome Protocol [36].
Gel electrophoresis was carried out for each PCR reaction on a 3.5% agarose gel to ensure the samplescontained library constructs of the desired length (~390 bp). For each sample, 1 µL ampli�ed DNA wasmixed into 199 µL Qubit® working solution (diluted Qubit® dsDNA HS Reagent 1:200 in Qubit® dsDNAHS Buffer) and quanti�ed using a Qubit® 2.0 Fluorometer. Samples were pooled equimolar and cleanedusing AxyPrep™ (Axygen) following the manufacturer’s instructions. Because negative controls containedlittle DNA, they were pooled separately and spiked into the �nal pool at a �at volume [33]. The �nal poolwas quanti�ed and quality checked using an Agilent TapeStation. DNA sequencing was performed on anIllumina MiSeq (v2, 2 x 150 bp) at SAHMRI (South Australian Health and Medical Research Institute).
Data processing and statistical analyses
DNA sequencing data were processed and analysed using QIIME2 v2020.2 [37]. An interactive Jupyternotebook containing all the QIIME2 code used is available (SI File 1). Forward reads (R1) were importedinto the QIIME2 and denoised into amplicon sequence variants (ASVs) using the deblur [38] plugin with atrim length of 150 bp. Representative sequences were assigned taxonomy using the QIIME2 feature-classi�er plugin (naive bayesian approach) on the pre-trained SILVA [39] 132 V4 region classi�er [40]. Aphylogenetic tree was created using the SATé-enabled phylogenetic placement (SEPP) technique [41]within the fragment-insertion QIIME2 plugin. Alpha diversity (Observed OTUs and Faith’s Phylogeneticdiversity [42]) and Beta diversity (weighted [43] and unweighted [44] UniFrac metrics) were calculatedusing the QIIME2 diversity plugin with a rarefaction depth of 36,346 sequences per sample. Tests fordifferentially abundant microbes between populations were performed using ANCOM [45]. SINA (SILVAIncremental Aligner) [46] was used to search speci�c ASVs against the SILVA 138 database. We usedSourceTracker2 (https://github.com/biota/sourcetracker2) [47] to assess whether microbes from the soilwere a source for faecal samples. Figures were constructed using ggplot2 [48] in R Studio [49]. The map
Page 7/24
was generated using Geoplaner (www.geoplaner.com) with data from OpenStreetMaps(wiki.openstreetmap.org). Venn diagrams were created using InteractiveVenn (www.interactivenn.net).
Removal of outlier samples
We observed 7 samples from Brook�eld Conservation Park that appeared to be outliers in our dataset.PCoA of unweighted UniFrac distances clearly separated these samples from other wild and captivesamples (SI Figure 1). Additionally, the diversity in these outlier samples was higher than other Brook�eldsamples (mean of 1,323 observed ASVs vs. 831). The taxonomic composition of these outlier sampleswas also substantially different to other samples (SI Figure 2). An interactive view at different taxonomiclevels can be observed by dragging SI File 2 into the https://view.qiime2.org/ webpage. The most starkdifference between these outlier samples and the other samples in the dataset is the loss of Spirochaetes,which was present in all other wild samples with a mean relative abundance of 11.6% and captivesamples at 5.1%. A possible cause for these differences could be taphonomy—perhaps these faecalsamples were older than they seemed, which could have resulted in a shift of observed communitycomposition. We chose to exclude these outlier samples from subsequent analyses.
Frequency-based �ltering to mitigate cross-sample contamination
Samples undergoing DNA extraction and library preparation in the same batch can be affected by cross-sample contamination, whereby cells (from DNA extraction) or DNA (from DNA extraction and/or librarypreparation) can cross from a sample to another [33,50]. Such cross-sample contamination can thereforeyield false-positive detection of microbes within samples, with samples of higher microbial biomassbeing more likely to spillover [50]. Because we randomized sample order within DNA extractions andlibrary preparations (to reduce batch effects), there is a possibility of spillover between faecal samplesfrom different populations. This would confound attempts at identifying ASVs that are unique to aparticular population (i.e. Figure 3B, Figure 5). To try and mitigate the effect of cross-samplecontamination for population-speci�c ASV analysis, we applied a conservative frequency-based �lteringapproach, whereby population-speci�c ASV tables were �ltered to remove ASVs with a relative abundanceof <0.00015%). This threshold was based on the frequency of the most abundant ASV in the dataset(3c44df3672100a011a334b67eea24366), which was found in all wild samples with a total frequency of278,742 reads (5.8% of total reads in wild samples). In contrast, this ASV was only found in the captive-only table with a total frequency of 131 reads (0.0001% of the captive table abundance). Assuming thatthe most abundant ASV would result in the greatest number spillover events, setting a threshold based onthis ASV (0.00015%) would account for the spillover of less abundant ASVs. See the interactive Jupyternotebook for more details and the exact code ran (SI File 1). The issue of cross-samples contamination inmicrobiome studies clearly deserves further research.
ResultsDNA sequencing of the 97 samples resulted in 13,545,820 reads (mean of 139,647), which were denoisedusing deblur into 8,483 amplicon sequence variants (ASVs).
Page 8/24
Captivity in�uences SHNW gut microbiota diversity and composition
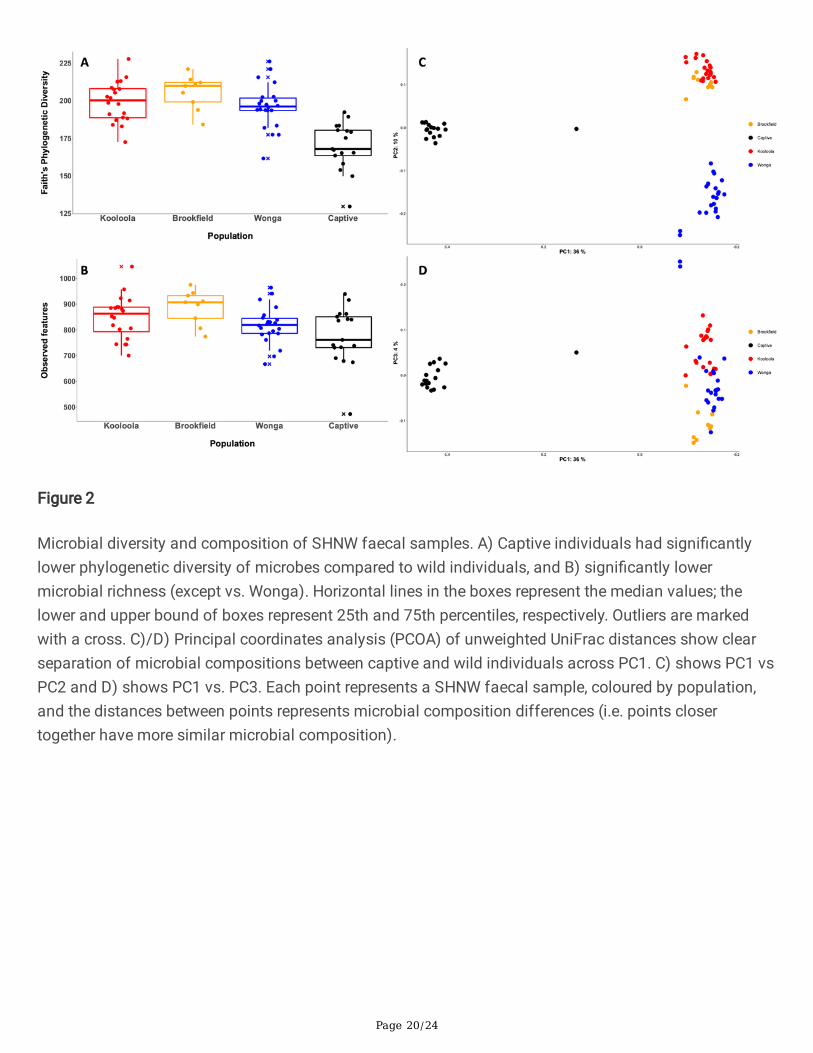
Microbial diversity was higher in wombat scats collected from wild populations compared to thosesourced from captivity (Figure 2A & B). All three wild populations had statistically signi�cantly highermicrobial phylogenetic diversity versus the captive population (Figure 2A; Kruskal-Wallis tests of Faith’sphylogenetic diversity p-values < 0.001 SI Table 1). This �nding was mirrored with microbial richness,with the exception of captive versus Wonga (Figure 2B; Kruskal-Wallis tests of richness p-values < 0.05 SITable 2). Analysis of microbial composition via principal coordinates analysis (PCoA) of unweightedUniFrac distances showed clustering of samples by captivity status (Figure 2C & D). Captive sampleswere separated from wild samples across the �rst principal coordinate, which explained 36% of thevariation, and these differences in microbial composition were statistically signi�cant (PERMANOVA ofunweighted UniFrac distances p-value=0.001, pseudo-F 26.7). This result was also found when using theweighted (by abundance) Unifrac metric (SI Figure 3; PERMANOVA of weighted UniFrac distances p-value= 0.001, pseudo-F 19.4).
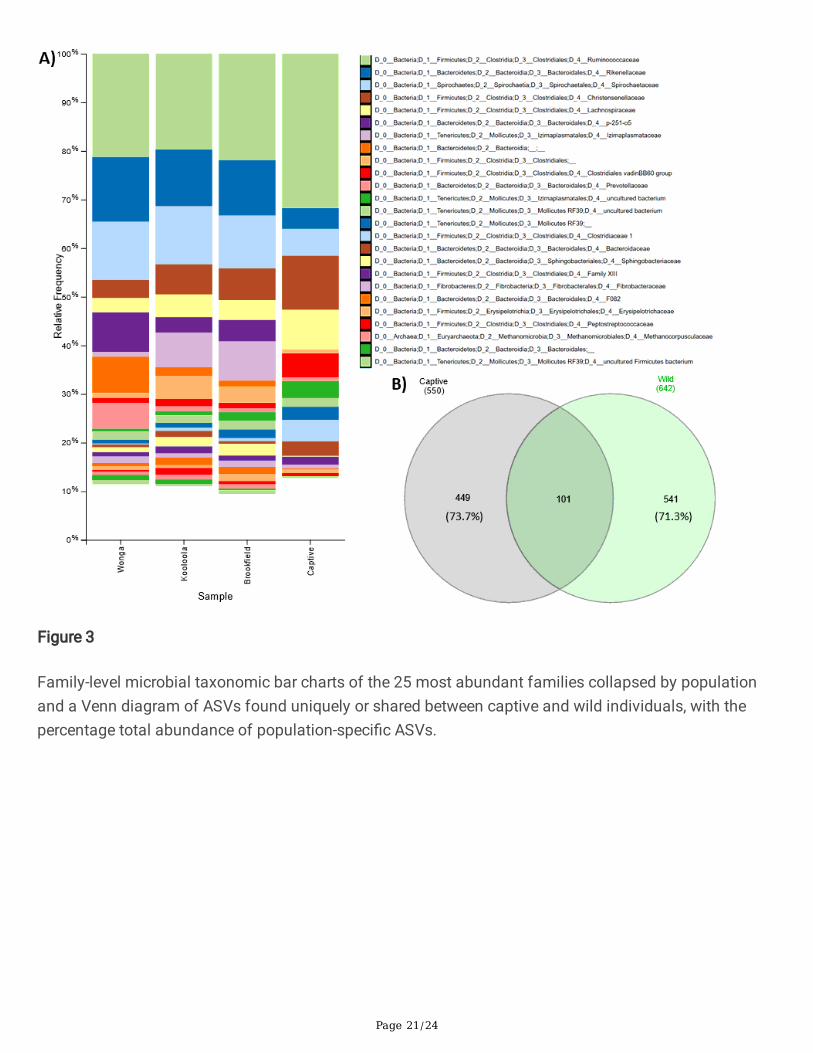
The microbial phyla with the greatest relative abundance in SHNW faecal samples were Firmicutes(39.5% and 64.4% relative abundance for wild and captive, respectively), Bacteroidetes (29.7% wild, 13.3%captive), Tenericutes (12.1% wild, 10.3% captive), and Spirochaetes (11.6% wild, 5.1% captive) (SI File 2).The Firmicutes:Bacteroidetes ratio was substantially higher in captive animals (mean 4.8:1) compared towild (Kooloola & Brook�eld=1.7:1, Wonga=0.8:1). Twenty �ve microbial families accounted for ~90% ofthe faecal microbiota, with the three most abundant families being Ruminococcaceae (20.9% wild, 33.1%captive), Spirochaetaceae (11.5% wild, 5.1% captive), Rikenellaceae (12.2% wild, 5.1% captive), andChristensenellaceae (5.5% wild, 8.5% captive) (Figure 3 and SI File 2). Interestingly, some families wereonly detected in wild animals; Izimaplasmataceae (5.4% in wild), p-251-o5 (5.3% in wild), and anunclassi�ed Bacteroidia family (3.5%). We used ANCOM to statistically test whether there were anyfamilies of microbes that were differentially abundant between captive and wild individuals. Twenty-onefamilies were found to be signi�cantly differentially abundant between captive and wild individuals (SIFile 3).
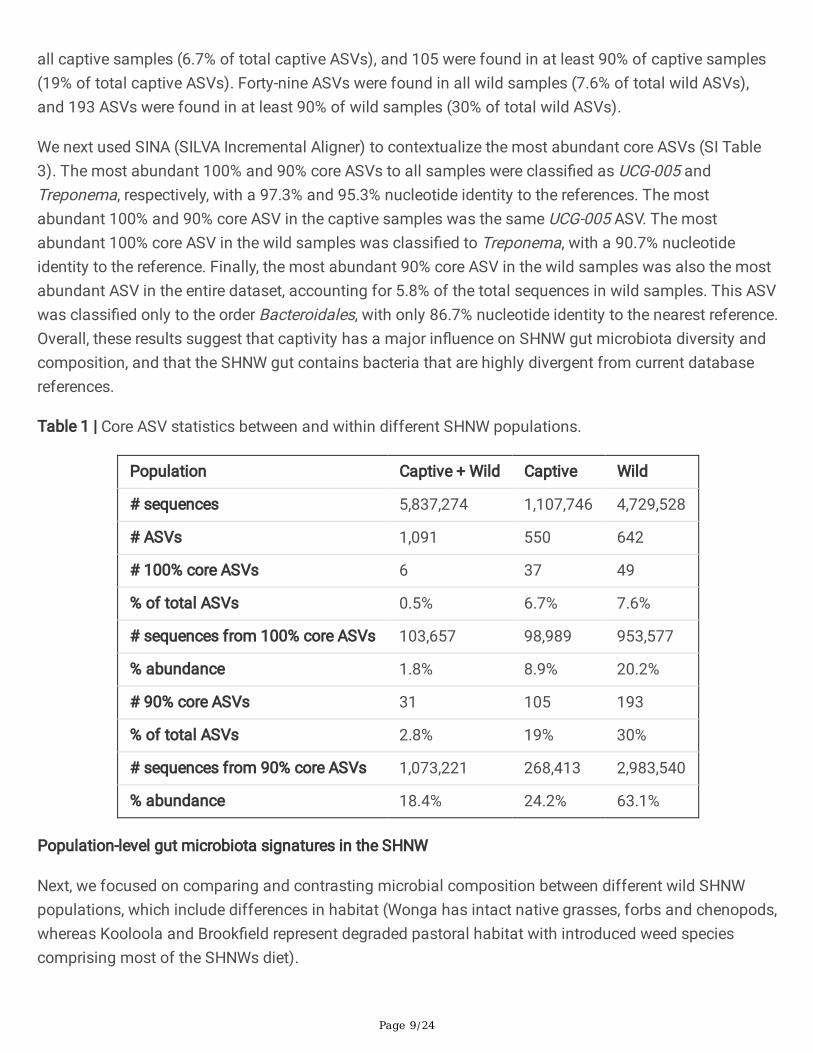
At the sequence-level, we found 181 ASVs that were signi�cantly differentially abundant between captiveand wild individuals (SI File 4). We next sought to determine whether there were ASVs only detected incaptive or wild SHNWs. After �ltering feature tables to conservatively account for cross-contaminationbetween samples (see methods), the total number of ASVs in the captive samples went from 2,618(1,292,572 total sequences) to 550 (1,107,746), and 3,096 (5,026,870) to 642 (4,729,528) for wildsamples. From these ASVs, 449 were found only in captive SHNWs, accounting for 73.7% of the totalabundance, with 541 ASVs being found only in wild SHNWs (71.3% abundance). One hundred and oneASVs were shared between the captive and wild SHNWs, accounting for 26.3% and 28.7% of their faecalmicrobiota abundance, respectively (Figure 3B). To determine the distribution of these ASVs across thesamples, we calculated the core microbiota (i.e. ASVs found in at least N% of samples) for both betweenand within captive and wild SHNWs. Six ASVs were found in all samples (0.5% of total ASVs), and 31were found in at least 90% of all samples (2.8% of total ASVs) (Table 1). Thirty-seven ASVs were found in
Page 9/24
all captive samples (6.7% of total captive ASVs), and 105 were found in at least 90% of captive samples(19% of total captive ASVs). Forty-nine ASVs were found in all wild samples (7.6% of total wild ASVs),and 193 ASVs were found in at least 90% of wild samples (30% of total wild ASVs).
We next used SINA (SILVA Incremental Aligner) to contextualize the most abundant core ASVs (SI Table3). The most abundant 100% and 90% core ASVs to all samples were classi�ed as UCG-005 andTreponema, respectively, with a 97.3% and 95.3% nucleotide identity to the references. The mostabundant 100% and 90% core ASV in the captive samples was the same UCG-005 ASV. The mostabundant 100% core ASV in the wild samples was classi�ed to Treponema, with a 90.7% nucleotideidentity to the reference. Finally, the most abundant 90% core ASV in the wild samples was also the mostabundant ASV in the entire dataset, accounting for 5.8% of the total sequences in wild samples. This ASVwas classi�ed only to the order Bacteroidales, with only 86.7% nucleotide identity to the nearest reference.Overall, these results suggest that captivity has a major in�uence on SHNW gut microbiota diversity andcomposition, and that the SHNW gut contains bacteria that are highly divergent from current databasereferences.
Table 1 | Core ASV statistics between and within different SHNW populations.
Population Captive + Wild Captive Wild
# sequences 5,837,274 1,107,746 4,729,528
# ASVs 1,091 550 642
# 100% core ASVs 6 37 49
% of total ASVs 0.5% 6.7% 7.6%
# sequences from 100% core ASVs 103,657 98,989 953,577
% abundance 1.8% 8.9% 20.2%
# 90% core ASVs 31 105 193
% of total ASVs 2.8% 19% 30%
# sequences from 90% core ASVs 1,073,221 268,413 2,983,540
% abundance 18.4% 24.2% 63.1%
Population-level gut microbiota signatures in the SHNW
Next, we focused on comparing and contrasting microbial composition between different wild SHNWpopulations, which include differences in habitat (Wonga has intact native grasses, forbs and chenopods,whereas Kooloola and Brook�eld represent degraded pastoral habitat with introduced weed speciescomprising most of the SHNWs diet).
Page 10/24
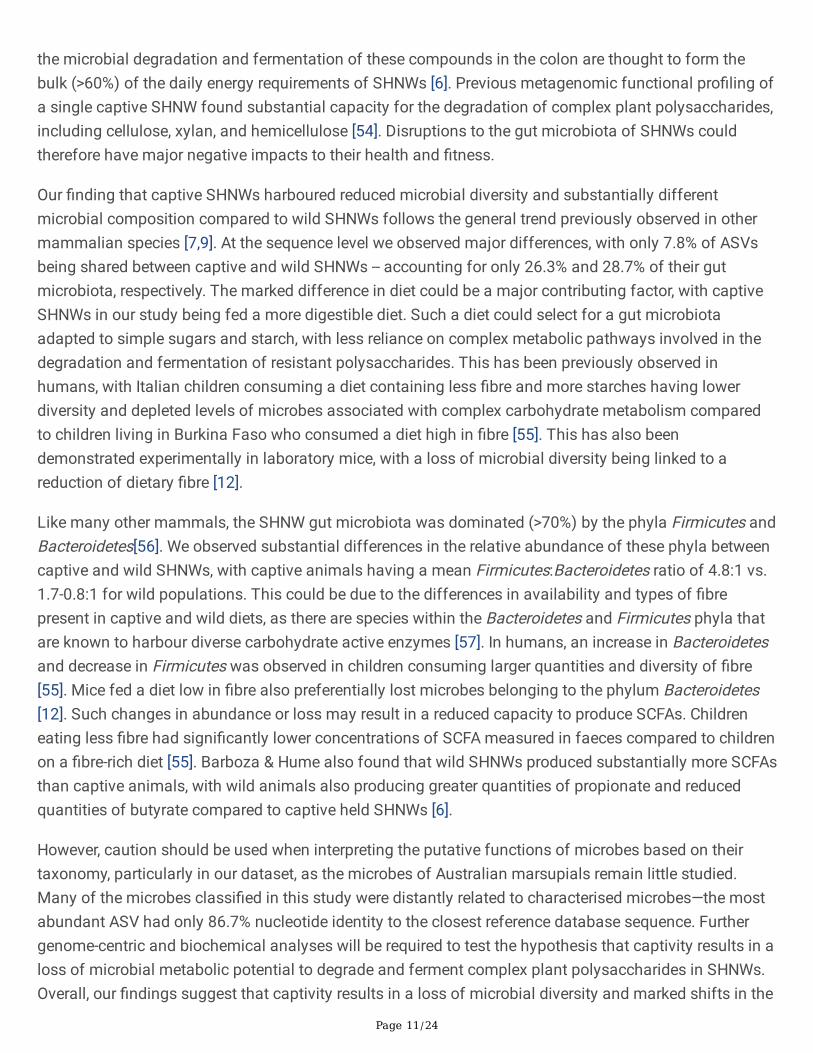
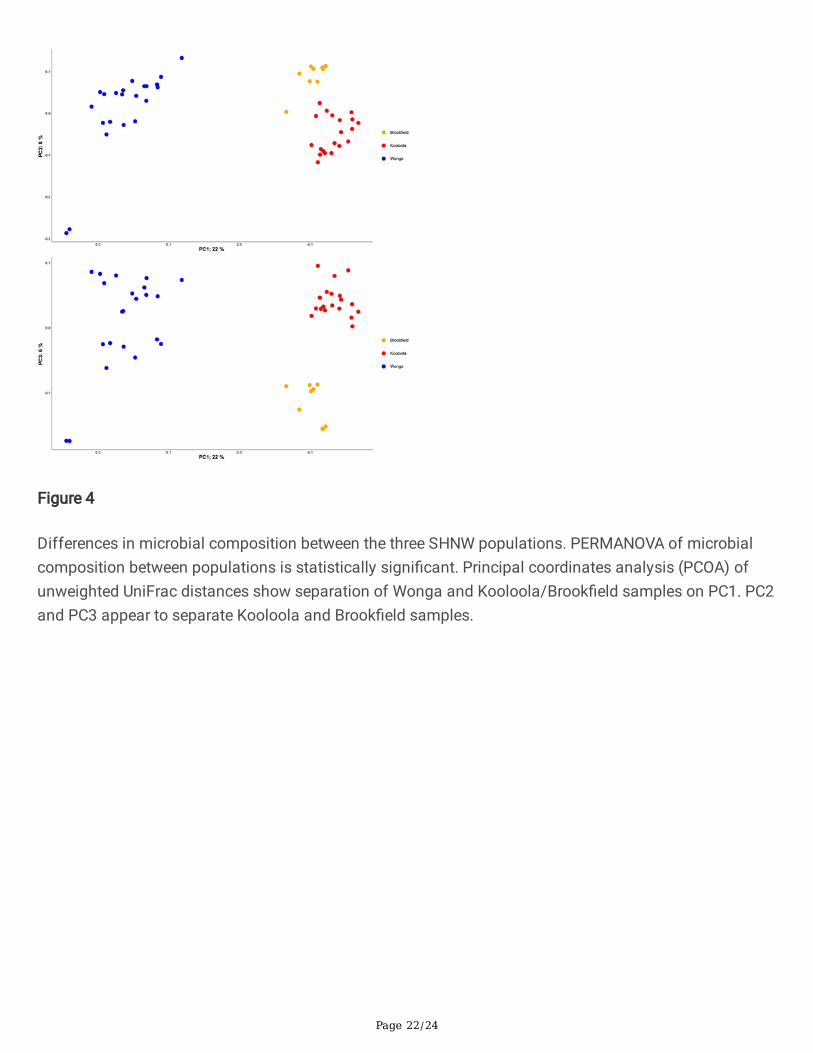
Samples from Wonga were clearly separated from Brook�eld and Kooloola along the �rst principalcoordinate, which explained 22% of the variation (Figure 4), and these differences in microbialcomposition were statistically signi�cant (PERMANOVA of unweighted UniFrac distances p-values =0.001, pseudo-F = 12.1 and 7.9 for Wonga vs. Kooloola and Wonga vs. Brook�eld, respectively). Samplesfrom Wonga and Brook�eld were also separated from each other across principal coordinates 2 and 3,which explained 8% and 6% of the variation, respectively, and these differences were also statisticallysigni�cant (PERMANOVA of unweighted UniFrac distance p-value = 0.001, pseudo-F = 4.3). These resultswere also similar when using the weighted Unifrac metric, with the exception of the differences betweenBrook�eld and Kooloola samples (SI Figure 4).
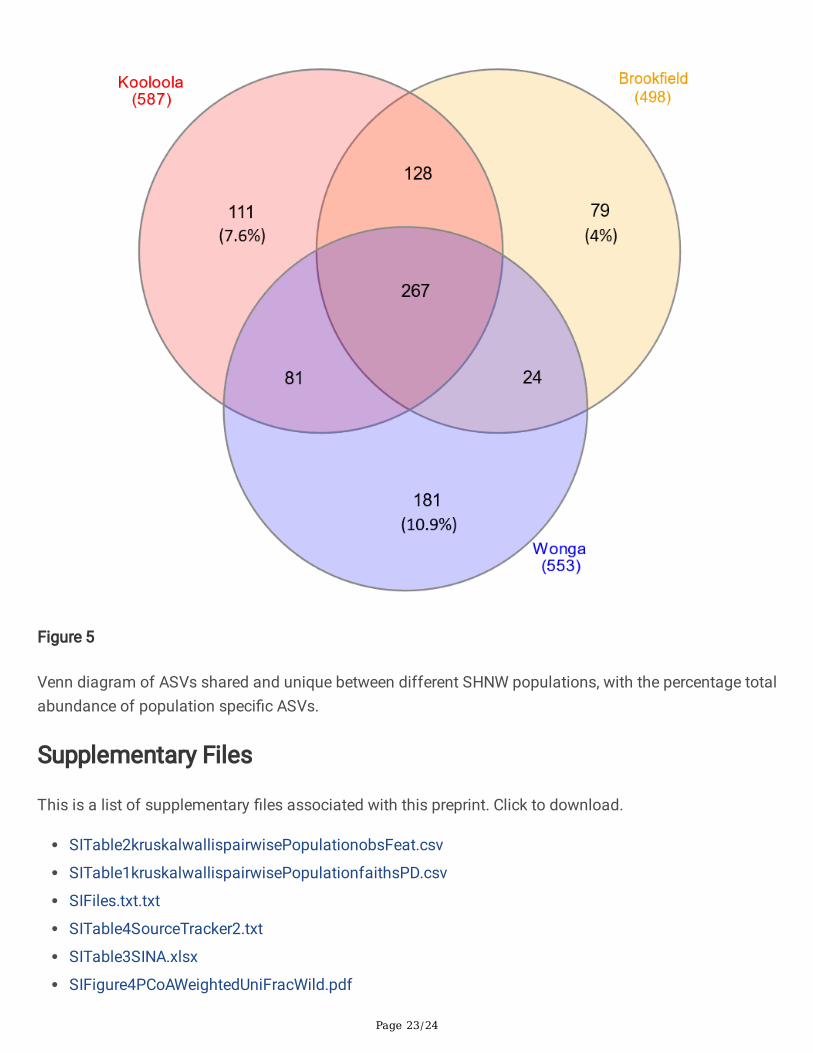
Using ANCOM, we found 7 families that had differential abundance between wild populations (SI File 5).Streptococcaceae had a higher relative abundance in Kooloola samples, an unclassi�ed RF39 family wasonly found in Kooloola and Brook�eld samples, and Micrococcaceae had a higher relative abundance inWonga samples. At the sequence level, 14 ASVs were signi�cantly differentially abundant betweenpopulations (SI File 6). Between the different SHNW populations, 111 ASVs were found only in Kooloolasamples (accounting for 7.6% total abundance), 79 were found only in Brook�eld samples (4%), 181ASVs were found only in the Wonga samples (10.9%), and 267 were shared in all wild samples (Figure 5).To test whether these population speci�c ASVs were due to differences in soil microbiota betweensampling sites, we ran SourceTracker2 with the soil samples set as sources and the faecal samples setas sinks. We found that soil microbes were not a major component of the SHNW faecal samples (mixingproportions <0.001; SI Table 4).
DiscussionCaptive management of wild mammals is typically accompanied by a drastic shift in environment anddiet, factors that have been shown to have a large in�uence on the gut microbiota of mammals. Inaddition, different populations of the same animal species have been found to harbour unique gutmicrobial communities, especially across distinct habitats [14,15]. These �ndings spurred us toinvestigate their relevance to the gut microbiota of the SHNW, a species of conservation signi�cance [24].We found that captive SHNWs had reduced gut microbiota diversity and a substantially differentmicrobial composition compared to wild SHNWs. We also found population-speci�c differences inmicrobial composition between the three wild SHNW populations surveyed, with the largest differencesoccurring between SHNWs living in intact versus degraded habitats.
The gut microbiota of mammalian herbivores provides key functions involved in the extraction ofnutrients and energy from the diet that would otherwise be unavailable to the host [51,52]. This relianceof herbivorous mammals on their gut microbial communities has resulted in physiological andmorphological adaptations of the mammalian gastrointestinal tract to enhance the extraction of energyby the gut microbiota, including an increase in length and capacity [53]. The SHNW is a hindgut fermenterwith an extremely long and capacious gastrointestinal tract (~12 times body length) [21]. As the diet ofSHNWs largely consists of plant cell walls that are recalcitrant to host enzymes, SCFAs produced through
Page 11/24
the microbial degradation and fermentation of these compounds in the colon are thought to form thebulk (>60%) of the daily energy requirements of SHNWs [6]. Previous metagenomic functional pro�ling ofa single captive SHNW found substantial capacity for the degradation of complex plant polysaccharides,including cellulose, xylan, and hemicellulose [54]. Disruptions to the gut microbiota of SHNWs couldtherefore have major negative impacts to their health and �tness.
Our �nding that captive SHNWs harboured reduced microbial diversity and substantially differentmicrobial composition compared to wild SHNWs follows the general trend previously observed in othermammalian species [7,9]. At the sequence level we observed major differences, with only 7.8% of ASVsbeing shared between captive and wild SHNWs -- accounting for only 26.3% and 28.7% of their gutmicrobiota, respectively. The marked difference in diet could be a major contributing factor, with captiveSHNWs in our study being fed a more digestible diet. Such a diet could select for a gut microbiotaadapted to simple sugars and starch, with less reliance on complex metabolic pathways involved in thedegradation and fermentation of resistant polysaccharides. This has been previously observed inhumans, with Italian children consuming a diet containing less �bre and more starches having lowerdiversity and depleted levels of microbes associated with complex carbohydrate metabolism comparedto children living in Burkina Faso who consumed a diet high in �bre [55]. This has also beendemonstrated experimentally in laboratory mice, with a loss of microbial diversity being linked to areduction of dietary �bre [12].
Like many other mammals, the SHNW gut microbiota was dominated (>70%) by the phyla Firmicutes andBacteroidetes[56]. We observed substantial differences in the relative abundance of these phyla betweencaptive and wild SHNWs, with captive animals having a mean Firmicutes:Bacteroidetes ratio of 4.8:1 vs.1.7-0.8:1 for wild populations. This could be due to the differences in availability and types of �brepresent in captive and wild diets, as there are species within the Bacteroidetes and Firmicutes phyla thatare known to harbour diverse carbohydrate active enzymes [57]. In humans, an increase in Bacteroidetesand decrease in Firmicutes was observed in children consuming larger quantities and diversity of �bre[55]. Mice fed a diet low in �bre also preferentially lost microbes belonging to the phylum Bacteroidetes[12]. Such changes in abundance or loss may result in a reduced capacity to produce SCFAs. Childreneating less �bre had signi�cantly lower concentrations of SCFA measured in faeces compared to childrenon a �bre-rich diet [55]. Barboza & Hume also found that wild SHNWs produced substantially more SCFAsthan captive animals, with wild animals also producing greater quantities of propionate and reducedquantities of butyrate compared to captive held SHNWs [6].
However, caution should be used when interpreting the putative functions of microbes based on theirtaxonomy, particularly in our dataset, as the microbes of Australian marsupials remain little studied.Many of the microbes classi�ed in this study were distantly related to characterised microbes—the mostabundant ASV had only 86.7% nucleotide identity to the closest reference database sequence. Furthergenome-centric and biochemical analyses will be required to test the hypothesis that captivity results in aloss of microbial metabolic potential to degrade and ferment complex plant polysaccharides in SHNWs.Overall, our �ndings suggest that captivity results in a loss of microbial diversity and marked shifts in the
Page 12/24
gut microbiota composition of SHNWs. Such changes could reduce the energy economy of SHNWs beingtranslocated from captivity to the wild. While the SHNW is only considered Near-threatened at present, itsclose relative the Northern Hairy-nosed Wombat (Lasiorhinus kreftii) is listed as critically endangered,with an estimated population size <300 [58]. Future captive breeding programs for this species shouldtake precautionary steps to reduce the loss of wild gut microbiota diversity in captivity, such as thefeeding of natural diets [13].
We also observed signi�cant differences in microbial composition between the three different wild SHNWpopulations sampled, with the largest difference being between Wonga (intact habitat) versus Brook�eldand Kooloola (degraded habitats). One possible reason for this �nding is that differences in �oralassemblages between intact/degraded habitats selected for distinct gut microbial compositions thatwere better adapted to deriving energy from the different plant species. Previous work on herbivorousprimates identi�ed changes in gut microbial diversity and composition between populations fromhabitats of differing quality [14,15], with animals from native habitats possessing a greater number ofgenes associated with SCFA production and hydrogen metabolism [14]. These differences also align withsigni�cant differences in body condition score between wombats from Wonga and Kooloola across allcohorts, with animals from Wonga (intact habitat) in signi�cantly better condition, at all times of the year,than those from Kooloola (degraded habitat) (Taggart et al. in preparation). The implications of these�ndings on breeding, survival of young, and resilience to drought in their semi-arid environment are likelyto be signi�cant. Another possible reason for these differences could relate the presence of toxic plantspecies in the degraded habitats (Brook�eld/Kooloola). These degraded habitats harboured plant speciesincluding, Potato weed, Ward’s weed, and Onion weed, and contain toxic plant defence compounds (eg.pyrrolizidine alkaloids) [59,31]. Previous work on other herbivorous mammals has demonstrated that thegut microbiota can detoxify plant defence compounds for the host [60–62]. Therefore, some of the gutmicrobes identi�ed as unique to SHNWs living in degraded habitats could play roles in the detoxi�cationof plant defence compounds. To test these possible factors, shotgun metagenomics could be used toidentify genes or pathways associated with the degradation of different plant cell wall components, orthe detoxi�cation of plant defence compounds. Additionally, as seasons affect plant assemblages inthese habitats (e.g. grasses tend to emerge in winter, and subside in summer), sampling the samepopulations at different times of the year could yield insights into how the gut microbiota is changing oradapting to host diet.
An alternate explanation for the differences in SHNW gut microbiota composition between wildpopulations is neutral allopatric speciation of microbes with their hosts [63]. As populations separatefrom each other the opportunity for microbes to be shared between them is reduced. Microbes withineach separate population can then continue to acquire mutations and co-speciate with their host, leadingto observed differences between populations. Dispersal in SHNWs is thought to be limited and biasedtoward females [27,64], with most animals staying within several hundred metres of their burrow of birth.Brook�eld and Kooloola are physically closer to each other than to Wonga station. Therefore, theobserved differences in gut microbiota composition between wild SHNW populations could be a productof minimal dispersal of animals between the populations, precluding the sharing of microbes between
Page 13/24
populations. Future host genetic investigations into the population structure and history of SHNWs inSouth Australia would provide a scaffold for which to test whether the gut microbiota is allopatricallyspeciating. Additionally, greater sampling of SHNW gut microbiota across their entire distribution(including the Nullarbor, which is ~1000 KM west of the populations tested here) will also be needed totest this scenario.
ConclusionWe found that captivity signi�cantly altered the diversity and composition of the gut microbiota inSHNWs. We also detected population-speci�c microbial compositions in the microbiota of wild SHNWs,which could represent microbial adaptations to the different habitats. How important these microbialdifferences are to host health and �tness remains to be determined, but could have managementimplications for SHNWs in the future, such as modifying captive diets or using faecal microbiotatransplants to assist with SHNW translocations.
AbbreviationsASV: Amplicon Sequence Variant
HTS: High-Throughput Sequencing
PCoA: Principal Coordinates Analysis
PCR: Polymerase Chain Reaction
SCFA: Short-Chain Fatty Acid
SHNW: Southern Hairy-nosed Wombat
DeclarationsEthical Approval and Consent to participate
Not applicable.
Consent for publication
Not applicable.
Availability of data and materials
Reviewer link to raw sequences:
https://dataview.ncbi.nlm.nih.gov/object/PRJNA663974?reviewer=gqp1hbe5d65b12q2hh2kpdth5v
Page 14/24
The QIIME2 code used in this manuscript is available in a Jupyter notebook (SI File 1).
Competing interests
The authors declare that they have no competing interests.
Funding
This project was funded by the Australian Research Council Centre of Excellence for AustralianBiodiversity and Heritage (CABAH).
Author contributions
All authors initiated and conceived the project. DT and RE collected the samples. RE performed themolecular work, bioinformatic and statistical analysis. All authors wrote, edited, and approved the �nalmanuscript.
Acknowledgements
We would like to acknowledge the help and support of Manfred Heide, who provided captive SHNWfaecal samples. We would also like to thank Calvin Heath for his help with the �eld and lab work.
Authors’ information
Not applicable.
References1. Trevelline, Brian K., Fontaine Samantha S., Hartup Barry K., Kohl Kevin D. Conservation biology needs
a microbial renaissance: a call for the consideration of host-associated microbiota in wildlifemanagement practices. Proceedings of the Royal Society B: Biological Sciences.2019;286:20182448.
2. McFall-Ngai M, Had�eld MG, Bosch TCG, Carey HV, Domazet-Lošo T, Douglas AE, et al. Animals in abacterial world, a new imperative for the life sciences. PNAS. 2013;110:3229–36.
3. McKenney EA, Koelle K, Dunn RR, Yoder AD. The ecosystem services of animal microbiomes.Molecular Ecology. 2018;27:2164–72.
4. Rowland I, Gibson G, Heinken A, Scott K, Swann J, Thiele I, et al. Gut microbiota functions:metabolism of nutrients and other food components. Eur J Nutr. 2018;57:1–24.
5. Kohl KD, Weiss RB, Cox J, Dale C, Dearing MD. Gut microbes of mammalian herbivores facilitateintake of plant toxins. Ecology Letters. 2014;17:1238–46.
�. Barboza PS, Hume ID. Hindgut fermentation in the wombats: two marsupial grazers. J Comp PhysiolB. 1992;162:561–6.
Page 15/24
7. Kohl KD, Skopec MM, Dearing MD. Captivity results in disparate loss of gut microbial diversity inclosely related hosts. Conserv Physiol [Internet]. 2014 [cited 2018 Dec 5];2. Available from:https://www.ncbi.nlm.nih.gov/pmc/articles/PMC4806740/
�. Clayton JB, Vangay P, Huang H, Ward T, Hillmann BM, Al-Ghalith GA, et al. Captivity humanizes theprimate microbiome. PNAS. 2016;113:10376–81.
9. McKenzie VJ, Song SJ, Delsuc F, Prest TL, Oliverio AM, Korpita TM, et al. The Effects of Captivity onthe Mammalian Gut Microbiome. Integr Comp Biol. 2017;57:690–704.
10. Dahlhausen KE, Doroud L, Firl AJ, Polkinghorne A, Eisen JA. Characterization of shifts of koala(Phascolarctos cinereus) intestinal microbial communities associated with antibiotic treatment.PeerJ. 2018;6:e4452.
11. Muegge BD, Kuczynski J, Knights D, Clemente JC, González A, Fontana L, et al. Diet drivesconvergence in gut microbiome functions across mammalian phylogeny and within humans.Science. 2011;332:970–4.
12. Sonnenburg ED, Smits SA, Tikhonov M, Higginbottom SK, Wingreen NS, Sonnenburg JL. Diet-inducedextinctions in the gut microbiota compound over generations. Nature. 2016;529:212–5.
13. Martínez-Mota R, Kohl KD, Orr TJ, Denise Dearing M. Natural diets promote retention of the native gutmicrobiota in captive rodents. The ISME Journal. Nature Publishing Group; 2020;14:67–78.
14. Amato KR, Yeoman CJ, Kent A, Righini N, Carbonero F, Estrada A, et al. Habitat degradation impactsblack howler monkey ( Alouatta pigra ) gastrointestinal microbiomes. The ISME Journal. NaturePublishing Group; 2013;7:1344–53.
15. Barelli C, Albanese D, Donati C, Pindo M, Dallago C, Rovero F, et al. Habitat fragmentation isassociated to gut microbiota diversity of an endangered primate: implications for conservation.Scienti�c Reports. Nature Publishing Group; 2015;5:14862.
1�. Brice KL, Trivedi P, Jeffries TC, Blyton MDJ, Mitchell C, Singh BK, et al. The Koala (Phascolarctoscinereus) faecal microbiome differs with diet in a wild population. PeerJ. 2019;7:e6534.
17. Blyton MDJ, Soo RM, Whisson D, Marsh KJ, Pascoe J, Le Pla M, et al. Faecal inoculations alter thegastrointestinal microbiome and allow dietary expansion in a wild specialist herbivore, the koala.Animal Microbiome. 2019;1:6.
1�. Taggart DA, Temple-Smith PDM. Southern hairy-nosed wombat. In: Van Dyck S, Strahan R, editors.The Mammals of Australia. Third. New Holland Publishers (Australia) Pty. Ltd; 2008. p. 204 – 206.
19. Swinbourne MJ, Taggart DA, Peacock D, Ostendorf B. Historical changes in the distribution of hairy-nosed wombats (Lasiorhinus spp.): a review. Aust Mammalogy. CSIRO PUBLISHING; 2017;39:1–16.
20. Swinbourne MJ, Taggart DA, Swinbourne AM, Lewis M, Ostendorf B. Using satellite imagery toassess the distribution and abundance of southern hairy-nosed wombats (Lasiorhinus latifrons).Remote Sensing of Environment. 2018;211:196–203.
21. Barboza PS, Hume ID. Digestive tract morphology and digestion in the wombats (Marsupialia:Vombatidae). J Comp Physiol B. 1992;162:552–60.
Page 16/24
22. Barboza PS. Digestive Strategies of the Wombats: Feed Intake, Fiber Digestion, and Digesta Passagein Two Grazing Marsupials with Hindgut Fermentation. Physiological Zoology. [University of ChicagoPress, Division of Comparative Physiology and Biochemistry, Society for Integrative and ComparativeBiology]; 1993;66:983–99.
23. Wells R. Vombatidae. Fauna of Australia Volume 1B Mammalia. Australian Government PublishingService, Canberra, Australian Capital Territory, Australia; 1989. p. 755–768.
24. Taggart DA, Finlayson GR, Sparrow EE, Dibben RM, Dibben JA, Campbell EC, et al. EnvironmentalFactors In�uencing Hairy-Nosed Wombat Abundance in Semi-Arid Rangelands. The Journal ofWildlife Management. 2020;84:921–9.
25. Wells RT. Field Observations of the Hairy-Nosed Wombat, Lasiorhinus Latifrons (Owen). Wildl Res.CSIRO PUBLISHING; 1978;5:299–303.
2�. Wells R, Green. Aspects of water metabolism in the southern hairy-nosed wombat Lasiorhinuslatifrons. Wombats. Surrey Beatty and Sons Ltd, Chipping Norton, New South Wales, Australia; 1998.p. 61–6.
27. Finlayson GR, Shimmin GA, Temple-Smith PD, Handasyde KA, Taggart DA. Burrow use and rangingbehaviour of the southern hairy-nosed wombat (Lasiorhinus latifrons) in the Murraylands, SouthAustralia. Journal of Zoology. Cambridge University Press; 2005;265:189–200.
2�. Finlayson GR, White CR, Dibben R, Shimmin GA, Taggart DA. Activity patterns of the southern hairy-nosed wombat (Lasiorhinus latifrons) (Marsupialia : Vombatidae) in the South AustralianMurraylands. Aust Mammalogy. CSIRO PUBLISHING; 2010;32:39–46.
29. Thornett E, Ostendorf B, Taggart DA. Interspecies co-use of southern hairy-nosed wombat(Lasiorhinus latifrons) burrows. Aust Mammalogy. CSIRO PUBLISHING; 2017;39:205–12.
30. Horsup AB, Johnson CN. Northern hairy-nosed wombat, Lasiorhinus krefftii. The Mammals ofAustralia. 3rd edn. Reed New Holland: Sydney; 2008. p. 202–4.
31. Camp A, Croxford AE, Ford CS, Baumann U, Clements PR, Hiendleder S, et al. Dual-locus DNAmetabarcoding reveals southern hairy-nosed wombats (Lasiorhinus latifrons Owen) have a summerdiet dominated by toxic invasive plants. PLOS ONE. Public Library of Science; 2020;15:e0229390.
32. Song SJ, Amir A, Metcalf JL, Amato KR, Xu ZZ, Humphrey G, et al. Preservation Methods Differ inFecal Microbiome Stability, Affecting Suitability for Field Studies. mSystems [Internet]. 2016 [cited2018 May 24];1. Available from: https://www.ncbi.nlm.nih.gov/pmc/articles/PMC5069758/
33. Eisenhofer R, Minich JJ, Marotz C, Cooper A, Knight R, Weyrich LS. Contamination in Low MicrobialBiomass Microbiome Studies: Issues and Recommendations. Trends in Microbiology. 2019;27:105–17.
34. Caporaso JG, Lauber CL, Walters WA, Berg-Lyons D, Lozupone CA, Turnbaugh PJ, et al. Globalpatterns of 16S rRNA diversity at a depth of millions of sequences per sample. PNAS.2011;108:4516–22.
35. Marotz C, Sharma A, Humphrey G, Gottel N, Daum C, Gilbert JA, et al. Triplicate PCR reactions for 16SrRNA gene amplicon sequencing are unnecessary. BioTechniques [Internet]. 2019 [cited 2019 May
Page 17/24
28]; Available from: https://www.future-science.com/doi/full/10.2144/btn-2018-0192
3�. Thompson LR, Sanders JG, McDonald D, Amir A, Ladau J, Locey KJ, et al. A communal cataloguereveals Earth’s multiscale microbial diversity. Nature. 2017;551:457–463.
37. Bolyen E, Rideout JR, Dillon MR, Bokulich NA, Abnet CC, Al-Ghalith GA, et al. Reproducible, interactive,scalable and extensible microbiome data science using QIIME 2. Nature biotechnology.2019;37:852–857.
3�. Amir A, McDonald D, Navas-Molina JA, Kopylova E, Morton JT, Xu ZZ, et al. Deblur Rapidly ResolvesSingle-Nucleotide Community Sequence Patterns. mSystems. 2017;2:e00191-16.
39. Quast C, Pruesse E, Yilmaz P, Gerken J, Schweer T, Yarza P, et al. The SILVA ribosomal RNA genedatabase project: improved data processing and web-based tools. Nucleic Acids Res. 2013;41:D590–6.
40. Bokulich NA, Kaehler BD, Rideout JR, Dillon M, Bolyen E, Knight R, et al. Optimizing taxonomicclassi�cation of marker-gene amplicon sequences with QIIME 2’s q2-feature-classi�er plugin.Microbiome. 2018;6:90.
41. Janssen S, McDonald D, Gonzalez A, Navas-Molina JA, Jiang L, Xu ZZ, et al. Phylogenetic Placementof Exact Amplicon Sequences Improves Associations with Clinical Information. mSystems.2018;3:e00021-18.
42. Faith DP. Conservation evaluation and phylogenetic diversity. Biological Conservation. 1992;61:1–10.
43. Lozupone CA, Hamady M, Kelley ST, Knight R. Quantitative and qualitative beta diversity measureslead to different insights into factors that structure microbial communities. Appl Environ Microbiol.2007;73:1576–85.
44. Lozupone C, Knight R. UniFrac: a New Phylogenetic Method for Comparing Microbial Communities.Applied and Environmental Microbiology. 2005;71:8228–35.
45. Mandal S, Treuren WV, White RA, Eggesbø M, Knight R, Peddada SD. Analysis of composition ofmicrobiomes: a novel method for studying microbial composition. Microbial Ecology in Health andDisease [Internet]. 2015 [cited 2015 Dec 3];26. Available from:http://www.microbecolhealthdis.net/index.php/mehd/article/view/27663
4�. Pruesse E, Peplies J, Glöckner FO. SINA: accurate high-throughput multiple sequence alignment ofribosomal RNA genes. Bioinformatics. 2012;28:1823–9.
47. Knights D, Kuczynski J, Charlson ES, Zaneveld J, Mozer MC, Collman RG, et al. Bayesian community-wide culture-independent microbial source tracking. Nat Meth. 2011;8:761–3.
4�. Wickham H. ggplot2: Elegant Graphics for Data Analysis [Internet]. Springer-Verlag New York; 2016.Available from: https://ggplot2.tidyverse.org
49. RStudio Team. RStudio: Integrated Development for R. RStudio, Inc, Boston, MA [Internet]. 2015;Available from: http://www.rstudio.com/
50. Minich JJ, Sanders JG, Amir A, Humphrey G, Gilbert JA, Knight R. Quantifying and UnderstandingWell-to-Well Contamination in Microbiome Research. mSystems [Internet]. American Society for
Page 18/24
Microbiology Journals; 2019 [cited 2020 Apr 15];4. Available from:https://msystems.asm.org/content/4/4/e00186-19
51. Bergman EN. Energy contributions of volatile fatty acids from the gastrointestinal tract in variousspecies. Physiological Reviews. American Physiological Society; 1990;70:567–90.
52. Flint HJ, Bayer EA, Rincon MT, Lamed R, White BA. Polysaccharide utilization by gut bacteria:potential for new insights from genomic analysis. Nature Reviews Microbiology. Nature PublishingGroup; 2008;6:121–31.
53. Hume ID, Warner ACI. Evolution of microbial digestion in mammals. In: Ruckebusch Y, Thivend P,editors. Digestive Physiology and Metabolism in Ruminants: Proceedings of the 5th InternationalSymposium on Ruminant Physiology, held at Clermont — Ferrand, on 3rd–7th September, 1979[Internet]. Dordrecht: Springer Netherlands; 1980 [cited 2020 Sep 2]. p. 665–84. Available from:https://doi.org/10.1007/978-94-011-8067-2_32
54. Shiffman ME, Soo RM, Dennis PG, Morrison M, Tyson GW, Hugenholtz P. Gene and genome-centricanalyses of koala and wombat fecal microbiomes point to metabolic specialization for Eucalyptusdigestion. PeerJ. 2017;5:e4075.
55. Filippo CD, Cavalieri D, Paola MD, Ramazzotti M, Poullet JB, Massart S, et al. Impact of diet inshaping gut microbiota revealed by a comparative study in children from Europe and rural Africa.PNAS. 2010;107:14691–6.
5�. Ley RE, Hamady M, Lozupone C, Turnbaugh PJ, Ramey RR, Bircher JS, et al. Evolution of Mammalsand Their Gut Microbes. Science. 2008;320:1647–51.
57. Flint HJ, Scott KP, Duncan SH, Louis P, Forano E. Microbial degradation of complex carbohydrates inthe gut. Gut Microbes. 2012;3:289–306.
5�. Horsup AB, Austin JJ, Fewster RM, Hansen BD, Harper DE, Molyneux JA, et al. Demographic trendsand reproductive patterns in the northern hairy-nosed wombat (Lasiorhinus krefftii) at Epping ForestNational Park (Scienti�c), central Queensland. Aust Mammalogy [Internet]. CSIRO PUBLISHING; 2020[cited 2020 Sep 2]; Available from: https://www.publish.csiro.au/am/AM20030
59. Woolford L, Fletcher MT, Boardman WSJ. Suspected pyrrolizidine alkaloid hepatotoxicosis in wildsouthern hairy-nosed wombats (Lasiorhinus latifrons). J Agric Food Chem. 2014;62:7413–8.
�0. Allison MJ, Hammond AC, Jones RJ. Detection of ruminal bacteria that degrade toxicdihydroxypyridine compounds produced from mimosine. Appl Environ Microbiol. 1990;56:590–4.
�1. Sundset MA, Barboza PS, Green TK, Folkow LP, Blix AS, Mathiesen SD. Microbial degradation ofusnic acid in the reindeer rumen. Naturwissenschaften. 2010;97:273–8.
�2. Kohl KD, Dearing MD. The Woodrat Gut Microbiota as an Experimental System for UnderstandingMicrobial Metabolism of Dietary Toxins. Front Microbiol [Internet]. 2016 [cited 2019 Oct 14];7.Available from: https://www.frontiersin.org/articles/10.3389/fmicb.2016.01165/full
�3. Groussin M, Mazel F, Alm EJ. Co-evolution and Co-speciation of Host-Gut Bacteria Systems. Cell Host& Microbe. 2020;28:12–22.
Page 19/24
�4. Walker FM, Taylor AC, Sunnucks P. Female dispersal and male kinship–based association insouthern hairy-nosed wombats (Lasiorhinus latifrons). Molecular Ecology. 2008;17:1361–74.
Figures
Figure 1
Map of study sites in South Australia. C = captive population (n = 21), K = Kooloola Station (n = 21), B =Brook�eld Conservation Park (n = 17), and W = Wonga Station (n = 23).
Page 20/24
Figure 2
Microbial diversity and composition of SHNW faecal samples. A) Captive individuals had signi�cantlylower phylogenetic diversity of microbes compared to wild individuals, and B) signi�cantly lowermicrobial richness (except vs. Wonga). Horizontal lines in the boxes represent the median values; thelower and upper bound of boxes represent 25th and 75th percentiles, respectively. Outliers are markedwith a cross. C)/D) Principal coordinates analysis (PCOA) of unweighted UniFrac distances show clearseparation of microbial compositions between captive and wild individuals across PC1. C) shows PC1 vsPC2 and D) shows PC1 vs. PC3. Each point represents a SHNW faecal sample, coloured by population,and the distances between points represents microbial composition differences (i.e. points closertogether have more similar microbial composition).
Page 21/24
Figure 3
Family-level microbial taxonomic bar charts of the 25 most abundant families collapsed by populationand a Venn diagram of ASVs found uniquely or shared between captive and wild individuals, with thepercentage total abundance of population-speci�c ASVs.
Page 22/24
Figure 4
Differences in microbial composition between the three SHNW populations. PERMANOVA of microbialcomposition between populations is statistically signi�cant. Principal coordinates analysis (PCOA) ofunweighted UniFrac distances show separation of Wonga and Kooloola/Brook�eld samples on PC1. PC2and PC3 appear to separate Kooloola and Brook�eld samples.
Page 23/24
Figure 5
Venn diagram of ASVs shared and unique between different SHNW populations, with the percentage totalabundance of population speci�c ASVs.
Supplementary Files
This is a list of supplementary �les associated with this preprint. Click to download.
SITable2kruskalwallispairwisePopulationobsFeat.csv
SITable1kruskalwallispairwisePopulationfaithsPD.csv
SIFiles.txt.txt
SITable4SourceTracker2.txt
SITable3SINA.xlsx
SIFigure4PCoAWeightedUniFracWild.pdf

Page 24/24
SIFigure3WeightedPCoACaptivevsWild.pdf
SIFigure2PhylaBarplotsOutliters.pdf
SIFigure1PCoAOutliers.pdf