microinsurance: a case study of the indian rainfall index...
TRANSCRIPT

Microinsurance: A Case Study of the
Indian Rainfall Index Insurance Market
Xavier Giné (World Bank)
Lev Menand (Federal Reserve Bank of New York)
Robert Townsend (MIT Economics Department)
James Vickery (Federal Reserve Bank of New York)*
Rainfall index insurance provides a payout based on measured local rainfall
during key phases of the agricultural season, and in principle can help rural
households diversify a key source of idiosyncratic risk. We describe basic
features of rainfall insurance contracts offered in India since 2003, and
document stylized facts about market demand and the distribution of payouts.
We summarize results of our previous research on this market, which
provides evidence that price, liquidity constraints and trust all present
significant barriers to increased takeup. We also discuss potential future
prospects for rainfall insurance and other index insurance products.
* Email contact: [email protected]; [email protected], [email protected], [email protected]. We thank BASIX for their generous provision of data and technical advice. We also express particular gratitude to K.P.C. Rao for his efforts in conducting field experiments and collecting survey data in Andhra Pradesh, and to our coauthors, especially Shawn Cole, for their insights. The views expressed in this paper are those of the authors, and do not reflect the opinions of the Federal Reserve Bank of New York or the World Bank.

1. Introduction
Households in India and other developing nations are often critically exposed to extreme
weather-related events, including drought, flood, tidal waves and hurricanes. For example, in a
household survey conducted by us in Andhra Pradesh, 89% of surveyed rural landowners cite
drought as the most important single risk faced by the household (Giné, Townsend and Vickery,
2008). Weather shocks often affect all households in a local geographic area, making some
forms of risk-coping, such as seeking help from nearby family, friends and neighbors, relatively
less effective. Globally, household exposure to extreme weather events is likely to increase over
future decades, due to climate change as well as population growth in risk-sensitive areas.1
Efforts have been made in India and other countries in recent years to develop formal insurance
markets to improve diversification of weather-related income shocks. The goal of this chapter is
to survey the features of one of these markets, namely the Indian rainfall index insurance
market. “Index insurance” refers to a contract whose payouts are linked to a publicly observable
index; in this case, the index is cumulative rainfall recorded on a local rain gauge during
different phases of the monsoon season.2 This form of insurance is now available at a retail level
in many parts of India, although these markets are still in their relative infancy in terms of
product design and distribution.
Rainfall insurance is only one of a growing range of “micro-insurance” products gaining
popularity in the developing world. Examples include policies relating to health, livestock,
accidental death and disability, property, weather, and microenterprise risk. Lloyd’s (2009)
estimates that around 135 million low income individuals around the world already make use of
micro-insurance in some form, and estimates a potential final market size of 1.5bn to 3bn
households. Growth in these markets reflects a broadening of efforts towards greater financial
access for the poor to include insurance and savings products in addition to micro-credit.
As with other types of microfinance, a key challenge for micro-insurance is to design products
that minimize transaction costs and ameliorate incentive problems, frictions which can otherwise
1 For example, see Balk et al. (2009), who use satellite mapping techniques to document population growth in areas subject to climate change and natural disasters. 2 World Bank (2005) examines ten index insurance case studies in countries as diverse as India, Malawi, Nicaragua, and Ukraine.
2

make financial services to the poor prohibitively expensive. The key feature of rainfall index
insurance that assists in this regard is that payouts are calculated based on a publicly observed
and exogenous variable, namely local rainfall. This significantly reduces transaction costs,
because the household does not need to formally file a claim, and the insurance company does
not need to do an inspection to estimate the amount of loss. Since rainfall data is observed in
close to real time, this also means that claims can in principle be calculated and disbursed
quickly to households. The use of an index also greatly reduces incentive problems, because the
household is unlikely to have significant private information about the distribution of future
rainfall shocks, and because the household cannot misreport the size of its loss.
The main disadvantage of index insurance is potential basis risk between the rainfall index and
the actual income loss suffered by the household. This will be greater when the distance between
the insured household and the rain gauge is larger, for example, or when actual yields correlate
poorly with the rainfall index. In addition, while index insurance is in part designed to minimize
transaction costs, these costs may still be significant relative to the modest value of insurance
purchased by an average policyholder, making the product expensive, at least by comparison to
insurance in the developed world. Finally, even if the insurance product is well designed, other
frictions may prevent households from purchasing it. For example, households may be liquidity
constrained, may not have a sufficient level of financial literacy to properly evaluate the product,
or may not fully trust the insurance provider.
As part of this chapter, we describe the basic structure of rainfall insurance contracts commonly
sold in India, and present some stylized facts on the distribution of returns on the insurance.
While aggregate data on market size and growth are difficult to come by, we do document
changes in product demand over time, summarizing data generously provided by the
microfinance institution BASIX.
We also describe stylized facts regarding the types of households that buy insurance, and factors
that inhibit demand for insurance, summarizing results of academic research conducted by three
of us [see Cole et al., 2009 and Giné et al., 2008]. Amongst our findings, we show that product
demand is quite price sensitive, suggesting that increased economies of scale and competition
could lead via lower prices to significant increases in insurance takeup. Our previous research
3

also shows that other frictions are also important for takeup, however, such as financial
constraints and the level of trust of the household in the insurance provider. We conclude with a
discussion of the future of rainfall insurance and other related index insurance products.
2. Monsoon variation and production risk
In 2007, agriculture in India accounted for 18.6% of GDP, employed more than 60% of the
country’s population and used 43% of its arable land (Hohl and Kannan, 2007). The country
largely depends on temporal and spatial diversification of rainfall to smooth weather-induced
volatility in incomes, especially since only 30% of arable land is irrigated (Gadgil et al. 2002;
Rao et al. 2000).
Several papers show that household incomes in India are sensitive to rainfall variation. Parchure
(2002) estimates that around 90% of variation in Indian crop production levels is due to rainfall
volatility. Using macro data from 1951-2003, Gadgil and Gadgil (2006) find that despite
substantial decreases in the contribution of agriculture to Indian GDP, severe droughts have
resulted in decreases between 2% and 5% of GDP throughout the period. A World Bank (2006)
study of adaptation strategies to droughts in Andhra Pradesh finds that, based on simulations of
a crop model, severe droughts (one in 30 years) are likely to decrease rice yields from 29% to
62% depending on the district. Yield losses of rain-fed crops also appear high, with different
crops being particularly vulnerable in different districts. Rosenzweig and Binswanger (1993)
also present evidence that weather shocks significantly affect agricultural profits, based on
ICRISAT panel data from the 1980s.
Figure 1 shows the actual onset of the monsoon over Kerala as announced by the Indian
Meteorological Department (IMD) as deviations in days from the normal onset of June 1st. It is
clear that there is significant volatility. This volatility however would be less of a concern if
available forecasts of the onset were accurate, so farmers could use them to adapt their
agriculture production decisions accordingly. The IMD issues a single long-range forecast of the
onset of the monsoon over Kerala around May 15. Despite recent advances in forecasting
techniques, even the onset conditional on the IMD forecast still displays substantial volatility.
Figure 2 shows the difference between the forecast and actual onset in days for each year. (For
example, in year 2005, the IMD forecasted that the monsoon would arrive in Kerala on June 13,
4

while it actually arrived on June 5, so the difference is 8 days.) This residual uncertainty in the
monsoon is reflected in a long and rich folk tradition of methods to predict the arrival of the
rains.3
Our survey data from Andhra Pradesh provides direct evidence that uncertainty about monsoon
onset is costly. In 2006, about a quarter of our sample had replanted in the past, and 73 percent
had abandoned the crop at least once in the past 10 years due to insufficient rains post-sowing.
Respondents report that the extra expenses borne by those that replant are large, equivalent to
20% of average total production expenses. This suggests that farmers would benefit from having
accurate priors about the onset of the monsoon (Gadgil et al. 2002).
In Giné, Townsend and Vickery (2010), we find evidence that farmers’ beliefs about the
monsoon are related to the benefits of having more accurate priors. In particular, farmers with
less access to risk coping mechanisms have more accurate priors; this increased accuracy leads
to average income gains of 8 to 9 percent of agricultural production.
3. Do households need formal rainfall insurance?
Innovative risk management tools like the rainfall insurance products discussed in this chapter
here are beneficial for household welfare only if other existing risk-sharing mechanisms are
inadequate (Townsend, 1994; Morduch, 1995; Lim and Townsend, 1998). This term
encompasses a wide range of different methods that households use to protect their consumption
and living standards from adverse events such as a poor monsoon. Some examples:
• Drawing on accumulated savings of liquid assets (e.g. cash, bank account balances etc.).
• Selling other assets (e.g. jewelry, land, livestock etc.).
• Borrowing from moneylenders, microfinance institutions (MFIs), banks or other
financial institutions.
• Informal risk-sharing arrangements with neighbors, friends, family etc. (For example, if
the household suffers an adverse shock, there may be an increase in remittance income
sent by family members living abroad, or financial assistance provided by other 3 This accumulation of indigenous knowledge over thousands of years is reflected in literature, folk songs, and proverbs or sayings. For example, farmers use the color of the sky, the shape and color of the clouds, the direction of the winds, the appearance of certain insects or migratory birds, and so on, to update the probability that the monsoon has arrived (Fein and Stephens, 1987).
5

households living in the same village, at least to the extent that those households are not
also affected by the same shock).
• Government assistance (e.g. government work programs, drought assistance programs
etc.).
• Formal insurance arrangements, like government crop insurance, or the rainfall
insurance product considered here.
If these mechanisms are insufficient, households affected by a drought or other adverse weather
events will experience a decline in consumption, or be forced to make costly adjustments in
labor supply, production, family planning and migration decisions (e.g. moving to an urban area
to find work if the monsoon crops fail). Each of these responses involves a potentially
significant welfare cost for the household. In addition, as emphasized by Morduch (1995),
households that are vulnerable to risk may also engage in a variety of costly ex-ante “income
smoothing” activities that reduce income variability, but at the cost of lower average income.
For example, a household with low savings concerned about monsoon risk may under-invest in
fertilizer or hybrid seeds at the start of the monsoon season, because of a desire to maintain a
stock of liquid savings in case the harvest fails.
We note that monsoon variation may be more difficult for households to smooth than other
adverse events, because a bad monsoon affects virtually every household in a local rural
geographic area. This makes several of the risk-sharing mechanisms described above less
effective. For example, informal risk-pooling arrangements amongst neighbors will not work,
because every household will have experienced a decline in agricultural income. Asset sales
may also be less effective as a way to compensate for lost income, simply because all
households will be seeking to sell assets at the same time. This in principle could push down
prices in the local asset market, due to a “cash in the market” or “fire sale” effect, an idea that is
modeled formally in Shleifer and Vishny (1992).
Previous research suggests that the mechanisms listed above do play an important role in
reducing the effects of income shocks on consumption and welfare. For example, Townsend
(1994) tests the benchmark of complete risk-sharing at the village level amongst rural
households in three villages in India. Under this benchmark, consumption of each household
6

commoves only with aggregate consumption of the village, and is not disproportionately
affected by idiosyncratic income shocks of the household. Consumption patterns are found to be
surprisingly close to the complete risk-sharing benchmark, although insurance is found to be
somewhat less complete for poorer households. Focusing on rainfall shocks, Paxson (1992)
finds that saving and dissaving by Thai households absorbs a large fraction of movements in
transitory household income due to rainfall variation. Yang and Choi (2007) and Miller and
Paulson (2007) find that remittance income responds significantly to rainfall shocks,
ameliorating the effects of income fluctuations on household consumption.
Despite these encouraging findings, a range of evidence also suggests many households remain
significantly underinsured against weather risk and other related shocks. Maccini and Yang
(2009) presents empirical evidence using Indonesian data that for females, local rainfall
variation around the time of birth significantly affects schooling, health and socioeconomic
status measured in adulthood, inconsistent with the notion that households are diversified against
rainfall risk. Duflo and Udry (2004) reject the null of perfect risk-sharing with respect to rainfall
shocks even within households. They show that rainfall-induced relative income shocks to
female-tended crops cause changes in the relative expenditure share of goods favored by
women, such as child education. Dercon and Outes (2009) present evidence that rainfall shocks
generate plausibly exogenous variation in income that can lead to poverty traps.
Furthermore, Rosenzweig and Binswanger (1993) present evidence that households do engage
in costly ‘income smoothing’ in response to rainfall risk, activities which they estimate
significantly reduce average income. These authors estimate using Indian data that a one-
standard deviation increase in average rainfall volatility is associated with a statistically
significant reduction in risk-taking and profits, equivalent to 15% of average profits for the
median farmer, and 35% of average profits for the bottom wealth quartile. Less directly focused
on rainfall shocks, Morduch (1995) and Townsend (1994) present evidence that poor households
are further from the full risk-sharing benchmark than wealthy households.
Household responses to qualitative surveys conducted by us in Andhra Pradesh are also
consistent with the proposition that households are not fully insured against rainfall shocks. In a
2004 survey, we ask households to list the three most important sources of risk they face.
7

Notably, 89% of farmers cite drought as the most significant source of risk they face. (See Giné
et al., 2008, for a table summarizing results of this survey question.) In addition, in surveys
conducted in Andhra Pradesh and Gujarat, households who chose not to purchase insurance
against rainfall risk were asked why. Only a very small fraction of these households (between
2% and 25% depending on the sample) cite “do not need insurance” as an explanation for non-
purchase. See Section 7 of this chapter for more details.
We conclude this section by noting our view that, despite the significant body of research cited
above, the literature studying the effect of monsoon quality on consumption, health, savings,
labor supply, and so on, is still very much incomplete. Much more needs to be understood about
exactly how rural households respond to an event like a severe drought, how large the welfare
consequences are, and how those costs are distributed amongst households. We believe that
further careful, systematic research on these questions would be very valuable, especially given
the potential for climate change to amplify weather variation in future years and decades.
4. Contract features
In India, formal rainfall insurance contracts were first developed by the general insurer ICICI
Lombard, with technical assistance from the World Bank (Hess, 2003). The ICICI Lombard
product was piloted in 2003 in the Mahabubnagar district of Andhra Pradesh, a semi-arid region
in south-central India; this pilot was expanded to also include villages in Ananthapur in 2004.
These pilot areas are also the study area for field research conducted by us, which has involved a
series of household surveys and field experiments conducted since 2004. Over time, rainfall
insurance has become more available across many parts of India, and policies are also now
underwritten by competing firms, including IFFCO-Tokio General Insurance Company, and the
government company Agricultural Insurance Company of India (AIC). Total amounts sold each
year remain relatively modest however (see Section 5 for a more detailed discussion of the
market structure and growth).
In this section we describe institutional features of these rainfall insurance contracts. We focus
on policies sold by ICICI Lombard, but also discuss competing products. At the end of the
section, we describe the distribution networks used to sell policies to households.
8

4.1 Coverage period and contract basis
Policies cover rainfall during the primary monsoon season, known as the “Kharif”. This is the
prime cropping season, which runs from approximately June to September. (Some farmers also
plant a second irrigation-fed “Rabi” crop during the winter season).
For purposes of contract design, the Kharif is divided into three contiguous, sequential phases,
each 35-45 days in length, intended to correspond to the agricultural phases of sowing,
vegetative growth and harvest. Insurance payouts in the first two phases are linked to deficient
rainfall. That is, the policy provides a positive payout if rainfall during the phase is below a
particular threshold or ‘strike’ level. In the third phase, corresponding to harvest, this is
reversed; the insurance provides a high payout if rainfall is higher than the threshold. This is
meant to protect farmers against heavy rains causing damage to mature crops.
4.2 How is rainfall measured?
Each policy is linked to rainfall at a particular rain gauge during a phase or phases of the
monsoon. ICICI Lombard policies are linked either to gauges maintained by the Indian
Meteorological Department (IMD), or to automatic gauges maintained by private vendors.
Policies are then marketed to households who live in areas close to the gauge. (For each study
village in Andhra Pradesh, the insurance product offered to households is based on a gauge
located no more than 20km from the village, generally significantly less).
4.3 Contract design
For each phase, the underlying index variable used to calculate payouts is accumulated rainfall
between the start date and end date of the phase, measured at a given reference weather station.4
The start of the first phase, rather than being a fixed calendar date, is set based on the monsoon
rains. Namely, it begins on the first date on which accumulated rain since June 1 exceeds 50mm,
or on July 1 if accumulated rain since June 1 is below 50mm.
4 Some adjustments are made to accumulated rainfall when constructing the rainfall index used to calculate payouts. If daily rainfall exceeds 60mm, only 60mm is counted towards the cumulative rainfall index. Also, rainfall <2mm is ignored. These adjustments reflect that heavy rain may generate water runoff, resulting in a less than proportionate increase in soil moisture, while very light rain is likely to evaporate before it soaks into the soil.
9

As an example, consider the contract linked to rainfall in phase 2 of the 2006 monsoon,
measured at the Narayanpet Indian Meteorological Department (IMD) weather station. The
structure of this contract is presented in Figure 3 below [source: Cole et. al., (2009)]. Although
contracts differ, the basic structure shown in Figure 3 is broadly representative of the contracts
underwritten by ICICI Lombard.
As the Figure shows, the policy pays zero if accumulated rainfall during the phase exceeds an
upper threshold, or ‘strike’, which in this case is 100mm. Otherwise, the policy pays Rs. 15 for
each mm of rainfall deficiency relative to the strike, until the lower threshold, or ‘exit’, is
reached. If rainfall is below the exit value, the policy pays a fixed, higher indemnity of Rs. 2000.
This exit level is meant to approximately correspond to crop failure. The choice of this non-
linear payout structure was in part made based on the use of crop models, in an attempt to
maximize the correlation between rainfall deficiency and loss of crop yield.
This example is for insurance on a single segment of the monsoon, in this case the second phase,
corresponding to vegetative growth. In general, households may choose to purchase policies for
an individual phase of the monsoon, or a single policy covering all three phases.
Rainfall index contracts offered by other underwriters differ somewhat from this structure. For
example, Cole et al. (2009) also discusses insurance offered to households in the state of
Gujarat, which is underwritten by IFFCO-Tokio. These policies have a simpler structure
covering cumulative rainfall over the entire monsoon.
4.4 Distribution networks
ICICI Lombard and other Indian rainfall insurance underwriters do not generally sell insurance
policies directly to farmers. Instead they use brokers, or partner with local financial institutions
in each rural area, which have well-established networks for the provision of financial services
to rural households. In our study areas, product marketing and distribution is performed by
BASIX, a large microfinance institution. In areas where it is active, BASIX has a network of
local agents, known as Livelihood Services Agents (or LSAs) who market a range of credit,
savings and insurance products to rural households. (See Cole and Tufano, 2007, for a
discussion of the business environment facing BASIX.)
10

BASIX receives a commission for each sale to cover marketing costs and payout disbursements.
At the end of the rainfall insurance coverage period, ICICI Lombard calculates payouts based on
measured rainfall, and provides funds to BASIX. BASIX then distributes payouts to households
through their LSA network, such as by setting up a meeting or collection station in each village
to distribute payouts once they become available.
To date, payouts have generally been made available to farmers by ICICI Lombard only some
months after the end of the monsoon season. This in part reflects delays in certifying weather
records by the IMD. However, we believe that this process could in principle be sped up
significantly, given that rainfall can in principle be measured almost in real time. Reducing the
delay between the realization of rainfall shocks and the settlement of claims should significantly
improve the attractiveness of the product, particularly for households facing liquidity
constraints. For example, payouts relating to Phase 1 (sowing) of the monsoon could be made
during the monsoon season itself, providing funds to help with the replanting of crops in the
wake of crop failure.
5. Market structure and growth
Even before weather insurance became available in 2003, Indian farmers seeking to protect their
crops could in principle attempt to do so through government crop insurance. India began to
pilot crop insurance in a limited way between 1972 and 1978. These early pilots were succeeded
by the Pilot Crop Insurance Scheme (PCIS) of 1979-1984 and after, the Comprehensive Crop
Insurance Scheme (CCIS) of 1985-1999. Both PCIS and CCIS were targeted to farmers with
loans from financial institutions. While the PCIS was voluntary, purchase of a CCIS policy was
compulsory if a loan was taken from a formal financial institution. In 1999, the National
Agricultural Insurance Scheme (NAIS) was introduced, replacing the CCIS. NAIS is available
to borrowers and non-borrowers, although the vast majority of clients remain those forced to buy
insurance as a condition of receiving a loan.
Each of the schemes described above employs an “area approach”. An insurance payout is
triggered if measured crop yields from the area fall below a certain threshold, based on crop
cutting experiments conducted on a sample of monitored selected plots. Distinct from the earlier
11

schemes, NAIS is based on an area approach for widespread calamities such as drought, but also
includes an “individual approach” for localized weather events, such as landslides, floods and so
on.
Premiums for crop insurance depend on the crop grown and are subsidized by 50% for small and
marginal farmers. The subsidy is shared equally between the central and state government. In
2007, NAIS covered close to 20 million farmers in 23 Indian states and spanned over 30
different crops for the Kharif and 25 crops during Rabi season. Annual premia collected are
around $150m USD, covering 10 per cent of sown area and 7 per cent of farmers.
Despite the high subsidies and a resulting high ratio of claims to premia (Sinha, 2004; Raju and
Chand, 2007; Nair, 2010), voluntary purchase of government insurance by farmers is very low.
This likely reflects in part a number of limitations in product design, which are discussed in
detail in Kalavakonda and Mahul, (2004), and also in the online Appendix S1 of Giné et al.
(2008). In particular: (1) NAIS applies a uniform premium for each crop type, leading to
mispricing and adverse selection, (2) understanding of the insurance is limited, and purchasing
and claiming payouts involves significant administrative costs, (3) not all crops are covered by
the scheme, (4) in some areas the geographic unit over which a crop cutting experiments are
conducted is large, generating excessive basis risk, (5) claims take on average a year to be
settled after the end of the growing season, (6) crop cutting experiments are expensive to
conduct, and may produce noisy results if not conducted in large enough samples.
Following initial pilot tests of ICICI rainfall insurance in 2003, IFFCO-Tokio General Insurance
developed its own rainfall insurance product, offered in Andhra Pradesh, Karnataka and Gujarat
in 2004. The same year, AIC introduced “Varsha Bima” (rainfall insurance) in 20 gauges of
Andhra Pradesh, Karnataka, Rajasthan and Uttar Pradesh. Since then, ICICI has expanded its
portfolio to cover 11 states with contracts in over 200 locations and up to 13 crops per location.
Other insurance companies have similarly expanded sales of the product.
Even before the introduction of ICICI Lombard rainfall insurance, some observers had argued
that traditional crop insurance could be successfully replaced by other index insurance products
(Skees, Hazell and Miranda, 1999). In the 2007 union budget speech, the Indian finance minister
12

stated that “AIC’s […] pilot weather insurance scheme […] appears to be a more promising risk
mitigation scheme” and allocated USD $25m to insurance companies to further develop weather
based insurance schemes on a pilot basis as an alternative to NAIS. AIC launched the first pilot
of the Weather-Based Crop Insurance Scheme (WBCIS) in Karnataka for Kharif 2007. For Rabi
2007-08 the scheme was expanded to 4 states, and for Kharif and Rabi 2008-09 to 10 states.
Similar to NAIS, WBCIS also operates on an area approach, except that area payouts are linked
to a rainfall gauge, rather than measured crop yields. Although insurance companies charge
actuarial rates, the farmers only pay a premium at par with NAIS. The remainder is borne
equally by the central and implementing state governments. All insurance companies (both
private and public) are invited to submit proposals for specific policies, and if approved are
entitled to this premium subsidy support. At present, despite AIC having the largest market
share, both ICICI Lombard and IFFCO-Tokio do participate in WBCIS in various states.
5.2 BASIX
In this section we present information on trends in policies sold by the MFI BASIX since 2003,
using administrative data generously provided to us by them. BASIX was the vendor for ICICI
Lombard’s original pilots of rainfall insurance in 2003. After an initial two year launch with
several hundred policy holders in Andhra Pradesh, BASIX expanded into five states in 2005. In
that year, 6,694 households purchased over 20,000 phases of insurance, including 43 distinct
contracts.
Trends in sales of rainfall insurance by BASIX in Andhra Pradesh are presented in Figure 4 and
Table 1.5 This data shows that there has been a secular increase in the number of phases of
insurance sold, as well as the number of customers served. The number of purchasers increases
from 194 households in 2003 to 14,542 policies in 2009, held by 7,567 different households.
Note that in the table we draw a scored line below 2004. This is because from 2005 onwards,
households were able to purchase individual phases of insurance. (In 2003 and 2004, farmers
could only buy a policy covering all three phases of the monsoon – we count that as three phases
of coverage for the purposes of calculating figures in Table 1). Note that these trends are not due
5 Although we have also data on BASIX insurance sales in other states also, we focus on Andhra Pradesh for this analysis, to avoid confounding effects associated with the introduction of subsidized insurance by AIC under WBCIS in some other states. Policies sold in Andhra Pradesh are not subject to government subsidies.
13

to any government subsidies, since WBCIS is not active in Andhra Pradesh. Policies are priced
and sold on a purely commercial basis.
The “sum insured” in Table 1 is the maximum payout of the insurance, meant to correspond to
cases of crop failure. As shown by the final column of the table, this amount is generally more
than 10 times as large as the policy premium in each year of the sample. Thus, the policy
provides a very high rate of return in the worst case scenario when rainfall is very low.
A contributing factor to the specific types of policies sold that is perhaps generally overlooked is
the role of insurance agents. In Andhra Pradesh, policies are sold through BASIX LSAs, who
are responsible for client education and the sale of other microinsurance, savings and credit
products. There are on average 13 LSAs in each location (rainfall station) which roughly
corresponds to a BASIX branch. Each of these LSAs has on average 22 microinsurance
customers (median is 15) and each customer buys on average 2.7 phases (median is 3, which
coincides with the bundle policy). Interestingly, our data suggests that around half of the LSAs
sell the exact same number and type of phases to each of his or her clients (e.g. 1 unit of phase 1
and 1 unit of phase 2), even though there is significant variation across LSAs selling in a given
location. This suggests the suggestions of the LSA are a significant influence on household
insurance demand.
While the popularity of rainfall insurance has increased over this period, growth has been steady
rather than spectacular. As a point of comparison, Figure 5 plots growth in rainfall insurance and
livestock insurance sold by BASIX since 2005. Over this period, livestock insurance coverage
has grown five-fold, compared to about a 50% increase in coverage for rainfall insurance. This
is not simply due to a difference in value, since as we discuss below, payouts on rainfall
insurance are if anything greater relative to premia than is the case for livestock insurance.
Section 7 describes some of the barriers to household participation in rainfall insurance
products.
6. Distribution of payouts
How often should a household expect rainfall insurance to pay out? How large is the expected
return relative to premiums? In this section we present evidence on the distribution of insurance
14

payouts, based on a long span of historical rainfall data, combined with contract specifications
from a previous paper by us. We also present information on actual payouts on policies sold in
recent years, again based on administrative data generously provided to us by BASIX.
6.1 Putative historical distribution
In a previous paper, Giné, Townsend and Vickery (2007), we use approximately three decades
of daily historical rainfall data to estimate a putative distribution of insurance returns, based on
11 different contracts offered to farmers in Andhra Pradesh in 2006. Namely, we estimate
payouts for each year of our rainfall data, assuming the 2006 contracts had been available during
that year. Each of the 11 contracts we study is linked to rainfall data from the Indian
Meteorological Department (IMD). The history of past rainfall data also comes from the IMD.
The estimated distribution of returns is presented in Figure 2 below. The x-axis for the graph is
‘payout rank,’ which ranks payouts in increasing order of size, expressed on a scale from 0 to 1.
Figure 2 plots payout amount against payout rank. (The minimum payoff is zero, the maximum
payoff is Rs. 1000). The calculated distribution presented in the Figure suggests that returns on
the rainfall insurance are highly skewed. The payout is zero up to a payout rank of 0.89 (i.e. the
89th percentile), indicating that an indemnity is paid in only 11% of phases. The 95th percentile
of payouts is around Rs. 200. In about 1% of phases, the insurance pays an indemnity of Rs.
1000, which is the maximum payout for each of these 11 contracts. Thus, the policies appear
primarily to insure against extreme tail events, with around half of the value of indemnities
being generated by the highest-paying 2% of phases.
Giné et al. (2007) also calculates the ratio of expected payouts on rainfall insurance relative to
premia. We estimate that this ratio is around 30% on average across the 11 weather stations.
This relatively low payout rate likely reflects a number of factors, amongst them a lack of
economies of scale given the small initial market for the product, and limited competition
amongst insurance providers. Payout ratios would likely converge to a higher value in a mature
market. Interestingly, in Cole et al. (2009), we estimate using a simple theoretical model
calibrated to empirical estimates that the insurance may still be valuable to Indian households
even at low payout ratios such as 30%.
15

One limitation of Giné et al. (2007) is that the historical record of rainfall may be an imperfect
guide to the future distribution of monsoon events, for example because global warming has led
to a higher probability of extreme outcomes. While some preliminary hypothesis tests fail to find
evidence of structural change, these tests are likely not to be very powerful, given our short
history of rainfall data and the skewed return distribution. Below we present some additional
evidence on actual payouts relative to premia on policies sold by BASIX since 2003.
6.2 Recent payouts
We again use administrative data provided by BASIX to calculate the ratio of total insurance
payouts to total premia each year since 2005. We do the same for livestock insurance policies
sold by BASIX. Results are presented in Figure 7.
Two facts are apparent from the Figure. First, average payouts on rainfall insurance are much
more volatile, reflecting aggregate variation in the quality of the monsoon. In particular, the
severe drought conditions of 2009 corresponded to a surge in payouts, which exceed 350% of
premia collected.
The second fact is that average returns on the insurance product are actually quite high over this
period, and in fact are better than actuarially fair based on a simple average of payout ratios
across these years. This return is significantly higher than the 30% calculated in Giné et al
(2007). This may reflect some unusual shocks over the past few years, particularly the record
drought in 2009. Alternatively, it may be due to structural change in weather conditions, such as
an increase in the volatility of the monsoon, which mean that the calculations in Giné et al.,
which are based on historical data, underestimate expected payouts. Notably, returns on
livestock insurance are significantly less volatile than for rainfall insurance, and average around
60% of premia collected over this period.
7. Who buys rainfall insurance?
In this section we discuss evidence from two of our original research papers studying factors
determining rainfall insurance participation. In Giné et al. (2008), we estimate a simple
regression model of the determinants of insurance demand, based on household characteristics
like wealth, landholdings, risk aversion and so on. Cole et al. (2009) presents results of a series
16

of randomized trials, in which households in Andhra Pradesh and Gujarat are either visited by
insurance educators, or presented with promotional material such as flyers and videos. Various
aspects of these interventions are randomized across households (e.g. the price of the insurance
or the amount of financial education provided). These field experiments provide direct causal
evidence of the determinants of rainfall insurance demand, free of identification problems.
Evidence from these two papers relates to a fundamental research question: Why aren’t financial
products that help pool important sources of idiosyncratic risk (such as rainfall) widely available
and widely used? A first potential answer to this question is simply that these products are too
expensive to be attractive to households. Section 6 presents some evidence that rainfall
insurance expected payouts on average appear to be significantly smaller than average premia,
presumably reflecting a combination of transaction costs, limited product market competition, or
a lack of scale economies. High costs are a persistent feature of financial services offered to the
rural poor in India and other developing economies, even for financial products that are widely
used. For example, Cull, Demirguc-Kunt and Morduch (2009) estimate that annual operating
costs for nonbank microcredit loans are equal to 17-26% of loan value, far higher than
corresponding ratios for consumer credit in the developed world.
An alternative view is that, while price is an important factor, other frictions, such as financial
constraints, trust and financial literacy are equally important barriers to increasing market
penetration of index insurance products. A more complete selection of potential determinants of
rainfall insurance demand is presented below:
1. Price relative to expected payouts. All else constant, a higher insurance policy price
should clearly be associated with lower insurance demand amongst households.
2. Availability of alternative risk-sharing arrangements. Some households may have
limited need for formal rainfall insurance, because of the availability of other informal
insurance arrangements, remittances, government and bank assistance during times of
drought, and so on. While these other channels may certainly ameliorate demand, as
described in Section 3, however, there is significant evidence that households are far
from being fully insured against rainfall risk.
17

3. Risk aversion, and basis risk. Any standard model of insurance demand will predict
that demand is increasing in the degree of household risk aversion. (In the limit, a
household that is perfectly risk-neutral has no demand for insurance whatsoever.) In
addition, demand will be declining in the level of basis risk, or equivalently, will be
increasing in the correlation between the insurance payoffs and the risk being insured.
For example, if the reference rain gauge is located far away from the household,
measured index rainfall may be poorly correlated with the amount of rain that falls on
the household’s crops. The noisier the insurance payoffs relative to the household’s
marginal utility of consumption, the lower will be household demand.
4. Ex-ante liquidity constraints. Insurance premia must be paid at the start of the
monsoon, while payouts are not generally received until the end of the monsoon season.
A liquidity constrained household may thus have a high willingness-to-pay for
insurance, but not have sufficient liquid assets at the start of the monsoon to purchase it,
given competing uses for those funds, such as investment in fertilizer or other
agricultural inputs.
5. Understanding of the product, and learning. Most target rural households have
relatively limited education, and may simply not understand the main features of the
product, or be able to accurately estimate the probability of different payoffs. Given
some ambiguity aversion, this lack of understanding is likely to reduce demand.
Households may also learn over time about the product, by observing whether it pays out
in response to different monsoon seasons.
6. Trust. Related to the above point, households who do not fully understand the product
may put significant weight on their trust in the insurance provider or the individual who
markets the product to them. They may also rely on product endorsements from a trusted
friend, village leader or family member. Guiso, Sapienza and Zingales (2007) argue trust
has important effects on financial market participation.
7. Framing and behavioral influences. Research in psychology and behavioral economics
suggests households are affected by subtle changes in the way a product is presented to
them. For example, in a field experiment in South Africa, Bertrand et al. (2009) find
subtle advertising cues significantly influence credit demand; for example, including the
picture of a man rather than a woman on an advertising flyer for a consumer loan shifts
loan demand by as much as a change of up to 2.2% in the monthly interest rate.
18

7.1 Empirical evidence
Our research has sought to identify the relative importance of the different demand factors
described above. As a first simple type of evidence, Giné et al. (2009) presents results of
household surveys from our study areas in Andhra Pradesh and Gujarat. These surveys ask
households to describe in open-ended fashion why they did or did not purchase insurance.
Responses are classified into one of a number of categories. Households who purchase insurance
generally cite reasons relating to “security” or “risk reduction”. Reasons cited by households
who do not purchase insurance are presented in Table 2.
In 2006, the most common single reason cited by households in both samples is ‘insufficient
funds to buy insurance’. This response is particularly common in Andhra Pradesh, where it is
cited by over 80% of households as the most important reason for non-purchase. This response
is suggestive of the role of liquidity constraints in retarding demand for the product.
Explanations relating to product quality, such as “it is not good value” and “it does not pay out
when I suffer a loss”, are much less frequently cited, and only a small fraction of households cite
“do not need insurance” as a reason for non-purchase (2.8% in Andhra Pradesh and 25.2% in
Gujarat). This low fraction appears consistent with the evidence cited in Section 3 that
households are not fully insured against rainfall risk. Notably, in 2004, a significant fraction of
Andhra Pradesh households, 21%, cite “do not understand insurance” as the primary reason why
they did not purchase any policies. This fraction falls to only 2% by 2006, as households
become more familiar with the product.
Cole et al. (2009) also conducts a series of formal field experiments to provide causal evidence
on several of the demand factors listed above. In Andhra Pradesh, this is done through
household visits by an insurance educator. A random subset of our sample receives a household
visit. Various aspects of the visit are then randomized across households. In Gujarat, treatments
consist of either a flyer given to the household, or a video about the product that is shown to the
farmer using a mobile video player. Content of the flyer and video are randomized across
households. (Households are tracked via a registration number on each flyer, which the
household presents when they buy insurance in return for a small discount on the product.) The
main findings of Cole et al. are summarized below:
19

Price. In Gujarat, households receive a discount on insurance by presenting the flyer they were
given by the insurance survey team. In a subset of the cases, the size of this discount is
randomized across flyers. We find that takeup of insurance is significantly affected by the size
of the discount offered.
A summary of these results is presented in Table 3. In each district where discounts were
offered, an increase in the size of the discount offered to households significantly increases the
take-up rate of the insurance product. (In Cole et al., it is shown that this change is statistically
significant at the 1% level.) Given the initial insurance premia, our calculations imply that a
10% decrease in price increases product participation by 6.6 to 8.7 percent, suggesting demand
is significantly price sensitive.
This observed price sensitivity underlines the importance of achieving economies of scale and
maximizing competition amongst providers of insurance. However, Table 3 also shows that
many households do not purchase insurance even when the product is better than actuarially fair.
This suggests other frictions are also important constraints on demand.
Liquidity constraints. In household visits in Andhra Pradesh, households are given a monetary
reward for their time from the insurance educator. The size of this payment is randomized across
households. The payment size has a very significant effect on insurance demand; a payment of
Rs. 100 rather than Rs. 25 increases the probability of insurance purchase by 34.7 percentage
points, and thus more than doubles demand compared to an average takeup rate of 27%.
Interestingly, this effect is strongest among poorer households.
This finding suggests liquidity constraints may be an important determinant of insurance
demand. Consistent with this finding, Cole et al. (2009) and Giné et al. (2008) find in cross-
sectional regressions that insurance participation is positively correlated with wealth, even
though the benefits of insurance are likely to be stronger for the poorest households. It is also
consistent with the survey evidence presented above (i.e. that insufficient funds are the most
common explanation cited by households for non-purchase of insurance).
20
Trust. In Andhra Pradesh, it is found that insurance demand is significantly higher when the
insurance educator, who is a village outsider, is endorsed by a trusted third party, namely, the
local BASIX representative, who visits the village regularly and is known to locals. This
endorsement increases takeup by 6.2 to 6.5 percentage points across the whole sample. Notably,
this is entirely due to an effect amongst households that are familiar with BASIX. Amongst this
subset of households, endorsement increases takeup by 10.9 percentage points. For households
unfamiliar with BASIX, the effect is economically small and statistically insignificant.
Gujarat experiments also provide some evidence consistent with trust and endorsement effects.
Namely, each flyer contains a written product endorsement from an individual identified by their
name and setting as being Muslim, Hindu or a neutral figure. Amongst a subset of flyers, it is
shown that takeup is higher when the religious affiliation of the figure in the flyer matches the
affiliation of the household.
Together these results provide direct causal evidence that trust influences financial system
participation, consistent with Guiso et al. (2007).
Financial education. In our Andhra Pradesh experiments, some household visits involve the
insurance educator presenting a more extended education module about the product. This
additional financial education is shown to have no statistically significant effect on takeup.
While it is quite possible that this simply reflects a poor design of the education module, this
result suggests some types of financial literacy training may not be useful to households, also
consistent with the results of Cole, Sampson and Zia (2009).
Framing and saliency. Saliency of the product appears to significantly affect takeup, in the
sense that Andhra Pradesh households who receive a visit from an insurance educator are more
likely to purchase insurance, even if the household visit is not combined with any of the other
treatments. In Gujarat, we test a number of behavioral biases and framing effects. These in
general are not found to significantly influence takeup (see Cole et al. for full details).
7.3 Summary and implications
21
These field experiments suggest that insurance demand is significantly price sensitive, but also
that other barriers, particularly liquidity constraints and trust, are significant barriers to higher
household participation in index insurance products.
8. Does insurance provision affect behavior?
Despite tremendous increases in global agricultural productivity brought about by the Green
Revolution, traditional farming practices still predominate in many parts of India and in other
developing countries. This holds despite high expected rates of return from switching to more
productive technologies such as higher-yielding seeds and fertilizer (see Duflo, Kremer and
Robinson, 2008, and Suri, 2009, for evidence from sub-Saharan Africa).
Credit constraints and limited access to information are often proposed as explanations for low
investment and technology adoption in the developing world (Feder, Just and Zilberman, 1985).
An additional explanation may be that low agricultural investment is a constrained-optimal
response to the riskiness of these investments. Although key farm inputs increase average
agricultural profitability, there is significant variation in their return on investment. For example,
the application of fertilizer in semi-arid areas in India relies on sufficient rainfall for it to be
effective. Thus, the return on fertilizer investments is very dependent on weather conditions,
which are beyond the household’s control. Consequently, risk averse households may be
unwilling to bear consumption fluctuations associated with these investments, and may decide
not to adopt them, or instead to shift towards lower-risk, lower-return alternatives.
Dercon and Christiaensen (2007) provide evidence of this hypothesis using panel data on rural
households from Ethiopia. Fertilizer purchases are lower among poorer households due to both
liquidity constraints and their inability to cope ex-post with adverse shocks. Thus, lack of
insurance leads to underinvestment in fertilizer (see also Lamb, 2003 and Horowitz and
Lichtenberg, 1993).
Some additional supportive evidence is presented in Cai et al. (2009), who examine changes in
incentives of insurance sales staff to study the impact of insurance on livestock rearing in
southwestern China. These authors present evidence that increased insurance provision increases
22

investment in livestock. Shapiro (2009) presents evidence from Mexico that participation in a
government disaster relief program leads to an increase in the use of more expensive capital
inputs and in the probability of sending a migrant abroad. Laboratory experiments by Lybbert et
al. (2009) and Hill and Visceisza (2009) also suggest that over time, subjects learn the benefits
of insurance and capitalize on it.
For the 2009 Kharif, we have designed an experiment to study whether the provision of formal
insurance leads to higher adoption rates of fertilizer and other productive agricultural
investments. Before planting, participating households were offered a (randomly determined)
discount on fertilizer, as well as one of two financial products: rainfall insurance (similar to
those sold in previous years) sufficient to cover the input costs of planting for one hectare of the
main cash crop in the region; or the promise of a cash payment equivalent to the expected
payout of these policies, to be paid at harvest time. Our preliminary results suggest the effects of
insurance provision on fertilizer purchase and application are limited, although our research is
still ongoing.
9. The future of rainfall insurance
Rainfall insurance and other index insurance products present a promising way to insure a key
source of idiosyncratic risk faced by rural households in rain-sensitive areas. While growing
over time, rainfall insurance takeup is still modest. In part this reflects several barriers identified
in our research, including high prices driven by transaction costs and a lack of economies of
scale, as well as liquidity constraints, and factors related to trust and learning about the product.
These research findings suggest some possible practical innovations to the way the product is
delivered to households. For example, the importance of liquidity constraints suggests policies
should be paid out as quickly as possible, especially during the monsoon season when our data
suggests households are particularly credit constrained. This has not always occurred in the past,
at least in our study areas. (Related, it is also likely helpful to be as explicit as possible up-front
with the farmer about the timing of the payment of any payouts.) A further possible design
change would be to combine the product with a short-term loan, or equivalently, originate loans
with interest rates that are explicitly state-contingent based on rainfall outcomes, to help
alleviate credit constraints.
23

As another example of ongoing financial innovation, insurance companies are partnering with
weather data providers, such as NCMSL, which are installing automated rainfall gauges
throughout India. The use of these automated gauges can help ameliorate basis risk and reduce
the delay before payouts can be calculated and paid. Historical data are not available for these
new gauges, however, complicating the process of setting a fair premium. A promising
alternative in areas that lack good rainfall data is the NDVI index, which measures vegetation
greenness in a pre-specified grid using satellite imagery. This satellite data exists for several
years; this approach may also have less basis risk than a rainfall index. The Centre for Insurance
and Risk Management in Chennai is currently involved in a pilot of this product in Andhra
Pradesh.
In some cases where household financial literacy is low, or other barriers to takeup are too high,
insurance policies could be targeted to groups, such as an entire village, a producer group or
cooperative. The group could then decide or pre-arrange how best to allocate funds amongst its
members in case of a payout. Policies could also be sold to input companies. For example,
during the 2005 monsoon season, Monsanto bought a bulk weather insurance policy so that it
could attach free weather insurance coupons for a minimal level of drought coverage to its
cottonseed packets which were sold to 100,000 farmers in Maharashtra.
The 11th Indian five-year plan (2007-2012) asks the government to earmark USD 7000 million
for insurance, so that 40 percent of farmers will be insured by 2011-12. Developments in rainfall
insurance and other micro-insurance markets are already contributing towards this ambitious
goal. As these insurance markets mature, they are likely to significantly improve risk
management opportunities amongst Indian households and entrepreneurial firms.
24

References A. Our academic research on rainfall insurance Cole, Shawn, Xavier Giné, Jeremy Tobacman, Petia Topalova, Robert Townsend and James Vickery, 2009, Barriers to Household Risk Management: Evidence From India, Harvard Business School Working Paper 09-116. Online at http://ssrn.com/abstract=1374076. Giné, Xavier, Robert Townsend and James Vickery, 2010, Forecasting When It Matters: Evidence from Semi-Arid India, Working Paper. Giné, Xavier, Robert Townsend and James Vickery, 2008, “Patterns of Rainfall Insurance Participation in Rural India”, World Bank Economic Review, 22, 539-566. Online at: http://ssrn.com/abstract=1318107 Giné, Xavier, Robert Townsend and James Vickery, 2007, “Statistical Analysis of Rainfall Insurance Payouts in Southern India”, American Journal of Agricultural Economics, 89, 1248-1254. Online at: http://ssrn.com/abstract=1100218 B. Other cited papers Balk, Deborah, Thomas Buettner, Gordon McGranahan, Mark R. Montgomery, Christopher Small, Donghwan Kim, Valentina Mara, Megan Todd, S. Chandrasekhar and Sandra Baptista, 2009. Mapping the Risks of Climate Change in Developing Countries. Unpublished manuscript, City University of New York. Bertrand, Marianne, Dean Karlan, Sendhil Mullainathan, Eldar Shafir and Jonathan Zinman, 2009, “What's Advertising Content Worth? Evidence from a Consumer Credit Marketing Field Experiment” Quarterly Journal of Economics, forthcoming. Cai, Hongbin, Yuyu Chen, Hanming Fang and Li-An Zhou, 2009, Microinsurance, Trust and Economic Development: Evidence from a Randomized Natural Field Experiment. Working Paper, University of Pennsylvania. Cole, Shawn, Thomas Sampson and Bilal Zia, 2009, Money or Knowledge? What Drives Demand for Financial Services in Emerging Markets? Harvard Business School Working Paper 09-117. Cole, Shawn and Peter Tufano. 2007. “BASIX” Harvard Business School Case 207-099. Cull, Robert, Asli Demirguc-Kunt and Jonathan Morduch, 2009, Microfinance Meets the Market, Journal of Economic Perspectives, 23 (1), 167-192. Dercon, S. and L. Christiaensen (2007). Consumption risk, technology adoption and poverty traps: Evidence from Ethiopia. World Bank Policy Research Working Paper 4257. Dercon, Stefan and Ingo Outes, 2009, Income Dynamics in Rural India: Testing for Poverty Traps and Multiple Equilibria, Working Paper, Oxford University.
25

Duflo, Esther, Michael Kremer and Jonathan Robinson 2008 “How High are Rates of Return to Fertilizer? Evidence from Field Experiments in Kenya”, American Economic Review Papers and Proceedings 98 (2): 482-488. Duflo, Esther and Chris Udry, 2004, Intrahousehold Resource Allocation in Cote d’Ivoire: Social Norms, Separate Accounts and Consumption Choices, NBER Working Paper No. 10498. Feder, Gershon, Richard Just and David Zilberman, 1985. "Adoption of Agricultural Innovations in Developing Countries: A Survey," Economic Development and Cultural Change, University of Chicago Press, vol. 33(2), pp. 255-98. Fein, J. and P. Stephens. 1987. Monsoons. John Wiley and Sons, New York, NY. Gadgil, Sulochana and Siddhartha Gadgil, 2006, The Indian Monsoon, GDP and Agriculture. Economic and Political Weekly, 4887- 4895. Gadgil, S., P.R. Seshagiri Rao, and K. Narahari Rao. 2002. Use of Climate Information for farm-level decision making: rainfed groundnut in southern India. Agricultural Systems, 74:431–457. Guiso, Luigi, Paola Sapienza and Luigi Zingales, 2008, Trusting the Stock Market, Journal of Finance, 63(6):2557‐2600. Hess, U. 2003. Innovative financial services for rural India: Monsoon-Index lending and insurance for small-holders, ARD Working Paper 9, World Bank, Washington, DC. Hill, Ruth Vargas and Angelino Viceisza, 2009, An Experiment on the Impact of Weather Shocks and Insurance on Risky Investment. Mimeo, IFPRI. Hohl, R. and H. Kannan. 2007. “Greenfield for Agriculture Insurance” IRDA Journal (December): 17-19. Horowitz, J. and E. Lichtenberg. 1993. “Insurance, Moral Hazard, and Chemical Use in Agriculture” American Journal of Agricultural Economics 75 (November): 926-935. Kalavakonda, Vijay and Olivier Mahul, 2004, Crop Insurance in Karnataka, Working Paper, World Bank. Lamb, R. 2003 “Fertilizer Use, Risk and Off-Farm Labor Markets in the Semi-Arid Tropics of India” American Journal of Agricultural Economics 85(2):359-371. Lim, Youngjae and Robert Townsend. 1998. “General Equilibrium Models of Financial Systems: Theory and Measurement in Village Economies.” Review of Economic Dynamics 1 (1): 59–118.
26

Lloyd’s, 2009, Insurance in Developing Countries: Exploring Opportunities in Microinsurance. Report produced in conjunction with the MicroInsurance Centre. Available online at: http://www.microinsurancecentre.org/UI/DocAbstract.aspx. Lybbert, Travis, Francisco Galarza, John McPeak, Christopher B. Barrett, Steve Boucher, Michael R. Carter, Pin Chantarat, Aziz Fadlaoui, Andrew Mude. 2009. “Dynamic Field Experiments in Development Economics: Risk Valuation in Morocco, Kenya and Peru” University of California at Davis Working Paper. Maccini, Sharon and Dean Yang, 2009, Under the Weather: Health, Schooling, and Economic Consequences of Early-Life Rainfall, American Economic Review, 99, 1006-1026. Miller, Douglas and Anna Paulson, 2007, “Risk Taking and the Quality of Informal Insurance: Gambling and Remittances in Thailand”, Federal Reserve Bank of Chicago Working Paper 2007-01. Morduch, Jonathan. 1995. Income Smoothing and Consumption Smoothing. Journal of Economic Perspectives 9 (3): 103–14. Nair, R. 2010. “Crop Insurance in India: Changes and Challenges” Economic and Political Weekly, February 6th: 19-22. Parchure, R. 2002. “Varsha Bonds and Options: Capital Market Solutions for Crop Insurance Problems.” mimeo, India. Paxson, Christina H.., 1992, ‘Using Weather Variability to Estimate the Response of Consumption to Changes in Transitory Income in Thailand’, American Economic Review, 82, 15-33. Rao, Narahari, S. Gadgil, P.R. Seshagiri Rao, and K. Savithri. 2000. Tailoring strategies to rainfall variability – The choice of the sowing window. Current Science, 78(10):1216–1230. Raju, S.S. and Ramesh Chand. 2007. “Progress and Problems in Agricultural Insurance” Economic and Political Weekly, May 26th: 1905-1908. Rosenzweig, Mark and Hans Binswanger, 1993, Wealth, Weather Risk and the Composition and Profitability of Agricultural Investments, Economic Journal, 103, 56-78. Shapiro, Jeremy, 2009, Weather Insurance and Investment Choice, mimeo, MIT Department of Economics. Shleifer, Andrei and Robert Vishny, 1992, Liquidation Values and Debt Capacity: A Market Equilibrium Approach, Journal of Finance, 47, 1343-1366. Sinha, S. 2004. “Agriculture Insurance in India: Scope for Participation of Private Insurers” Economic and Political Weekly, June 19th: 2605-2612.
27

Skees, Jerry, Peter Hazell and Mario Miranda, 1999, New Approaches to Crop Yield Insurance in Developing Countries, EPTD Discussion Paper 55, International Food Policy Research Institute. Suri, Tavneet 2009 “Selection and Comparative Advantage in Technology Adoption” mimeo MIT Sloan School of Management. Townsend, Robert. 1994. “Risk and Insurance in Village India.” Econometrica 62 (3): 539–92. World Bank, 2005, Managing Agricultural Production Risk: Innovations In Developing Countries, World Bank Agriculture and Rural Development Department, World Bank Press. World Bank, 2006, Overcoming Drought: Adaptation Strategies for Andhra Pradesh, India, World Bank Publications, Washington, DC. Yang, Dean and HwaJung Choi, 2007, Are Remittances Insurance? Evidence from Rainfall Shocks in the Philippines, World Bank Economic Review, 21, 219-248.
28

Figure 1: Actual Onset over Kerala as deviations from June 1st (1978-2006)
Data for this Figure come from Indian Meteorological Department (http://www.imdpune.gov.in/)
-10
010
20N
umbe
r of d
ays
sinc
e Ju
ne 1
st
1975 1985 1995 2005years
29

Figure 2: Difference in days between onset and IMD long-range forecast of monsoon (1978-2006)
Data for this Figure come from Indian Meteorological Department (http://www.imdpune.gov.in/)
-10
010
20A
ctua
l ons
et -
IMD
fore
cast
ed o
nset
1975 1985 1995 2005years
30

Figure 3: Payout structure, Narayanpet Phase 2 insurance contract
Figure plots the relationship between rainfall insurance payouts and phase rainfall. Source: Cole
et al. (2009).
rainfall during phase
payout for phase
1st trigger(100mm)
2nd trigger[corresponds to crop failure]
(40mm)
(900Rs)
(2000Rs)
31

Figure 4. Sales of rainfall insurance by BASIX, Andhra Pradesh
Trends in sales of ICICI Lombard rainfall insurance in Andhra Pradesh. Figure plots the number
of phases of policies sold, as well as the number of distinct policyholders. Source: BASIX.
050
0010
000
1500
0
2003 2004 2005 2006 2007 2008 2009Year
Total Number of Policies Total Number of Policyholders
32
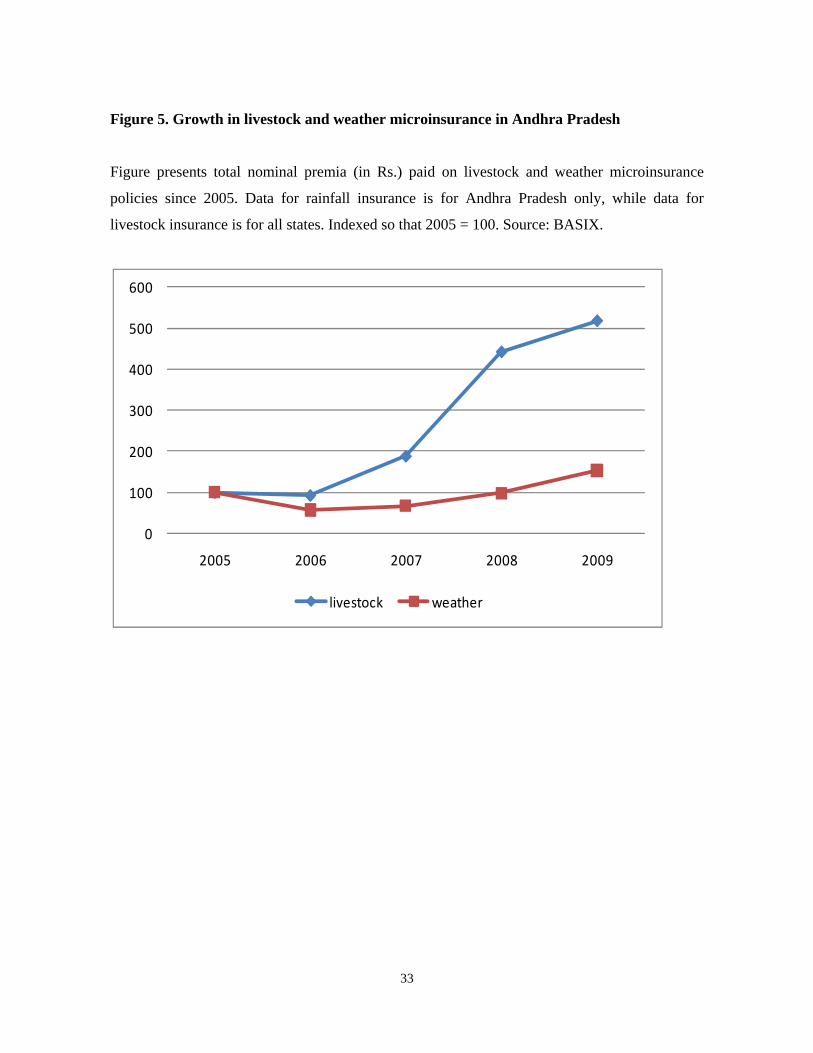
Figure 5. Growth in livestock and weather microinsurance in Andhra Pradesh
Figure presents total nominal premia (in Rs.) paid on livestock and weather microinsurance
policies since 2005. Data for rainfall insurance is for Andhra Pradesh only, while data for
livestock insurance is for all states. Indexed so that 2005 = 100. Source: BASIX.
0
100
200
300
400
500
600
2005 2006 2007 2008 2009
livestock weather
33

Figure 6: Estimated distribution of insurance payouts
Figure plots payout amount against payout rank, sorting all putative payouts in increasing order
of size. Source: Giné et al. (2007).
020
040
060
080
010
00P
ayou
t am
ount
(Rs.
)
.85 .9 .95 1Payout rank
34

Figure 7. Payouts relative to premia for rainfall and livestock insurance
Figure plots the ratio of total payouts to total premia paid for livestock insurance and rainfall
insurance policies sold by BASIX across all states. Source: BASIX administrative data.
0
0.5
1
1.5
2
2.5
3
3.5
4
2003 2004 2005 2006 2007 2008 2009
livestock
weather
35

Table 1: Summary Statistics on Insurance Policies Sold in Andhra Pradesh In some cases BASIX sold combined policies covering all three monsoon phases. These are counted as
three policies (one per phase). Figures are also adjusted for 2003-2004. Source: BASIX administrative
data.
Year Number of Policies
Number of Policy Holders
Policies per Policy Holder*
Premiums Collected (Rs)
Sum Insured (Rs)
Premium per phase (Rs)
Premium/ Sum Insured
2003 792 194 4.08
2004 1,305 281 4.64
2005 9,895 3,062 3.23 927,285 9,894,000 93.71 9.37%
2006 6,039 4,070 1.48 534,734 6,038,000 88.55 8.86%
2007 6,396 2,852 2.24 628,265 6,436,000 98.23 9.76%
2008 9,411 3,619 2.60 910,165 9,411,000 96.71 9.67%
2009 14,765 7,567 1.95 1,421,190 14,749,000 96.45 9.64%
36

37
Table 2. Self-reported reasons for rainfall insurance non-purchase
Non-purchasing households in the study areas Andhra Pradesh and Gujarat analyzed in Cole et
al. (2009) are asked to explain why they did not buy insurance. In Andhra Pradesh, non-
purchasing households were asked the top three reasons why they didn't buy insurance. Only the
primary reason cited by the household for non-adoption of insurance is reported. This table is
reproduced from Cole et al. (2009).
Why did you not purchase insurance? Andhra Pradesh Gujarat
2004 2006 2006
Insufficient funds to buy insurance 27.1% 80.8% 27.9%
It is not good value (low payout / high premiums) 16.4% 7.85% 15.0%
Do not trust insurance provider 2.34% 5.23% n.a.
It does not pay out when I suffer a loss 17.8% 2.91% n.a.
Do not understand insurance 21.0% 2.33% 10.9%
Do not need insurance 2.80% 0.58% 25.2%
No castor, groundnut 6.07% n.a. n.a.
Other 6.54% 0.29% 32.7%

Table 3: Discounts and insurance demand
The table below shows how rainfall insurance takeup rates in three districts of Gujarat,
Ahmedabad, Patan and Anand, are affected by the size of the discount offered to households.
“Return” indicates the estimated ratio of payoffs to premia, based on historical rainfall data (this
calculation was not possible for Anand due to data limitations). Take-up indicates the fraction of
treated households who purchase insurance. Reproduced from Cole et al. (2009).
Ahmedabad Patan Anand
“Return” Take-Up “Return” Take-Up “Return” Take-Up
Discount
5 64% 25% 54% 22% n.d. 36%
15 87% 37% 61% 22% n.d. 37%
30 181% 47% 78% 30% n.d. 44%
38