micron 9200 max nvme ssds + red hat ceph storage...
TRANSCRIPT
A Micron Reference Architecture
Micron® 9200 MAX NVMe™ SSDs + Red Hat® Ceph Storage 3.0
Reference Architecture
2
A Micron Reference Architecture
Contents
Executive Summary ....................................................................................................................................................... 3
Why Micron for this Solution ................................................................................................................................... 3
Ceph Distributed Architecture Overview ........................................................................................................................ 4
Reference Architecture Overview................................................................................................................................... 6
Software .................................................................................................................................................................. 6
Red Hat Ceph Storage 3.0 ................................................................................................................................ 6
Red Hat Enterprise Linux 7.4 ............................................................................................................................. 7
Software by Node Type .......................................................................................................................................... 7
Hardware ................................................................................................................................................................ 8
Ceph Storage Node ........................................................................................................................................... 8
Ceph Monitor Node ........................................................................................................................................... 9
Micron 9200 MAX NVMe SSDs ......................................................................................................................... 9
Network Switches .............................................................................................................................................. 9
Mellanox ConnectX®-5 EN Dual Port NICs ...................................................................................................... 10
Planning Considerations .............................................................................................................................................. 11
Number of Ceph Storage Nodes ........................................................................................................................... 11
Number of Ceph Monitor Nodes ........................................................................................................................... 11
Replication Factor ................................................................................................................................................. 11
CPU Sizing ............................................................................................................................................................ 11
Ceph Configuration Tuning ................................................................................................................................... 11
Networking ............................................................................................................................................................ 11
Number of OSDs per Drive ................................................................................................................................... 12
OS Tuning/NUMA ................................................................................................................................................. 13
Measuring Performance ............................................................................................................................................... 14
4KB Random Workloads: FIO + RBD ................................................................................................................... 14
4MB Object Workloads: RADOS Bench ............................................................................................................... 14
Baseline Test Methodology .......................................................................................................................................... 15
Storage Baseline Results ...................................................................................................................................... 15
Network Baseline Results ..................................................................................................................................... 15
Test Results and Analysis ............................................................................................................................................ 16
4KB Random Workload Testing ............................................................................................................................ 16
4KB Random Write Workload Analysis............................................................................................................ 16
4KB Random Read Workload Analysis ........................................................................................................... 18
Random Read Results Summary .................................................................................................................... 20
4KB Random 70% Read / 30% Write Workload Analysis ................................................................................ 20
Random 70/30 R/W Results Summary ............................................................................................................ 22
4MB Object Workloads ......................................................................................................................................... 22
2x vs. 3x Replication Performance ........................................................................................................................ 24
2x vs. 3x Replication 4KB Random Workloads ................................................................................................ 24
2x vs. 3x Replication Random Write Workload Analysis ................................................................................. 25
2x vs. 3x Replication Random Read Workload Analysis ................................................................................. 27
2x vs. 3x Replication 70/30 R/W Workload Analysis ....................................................................................... 29
2x vs. 3x Replication Object Write ................................................................................................................... 31
2x vs. 3x Replication Object Read ................................................................................................................... 32
Summary ...................................................................................................................................................................... 33
Appendix: Configuration Details ................................................................................................................................... 34
About Micron ................................................................................................................................................................ 37
About Red Hat Ceph Storage ...................................................................................................................................... 37
3
A Micron Reference Architecture
Executive Summary
This document describes an example configuration of a performance-optimized Red Hat® Ceph Storage
cluster using Micron® SSDs with NVMe™, standard x86 architecture rack-mount servers and 100 GbE
networking.
It details the hardware and software building blocks used to construct this reference architecture
(including the Red Hat Enterprise Linux OS configuration, network switch configurations and Ceph tuning
parameters) and shows the performance test results and measurement techniques for a scalable 4-node
Ceph architecture.
This all-NVMe solution is optimized for block performance while also providing very high object
performance in a compact, rack-efficient design to enable:
Faster deployment: The configuration has been pre-validated and is thoroughly documented to enable
faster deployment.
Balanced design: The right combination of NVMe SSDs, DRAM, processors and networking ensures
subsystems are balanced and performance-matched.
Broad use: Complete tuning and performance characterization across multiple IO profiles for broad
deployment across multiple uses.
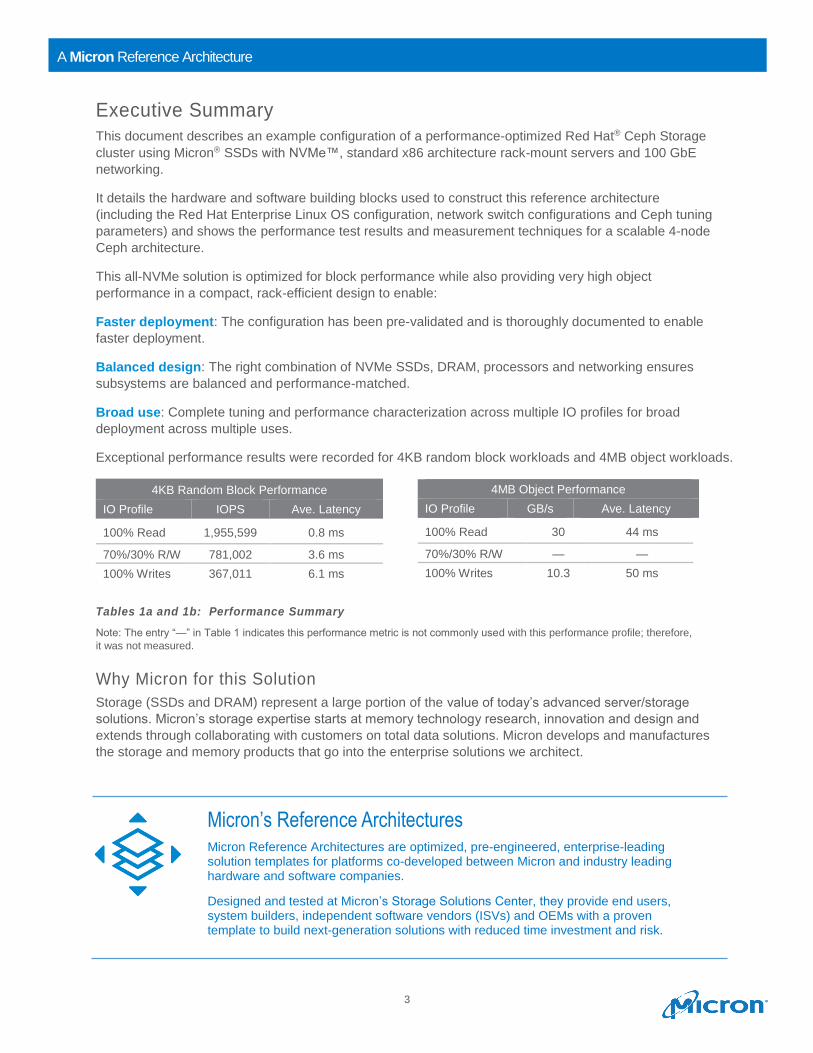
Exceptional performance results were recorded for 4KB random block workloads and 4MB object workloads.
Tables 1a and 1b: Performance Summary
Note: The entry “—” in Table 1 indicates this performance metric is not commonly used with this performance profile; therefore,
it was not measured.
Why Micron for this Solution
Storage (SSDs and DRAM) represent a large portion of the value of today’s advanced server/storage
solutions. Micron’s storage expertise starts at memory technology research, innovation and design and
extends through collaborating with customers on total data solutions. Micron develops and manufactures
the storage and memory products that go into the enterprise solutions we architect.
4KB Random Block Performance
IO Profile IOPS Ave. Latency
100% Read 1,955,599 0.8 ms
70%/30% R/W 781,002 3.6 ms
100% Writes 367,011 6.1 ms
4MB Object Performance
IO Profile GB/s Ave. Latency
100% Read 30 44 ms
70%/30% R/W — —
100% Writes 10.3 50 ms
Micron’s Reference Architectures Micron Reference Architectures are optimized, pre-engineered, enterprise-leading solution templates for platforms co-developed between Micron and industry leading hardware and software companies.
Designed and tested at Micron’s Storage Solutions Center, they provide end users, system builders, independent software vendors (ISVs) and OEMs with a proven template to build next-generation solutions with reduced time investment and risk.
4
A Micron Reference Architecture
Ceph Distributed Architecture Overview
A Ceph storage cluster is frequently built from large numbers of Ceph nodes for scalability, fault-
tolerance, and performance. Each node is based on industry standard hardware and uses intelligent
Ceph daemons that communicate with each other to:
• Store, retrieve and replicate data
• Monitor and report on cluster health
• Redistribute data dynamically (remap and backfill)
• Ensure data integrity (scrubbing)
• Detect and recover from faults and failures
To the Ceph client interface that reads and writes data, a Ceph storage cluster looks like a simple pool
where data is stored. However, the storage cluster performs many complex operations in a manner that is
completely transparent to the client interface. Ceph clients and Ceph Object Storage Daemons (Ceph
OSD daemons, or OSDs) both use the Controlled Replication Under Scalable Hashing (CRUSH)
algorithm for storage and retrieval of objects.
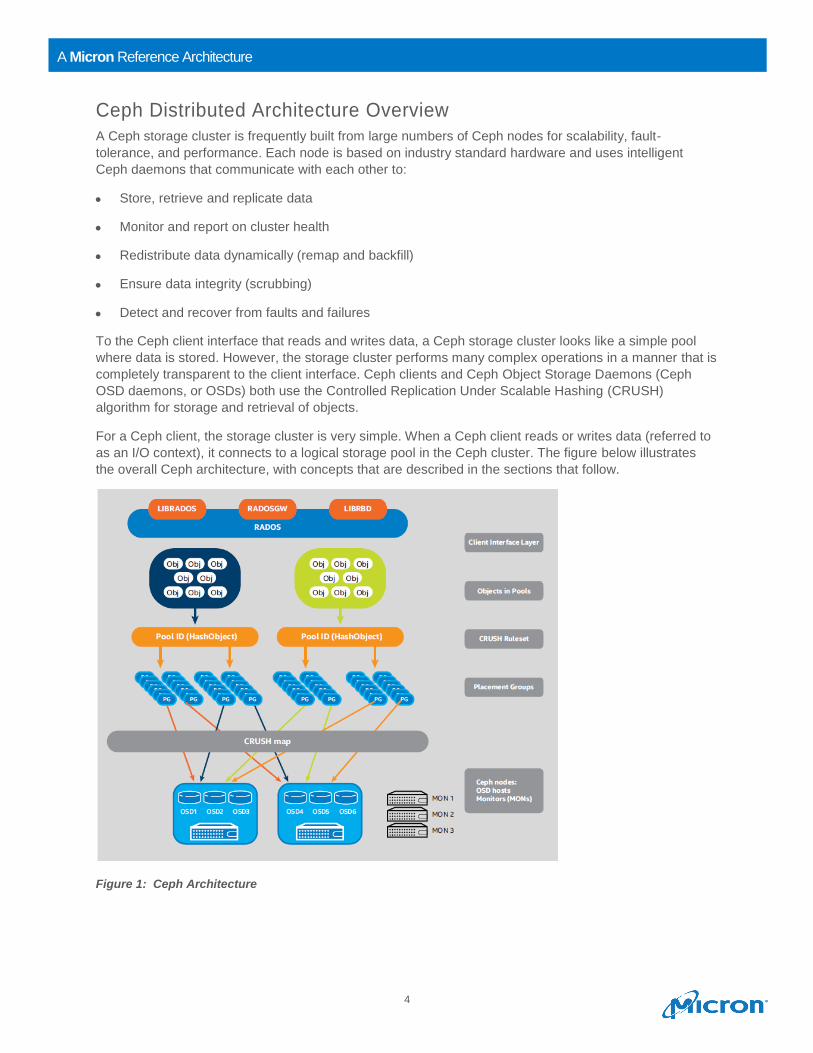
For a Ceph client, the storage cluster is very simple. When a Ceph client reads or writes data (referred to
as an I/O context), it connects to a logical storage pool in the Ceph cluster. The figure below illustrates
the overall Ceph architecture, with concepts that are described in the sections that follow.
Figure 1: Ceph Architecture
5
A Micron Reference Architecture
Clients write to Ceph storage pools while the CRUSH ruleset determines how placement groups are
distributed across object storage daemons (OSDs).
• Pools: A Ceph storage cluster stores data objects in logical dynamic partitions called pools. Pools can
be created for particular data types, such as for block devices, object gateways, or simply to separate
user groups. The Ceph pool configuration dictates the number of object replicas and the number of
placement groups (PGs) in the pool. Ceph storage pools can be either replicated or erasure coded, as
appropriate for the application and cost model. Additionally, pools can “take root” at any position in the
CRUSH hierarchy, allowing placement on groups of servers with differing performance characteristics—
allowing storage to be optimized for different workloads.
• Placement groups: Ceph maps objects to placement groups (PGs). PGs are shards or fragments of a
logical object pool that are composed of a group of Ceph OSD daemons that are in a peering
relationship. Placement groups provide a means of creating replication or erasure coding groups of
coarser granularity than on a per object basis. A larger number of placement groups (e.g., 200 per OSD
or more) leads to better balancing.
• CRUSH ruleset: The CRUSH algorithm provides controlled, scalable, and declustered placement of
replicated or erasure-coded data within Ceph and determines how to store and retrieve data by
computing data storage locations. CRUSH empowers Ceph clients to communicate with OSDs directly,
rather than through a centralized server or broker. By determining a method of storing and retrieving
data by an algorithm, Ceph avoids a single point of failure, a performance bottleneck, and a physical
limit to scalability.
• Ceph monitors (MONs): Before Ceph clients can read or write data, they must contact a Ceph MON to
obtain the current cluster map. A Ceph storage cluster can operate with a single monitor, but this
introduces a single point of failure. For added reliability and fault tolerance, Ceph supports an odd
number of monitors in a quorum (typically three or five for small to mid-sized clusters). Consensus
among various monitor instances ensures consistent knowledge about the state of the cluster.
• Ceph OSD daemons: In a Ceph cluster, Ceph OSD daemons store data and handle data replication,
recovery, backfilling, and rebalancing. They also provide some cluster state information to Ceph
monitors by checking other Ceph OSD daemons with a heartbeat mechanism. A Ceph storage cluster
configured to keep three replicas of every object requires a minimum of three Ceph OSD daemons, two
of which need to be operational to successfully process write requests. Ceph OSD daemons roughly
correspond to a file system on a physical hard disk drive.
6
A Micron Reference Architecture
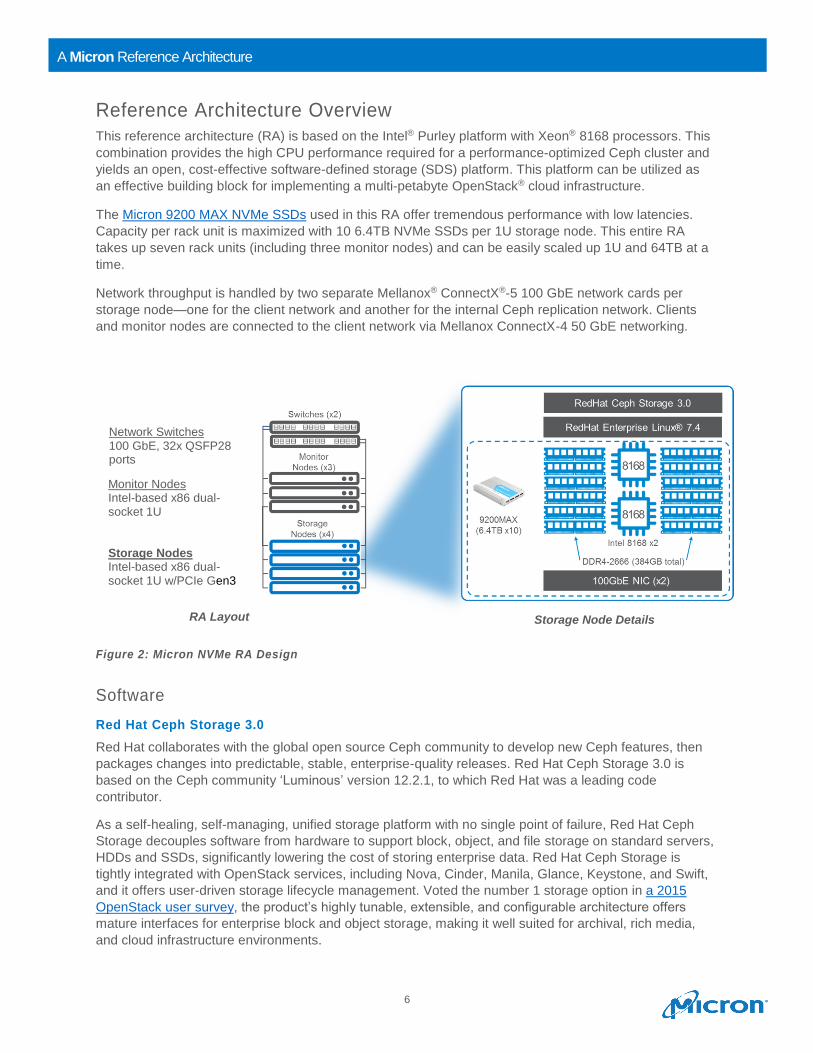
Reference Architecture Overview
This reference architecture (RA) is based on the Intel® Purley platform with Xeon® 8168 processors. This
combination provides the high CPU performance required for a performance-optimized Ceph cluster and
yields an open, cost-effective software-defined storage (SDS) platform. This platform can be utilized as
an effective building block for implementing a multi-petabyte OpenStack® cloud infrastructure.
The Micron 9200 MAX NVMe SSDs used in this RA offer tremendous performance with low latencies.
Capacity per rack unit is maximized with 10 6.4TB NVMe SSDs per 1U storage node. This entire RA
takes up seven rack units (including three monitor nodes) and can be easily scaled up 1U and 64TB at a
time.
Network throughput is handled by two separate Mellanox® ConnectX®-5 100 GbE network cards per
storage node—one for the client network and another for the internal Ceph replication network. Clients
and monitor nodes are connected to the client network via Mellanox ConnectX-4 50 GbE networking.
Figure 2: Micron NVMe RA Design
Software
Red Hat Ceph Storage 3.0
Red Hat collaborates with the global open source Ceph community to develop new Ceph features, then
packages changes into predictable, stable, enterprise-quality releases. Red Hat Ceph Storage 3.0 is
based on the Ceph community ‘Luminous’ version 12.2.1, to which Red Hat was a leading code
contributor.
As a self-healing, self-managing, unified storage platform with no single point of failure, Red Hat Ceph
Storage decouples software from hardware to support block, object, and file storage on standard servers,
HDDs and SSDs, significantly lowering the cost of storing enterprise data. Red Hat Ceph Storage is
tightly integrated with OpenStack services, including Nova, Cinder, Manila, Glance, Keystone, and Swift,
and it offers user-driven storage lifecycle management. Voted the number 1 storage option in a 2015
OpenStack user survey, the product’s highly tunable, extensible, and configurable architecture offers
mature interfaces for enterprise block and object storage, making it well suited for archival, rich media,
and cloud infrastructure environments.
Storage Nodes Intel-based x86 dual-socket 1U w/PCIe Gen3
Monitor Nodes Intel-based x86 dual-socket 1U
Network Switches 100 GbE, 32x QSFP28 ports
Storage Node Details RA Layout
7
A Micron Reference Architecture
Among many of its features, Red Hat Ceph Storage 3 provides the following advantages to this RA:
• Block storage integrated with OpenStack, Linux and KVM hypervisor
• Data durability via erasure coding or replication
• Red Hat Ansible® automation-based deployment
• Advanced Ceph monitoring and diagnostic information with an on-premise monitoring dashboard
• Graphical visualization of the entire cluster or single components
with cluster and per-node usage
and performance statistics
• Availability of service level agreement (SLA)-backed technical support
• Red Hat Enterprise Linux (included with subscription) and the backing of a global open source community
Red Hat Enterprise Linux 7.4
Red Hat® Enterprise Linux® (RHEL) is a high-performing operating system that has been deployed in IT
environments for more than a decade.
Red Hat Enterprise Linux 7.4 is noted for its enterprise-level performance, reliability, and security as well
as its broad use (it is certified by leading hardware and software vendors), broad scalability (from
workstations, to servers, to mainframes) and consistent application environment across physical, virtual,
and cloud deployments.
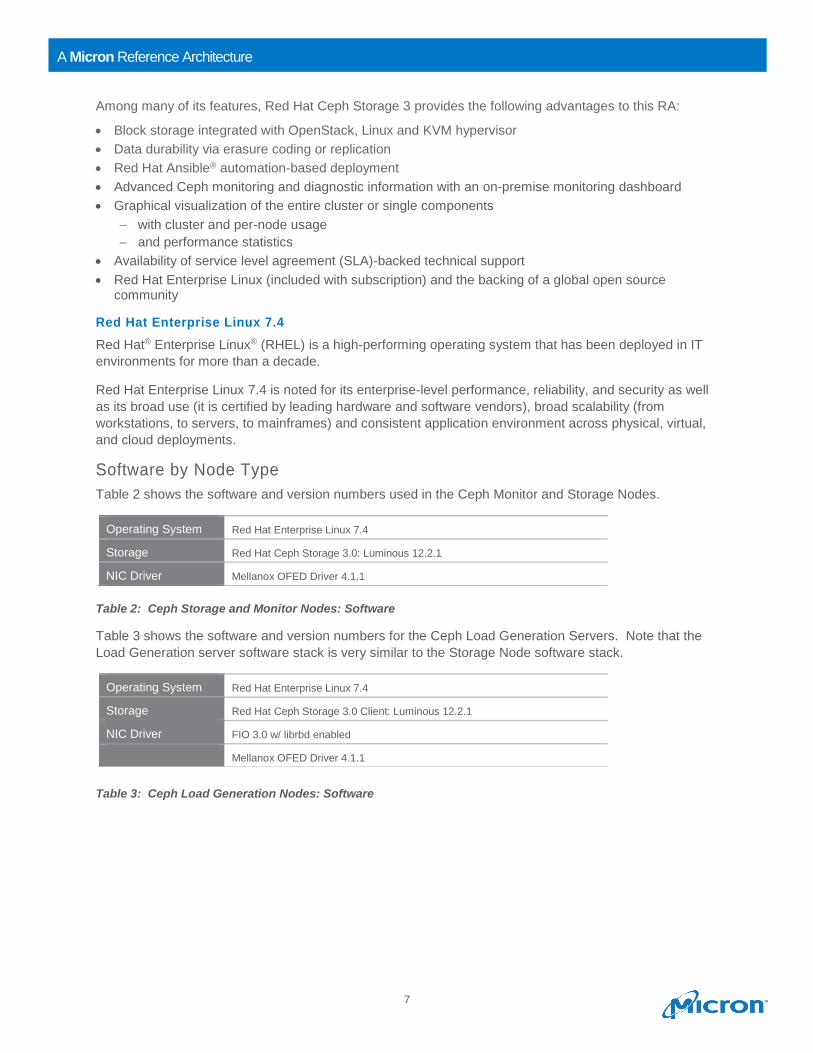
Software by Node Type
Table 2 shows the software and version numbers used in the Ceph Monitor and Storage Nodes.
Table 2: Ceph Storage and Monitor Nodes: Software
Table 3 shows the software and version numbers for the Ceph Load Generation Servers. Note that the
Load Generation server software stack is very similar to the Storage Node software stack.
Table 3: Ceph Load Generation Nodes: Software
Operating System Red Hat Enterprise Linux 7.4
Storage Red Hat Ceph Storage 3.0: Luminous 12.2.1
NIC Driver Mellanox OFED Driver 4.1.1
Operating System Red Hat Enterprise Linux 7.4
Storage Red Hat Ceph Storage 3.0 Client: Luminous 12.2.1
NIC Driver FIO 3.0 w/ librbd enabled
Mellanox OFED Driver 4.1.1
8
A Micron Reference Architecture
Hardware
This RA uses standard 1U, x86 architecture platforms each housing up to 10 NVMe SSDs (U.2 form
factor) with additional storage for local operating systems.
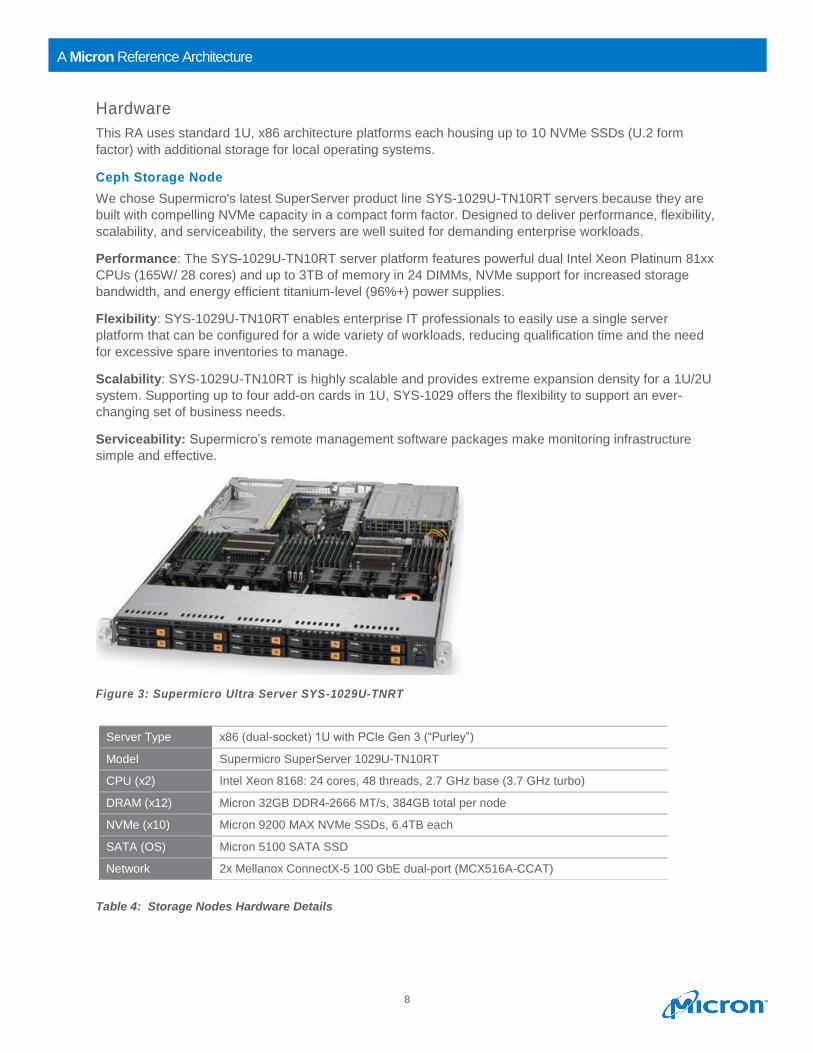
Ceph Storage Node
We chose Supermicro's latest SuperServer product line SYS-1029U-TN10RT servers because they are
built with compelling NVMe capacity in a compact form factor. Designed to deliver performance, flexibility,
scalability, and serviceability, the servers are well suited for demanding enterprise workloads.
Performance: The SYS-1029U-TN10RT server platform features powerful dual Intel Xeon Platinum 81xx
CPUs (165W/ 28 cores) and up to 3TB of memory in 24 DIMMs, NVMe support for increased storage
bandwidth, and energy efficient titanium-level (96%+) power supplies.
Flexibility: SYS-1029U-TN10RT enables enterprise IT professionals to easily use a single server
platform that can be configured for a wide variety of workloads, reducing qualification time and the need
for excessive spare inventories to manage.
Scalability: SYS-1029U-TN10RT is highly scalable and provides extreme expansion density for a 1U/2U
system. Supporting up to four add-on cards in 1U, SYS-1029 offers the flexibility to support an ever-
changing set of business needs.
Serviceability: Supermicro’s remote management software packages make monitoring infrastructure
simple and effective.
Figure 3: Supermicro Ultra Server SYS-1029U-TNRT
Table 4: Storage Nodes Hardware Details
Server Type x86 (dual-socket) 1U with PCIe Gen 3 (“Purley”)
Model Supermicro SuperServer 1029U-TN10RT
CPU (x2) Intel Xeon 8168: 24 cores, 48 threads, 2.7 GHz base (3.7 GHz turbo)
DRAM (x12) Micron 32GB DDR4-2666 MT/s, 384GB total per node
NVMe (x10) Micron 9200 MAX NVMe SSDs, 6.4TB each
SATA (OS) Micron 5100 SATA SSD
Network 2x Mellanox ConnectX-5 100 GbE dual-port (MCX516A-CCAT)
9
A Micron Reference Architecture
Ceph Monitor Node
Table 5: Monitor Nodes Hardware Details
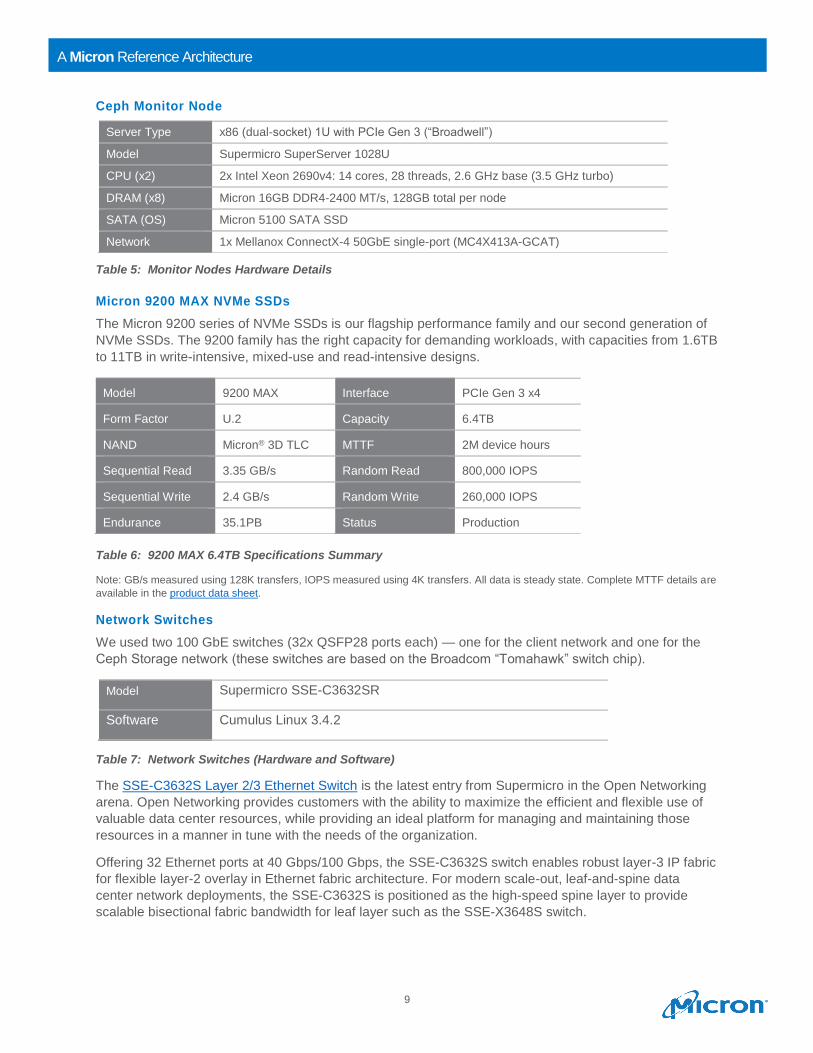
Micron 9200 MAX NVMe SSDs
The Micron 9200 series of NVMe SSDs is our flagship performance family and our second generation of
NVMe SSDs. The 9200 family has the right capacity for demanding workloads, with capacities from 1.6TB
to 11TB in write-intensive, mixed-use and read-intensive designs.
Table 6: 9200 MAX 6.4TB Specifications Summary
Note: GB/s measured using 128K transfers, IOPS measured using 4K transfers. All data is steady state. Complete MTTF details are
available in the product data sheet.
Network Switches
We used two 100 GbE switches (32x QSFP28 ports each) — one for the client network and one for the
Ceph Storage network (these switches are based on the Broadcom “Tomahawk” switch chip).
Table 7: Network Switches (Hardware and Software)
The SSE-C3632S Layer 2/3 Ethernet Switch is the latest entry from Supermicro in the Open Networking
arena. Open Networking provides customers with the ability to maximize the efficient and flexible use of
valuable data center resources, while providing an ideal platform for managing and maintaining those
resources in a manner in tune with the needs of the organization.
Offering 32 Ethernet ports at 40 Gbps/100 Gbps, the SSE-C3632S switch enables robust layer-3 IP fabric
for flexible layer-2 overlay in Ethernet fabric architecture. For modern scale-out, leaf-and-spine data
center network deployments, the SSE-C3632S is positioned as the high-speed spine layer to provide
scalable bisectional fabric bandwidth for leaf layer such as the SSE-X3648S switch.
Server Type x86 (dual-socket) 1U with PCIe Gen 3 (“Broadwell”)
Model Supermicro SuperServer 1028U
CPU (x2) 2x Intel Xeon 2690v4: 14 cores, 28 threads, 2.6 GHz base (3.5 GHz turbo)
DRAM (x8) Micron 16GB DDR4-2400 MT/s, 128GB total per node
SATA (OS) Micron 5100 SATA SSD
Network 1x Mellanox ConnectX-4 50GbE single-port (MC4X413A-GCAT)
Model 9200 MAX Interface PCIe Gen 3 x4
Form Factor U.2 Capacity 6.4TB
NAND Micron® 3D TLC MTTF 2M device hours
Sequential Read 3.35 GB/s Random Read 800,000 IOPS
Sequential Write 2.4 GB/s Random Write 260,000 IOPS
Endurance 35.1PB Status Production
Model Supermicro SSE-C3632SR
Software Cumulus Linux 3.4.2
10
A Micron Reference Architecture
Depending on deployment connectivity, physical Ethernet QSFP28 ports in the SSE-C3632S can be
configured for either 40 Gbps or 100 Gbps per port, thus enabling a flexible physical connectivity option
between the spine layer and leaf layer in the datacenter Ethernet fabric.
The compact 1U form factor gives users the ability to optimize deployment in standalone or top-of-rack
environments. A rail kit facilitates rack-mounting installations. These switches are ideal for deployment in
datacenter, cloud and enterprise environments with the capability of handling access for the most
demanding applications.
Mellanox ConnectX®-5 EN Dual Port NICs
The ConnectX-5 EN Network Controller with two ports of 100 Gb/s Ethernet connectivity and advanced
offload capabilities delivers high bandwidth, low latency and high computation efficiency for high-
performance, data-intensive and scalable HPC, cloud, data analytics, database and storage platforms.
11
A Micron Reference Architecture
Planning Considerations
Number of Ceph Storage Nodes
At least three storage nodes must be present in a Ceph cluster to become eligible for Red Hat technical
support. Ten storage nodes are the recommended scale for an enterprise Ceph cluster. Four storage
nodes represent a valid building block to use for scaling up to larger deployments. This RA uses four
storage nodes.
Number of Ceph Monitor Nodes
At least three monitor nodes should be configured on separate hardware. These nodes do not require
high-performance CPUs. They do benefit from having SSDs to store the monitor map data. One monitor
node is the minimum, but three or more monitor nodes are typically used in production deployments.
Replication Factor
NVMe SSDs have high reliability with high MTBR and low bit error rate. 2x replication is recommended in
production when deploying OSDs on NVMe versus the 3x replication common with legacy storage.
CPU Sizing
Ceph OSD processes can consume large amounts of CPU while doing small block operations.
Consequently, a higher CPU core count generally results in higher performance for I/O-intensive
workloads. For throughput-intensive workloads characterized by large sequential I/O, Ceph performance
is more likely to be bound by the maximum network bandwidth of the cluster.
Ceph Configuration Tuning
Tuning Ceph for NVMe devices can be complex. The ceph.conf settings used in this RA are optimized for
small block random performance and are included in Appendix A.
Networking
A 25 GbE network is required to leverage the maximum block performance benefits of a NVMe-based
Ceph cluster. For throughput-intensive workloads, 50 GbE to 100 GbE is recommended
Two OSDs per 9200 MAX SSD greatly reduce tail latency for 4KB random
writes. It also improves 4KB random write IOPS at higher queue depths.
12
A Micron Reference Architecture
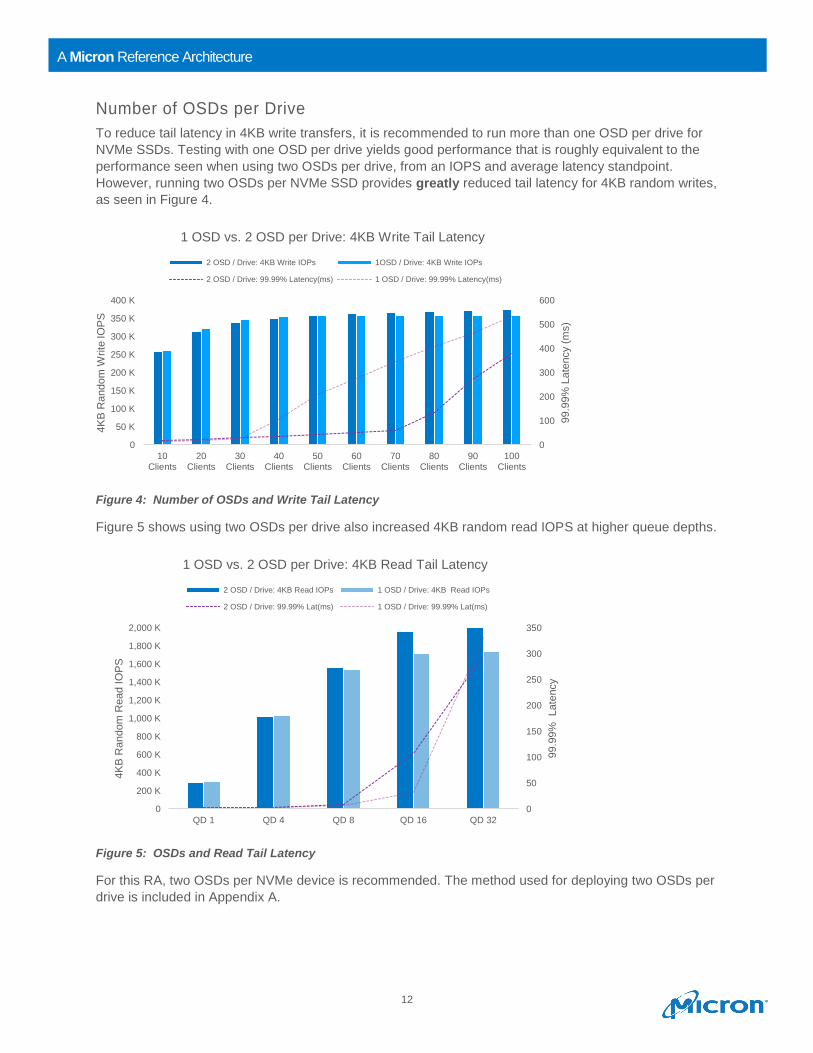
Number of OSDs per Drive
To reduce tail latency in 4KB write transfers, it is recommended to run more than one OSD per drive for
NVMe SSDs. Testing with one OSD per drive yields good performance that is roughly equivalent to the
performance seen when using two OSDs per drive, from an IOPS and average latency standpoint.
However, running two OSDs per NVMe SSD provides greatly reduced tail latency for 4KB random writes,
as seen in Figure 4.
Figure 4: Number of OSDs and Write Tail Latency
Figure 5 shows using two OSDs per drive also increased 4KB random read IOPS at higher queue depths.
Figure 5: OSDs and Read Tail Latency
For this RA, two OSDs per NVMe device is recommended. The method used for deploying two OSDs per
drive is included in Appendix A.
0
100
200
300
400
500
600
0
50 K
100 K
150 K
200 K
250 K
300 K
350 K
400 K
10Clients
20Clients
30Clients
40Clients
50Clients
60Clients
70Clients
80Clients
90Clients
100Clients
99.9
9%
Late
ncy (
ms)
4K
B R
andom
Write
IO
PS
1 OSD vs. 2 OSD per Drive: 4KB Write Tail Latency
2 OSD / Drive: 4KB Write IOPs 1OSD / Drive: 4KB Write IOPs
2 OSD / Drive: 99.99% Latency(ms) 1 OSD / Drive: 99.99% Latency(ms)
0
50
100
150
200
250
300
350
0
200 K
400 K
600 K
800 K
1,000 K
1,200 K
1,400 K
1,600 K
1,800 K
2,000 K
QD 1 QD 4 QD 8 QD 16 QD 32
99.9
9%
Late
ncy
4K
B R
andom
Read I
OP
S
1 OSD vs. 2 OSD per Drive: 4KB Read Tail Latency
2 OSD / Drive: 4KB Read IOPs 1 OSD / Drive: 4KB Read IOPs
2 OSD / Drive: 99.99% Lat(ms) 1 OSD / Drive: 99.99% Lat(ms)
13
A Micron Reference Architecture
OS Tuning/NUMA
OS tuning parameters are deployed by Ceph-Ansible. The following OS settings were used:
disable_transparent_hugepage: true
kernel.pid_max, value: 4,194,303
fs.file-max, value: 26,234,859
vm.zone_reclaim_mode, value: 0
vm.swappiness, value: 1
vm.min_free_kbytes, value: 1,000,000
net.core.rmem_max, value: 268,435,456
net.core.wmem_max, value: 268,435,456
net.ipv4.tcp_rmem, value: 4096 87,380 134,217,728
net.ipv4.tcp_wmem, value: 4096 65,536 134,217,728
ceph_tcmalloc_max_total_thread_cache: 134,217,728
NUMA tuning was not used during testing due to the unbalanced nature of the servers used—four NVMe
devices and both NICs go to CPU 1 and the other six NVMe devices are on CPU 2. Irqbalance was active
for all tests and did a reasonable job balancing across CPUs.
14
A Micron Reference Architecture
Measuring Performance
4KB Random Workloads: FIO + RBD
4KB random workloads were tested using the FIO synthetic IO generation tool and the Ceph RADOS
Block Device (RBD) driver.
100 RBD images were created at the start of testing. When testing on a 2x replicated pool, the RBD
images were 75GB each (7.5TB of data); on a 2x replicated pool, that equals 15TB of total data stored.
When testing on a 3x replicated pool, the RBD images were 50GB each (5TB of data); on a 3x pool, that
also equals 15TB of total data stored. The four storage nodes have a combined total of 1.5TB of DRAM,
which is 10% of the dataset size.
4KB random writes were measured by scaling up the number of FIO clients running load against Ceph at
a fixed queue depth of 32. A client in this case is a single instance of FIO running on a load generation
server. Using a queue depth of 32 simulates a reasonably active RDB image consumer and allows our
tests to scale up to a high client count. The number of clients was scaled from 10 clients up to 100 clients.
10 load generation servers were used in testing with an equal number of FIO instances on each.
4KB random reads and 70/30 read/write tests were measured by using all 100 RBD images, scaling up
the queue depth per FIO client from 1 to 32. It is important to use all 100 clients for reads so that the
entire 15TB dataset is being accessed; otherwise, Linux filesystem caching can skew results higher.
Each test was run three times for 10 minutes with a two-minute ramp up time. Linux filesystem caches
were cleared between each test. The results reported are the averages across all test runs.
4MB Object Workloads: RADOS Bench
RADOS Bench is a built-in tool for measuring object performance. It represents the best-case object
performance scenario of data coming directly to Ceph from a RADOS Gateway node.
4MB object writes were measured by running RADOS Bench with a “threads” value of 16 on a load
generation server writing directly to a Ceph storage pool. The number of load generation servers scaled
up from 2 to 10.
4MB object reads were measured by first writing 15TB of data into a 2x or 3x replicated pool using 20
RADOS Bench instances. Once the data load was complete, all 20 RADOS Bench instances were used
to run 4MB object reads against the storage pool. The thread count of RADOS Bench scaled up from 4
threads to 32 threads.
Object workload tests were run for 10 minutes, three times each. Linux filesystem caches were cleared
between each test. The results reported are the averages across all test runs.
15
A Micron Reference Architecture
Baseline Test Methodology
Storage and network performance were baseline tested (tested without Ceph software to determine the
theoretical hardware performance maximums) with FIO and iPerf.
• Storage testing was done with one locally run FIO command test across all 10 NVMe drives
simultaneously.
• Network testing used two concurrent iperf3 tests (details provided below).
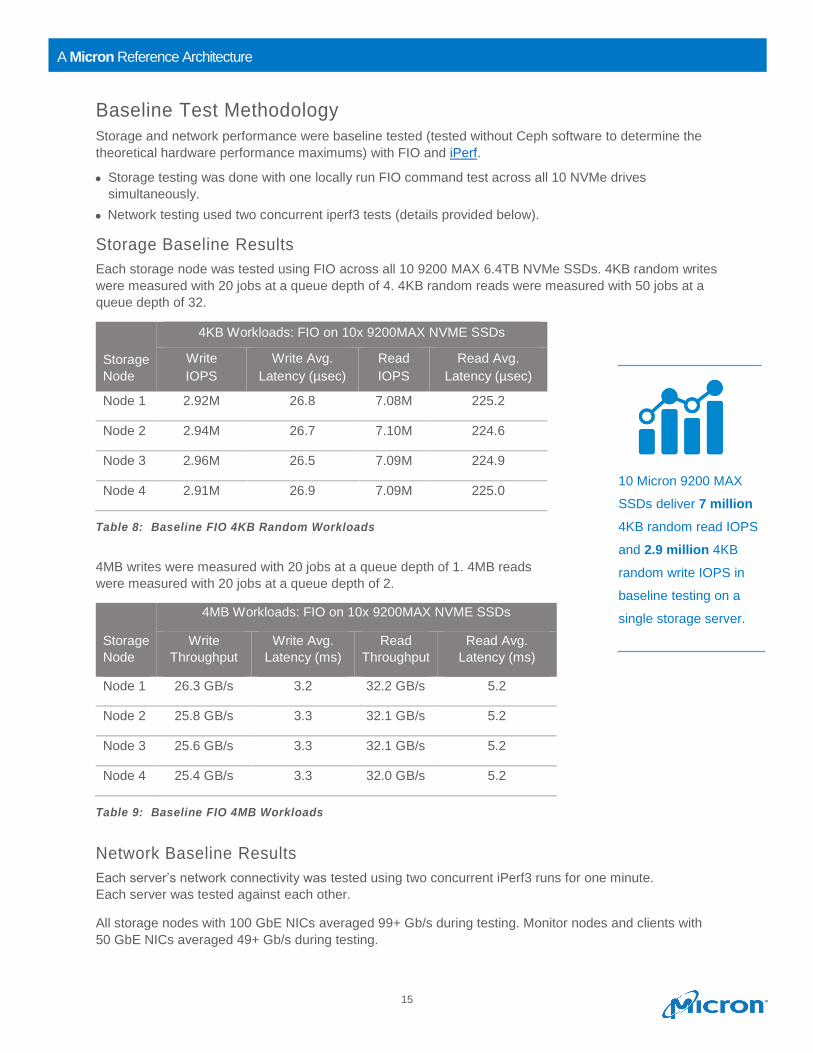
Storage Baseline Results
Each storage node was tested using FIO across all 10 9200 MAX 6.4TB NVMe SSDs. 4KB random writes
were measured with 20 jobs at a queue depth of 4. 4KB random reads were measured with 50 jobs at a
queue depth of 32.
Storage
Node
4KB Workloads: FIO on 10x 9200MAX NVME SSDs
Write
IOPS
Write Avg.
Latency (µsec)
Read
IOPS
Read Avg.
Latency (µsec)
Node 1 2.92M 26.8 7.08M 225.2
Node 2 2.94M 26.7 7.10M 224.6
Node 3 2.96M 26.5 7.09M 224.9
Node 4 2.91M 26.9 7.09M 225.0
Table 8: Baseline FIO 4KB Random Workloads
4MB writes were measured with 20 jobs at a queue depth of 1. 4MB reads
were measured with 20 jobs at a queue depth of 2.
Storage
Node
4MB Workloads: FIO on 10x 9200MAX NVME SSDs
Write
Throughput
Write Avg.
Latency (ms)
Read
Throughput
Read Avg.
Latency (ms)
Node 1 26.3 GB/s 3.2 32.2 GB/s 5.2
Node 2 25.8 GB/s 3.3 32.1 GB/s 5.2
Node 3 25.6 GB/s 3.3 32.1 GB/s 5.2
Node 4 25.4 GB/s 3.3 32.0 GB/s 5.2
Table 9: Baseline FIO 4MB Workloads
Network Baseline Results
Each server’s network connectivity was tested using two concurrent iPerf3 runs for one minute.
Each server was tested against each other.
All storage nodes with 100 GbE NICs averaged 99+ Gb/s during testing. Monitor nodes and clients with
50 GbE NICs averaged 49+ Gb/s during testing.
10 Micron 9200 MAX
SSDs deliver 7 million
4KB random read IOPS
and 2.9 million 4KB
random write IOPS in
baseline testing on a
single storage server.
16
A Micron Reference Architecture
Test Results and Analysis
The results detailed below were collected on a 2x replicated storage pool in Red Hat Ceph 3.0 (Luminous
12.2.1) with 8192 placement groups.
4KB Random Workload Testing
Red Hat Ceph 3.0 was tested with 100 RBD images at 75GB each, providing 7.5TB of
data on a 2x replicated pool (15TB of total data). Random writes were tested with a
constant queue depth of 32, while the number of clients increased from 10 to 100.
Using a queue depth of 32 simulated a reasonably active RDB image consumer and
enabled our tests to scale to a high number of clients.
Random reads and 70/30 R/W workloads were measured by running load against all
100 RBD images, scaling up the queue depth per client from 1 to 32. We used all 100
clients for every read test to ensure Ceph used the Linux filesystem cache equally on
all tests.
Each test was run three times at 10 minutes per run with a two-minute ramp-up time.
The average results of those three runs are represented in the figures below.
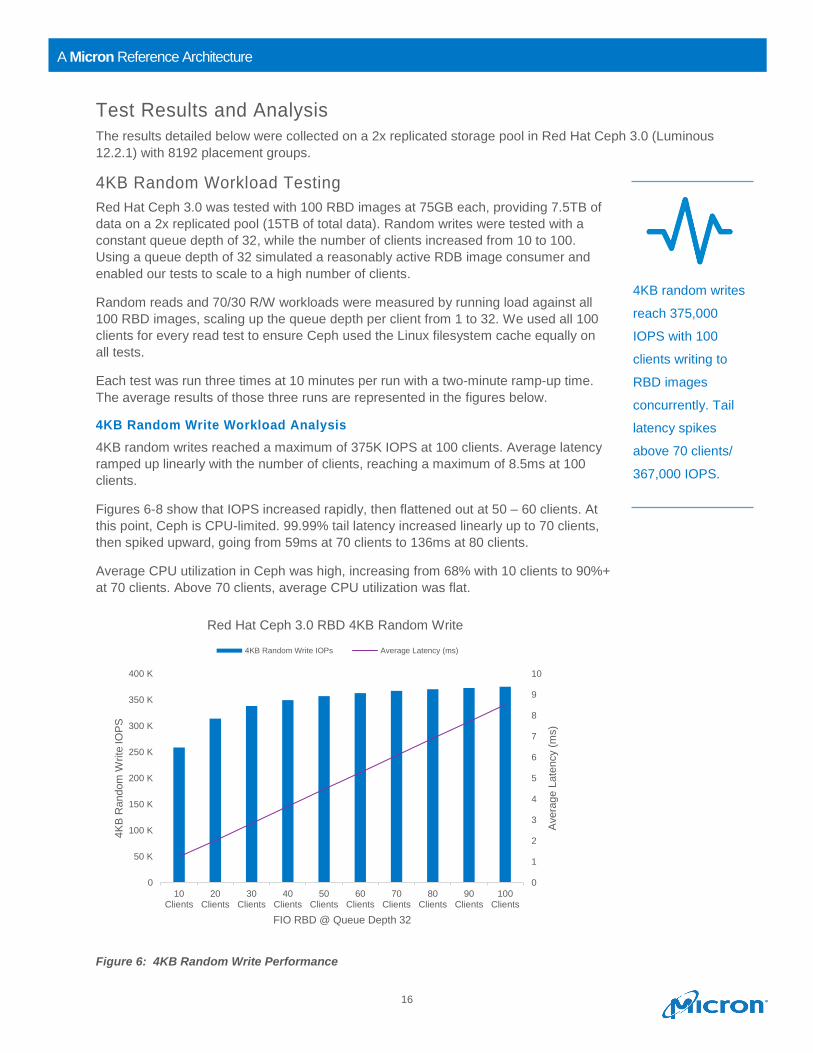
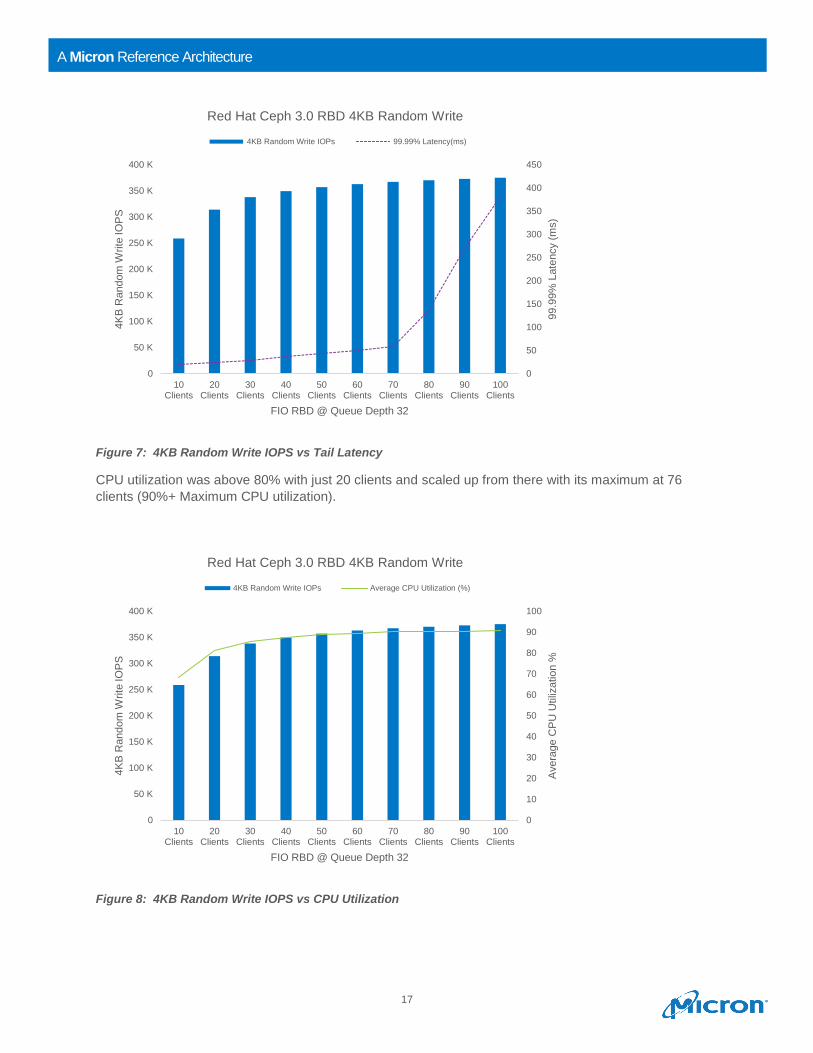
4KB Random Write Workload Analysis
4KB random writes reached a maximum of 375K IOPS at 100 clients. Average latency
ramped up linearly with the number of clients, reaching a maximum of 8.5ms at 100
clients.
Figures 6-8 show that IOPS increased rapidly, then flattened out at 50 – 60 clients. At
this point, Ceph is CPU-limited. 99.99% tail latency increased linearly up to 70 clients,
then spiked upward, going from 59ms at 70 clients to 136ms at 80 clients.
Average CPU utilization in Ceph was high, increasing from 68% with 10 clients to 90%+
at 70 clients. Above 70 clients, average CPU utilization was flat.
Figure 6: 4KB Random Write Performance
0
1
2
3
4
5
6
7
8
9
10
0
50 K
100 K
150 K
200 K
250 K
300 K
350 K
400 K
10Clients
20Clients
30Clients
40Clients
50Clients
60Clients
70Clients
80Clients
90Clients
100Clients
Avera
ge L
ate
ncy (
ms)
4K
B R
andom
Write
IO
PS
FIO RBD @ Queue Depth 32
Red Hat Ceph 3.0 RBD 4KB Random Write
4KB Random Write IOPs Average Latency (ms)
4KB random writes
reach 375,000
IOPS with 100
clients writing to
RBD images
concurrently. Tail
latency spikes
above 70 clients/
367,000 IOPS.
17
A Micron Reference Architecture
Figure 7: 4KB Random Write IOPS vs Tail Latency
CPU utilization was above 80% with just 20 clients and scaled up from there with its maximum at 76
clients (90%+ Maximum CPU utilization).
Figure 8: 4KB Random Write IOPS vs CPU Utilization
0
50
100
150
200
250
300
350
400
450
0
50 K
100 K
150 K
200 K
250 K
300 K
350 K
400 K
10Clients
20Clients
30Clients
40Clients
50Clients
60Clients
70Clients
80Clients
90Clients
100Clients
99.9
9%
Late
ncy (
ms)
4K
B R
andom
Write
IO
PS
FIO RBD @ Queue Depth 32
Red Hat Ceph 3.0 RBD 4KB Random Write
4KB Random Write IOPs 99.99% Latency(ms)
0
10
20
30
40
50
60
70
80
90
100
0
50 K
100 K
150 K
200 K
250 K
300 K
350 K
400 K
10Clients
20Clients
30Clients
40Clients
50Clients
60Clients
70Clients
80Clients
90Clients
100Clients
Avera
ge C
PU
Utiliz
atio
n %
4K
B R
andom
Write
IO
PS
FIO RBD @ Queue Depth 32
Red Hat Ceph 3.0 RBD 4KB Random Write
4KB Random Write IOPs Average CPU Utilization (%)
18
A Micron Reference Architecture
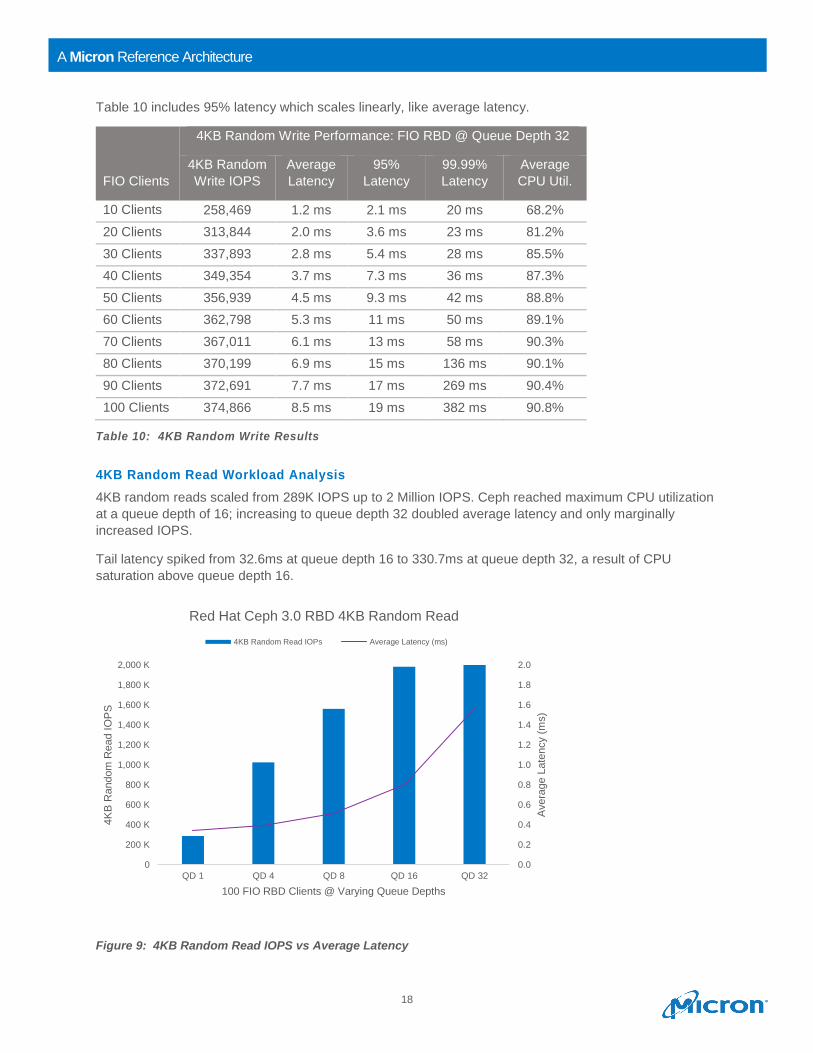
Table 10 includes 95% latency which scales linearly, like average latency.
FIO Clients
4KB Random Write Performance: FIO RBD @ Queue Depth 32
4KB Random
Write IOPS
Average
Latency
95%
Latency
99.99%
Latency
Average
CPU Util.
10 Clients 258,469 1.2 ms 2.1 ms 20 ms 68.2%
20 Clients 313,844 2.0 ms 3.6 ms 23 ms 81.2%
30 Clients 337,893 2.8 ms 5.4 ms 28 ms 85.5%
40 Clients 349,354 3.7 ms 7.3 ms 36 ms 87.3%
50 Clients 356,939 4.5 ms 9.3 ms 42 ms 88.8%
60 Clients 362,798 5.3 ms 11 ms 50 ms 89.1%
70 Clients 367,011 6.1 ms 13 ms 58 ms 90.3%
80 Clients 370,199 6.9 ms 15 ms 136 ms 90.1%
90 Clients 372,691 7.7 ms 17 ms 269 ms 90.4%
100 Clients 374,866 8.5 ms 19 ms 382 ms 90.8%
Table 10: 4KB Random Write Results
4KB Random Read Workload Analysis
4KB random reads scaled from 289K IOPS up to 2 Million IOPS. Ceph reached maximum CPU utilization
at a queue depth of 16; increasing to queue depth 32 doubled average latency and only marginally
increased IOPS.
Tail latency spiked from 32.6ms at queue depth 16 to 330.7ms at queue depth 32, a result of CPU
saturation above queue depth 16.
Figure 9: 4KB Random Read IOPS vs Average Latency
0.0
0.2
0.4
0.6
0.8
1.0
1.2
1.4
1.6
1.8
2.0
0
200 K
400 K
600 K
800 K
1,000 K
1,200 K
1,400 K
1,600 K
1,800 K
2,000 K
QD 1 QD 4 QD 8 QD 16 QD 32
Avera
ge L
ate
ncy (
ms)
4K
B R
andom
Read I
OP
S
100 FIO RBD Clients @ Varying Queue Depths
Red Hat Ceph 3.0 RBD 4KB Random Read
4KB Random Read IOPs Average Latency (ms)
19
A Micron Reference Architecture
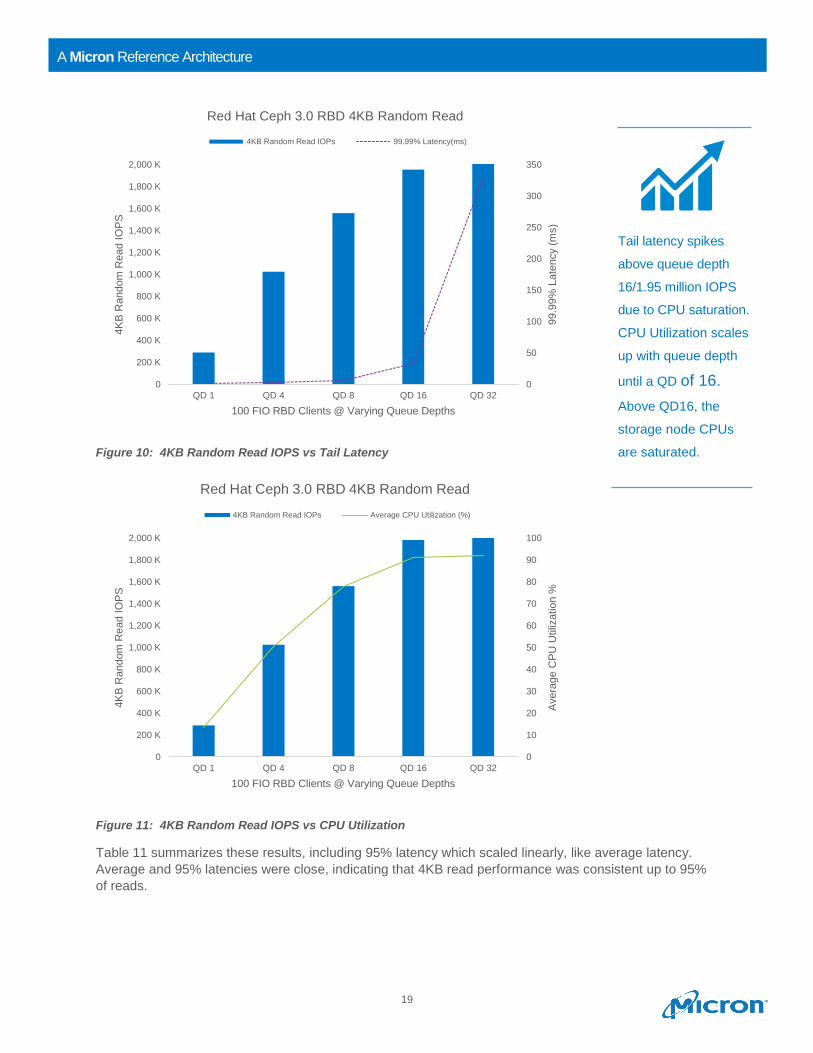
Figure 10: 4KB Random Read IOPS vs Tail Latency
Figure 11: 4KB Random Read IOPS vs CPU Utilization
Table 11 summarizes these results, including 95% latency which scaled linearly, like average latency.
Average and 95% latencies were close, indicating that 4KB read performance was consistent up to 95%
of reads.
0
50
100
150
200
250
300
350
0
200 K
400 K
600 K
800 K
1,000 K
1,200 K
1,400 K
1,600 K
1,800 K
2,000 K
QD 1 QD 4 QD 8 QD 16 QD 32
99.9
9%
Late
ncy (
ms)
4K
B R
andom
Read I
OP
S
100 FIO RBD Clients @ Varying Queue Depths
Red Hat Ceph 3.0 RBD 4KB Random Read
4KB Random Read IOPs 99.99% Latency(ms)
0
10
20
30
40
50
60
70
80
90
100
0
200 K
400 K
600 K
800 K
1,000 K
1,200 K
1,400 K
1,600 K
1,800 K
2,000 K
QD 1 QD 4 QD 8 QD 16 QD 32
Avera
ge C
PU
Utiliz
atio
n %
4K
B R
andom
Read I
OP
S
100 FIO RBD Clients @ Varying Queue Depths
Red Hat Ceph 3.0 RBD 4KB Random Read
4KB Random Read IOPs Average CPU Utilization (%)
Tail latency spikes
above queue depth
16/1.95 million IOPS
due to CPU saturation.
CPU Utilization scales
up with queue depth
until a QD of 16.
Above QD16, the
storage node CPUs
are saturated.
20
A Micron Reference Architecture
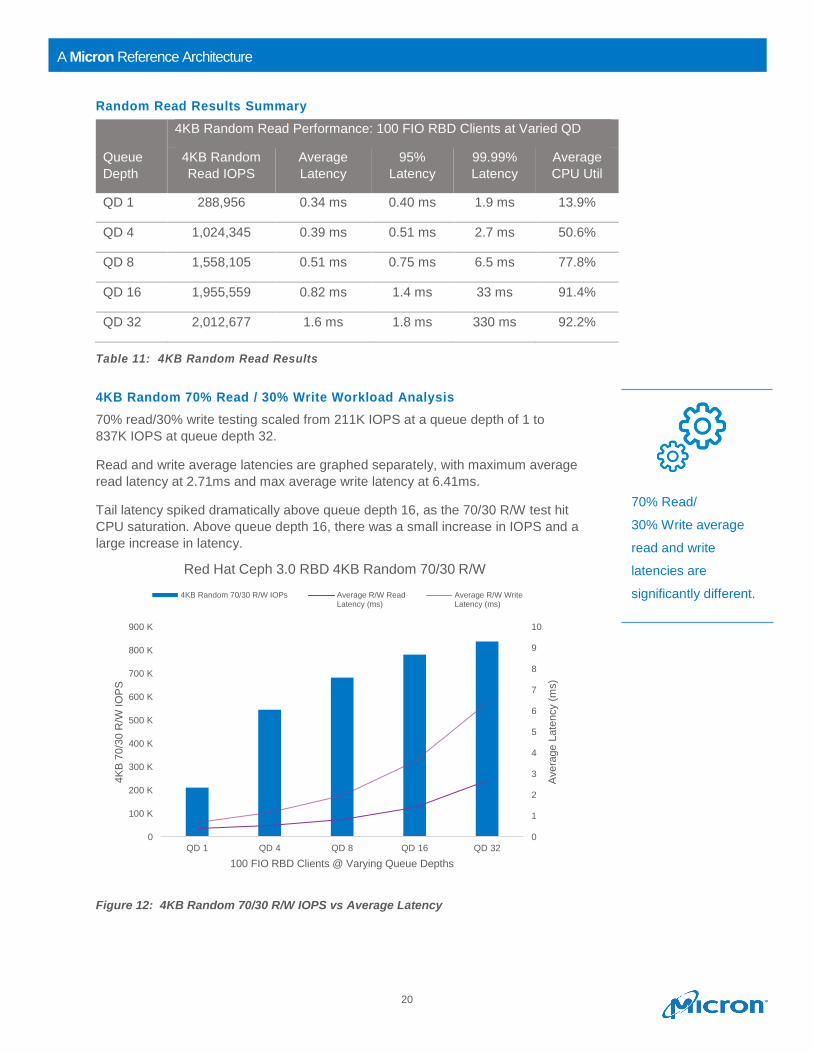
Random Read Results Summary
Queue
Depth
4KB Random Read Performance: 100 FIO RBD Clients at Varied QD
4KB Random
Read IOPS
Average
Latency
95%
Latency
99.99%
Latency
Average
CPU Util
QD 1 288,956 0.34 ms 0.40 ms 1.9 ms 13.9%
QD 4 1,024,345 0.39 ms 0.51 ms 2.7 ms 50.6%
QD 8 1,558,105 0.51 ms 0.75 ms 6.5 ms 77.8%
QD 16 1,955,559 0.82 ms 1.4 ms 33 ms 91.4%
QD 32 2,012,677 1.6 ms 1.8 ms 330 ms 92.2%
Table 11: 4KB Random Read Results
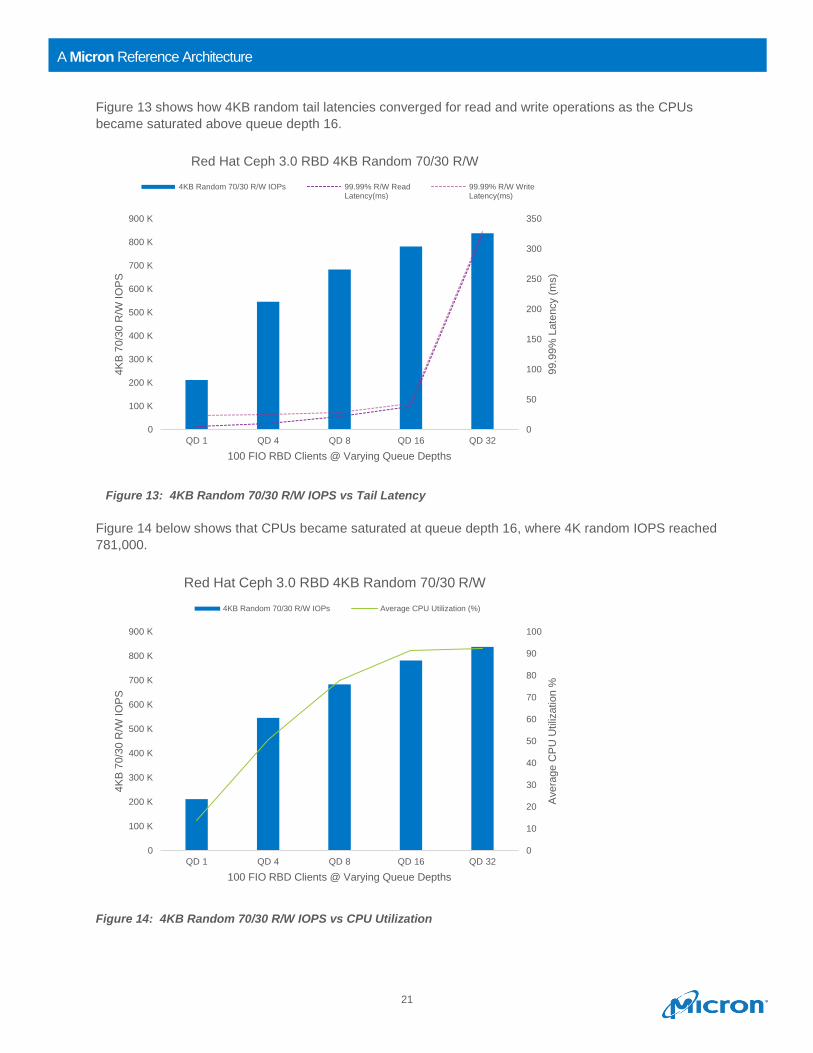
4KB Random 70% Read / 30% Write Workload Analysis
70% read/30% write testing scaled from 211K IOPS at a queue depth of 1 to
837K IOPS at queue depth 32.
Read and write average latencies are graphed separately, with maximum average
read latency at 2.71ms and max average write latency at 6.41ms.
Tail latency spiked dramatically above queue depth 16, as the 70/30 R/W test hit
CPU saturation. Above queue depth 16, there was a small increase in IOPS and a
large increase in latency.
Figure 12: 4KB Random 70/30 R/W IOPS vs Average Latency
0
1
2
3
4
5
6
7
8
9
10
0
100 K
200 K
300 K
400 K
500 K
600 K
700 K
800 K
900 K
QD 1 QD 4 QD 8 QD 16 QD 32
Avera
ge L
ate
ncy (
ms)
4K
B 7
0/3
0 R
/W IO
PS
100 FIO RBD Clients @ Varying Queue Depths
Red Hat Ceph 3.0 RBD 4KB Random 70/30 R/W
4KB Random 70/30 R/W IOPs Average R/W ReadLatency (ms)
Average R/W WriteLatency (ms)
70% Read/
30% Write average
read and write
latencies are
significantly different.
21
A Micron Reference Architecture
Figure 13 shows how 4KB random tail latencies converged for read and write operations as the CPUs
became saturated above queue depth 16.
Figure 14 below shows that CPUs became saturated at queue depth 16, where 4K random IOPS reached
781,000.
Figure 14: 4KB Random 70/30 R/W IOPS vs CPU Utilization
0
50
100
150
200
250
300
350
0
100 K
200 K
300 K
400 K
500 K
600 K
700 K
800 K
900 K
QD 1 QD 4 QD 8 QD 16 QD 32
99.9
9%
Late
ncy (
ms)
4K
B 7
0/3
0 R
/W IO
PS
100 FIO RBD Clients @ Varying Queue Depths
Red Hat Ceph 3.0 RBD 4KB Random 70/30 R/W
4KB Random 70/30 R/W IOPs 99.99% R/W ReadLatency(ms)
99.99% R/W WriteLatency(ms)
0
10
20
30
40
50
60
70
80
90
100
0
100 K
200 K
300 K
400 K
500 K
600 K
700 K
800 K
900 K
QD 1 QD 4 QD 8 QD 16 QD 32
Avera
ge C
PU
Utiliz
atio
n %
4K
B 7
0/3
0 R
/W IO
PS
100 FIO RBD Clients @ Varying Queue Depths
Red Hat Ceph 3.0 RBD 4KB Random 70/30 R/W
4KB Random 70/30 R/W IOPs Average CPU Utilization (%)
Figure 13: 4KB Random 70/30 R/W IOPS vs Tail Latency
22
A Micron Reference Architecture
Random 70/30 R/W Results Summary
Queue
Depth
4KB Random 70/30 R/W Performance: 100 FIO RBD Clients
at Varied QD
R/W
IOPS
Avg. Read
Latency
Avg. Write
Latency
99.99%
Read
Latency
99.99%
Write
Latency
Avg.
CPU
Util
QD 1 211,322 0.38 ms 0.68 ms 4.2 ms 23 ms 13.9%
QD 4 545,172 0.54 ms 1.2 ms 9.8 ms 24 ms 50.6%
QD 8 682,920 0.82 ms 1.9 ms 20 ms 29 ms 77.8%
QD 16 781,002 1.4 ms 3.5 ms 38 ms 42 ms 91.4%
QD 32 837,459 2.7 ms 6.4 ms 324 ms 329 ms 92.2%
Table 12: 4KB 70/30 Random Read/Write Results
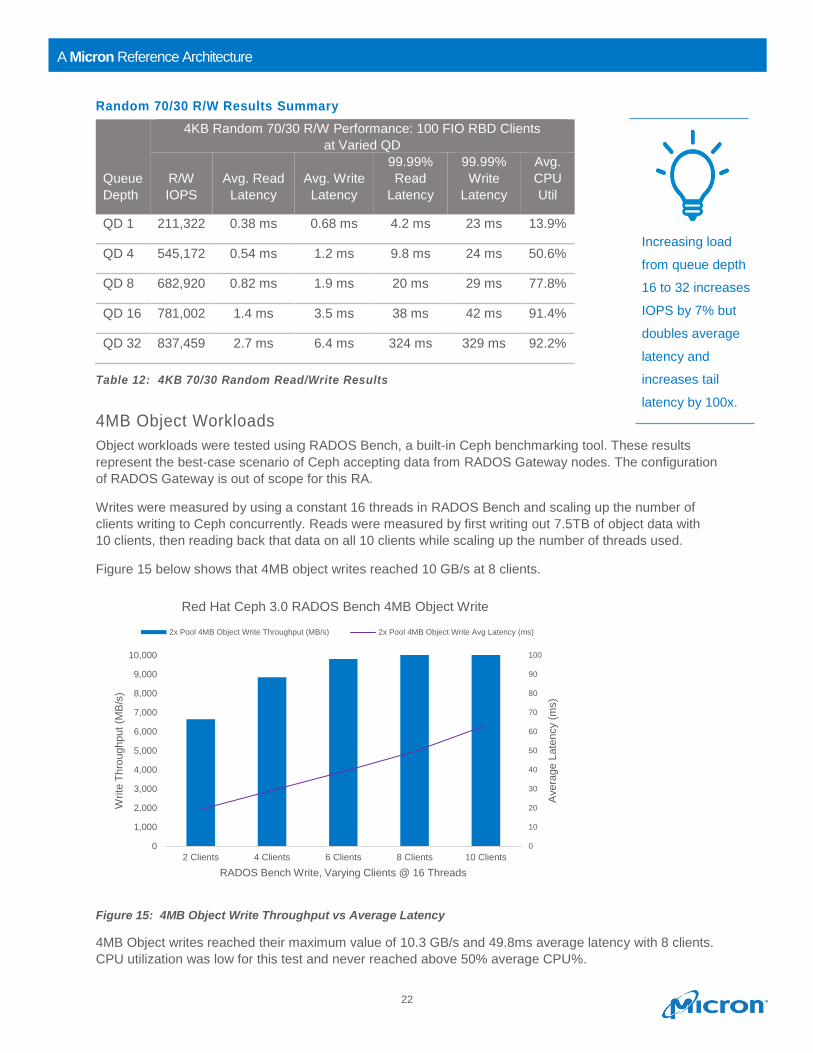
4MB Object Workloads
Object workloads were tested using RADOS Bench, a built-in Ceph benchmarking tool. These results
represent the best-case scenario of Ceph accepting data from RADOS Gateway nodes. The configuration
of RADOS Gateway is out of scope for this RA.
Writes were measured by using a constant 16 threads in RADOS Bench and scaling up the number of
clients writing to Ceph concurrently. Reads were measured by first writing out 7.5TB of object data with
10 clients, then reading back that data on all 10 clients while scaling up the number of threads used.
Figure 15 below shows that 4MB object writes reached 10 GB/s at 8 clients.
Figure 15: 4MB Object Write Throughput vs Average Latency
4MB Object writes reached their maximum value of 10.3 GB/s and 49.8ms average latency with 8 clients.
CPU utilization was low for this test and never reached above 50% average CPU%.
0
10
20
30
40
50
60
70
80
90
100
0
1,000
2,000
3,000
4,000
5,000
6,000
7,000
8,000
9,000
10,000
2 Clients 4 Clients 6 Clients 8 Clients 10 Clients
Avera
ge L
ate
ncy (
ms)
Write
Th
roughput
(MB
/s)
RADOS Bench Write, Varying Clients @ 16 Threads
Red Hat Ceph 3.0 RADOS Bench 4MB Object Write
2x Pool 4MB Object Write Throughput (MB/s) 2x Pool 4MB Object Write Avg Latency (ms)
Increasing load
from queue depth
16 to 32 increases
IOPS by 7% but
doubles average
latency and
increases tail
latency by 100x.
23
A Micron Reference Architecture
4MB Object Write Results Summary
Clients @
16 Threads
4MB Object Write Performance: RADOS Bench
Write Throughput Average Latency (ms)
2 Clients 6.6 GB/s 19.3
4 Clients 8.8 GB/s 28.9
6 Clients 9.8 GB/s 39.2
8 Clients 10.3 GB/s 49.8
10 Clients 10.1 GB/s 63.1
Table 13: 4MB Object Write Results
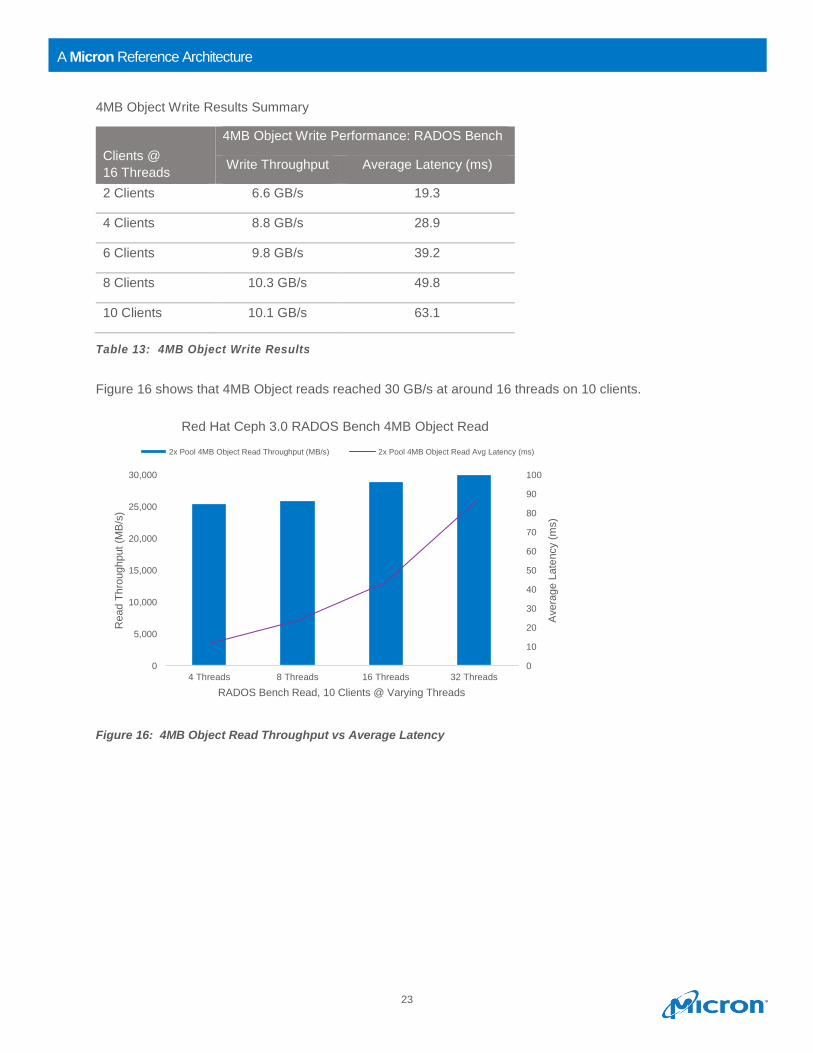
Figure 16 shows that 4MB Object reads reached 30 GB/s at around 16 threads on 10 clients.
Figure 16: 4MB Object Read Throughput vs Average Latency
0
10
20
30
40
50
60
70
80
90
100
0
5,000
10,000
15,000
20,000
25,000
30,000
4 Threads 8 Threads 16 Threads 32 Threads
Avera
ge L
ate
ncy (
ms)
Read T
hro
ughput (M
B/s
)
RADOS Bench Read, 10 Clients @ Varying Threads
Red Hat Ceph 3.0 RADOS Bench 4MB Object Read
2x Pool 4MB Object Read Throughput (MB/s) 2x Pool 4MB Object Read Avg Latency (ms)
24
A Micron Reference Architecture
4MB Object reads reached their maximum of 30 GB/s and 85.4ms average latency at 32 clients.
CPU utilization was low for this test and never reached above 50% average CPU%.
10 Clients @
Varied Threads
4MB Object Read Performance: RADOS Bench
Read Throughput Average Latency (ms)
4 Threads 25.6 GB/s 11.8
8 Threads 26.0 GB/s 23.9
16 Threads 29.0 GB/s 43.6
32 Threads 30.0 GB/s 85.4
Table 14: 4MB Object Read Results
2x vs. 3x Replication Performance
Many Ceph users require the added data protection of a 3x replicated pool. The results detailed below
compare data collected on a 2x and a 3x replicated storage pool in Red Hat Ceph 3.0 (Luminous 12.2.1)
with 8192 placement groups.
2x vs. 3x Replication 4KB Random Workloads
The 2x replicated pool in Red Hat Ceph 3.0 was tested with 100 RBD images at 75GB each, providing
7.5TB of data on a 2x replicated pool (15TB of total data). The 3x replicated pool in Red Hat Ceph 3.0
was tested with 100 RBD images at 50GB each, providing 5TB of data on a 3x replicated pool (15TB of
total data).
Random writes were tested with a constant queue depth of 32 while the number of clients increased from
10 to 100. Random reads and 70/30 R/W workloads were measured by running load against all 100 RBD
images and scaling up the queue depth per client from 1 to 32.
Each test was run three times at 10 minutes per run; the average results of those runs are represented in
the graphs that follow.
Increasing data protection by using a 3x replicated storage pool over a
2x replicated pool decreased 4KB random write performance by 35%
but did not affect read performance.
25
A Micron Reference Architecture
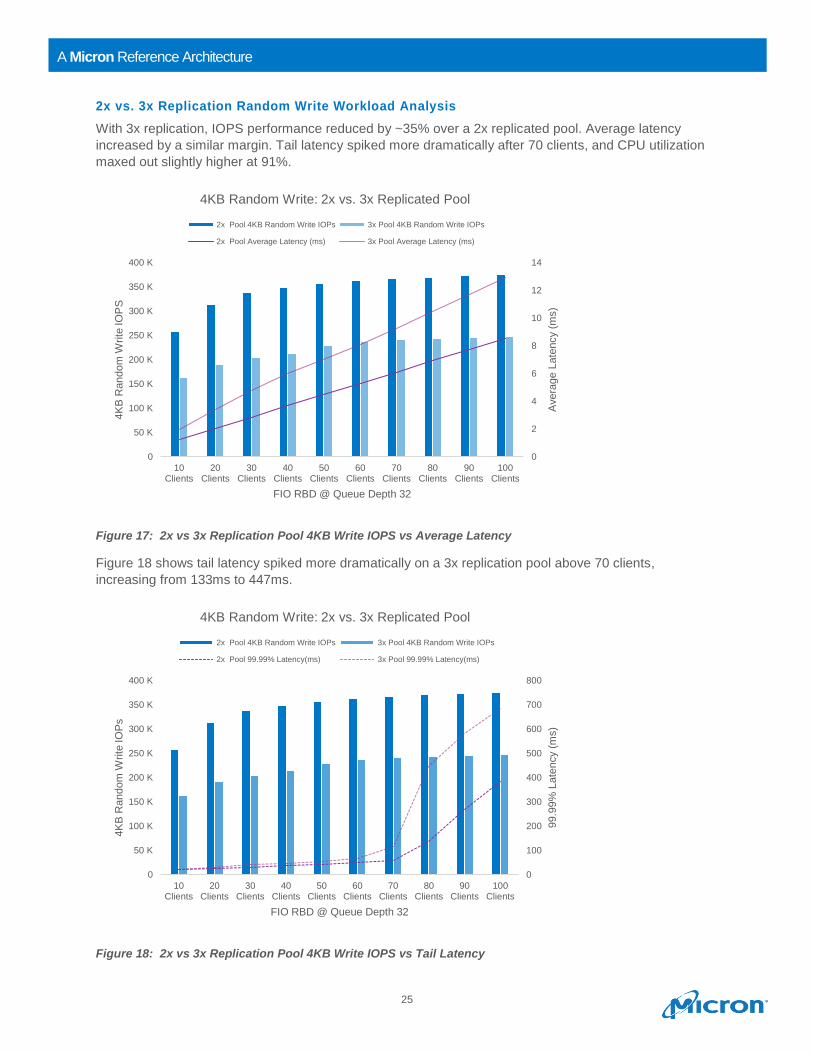
2x vs. 3x Replication Random Write Workload Analysis
With 3x replication, IOPS performance reduced by ~35% over a 2x replicated pool. Average latency
increased by a similar margin. Tail latency spiked more dramatically after 70 clients, and CPU utilization
maxed out slightly higher at 91%.
Figure 17: 2x vs 3x Replication Pool 4KB Write IOPS vs Average Latency
Figure 18 shows tail latency spiked more dramatically on a 3x replication pool above 70 clients,
increasing from 133ms to 447ms.
Figure 18: 2x vs 3x Replication Pool 4KB Write IOPS vs Tail Latency
0
2
4
6
8
10
12
14
0
50 K
100 K
150 K
200 K
250 K
300 K
350 K
400 K
10Clients
20Clients
30Clients
40Clients
50Clients
60Clients
70Clients
80Clients
90Clients
100Clients
Avera
ge L
ate
ncy (
ms)
4K
B R
andom
Write
IO
PS
FIO RBD @ Queue Depth 32
4KB Random Write: 2x vs. 3x Replicated Pool
2x Pool 4KB Random Write IOPs 3x Pool 4KB Random Write IOPs
2x Pool Average Latency (ms) 3x Pool Average Latency (ms)
0
100
200
300
400
500
600
700
800
0
50 K
100 K
150 K
200 K
250 K
300 K
350 K
400 K
10Clients
20Clients
30Clients
40Clients
50Clients
60Clients
70Clients
80Clients
90Clients
100Clients
99.9
9%
Late
ncy (
ms)
4K
B R
andom
Write
IO
Ps
FIO RBD @ Queue Depth 32
4KB Random Write: 2x vs. 3x Replicated Pool
2x Pool 4KB Random Write IOPs 3x Pool 4KB Random Write IOPs
2x Pool 99.99% Latency(ms) 3x Pool 99.99% Latency(ms)
26
A Micron Reference Architecture
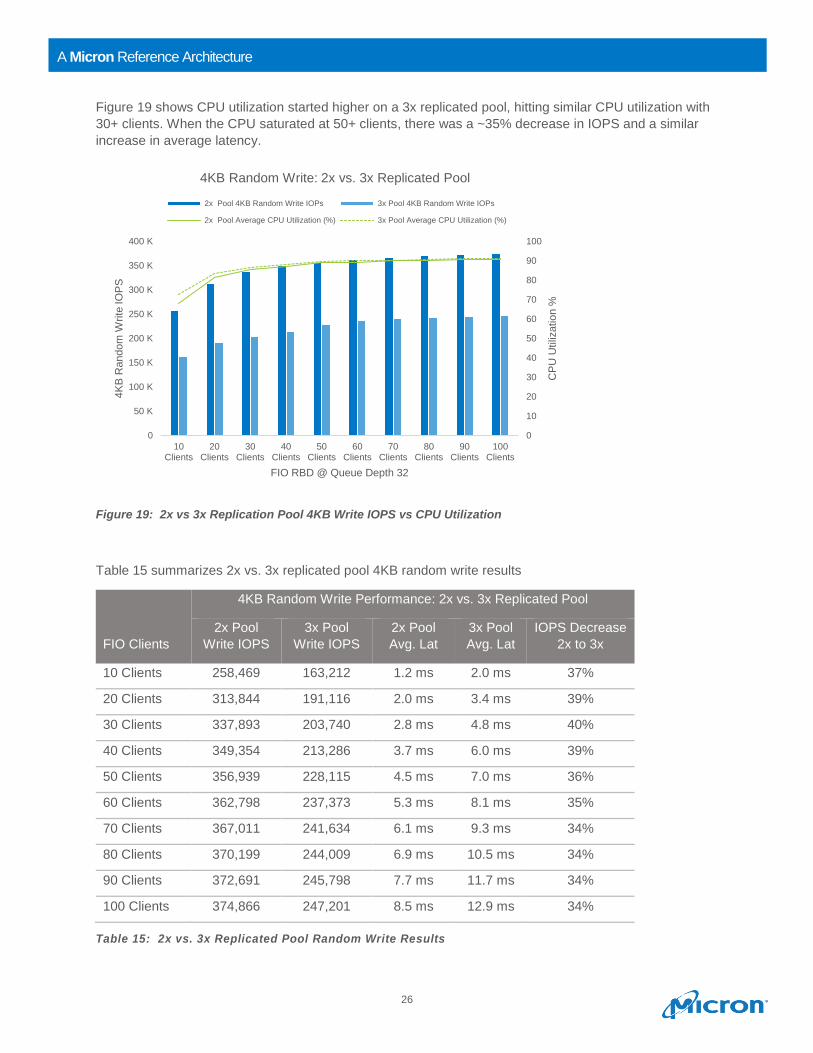
Figure 19 shows CPU utilization started higher on a 3x replicated pool, hitting similar CPU utilization with
30+ clients. When the CPU saturated at 50+ clients, there was a ~35% decrease in IOPS and a similar
increase in average latency.
Figure 19: 2x vs 3x Replication Pool 4KB Write IOPS vs CPU Utilization
Table 15 summarizes 2x vs. 3x replicated pool 4KB random write results
FIO Clients
4KB Random Write Performance: 2x vs. 3x Replicated Pool
2x Pool
Write IOPS
3x Pool
Write IOPS
2x Pool
Avg. Lat
3x Pool
Avg. Lat
IOPS Decrease
2x to 3x
10 Clients 258,469 163,212 1.2 ms 2.0 ms 37%
20 Clients 313,844 191,116 2.0 ms 3.4 ms 39%
30 Clients 337,893 203,740 2.8 ms 4.8 ms 40%
40 Clients 349,354 213,286 3.7 ms 6.0 ms 39%
50 Clients 356,939 228,115 4.5 ms 7.0 ms 36%
60 Clients 362,798 237,373 5.3 ms 8.1 ms 35%
70 Clients 367,011 241,634 6.1 ms 9.3 ms 34%
80 Clients 370,199 244,009 6.9 ms 10.5 ms 34%
90 Clients 372,691 245,798 7.7 ms 11.7 ms 34%
100 Clients 374,866 247,201 8.5 ms 12.9 ms 34%
Table 15: 2x vs. 3x Replicated Pool Random Write Results
0
10
20
30
40
50
60
70
80
90
100
0
50 K
100 K
150 K
200 K
250 K
300 K
350 K
400 K
10Clients
20Clients
30Clients
40Clients
50Clients
60Clients
70Clients
80Clients
90Clients
100Clients
CP
U U
tiliz
atio
n %
4K
B R
andom
Write
IO
PS
FIO RBD @ Queue Depth 32
4KB Random Write: 2x vs. 3x Replicated Pool
2x Pool 4KB Random Write IOPs 3x Pool 4KB Random Write IOPs
2x Pool Average CPU Utilization (%) 3x Pool Average CPU Utilization (%)
27
A Micron Reference Architecture
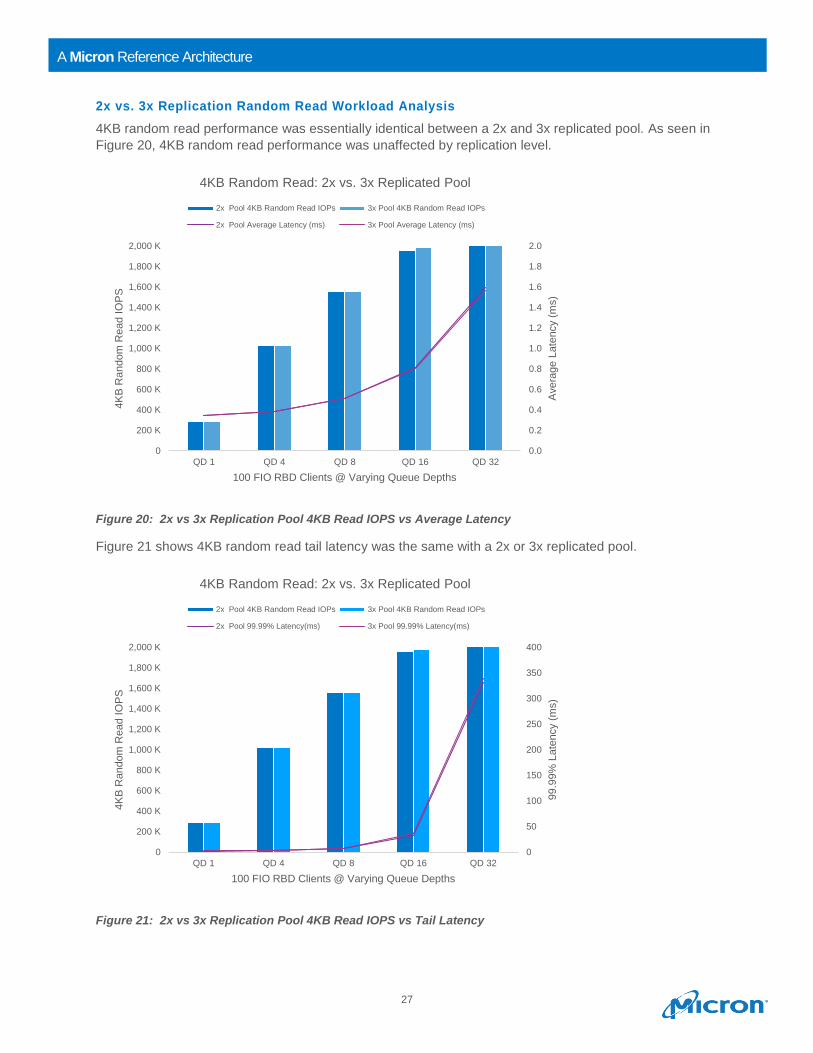
2x vs. 3x Replication Random Read Workload Analysis
4KB random read performance was essentially identical between a 2x and 3x replicated pool. As seen in
Figure 20, 4KB random read performance was unaffected by replication level.
Figure 20: 2x vs 3x Replication Pool 4KB Read IOPS vs Average Latency
Figure 21 shows 4KB random read tail latency was the same with a 2x or 3x replicated pool.
Figure 21: 2x vs 3x Replication Pool 4KB Read IOPS vs Tail Latency
0.0
0.2
0.4
0.6
0.8
1.0
1.2
1.4
1.6
1.8
2.0
0
200 K
400 K
600 K
800 K
1,000 K
1,200 K
1,400 K
1,600 K
1,800 K
2,000 K
QD 1 QD 4 QD 8 QD 16 QD 32
Avera
ge L
ate
ncy (
ms)
4K
B R
andom
Read I
OP
S
100 FIO RBD Clients @ Varying Queue Depths
4KB Random Read: 2x vs. 3x Replicated Pool
2x Pool 4KB Random Read IOPs 3x Pool 4KB Random Read IOPs
2x Pool Average Latency (ms) 3x Pool Average Latency (ms)
0
50
100
150
200
250
300
350
400
0
200 K
400 K
600 K
800 K
1,000 K
1,200 K
1,400 K
1,600 K
1,800 K
2,000 K
QD 1 QD 4 QD 8 QD 16 QD 32
99.9
9%
Late
ncy (
ms)
4K
B R
andom
Read I
OP
S
100 FIO RBD Clients @ Varying Queue Depths
4KB Random Read: 2x vs. 3x Replicated Pool
2x Pool 4KB Random Read IOPs 3x Pool 4KB Random Read IOPs
2x Pool 99.99% Latency(ms) 3x Pool 99.99% Latency(ms)
28
A Micron Reference Architecture
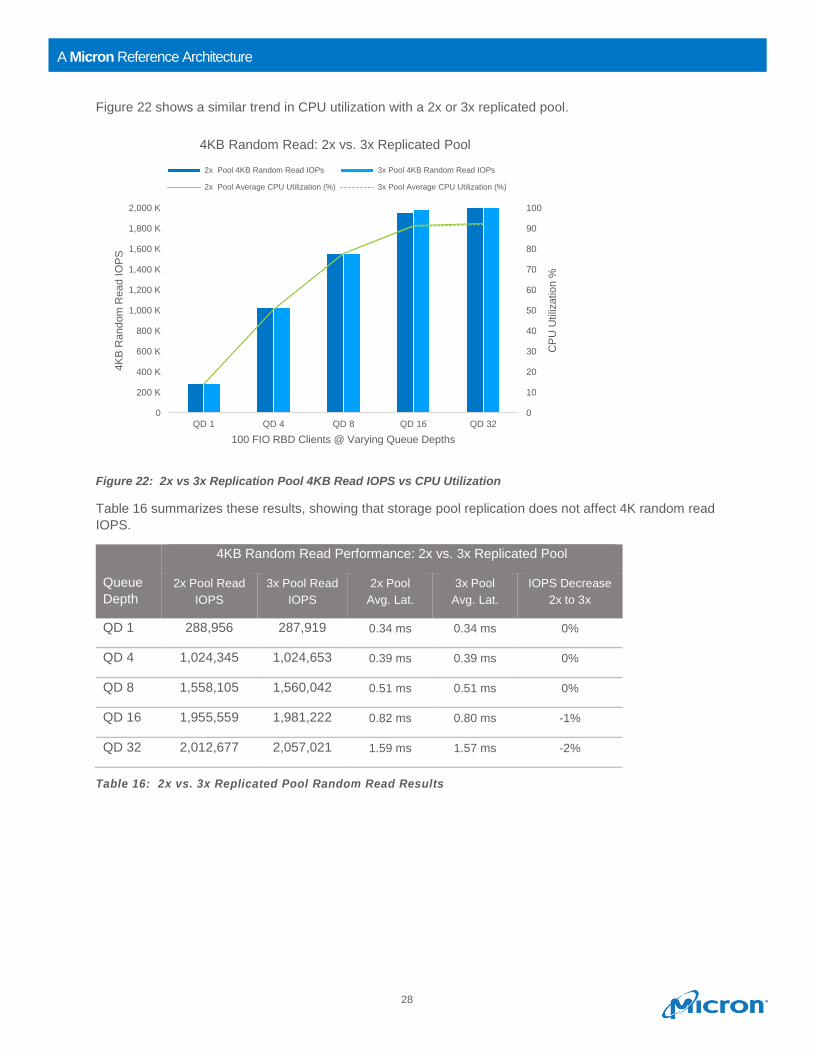
Figure 22 shows a similar trend in CPU utilization with a 2x or 3x replicated pool.
Figure 22: 2x vs 3x Replication Pool 4KB Read IOPS vs CPU Utilization
Table 16 summarizes these results, showing that storage pool replication does not affect 4K random read
IOPS.
Queue
Depth
4KB Random Read Performance: 2x vs. 3x Replicated Pool
2x Pool Read
IOPS
3x Pool Read
IOPS
2x Pool
Avg. Lat.
3x Pool
Avg. Lat.
IOPS Decrease
2x to 3x
QD 1 288,956 287,919 0.34 ms 0.34 ms 0%
QD 4 1,024,345 1,024,653 0.39 ms 0.39 ms 0%
QD 8 1,558,105 1,560,042 0.51 ms 0.51 ms 0%
QD 16 1,955,559 1,981,222 0.82 ms 0.80 ms -1%
QD 32 2,012,677 2,057,021 1.59 ms 1.57 ms -2%
Table 16: 2x vs. 3x Replicated Pool Random Read Results
0
10
20
30
40
50
60
70
80
90
100
0
200 K
400 K
600 K
800 K
1,000 K
1,200 K
1,400 K
1,600 K
1,800 K
2,000 K
QD 1 QD 4 QD 8 QD 16 QD 32
CP
U U
tiliz
atio
n %
4K
B R
andom
Read I
OP
S
100 FIO RBD Clients @ Varying Queue Depths
4KB Random Read: 2x vs. 3x Replicated Pool
2x Pool 4KB Random Read IOPs 3x Pool 4KB Random Read IOPs
2x Pool Average CPU Utilization (%) 3x Pool Average CPU Utilization (%)
29
A Micron Reference Architecture
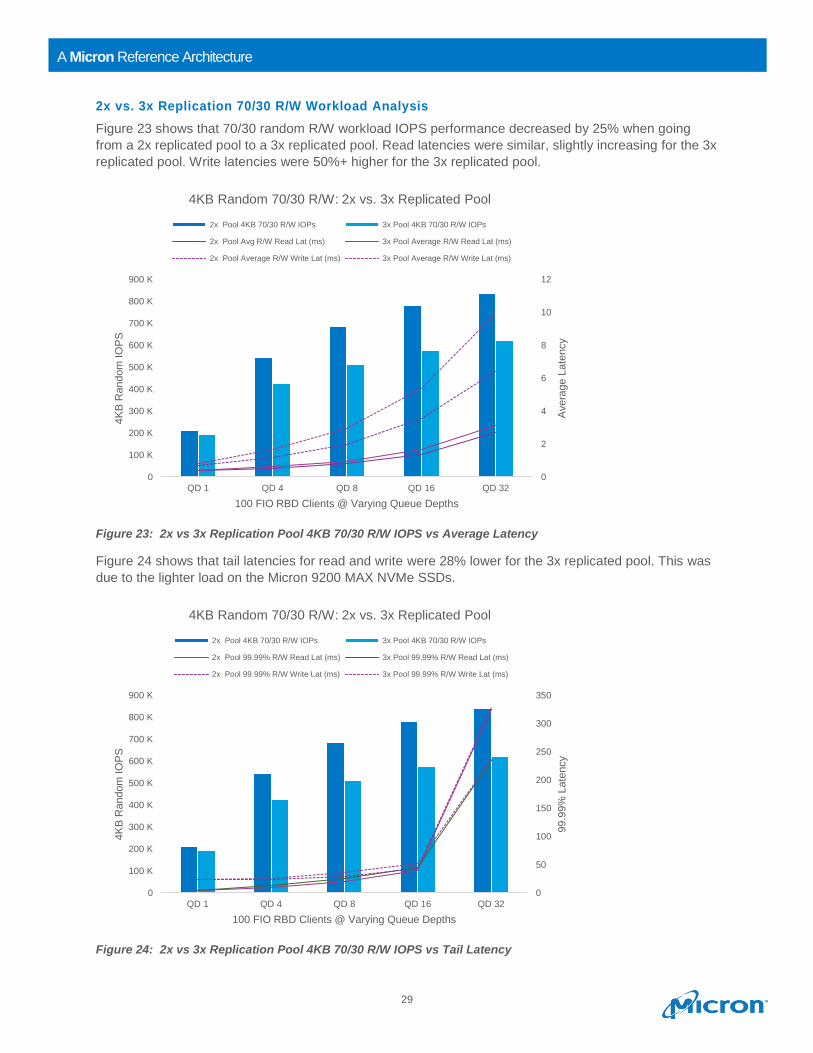
2x vs. 3x Replication 70/30 R/W Workload Analysis
Figure 23 shows that 70/30 random R/W workload IOPS performance decreased by 25% when going
from a 2x replicated pool to a 3x replicated pool. Read latencies were similar, slightly increasing for the 3x
replicated pool. Write latencies were 50%+ higher for the 3x replicated pool.
Figure 23: 2x vs 3x Replication Pool 4KB 70/30 R/W IOPS vs Average Latency
Figure 24 shows that tail latencies for read and write were 28% lower for the 3x replicated pool. This was
due to the lighter load on the Micron 9200 MAX NVMe SSDs.
Figure 24: 2x vs 3x Replication Pool 4KB 70/30 R/W IOPS vs Tail Latency
0
2
4
6
8
10
12
0
100 K
200 K
300 K
400 K
500 K
600 K
700 K
800 K
900 K
QD 1 QD 4 QD 8 QD 16 QD 32
Avera
ge L
ate
ncy
4K
B R
andom
IO
PS
100 FIO RBD Clients @ Varying Queue Depths
4KB Random 70/30 R/W: 2x vs. 3x Replicated Pool
2x Pool 4KB 70/30 R/W IOPs 3x Pool 4KB 70/30 R/W IOPs
2x Pool Avg R/W Read Lat (ms) 3x Pool Average R/W Read Lat (ms)
2x Pool Average R/W Write Lat (ms) 3x Pool Average R/W Write Lat (ms)
0
50
100
150
200
250
300
350
0
100 K
200 K
300 K
400 K
500 K
600 K
700 K
800 K
900 K
QD 1 QD 4 QD 8 QD 16 QD 32
99.9
9%
Late
ncy
4K
B R
andom
IO
PS
100 FIO RBD Clients @ Varying Queue Depths
4KB Random 70/30 R/W: 2x vs. 3x Replicated Pool
2x Pool 4KB 70/30 R/W IOPs 3x Pool 4KB 70/30 R/W IOPs
2x Pool 99.99% R/W Read Lat (ms) 3x Pool 99.99% R/W Read Lat (ms)
2x Pool 99.99% R/W Write Lat (ms) 3x Pool 99.99% R/W Write Lat (ms)
30
A Micron Reference Architecture
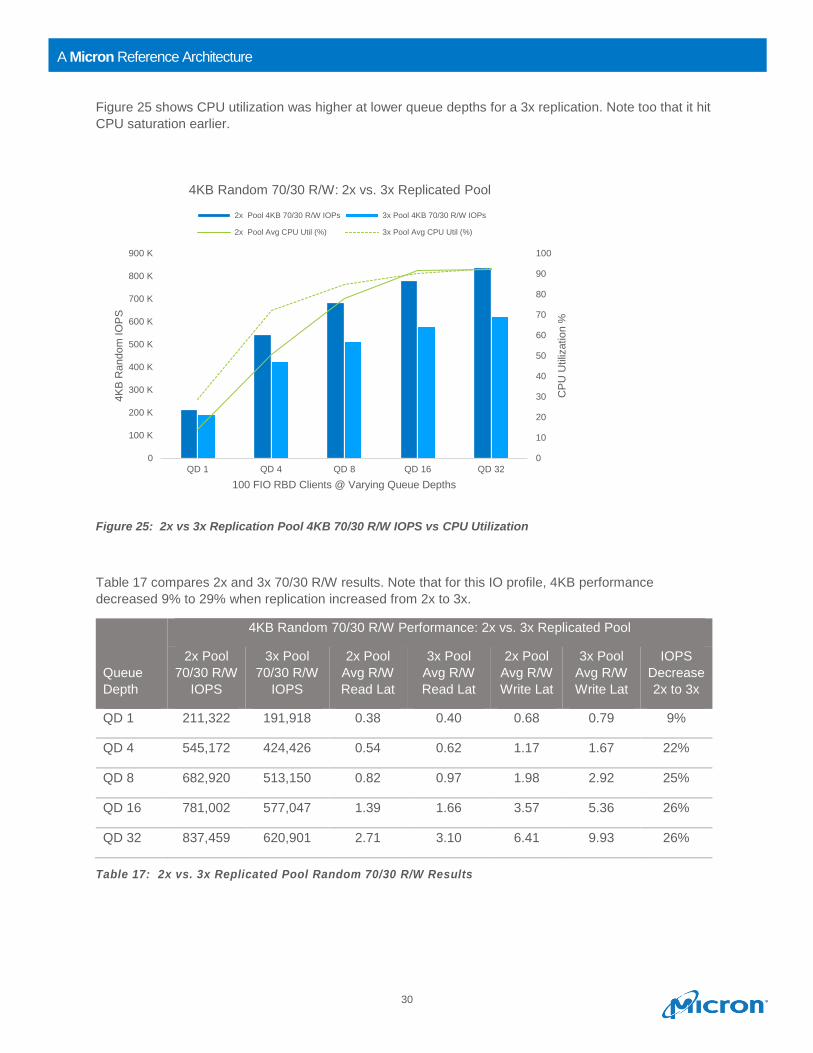
Figure 25 shows CPU utilization was higher at lower queue depths for a 3x replication. Note too that it hit
CPU saturation earlier.
Figure 25: 2x vs 3x Replication Pool 4KB 70/30 R/W IOPS vs CPU Utilization
Table 17 compares 2x and 3x 70/30 R/W results. Note that for this IO profile, 4KB performance
decreased 9% to 29% when replication increased from 2x to 3x.
Queue
Depth
4KB Random 70/30 R/W Performance: 2x vs. 3x Replicated Pool
2x Pool
70/30 R/W
IOPS
3x Pool
70/30 R/W
IOPS
2x Pool
Avg R/W
Read Lat
3x Pool
Avg R/W
Read Lat
2x Pool
Avg R/W
Write Lat
3x Pool
Avg R/W
Write Lat
IOPS
Decrease
2x to 3x
QD 1 211,322 191,918 0.38 0.40 0.68 0.79 9%
QD 4 545,172 424,426 0.54 0.62 1.17 1.67 22%
QD 8 682,920 513,150 0.82 0.97 1.98 2.92 25%
QD 16 781,002 577,047 1.39 1.66 3.57 5.36 26%
QD 32 837,459 620,901 2.71 3.10 6.41 9.93 26%
Table 17: 2x vs. 3x Replicated Pool Random 70/30 R/W Results
0
10
20
30
40
50
60
70
80
90
100
0
100 K
200 K
300 K
400 K
500 K
600 K
700 K
800 K
900 K
QD 1 QD 4 QD 8 QD 16 QD 32
CP
U U
tiliz
atio
n %
4K
B R
andom
IO
PS
100 FIO RBD Clients @ Varying Queue Depths
4KB Random 70/30 R/W: 2x vs. 3x Replicated Pool
2x Pool 4KB 70/30 R/W IOPs 3x Pool 4KB 70/30 R/W IOPs
2x Pool Avg CPU Util (%) 3x Pool Avg CPU Util (%)
31
A Micron Reference Architecture
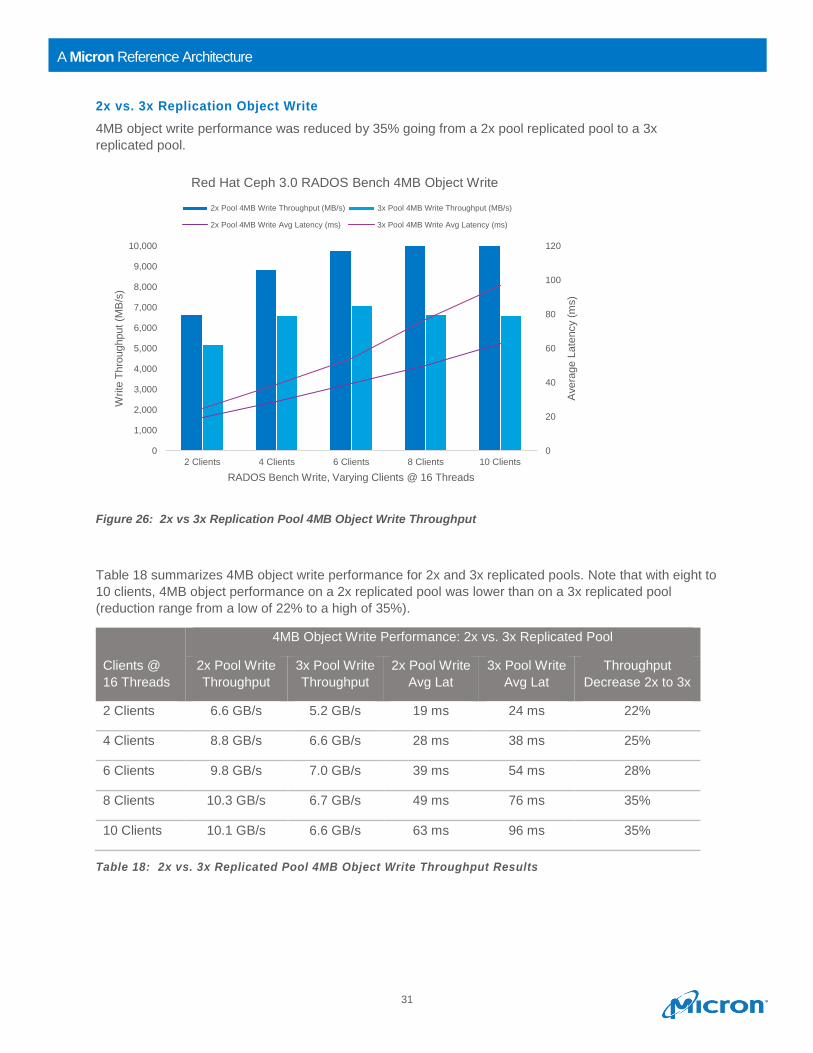
2x vs. 3x Replication Object Write
4MB object write performance was reduced by 35% going from a 2x pool replicated pool to a 3x
replicated pool.
Figure 26: 2x vs 3x Replication Pool 4MB Object Write Throughput
Table 18 summarizes 4MB object write performance for 2x and 3x replicated pools. Note that with eight to
10 clients, 4MB object performance on a 2x replicated pool was lower than on a 3x replicated pool
(reduction range from a low of 22% to a high of 35%).
Clients @
16 Threads
4MB Object Write Performance: 2x vs. 3x Replicated Pool
2x Pool Write
Throughput
3x Pool Write
Throughput
2x Pool Write
Avg Lat
3x Pool Write
Avg Lat
Throughput
Decrease 2x to 3x
2 Clients 6.6 GB/s 5.2 GB/s 19 ms 24 ms 22%
4 Clients 8.8 GB/s 6.6 GB/s 28 ms 38 ms 25%
6 Clients 9.8 GB/s 7.0 GB/s 39 ms 54 ms 28%
8 Clients 10.3 GB/s 6.7 GB/s 49 ms 76 ms 35%
10 Clients 10.1 GB/s 6.6 GB/s 63 ms 96 ms 35%
Table 18: 2x vs. 3x Replicated Pool 4MB Object Write Throughput Results
0
20
40
60
80
100
120
0
1,000
2,000
3,000
4,000
5,000
6,000
7,000
8,000
9,000
10,000
2 Clients 4 Clients 6 Clients 8 Clients 10 Clients
Avera
ge L
ate
ncy (
ms)
Write
Th
roughput
(MB
/s)
RADOS Bench Write, Varying Clients @ 16 Threads
Red Hat Ceph 3.0 RADOS Bench 4MB Object Write
2x Pool 4MB Write Throughput (MB/s) 3x Pool 4MB Write Throughput (MB/s)
2x Pool 4MB Write Avg Latency (ms) 3x Pool 4MB Write Avg Latency (ms)
32
A Micron Reference Architecture
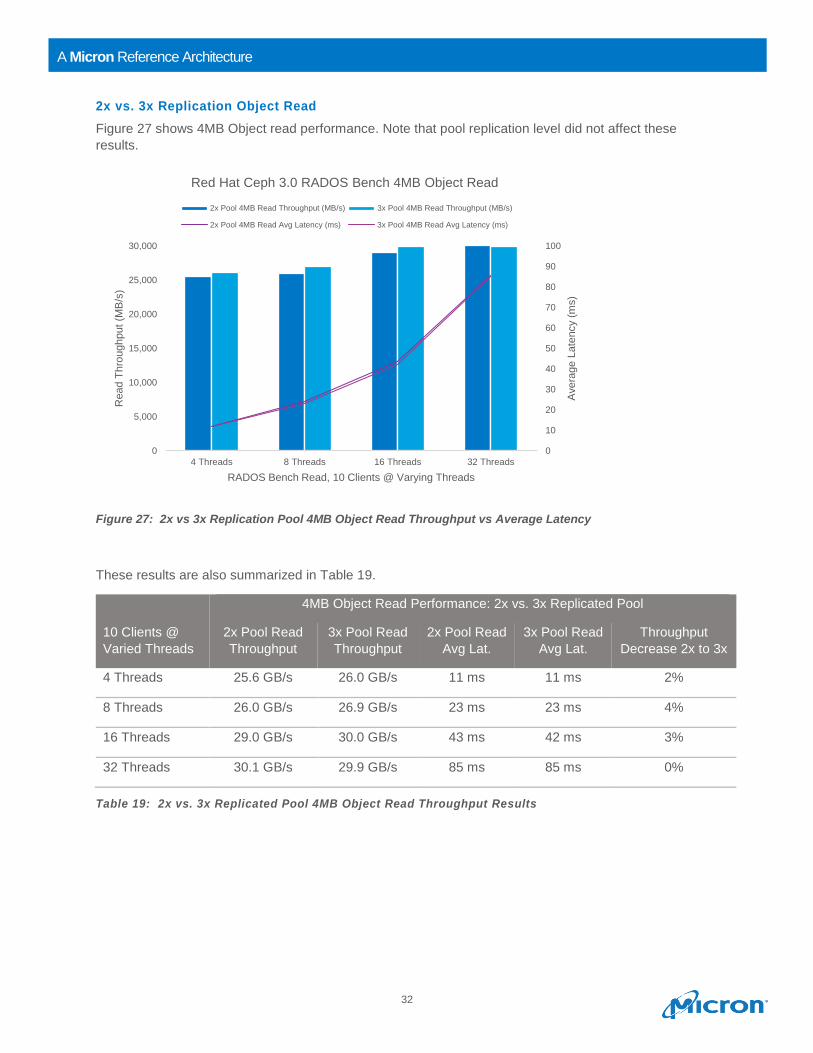
2x vs. 3x Replication Object Read
Figure 27 shows 4MB Object read performance. Note that pool replication level did not affect these
results.
Figure 27: 2x vs 3x Replication Pool 4MB Object Read Throughput vs Average Latency
These results are also summarized in Table 19.
10 Clients @
Varied Threads
4MB Object Read Performance: 2x vs. 3x Replicated Pool
2x Pool Read
Throughput
3x Pool Read
Throughput
2x Pool Read
Avg Lat.
3x Pool Read
Avg Lat.
Throughput
Decrease 2x to 3x
4 Threads 25.6 GB/s 26.0 GB/s 11 ms 11 ms 2%
8 Threads 26.0 GB/s 26.9 GB/s 23 ms 23 ms 4%
16 Threads 29.0 GB/s 30.0 GB/s 43 ms 42 ms 3%
32 Threads 30.1 GB/s 29.9 GB/s 85 ms 85 ms 0%
Table 19: 2x vs. 3x Replicated Pool 4MB Object Read Throughput Results
0
10
20
30
40
50
60
70
80
90
100
0
5,000
10,000
15,000
20,000
25,000
30,000
4 Threads 8 Threads 16 Threads 32 Threads
Avera
ge L
ate
ncy (
ms)
Read T
hro
ughput (M
B/s
)
RADOS Bench Read, 10 Clients @ Varying Threads
Red Hat Ceph 3.0 RADOS Bench 4MB Object Read
2x Pool 4MB Read Throughput (MB/s) 3x Pool 4MB Read Throughput (MB/s)
2x Pool 4MB Read Avg Latency (ms) 3x Pool 4MB Read Avg Latency (ms)
33
A Micron Reference Architecture
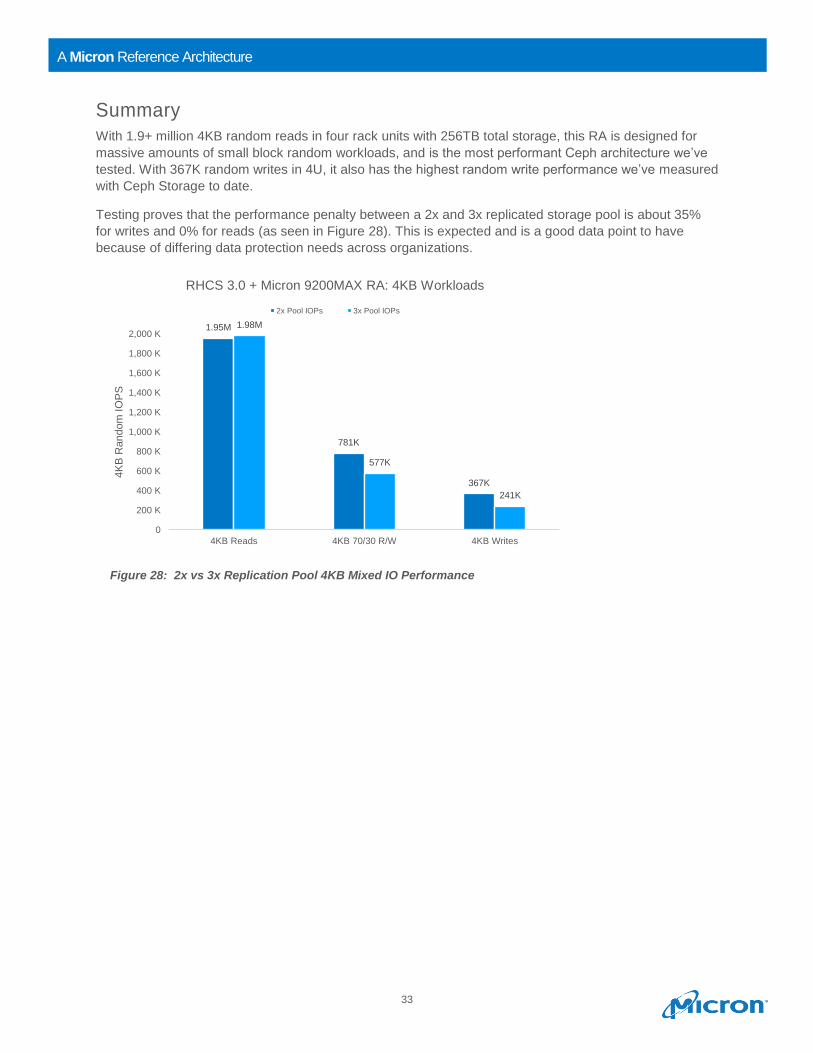
Summary
With 1.9+ million 4KB random reads in four rack units with 256TB total storage, this RA is designed for
massive amounts of small block random workloads, and is the most performant Ceph architecture we’ve
tested. With 367K random writes in 4U, it also has the highest random write performance we’ve measured
with Ceph Storage to date.
Testing proves that the performance penalty between a 2x and 3x replicated storage pool is about 35%
for writes and 0% for reads (as seen in Figure 28). This is expected and is a good data point to have
because of differing data protection needs across organizations.
1.95M
781K
367K
1.98M
577K
241K
0
200 K
400 K
600 K
800 K
1,000 K
1,200 K
1,400 K
1,600 K
1,800 K
2,000 K
4KB Reads 4KB 70/30 R/W 4KB Writes
4K
B R
andom
IO
PS
RHCS 3.0 + Micron 9200MAX RA: 4KB Workloads
2x Pool IOPs 3x Pool IOPs
Figure 28: 2x vs 3x Replication Pool 4KB Mixed IO Performance
34
A Micron Reference Architecture
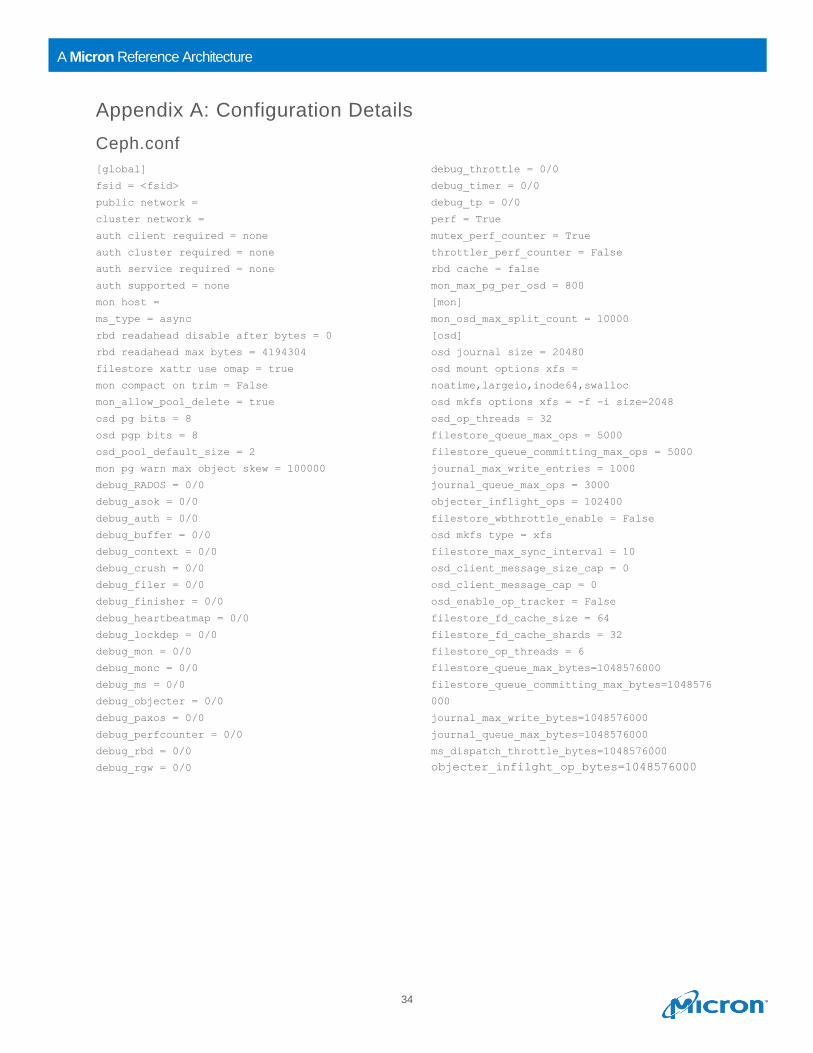
Appendix A: Configuration Details
Ceph.conf
[global]
fsid = <fsid>
public network =
cluster network =
auth client required = none
auth cluster required = none
auth service required = none
auth supported = none
mon host =
ms_type = async
rbd readahead disable after bytes = 0
rbd readahead max bytes = 4194304
filestore xattr use omap = true
mon compact on trim = False
mon_allow_pool_delete = true
osd pg bits = 8
osd pgp bits = 8
osd_pool_default_size = 2
mon pg warn max object skew = 100000
debug_RADOS = 0/0
debug_asok = 0/0
debug_auth = 0/0
debug_buffer = 0/0
debug_context = 0/0
debug_crush = 0/0
debug_filer = 0/0
debug_finisher = 0/0
debug_heartbeatmap = 0/0
debug_lockdep = 0/0
debug_mon = 0/0
debug_monc = 0/0
debug_ms = 0/0
debug_objecter = 0/0
debug_paxos = 0/0
debug_perfcounter = 0/0
debug_rbd = 0/0
debug_rgw = 0/0
debug_throttle = 0/0
debug_timer = 0/0
debug_tp = 0/0
perf = True
mutex_perf_counter = True
throttler_perf_counter = False
rbd cache = false
mon_max_pg_per_osd = 800
[mon]
mon_osd_max_split_count = 10000
[osd]
osd journal size = 20480
osd mount options xfs =
noatime,largeio,inode64,swalloc
osd mkfs options xfs = -f -i size=2048
osd_op_threads = 32
filestore_queue_max_ops = 5000
filestore_queue_committing_max_ops = 5000
journal_max_write_entries = 1000
journal_queue_max_ops = 3000
objecter_inflight_ops = 102400
filestore_wbthrottle_enable = False
osd mkfs type = xfs
filestore_max_sync_interval = 10
osd_client_message_size_cap = 0
osd_client_message_cap = 0
osd_enable_op_tracker = False
filestore_fd_cache_size = 64
filestore_fd_cache_shards = 32
filestore_op_threads = 6
filestore_queue_max_bytes=1048576000
filestore_queue_committing_max_bytes=1048576
000
journal_max_write_bytes=1048576000
journal_queue_max_bytes=1048576000
ms_dispatch_throttle_bytes=1048576000
objecter_infilght_op_bytes=1048576000
35
A Micron Reference Architecture
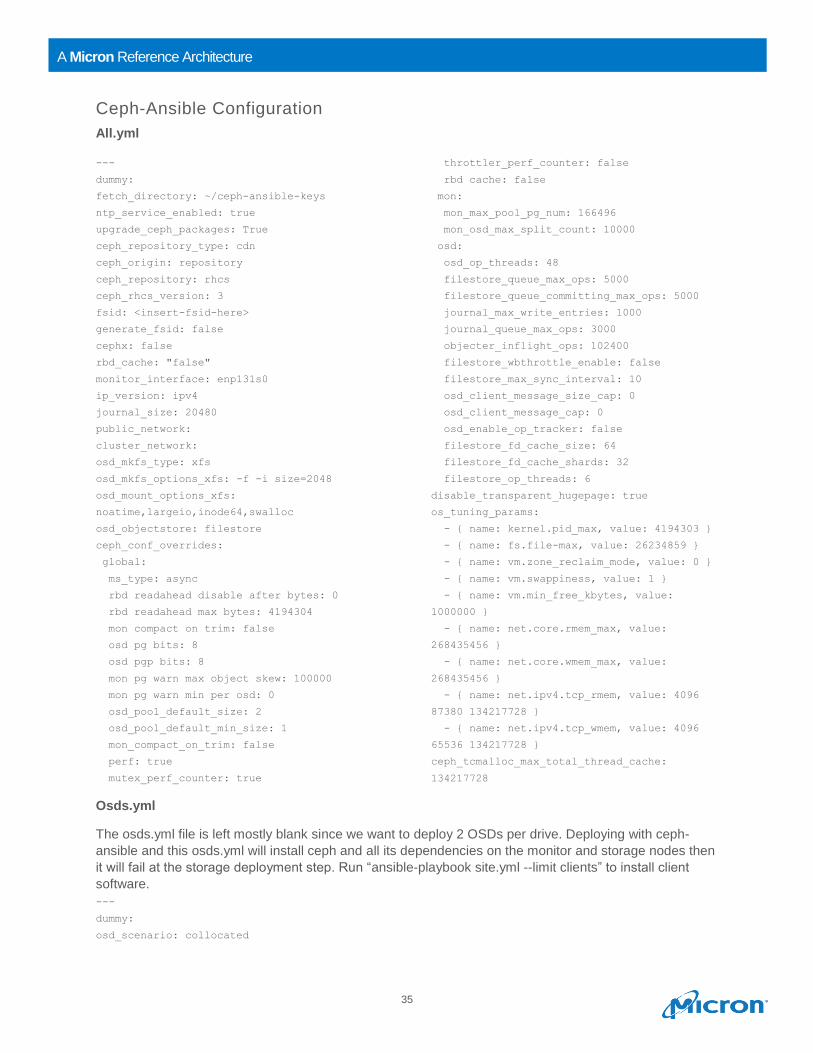
Ceph-Ansible Configuration
All.yml
---
dummy:
fetch_directory: ~/ceph-ansible-keys
ntp_service_enabled: true
upgrade_ceph_packages: True
ceph_repository_type: cdn
ceph_origin: repository
ceph_repository: rhcs
ceph_rhcs_version: 3
fsid: <insert-fsid-here>
generate_fsid: false
cephx: false
rbd_cache: "false"
monitor_interface: enp131s0
ip_version: ipv4
journal_size: 20480
public_network:
cluster_network:
osd_mkfs_type: xfs
osd_mkfs_options_xfs: -f -i size=2048
osd_mount_options_xfs:
noatime,largeio,inode64,swalloc
osd_objectstore: filestore
ceph_conf_overrides:
global:
ms_type: async
rbd readahead disable after bytes: 0
rbd readahead max bytes: 4194304
mon compact on trim: false
osd pg bits: 8
osd pgp bits: 8
mon pg warn max object skew: 100000
mon pg warn min per osd: 0
osd_pool_default_size: 2
osd_pool_default_min_size: 1
mon_compact_on_trim: false
perf: true
mutex_perf_counter: true
throttler_perf_counter: false
rbd cache: false
mon:
mon_max_pool_pg_num: 166496
mon_osd_max_split_count: 10000
osd:
osd_op_threads: 48
filestore_queue_max_ops: 5000
filestore_queue_committing_max_ops: 5000
journal_max_write_entries: 1000
journal_queue_max_ops: 3000
objecter_inflight_ops: 102400
filestore_wbthrottle_enable: false
filestore_max_sync_interval: 10
osd_client_message_size_cap: 0
osd_client_message_cap: 0
osd_enable_op_tracker: false
filestore_fd_cache_size: 64
filestore_fd_cache_shards: 32
filestore_op_threads: 6
disable_transparent_hugepage: true
os_tuning_params:
- { name: kernel.pid_max, value: 4194303 }
- { name: fs.file-max, value: 26234859 }
- { name: vm.zone_reclaim_mode, value: 0 }
- { name: vm.swappiness, value: 1 }
- { name: vm.min_free_kbytes, value:
1000000 }
- { name: net.core.rmem_max, value:
268435456 }
- { name: net.core.wmem_max, value:
268435456 }
- { name: net.ipv4.tcp_rmem, value: 4096
87380 134217728 }
- { name: net.ipv4.tcp_wmem, value: 4096
65536 134217728 }
ceph_tcmalloc_max_total_thread_cache:
134217728
Osds.yml
The osds.yml file is left mostly blank since we want to deploy 2 OSDs per drive. Deploying with ceph-
ansible and this osds.yml will install ceph and all its dependencies on the monitor and storage nodes then
it will fail at the storage deployment step. Run “ansible-playbook site.yml --limit clients” to install client
software.
---
dummy:
osd_scenario: collocated
36
A Micron Reference Architecture
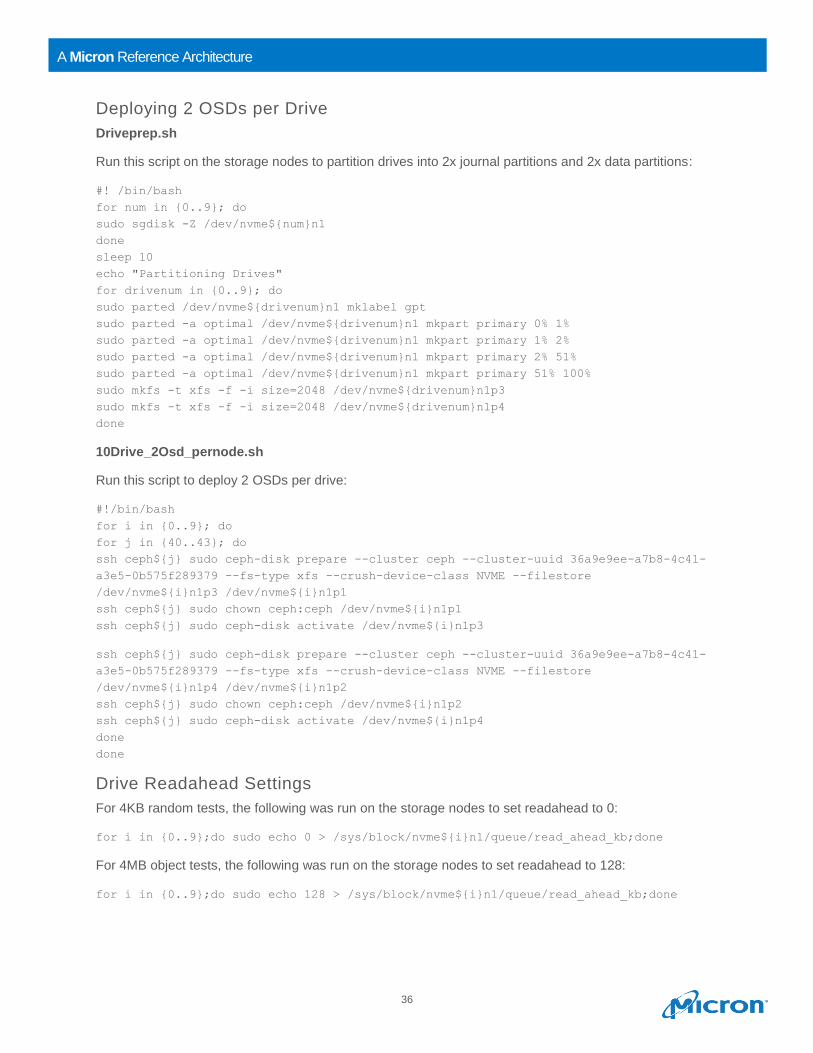
Deploying 2 OSDs per Drive
Driveprep.sh
Run this script on the storage nodes to partition drives into 2x journal partitions and 2x data partitions:
#! /bin/bash
for num in {0..9}; do
sudo sgdisk -Z /dev/nvme${num}n1
done
sleep 10
echo "Partitioning Drives"
for drivenum in {0..9}; do
sudo parted /dev/nvme${drivenum}n1 mklabel gpt
sudo parted -a optimal /dev/nvme${drivenum}n1 mkpart primary 0% 1%
sudo parted -a optimal /dev/nvme${drivenum}n1 mkpart primary 1% 2%
sudo parted -a optimal /dev/nvme${drivenum}n1 mkpart primary 2% 51%
sudo parted -a optimal /dev/nvme${drivenum}n1 mkpart primary 51% 100%
sudo mkfs -t xfs -f -i size=2048 /dev/nvme${drivenum}n1p3
sudo mkfs -t xfs -f -i size=2048 /dev/nvme${drivenum}n1p4
done
10Drive_2Osd_pernode.sh
Run this script to deploy 2 OSDs per drive:
#!/bin/bash
for i in {0..9}; do
for j in {40..43}; do
ssh ceph${j} sudo ceph-disk prepare --cluster ceph --cluster-uuid 36a9e9ee-a7b8-4c41-
a3e5-0b575f289379 --fs-type xfs --crush-device-class NVME --filestore
/dev/nvme${i}n1p3 /dev/nvme${i}n1p1
ssh ceph${j} sudo chown ceph:ceph /dev/nvme${i}n1p1
ssh ceph${j} sudo ceph-disk activate /dev/nvme${i}n1p3
ssh ceph${j} sudo ceph-disk prepare --cluster ceph --cluster-uuid 36a9e9ee-a7b8-4c41-
a3e5-0b575f289379 --fs-type xfs --crush-device-class NVME --filestore
/dev/nvme${i}n1p4 /dev/nvme${i}n1p2
ssh ceph${j} sudo chown ceph:ceph /dev/nvme${i}n1p2
ssh ceph${j} sudo ceph-disk activate /dev/nvme${i}n1p4
done
done
Drive Readahead Settings
For 4KB random tests, the following was run on the storage nodes to set readahead to 0:
for i in {0..9};do sudo echo 0 > /sys/block/nvme${i}n1/queue/read_ahead_kb;done
For 4MB object tests, the following was run on the storage nodes to set readahead to 128:
for i in {0..9};do sudo echo 128 > /sys/block/nvme${i}n1/queue/read_ahead_kb;done
37
A Micron Reference Architecture
Spectre/Meltdown Patch Settings
Due to the potential performance impact and changing release status of Spectre/Meltdown updates, the
variant #2 (Spectre) and variant #3 (Meltdown) patches were disabled (see the instructions in this article
https://access.redhat.com/articles/3311301).
echo 0 > /sys/kernel/debug/x86/pti_enabled
echo 0 > /sys/kernel/debug/x86/ibrs_enabled
echo 0 > /sys/kernel/debug/x86/ibpb_enabled
About Micron
Micron Technology (Nasdaq: MU) is a world leader in innovative memory solutions. Through our global
brands—Micron, Crucial® and Ballistix®—our broad portfolio of high-performance memory technologies,
including DRAM, NAND and NOR memory, is transforming how the world uses information. Backed by
more than 35 years of technology leadership, Micron's memory solutions enable the world's most
innovative computing, consumer, enterprise storage, data center, mobile, embedded, and automotive
applications. Micron's common stock is traded on the Nasdaq under the MU symbol. To learn more about
Micron Technology, Inc., visit micron.com.
About Red Hat Ceph Storage
Red Hat Ceph Storage is an open, massively scalable storage solution for modern workloads like cloud
infrastructure, data analytics, media repositories, and backup and restore systems. It can:
• Free you from the expensive lock-in of proprietary, hardware-based storage solutions.
• Consolidate labor and storage costs into 1 versatile solution.
• Introduce cost-effective scalability on self-healing clusters based on standard servers and disks.
micron.com ©2018 Micron Technology, Inc. All rights reserved. All information herein is provided on as “AS IS” basis without warranties of any kind, including any implied warranties, warranties of merchantability or warranties of fitness for a particular purpose. Micron, the Micron logo, and all other Micron trademarks are the property of Micron Technology, Inc. All other trademarks are the property of their respective owners. No hardware, software or system can provide absolute security and protection of data under all conditions. Micron assumes no liability for lost, stolen or corrupted data arising from the use of any Micron product, including those products that incorporate any of the mentioned security features. Products are warranted only to meet Micron’s production data sheet specifications. Products, programs and specifications are subject to change without notice. Dates are estimates only. All data and statements within this document were developed by Micron with cooperation of the vendors used. All vendors have reviewed the content for accuracy. Rev. C 09/18 CCM004-676576390-11010