microsaccades in parkinson’s disease
TRANSCRIPT

MICROSACCADES IN PARKINSON’S DISEASE
by
Hailey McInnis
A thesis submitted to the Department of Neuroscience
In conformity with the requirements for
the degree of Master of Science
Queen’s University
Kingston, Ontario, Canada
(January, 2014)
Copyright ©Hailey Arden McInnis, 2014
ii
Abstract
Individuals with Parkinson’s disease (PD) display deficits in voluntary saccade
generation but improved automatic, visually-triggered saccade performance. This can be tested
using prosaccades, saccades to visual stimuli, and antisaccades, saccades in the opposite direction
from the visual stimuli. Voluntary saccade impairments resulting in antisaccade direction errors
and longer saccadic reaction times (SRTs) are thought to be due to insufficient presetting of
neural circuitry during saccade preparation in complex tasks involving suppression and selection.
The basal ganglia, a major site of PD pathology, might be the cause of abnormalities in preparing
for action selection in PD patients. Recently, microsaccade rates have been hypothesized to
reflect the dual preparatory signals of saccade facilitation and suppression. In this thesis, we
investigated the microsaccade behaviour of PD patients as they performed prosaccades and
antisaccades. We hypothesized that deficits in voluntary movements in PD would result in
impaired suppression of involuntary movements as reflected by increased microsaccade rates.
Our findings demonstrate consistently elevated microsaccade rates in PD subjects compared to
age-matched controls. Furthermore, positive correlations were found between antisaccade
direction error rate and microsaccade rate as well as microsaccade rate and Hoehn-Yahr score, an
indicator of disease severity in PD patients. We conclude that microsaccades reflect the impaired
suppression of involuntary movements caused by voluntary movement deficits in PD pathology.
Our findings indicate that microsaccades provide insight into action preparatory mechanisms and
BG dysfunction. Therefore, measuring microsaccades in PD may provide a useful biomarker to
follow disease progression and effectiveness of treatment therapies.

iii
Co-Authorship
This research was conducted by Hailey McInnis under the supervision of Dr. Douglas P.
Munoz and Dr. Giovanna Pari. The experimental paradigm was conceptualized by Dr. Douglas
Munoz and implemented into eye-tracking capability by Don Brien. Dr. Giovanna Pari and
Hailey McInnis recruited subjects with Parkinson’s disease from the Movement Disorders Clinic
at Hotel Dieu Hospital. Hailey McInnis conducted the behavioural experiments, performed data
analysis, and reported the findings in this thesis.

iv
Acknowledgements
Foremost, I would like to sincerely thank Dr. Douglas P. Munoz for welcoming me into
his lab. I am grateful that I had the chance to work under his supervision for my Master’s thesis.
His enthusiastic dedication to his students deepened my own fascination with neuroscience. His
investigative spirit permeates through the entire Munoz lab, resulting in the production of high
quality research. His attention to detail even inspired some imaginative figure colour descriptions,
including “pale beige” and “aggressive salmon”. His sense of humour puts his students at ease
and facilitates their research endeavours.
I was lucky to have the opportunity to collaborate with Dr. Giovanna Pari. The clinical
component of my project was most fascinating and my experience certainly confirmed my
passion for healthcare. I am grateful to have had such a well-rounded and attentive physician
mentor.
I want to recognize the support I received from my lab mates. I am honoured to have
been included in such a rich learning environment. I am appreciative of Don Brien’s guidance
throughout my thesis. He was there at all stages of my project, from his initial explanation of the
eye-tracking technology to the final Matlab coding edits. It’s amazing that he managed to address
my questions despite his busy schedule.
Of course, I would be remiss if I did not acknowledge my beginnings in Dr. Mike Dorris’
lab. My training in electrophysiology under the direction of Dr. Dorris developed my appreciation
for cellular level research. I made lasting friendships in the Dorris lab. My friend Ashley Parr is a
brilliant researcher and a supportive friend. I cannot wait to see the fascinating projects that are in
her future. My friend Jenny Green invited me into her loving family. Her ability to excel in her
family life and in her career is inspirational. Thank you for all the laughs and the memories,
ladies!

v
I am thankful to my housemates, friends, and boyfriend Mark for celebrating my
successes with me and helping me overcome my challenges. Despite the distance, my family was
so encouraging that it felt as though they were with me in Kingston. Of course, my parents Bill
and Wendy would be on the road to Kingston if I needed a visit! Their unconditional love helped
me overcome all obstacles.
To the community members who participated in this work, thank you for dedicating your
time. This research was supported by operating grants from the Canadian Institutes of Health
Research and the Canadian Foundation of Innovation.

vi
Table of Contents
Abstract ............................................................................................................................................ ii
Co-Authorship ................................................................................................................................ iii
Acknowledgements ......................................................................................................................... iv
List of Figures ............................................................................................................................... viii
List of Tables .................................................................................................................................. ix
List of Abbreviations ....................................................................................................................... x
Chapter 1 Introduction ..................................................................................................................... 1
1.1 Clinical features and etiology ................................................................................................ 3
1.2 Saccades: a model of behavioural control ............................................................................. 5
1.3 The oculomotor circuit ........................................................................................................... 6
1.4 Basal ganglia thalamocortical networks ............................................................................... 8
1.5 Pro- vs. antisaccade task: a test for basal ganglia function ................................................ 10
1.6 Eye movements affected by PD ............................................................................................ 13
1.7 Microsaccades ..................................................................................................................... 15
1.8 Role of microsaccades in action preparation ...................................................................... 16
1.9 Thesis objectives .................................................................................................................. 18
Chapter 2 Methods ......................................................................................................................... 20
2.1 Participants .......................................................................................................................... 20
2.2 Eye tracking and visual display ........................................................................................... 23
2.3 Saccade paradigm ................................................................................................................ 23
2.4 Saccade and microsaccade measurement ............................................................................ 24
2.5 Behavioural analysis ............................................................................................................ 25
Chapter 3 Results ........................................................................................................................... 28
3.1 Clinical evaluation and cognitive assessment ..................................................................... 28
3.2 Saccade behaviour ............................................................................................................... 28
3.3 Microsaccade characteristics .............................................................................................. 31
3.4 Microsaccade rates .............................................................................................................. 34
3.5 Correlational analysis ......................................................................................................... 37
Chapter 4 Discussion ..................................................................................................................... 40
4.1 Saccade control abnormalities in PD .................................................................................. 41
4.2 General characteristics of microsaccades ........................................................................... 42
4.3 Microsaccades in PD ........................................................................................................... 44

vii
4.4 The role of the basal ganglia ............................................................................................... 46
4.5 Limitations and future directions ......................................................................................... 48
4.6 Summary and conclusions .................................................................................................... 50
References ...................................................................................................................................... 51

viii
List of Figures
Figure 1.1: The saccadic eye movement system.. ............................................................................ 6
Figure 1.2: Neural structures involved in the basal ganglia control of saccadic eye movements. . 10
Figure 1.3: Schematic of prosaccade and antisaccade tasks.. ........................................................ 11
Figure 1.4: Basal ganglia model during the antisaccade paradigm ................................................ 13
Figure 3.1: Cumulative distributions of saccadic reaction times (SRTs). ...................................... 29
Figure 3.2: Saccade characteristics of PD and control subjects. .................................................... 31
Figure 3.3: Microsaccade main sequences ..................................................................................... 32
Figure 3.4: Rose plots of microsaccade directions for trials with 2000ms fixation periods. ......... 33
Figure 3.5: Rose plots of microsaccade directions for trials with 1000ms fixation periods. ......... 34
Figure 3.6: Time courses of microsaccade rates of PD and control subjects in all trials ............... 35
Figure 3.7: Time courses of microsaccade rates of PD and control subjects in correct trials ........ 36
Figure 3.8: Time courses of microsaccade rates comparing correct and error antisaccade trials .. 37
Figure 3.9: Significant (p<0.05) correlations found in PD subjects and controls .......................... 39

ix
List of Tables
Table 1: Clinical information of PD subjects. ................................................................................ 22
Table 2: R-values for correlations between saccade measurements and cognitive or symptom
assessments. ................................................................................................................................... 38

x
List of Abbreviations
A anticholinergic
AN automatic saccade neuron
ANOVA analysis of variance
BG basal ganglia
CN caudate nucleus
CNS central nervous system
COMT catechol-O-methyl transferase
cVN contralateral saccade-preferred volitional neuron
D1 D1- like dopamine receptors
D2 D2-like dopamine receptors
DA dopamine
DBS deep brain stimulation
DLPFC dorsolateral prefrontal cortex
E entacapone
FEF frontal eye field
fMRI functional magnetic resonance imaging
GABA gamma-aminobutyric acid
GPe globus pallidus, external segment
iVN ipsilateral saccade-preferred volitional neuron
L levodopa
L-CR levodopa controlled-release
LATER linear approach to threshold with ergodic rate
LCD liquid-crystal display
LGN lateral geniculate nucleus

xi
LIP lateral intraparietal area
LSD least significant difference
M amantadine
MAO-B monoamine oxidase B
MoCA Montreal Cognitive Assessment
MPTP 1-methyl-4 phenyl-1,2,3,6-tetrahydropyridine
P pramipexole
PD Parkinson’s disease
R ropinirole
S rasagiline
SC superior colliculus
SD standard deviation
SE standard error
SEF supplementary eye field
SNc substantia nigra pars compacta
SNr substantia nigra pars reticulata
SRT saccadic reaction time
STN subthalamic nucleus
UPDRS United Parkinson’s Disease Rating Scale

1
Chapter 1
Introduction
Parkinson’s Disease (PD) is a neurodegenerative disorder of the central nervous system
(CNS). The core motor symptoms stem from the death of dopaminergic neurons in the substantia
nigra pars compacta (SNc) of the basal ganglia (BG) (Greenfield & Bosanquet, 1953). As in other
neurodegenerative diseases, however, lesions begin developing a considerable time earlier than
the appearance of motor dysfunctions. Initially, lesions occur in the dorsal motor nucleus of the
glossopharyngeal and vagal nerves and the anterior olfactory nucleus (Braak et al., 2003). PD can
also impact sensation and perception, cognition, sleep, and emotional functioning (Davidsdottir et
al., 2005; Jankovic, 2008; Wolters, 2009). Pertinent to this thesis, dopamine depletion in
peripheral visual structures can affect basic visual processes (Harnois & Di Paulo, 1990).
PD affects approximately 50000 people in Canada and more men are affected than
women, at a ratio of 1.8:1. The majority (79%) of individuals living with PD were diagnosed after
the age of 65 (Statistics Canada, 2013). Once a diagnosis is made, medications are prescribed to
alleviate symptoms by increasing dopamine (DA) levels in the brain or directly stimulating DA
receptors to compensate for neurodegeneration. Common medication includes levodopa, which
converts into DA in the CNS, dopamine receptor agonists, and monoamine oxidase B (MAO-B)
inhibitors that prevent the breakdown of DA in the synapse (Rascol et al., 2003). Once drug
therapy is no longer sufficient, surgical treatments such as deep brain stimulation are considered.
Current treatments can reduce symptom severity and increase quality of life but there is at present
no cure for PD.
A diagnosis of PD relies on the clinical presentation of at least 3 of the motor symptoms
of tremor, rigidity, akinesia/bradykinesia and postural instability (Bergman & Deuschl, 2002).
Diagnostic accuracy is complicated by the variable presentation of the disorder along with the

2
similarity of other motor disorders such as essential tremor and progressive supranuclear palsy.
Tremor is common between PD and essential tremor patients although PD patients tend to present
with a resting tremor while essential tremor manifests as an action tremor (Chen & Swope, 2003).
Progressive supranuclear palsy shares common motor symptoms with PD but can be
differentiated due to the presence of postural instability and ophthalmoplegia in the former
disorder (Rehman, 1999). These disorders have a poor response to dopaminergic treatment so
neurologists often wait for a positive treatment response to confirm a PD diagnosis (Calne et al.,
1992). Therefore, the implementation of new screening tools could increase diagnostic accuracy
at initial presentation and expedite appropriate treatment of disorders resembling PD.
Additional screening tools would lessen the reliance on treatment responses because
neurologists and even general practitioners could properly discern PD from other related
disorders upon presentation. A quantitative test could also be used to evaluate the efficacy of
different treatments by comparing test results before and after treatment. The eye movement
system is one system that could provide such a quantitative behavioural test. Furthermore, eye
movements lend themselves to precise, non-invasive measurement and kinematic analysis.
Finally, there is substantial understanding of the neural circuitry controlling the planning and
execution of saccadic eye movements (Leigh & Zee, 1999; Moschovakis et al., 1996; Munoz et
al., 2000; Munoz & Everling 2004).
Eye movements have been shown to be affected in PD patients. The eye movement
circuitry involves the BG and PD pathophysiology results in deficits in visually-guided saccade
suppression. This has been tested using the antisaccade task in which a subject looks away from a
target, specifically to the target’s opposite position. Previously, it has been demonstrated that PD
patients make more direction errors while performing the antisaccade task compared to age-
matched controls (Amador et al., 2006; Briand et al., 1999; Chan et al., 2005). When healthy
controls make errors in this task, it is correlated to significantly higher rates of microsaccades

3
during fixation (Watanabe et al., 2013). These microsaccades can be detected using recent
advances in camera technology and a bifocal lens which captures both eyes simultaneously
(Engbert & Kliegl, 2002).
It has been postulated that microsaccades provide direct insight into volitional action
preparation (Watanabe et al., 2013) and therefore can be used to identify people with deficits in
action preparation. In this thesis, I will record microsaccades in PD subjects as they perform
saccadic tasks. I will investigate whether or not these subjects, who have known deficits in
voluntary action preparation, exhibit greater rates of microsaccades and if these correspond to the
PD subjects’ increased error rate during the antisaccade task. Furthermore, a reduction in
microsaccade suppression in PD patients would lend support to the claim that microsaccades can
be used as an overt measure of voluntary action preparation (Watanabe et al., 2013).
1.1 Clinical features and etiology
Due to the variable presentation of the disease, PD is currently characterized by the
presence of motor symptoms with a slow onset and steady progression in frequency and severity
(Calne, 1992). Considering the extensive list of differential diagnoses, the clinician must also
consider family history of the disorder and the patient’s response to dopaminergic treatment
before ascertaining a diagnosis of PD (Calne, 2005). On initial clinical presentation, the three
cardinal signs of PD are resting tremor, rigidity, and bradykinesia (Samii, 2008).
Resting tremor is the most common presenting sign, with approximately 70% of patients
presenting with tremor at initial consultation (Hughes et al., 1993). The tremor is a rhythmic,
“pill-rolling” movement of the thumb and index finger that normally appears asymmetrically and
at rest. Rigidity presents as increased resistance to passive stretch, clinically assessed through
bilateral manipulations of the wrist and elbow joints (Samii, 2008). It can manifest as increased
tone throughout the motion or “cogwheeling”, a jerky movement similar to a ratchet.
Bradykinesia, akinesia, and hypokinesia are grouped together as the final and often most

4
debilitating of the cardinal signs. Bradykinesia is defined as the slowing of voluntary movements
and the absence of normal associated movements. For example, slow walking and reduced arm
swing is a hallmark of bradykinesia. Akinesia is the absolute poverty of voluntary movements,
such as in facial muscles resulting in a “masked face” expression. Lastly, hypokinesia refers to
the slowness and smallness of movements often manifesting as micrographia (Berardelli et al.,
2001). Some consider postural instability as the fourth cardinal sign; however, it doesn’t usually
appear in the early stages of PD. In fact, postural instability is one of the initial symptoms of
progressive supranuclear palsy, a neurodegenerative disease distinct from PD (Litvan et al.,
1996).
The presence of these cardinal signs can lead to a PD diagnosis; however, performing a
post-mortem autopsy is the only means of confirming the diagnosis (Litvan et al., 2003). The
pathologist looks for dopaminergic cell loss in the SNc and the presence of Lewy-related
pathology in neuronal populations. Lewy bodies, intracytoplasmic, eosinophilic intrusions, and
Lewy neurites, nerve cell processes, both contain the α-synuclein protein as their primary
structural component. The pathogenetic relevance of Lewy bodies in the surviving DA neurons
and other affected regions in the CNS is unclear but their presence has been seen as critical in
making the pathological diagnosis of PD (Warner & Schapira, 2003).
While the neural basis of PD is partially understood, the identity of the neurodegenerative
insult remains unknown. If the initial cause was discovered, the mechanisms for cell death could
be determined. Consequently, neuroprotective treatments could be developed to prevent
neurodegeneration as opposed to our current dopamine replacement treatment options.
Although no exact cause has been pinpointed, several risk factors have been associated
with the development of PD (Priyadarshi et al., 2001). The major risk factor is aging; the majority
of people are diagnosed after the age of 65 (Statistics Canada, 2013). PD is thought to be caused
by an interaction between environmental and genetic factors. MPTP intoxication is a prototypical

5
example of how an exogenous toxin can present as PD (Langston et al., 1983). Other
environmental factors include living in a rural area, drinking well water, farming, and exposure to
pesticides. It is thought that a toxin could cause neurodegeneration through chronic exposure or a
sudden exposure that initiates a deleterious cascade of events.
The results from genetic studies have provided insight into possibilities of the underlying
pathogenesis of the disease. Synuclein deposition, mitochondrial dysfunction, or disorders of
autophagy might all play a role in the development of PD (Jenner et al., 2013). Of course, the
heterogeneity within PD and related disorders means that finding one causal agent is unlikely. It
is possible that different forms of PD have different pathogenesis. If so, more specific categories
under the PD umbrella should be implemented to distinguish PD-like disorders from idiopathic
PD. With the knowledge of the underlying cause of the symptoms, more specific treatment can be
developed.
1.2 Saccades: a model of behavioural control
Saccades are quick, conjugate eye movements that move the foveae to a location in the
visual field (Collewijn et al., 1988; Westheimer, 1954). Saccades are a valuable behavioural
output for studying motor control because they can be either sensory-guided or volitionally-
directed. Sensory-guided saccades are directed to a stimulus that appears in the environment
(Guiton et al., 1985; Pierrot-Deseilligny et al., 1991; Schiller et al., 1987). For instance, a
visually-guided saccade may be triggered after a sudden motion is detected in the visual field. In
contrast, volitionally-directed saccades are eye movements initiated by an internal goal of the
individual (Gaymard et al., 1998; Hikosaka et al., 2000). For example, a diligent worker
suppresses the instinct to look at visual distractors and, instead, produces volitionally-directed
saccades necessary for performing his/her work.
The saccadic eye movement system is commonly used as a model for studying cognitive
function for several reasons (Leigh & Zee, 1999; Moschovakis et al., 1996; Munoz et al., 2000).

6
The eyes are rotated by the actions of only three orthogonal pairs of extraocular muscles.
Furthermore, eye movement control circuitry does not have to compensate for variable loads and
inertia present in larger skeletal muscle systems (Jones & Dejong, 1971). This circuitry is readily
accessible to microelectrodes, facilitating electrophysiological recordings in awake, behaving
non-human primates (Sparks, 2002). Since the entire circuit exists within the cranium, researchers
can record from different neuronal components efficiently. The circuit’s simplistic computational
design and its accessibility to microelectrodes result in a well-understood sensory-to-motor
transformation. The saccadic eye movement system can be easily measured in behavioural studies
with the use of video-based eye tracking technology.
1.3 The oculomotor circuit
Regions in the cerebral cortex, basal ganglia, thalamus, superior colliculus (SC),
brainstem, and cerebellum contribute to the production and flexible control of saccades (Fig. 1.1)
(Leigh & Zee, 1999; Moschovakis et al., 1996; Pierrot-Deseilligny et al., 1991; Scudder et al.,
2002). The consolidation of findings from lesion studies, behavioural testing, functional
Figure 1.1: The saccadic eye movement system. Adapted from Munoz & Everling (2004).

7
neuroimaging, and primate neurophysiology has resulted in a well-understood sensory-to-motor
transformation. This considerable body of knowledge makes the eye movement system a useful
model for investigations into the function of the involved brain areas (Coe et al., 2002; Dias &
Segraves, 1999; Guitton et al., 1985; Munoz & Everling, 2004).
Visual information enters the oculomotor circuit through the retina. The signal travels to
the lateral geniculate nucleus (LGN) of the thalamus and to the visual cortex via the retino-
geniculo-cortical pathway. The visual cortex projects to regions in the parietal cortex and the
frontal cortex. Each cortical area, along with the retina itself via the retinotectal pathway,
projects directly to the superior colliculus.
Frontal cortical regions involved in oculomotor functioning include the frontal eye field
(FEF), the supplementary eye field (SEF), and the dorsolateral prefrontal cortex (DLPFC). The
FEF is active during voluntary saccade execution. (Pierrot-Deseilligny et al., 1991; Dias &
Segraves, 1999; Rivaud et al., 1994; Sommer & Tehovnik, 1997). The SEF performs roles of
saccade sequencing and internally guided decision-making (Coe et al., 2002). Finally, the DLPFC
is important for executive function and suppressing visually-guided saccade responses (Guitton et
al., 1985; Pierrot-Deseilligny et al., 1991). Overall, these frontal cortical areas signal the motor
output regions to execute voluntary saccades.
Importantly, the frontal cortical oculomotor areas also project to the caudate nucleus
(CN) of the BG. The BG as a whole act as an action selector by modulating signals from the
frontal cortex (Watanabe & Munoz, 2011). The BG exert a strong, tonic inhibition and promote
certain signals via disinhibition (Hikosaka et al., 2000). Additionally, the BG exert control over
the brainstem motor networks through projection to the SC from the substantia nigra pars
reticulata (Snr) (Hikosaka & Wurtz, 1983; Hikosaka et al., 2000; Jiang et al., 2003; Niijima &
Yoshida, 1982). The SC is a key station for saccade control, with retinal visual inputs mapped
onto its superficial layer (Schiller & Stryker, 1972). Its intermediate layer possesses a motor

8
function (Sparks, 1986). With both sensory and motor functionalities, the SC can respond to
visual signals and generate a saccade command to the reticular formation in the brainstem
(Chimoto et al., 1996; Rodgers et al., 2006). Auditory and somatosensory information also
converge onto the intermediate layer of the SC, triggering eye movements to non-visual stimuli
(Munoz, 2002; Russo & Bruce, 1994; Stein & Meredith, 1993). Therefore, saccades can either be
volitionally-generated, driven by internal goals and involving the frontal cortical areas, or
triggered by salient stimuli in the environment. The role of the basal ganglia is to promote the
appropriate action among these competing motor commands.
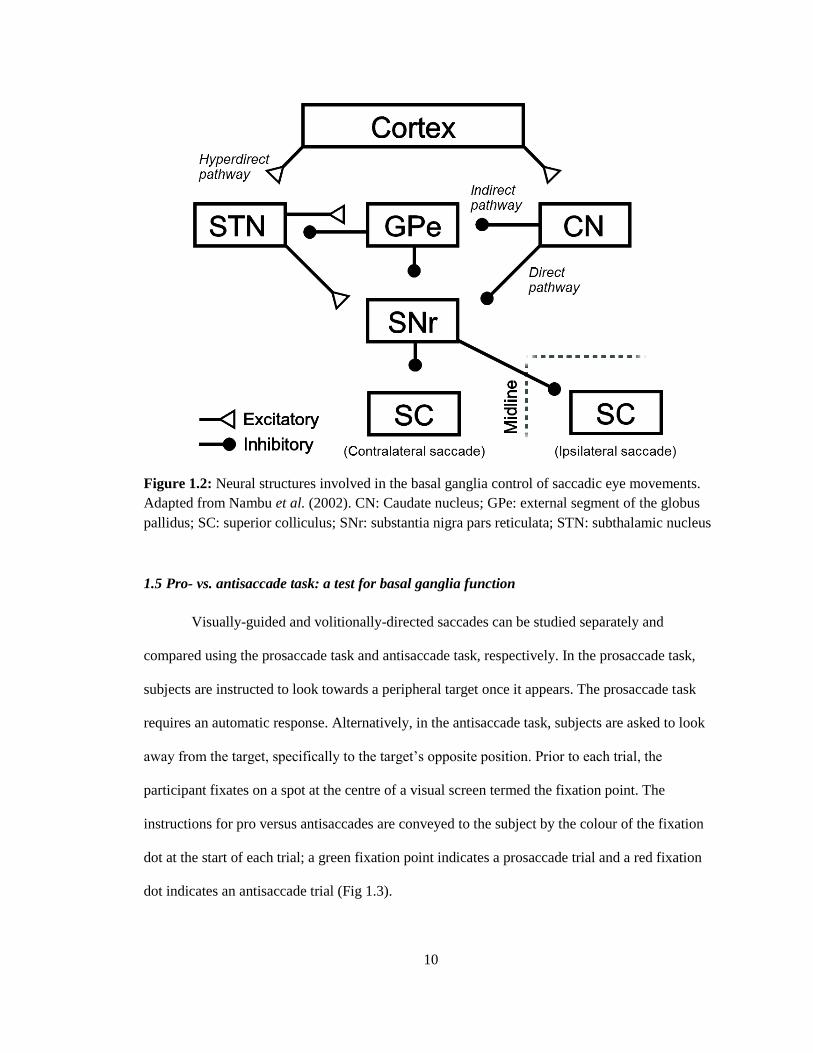
1.4 Basal ganglia thalamocortical networks
Along with the BG’s control over brainstem motor networks, the BG contain different
pathways to modulate incoming signals from the cortex (Fig. 1.2). The CN in the striatum
receives input from cortical areas and the thalamus (Hikosaka et al., 2000). It sends GABAergic
projections directly to the SNr and indirectly through the external component of the globus
pallidus (GPe). The GPe also communicates reciprocally with the subthalamic nucleus (STN)
(Watanabe & Munoz, 2011). Via the direct pathway, the CN transiently inhibits the SNr, which
reduces the tonic inhibition on the thalamus and excites the cortex (Hikosaka et al., 2000). The
indirect pathway is so named because it involves additional structures: the GPe and STN.
Through the indirect pathway, increased activity of the striatum results in increased activity in the
SNr. The indirect pathway results in inhibition of the thalamus and less excitation of the cortex
(Takakusaki et al., 2004). Therefore, the BG’s role as an action selector is facilitated by the
versatility offered by the antagonistic effects of the direct and indirect pathways.
A third pathway, known as the hyperdirect pathway, bypasses the striatum and connects
the cortex directly to the STN (Hartmann-von Monakow et al., 1978; Nambu et al., 2000). This
pathway provides shorter conduction times compared to signals through the direct and indirect

9
pathways. The hyperdirect pathway exerts powerful excitatory effects that activate the STN and,
as a result, inhibit the thalamus and cortex (Nambu et al., 2002).
The SNc plays an important role by projecting dopaminergic neurons into the striatum.
Dopamine has different effects depending on the receptor it binds to (Hikosaka et al., 2000).
Neurons projecting to the SNr, the direct pathway, express D1-type receptors so DA binding will
be excitatory. Neurons projecting to the GPe, the indirect pathway, express D2-type receptors so
DA binding will be inhibitory. Since the actions of the direct and indirect pathways on the output
of the basal ganglia are antagonistic, these different influences of the nigrostriatal dopaminergic
neurons produce the same effect: a decrease in the inhibitory outflow of the BG and so greater
cortical excitability (Gerfen et al., 1990). In PD, dopamine depletion causes the dominance of the
indirect pathway over the direct pathway, resulting in suppression of saccade initiation (Watanabe
& Munoz, 2011).
It has been hypothesized that the direct, indirect, and hyperdirect pathways work in
sequence in order to facilitate selection of a preferred motor plan. During the preparatory activity
for a voluntary limb movement, a signal is transmitted through the hyperdirect pathway to
suppress activity in the cortical and thalamic networks. Secondly, a signal from the direct
pathway inhibits pallidal neurons in the SNr, which alleviates inhibition only on the selected
motor plan. Finally, a signal travels through the indirect pathway to re-activate the SNr’s
inhibition on the thalamus. This sequential information processing encourages the initiation and
execution of only the selected motor plan with the appropriate timing (Nambu et al., 2002).
10
1.5 Pro- vs. antisaccade task: a test for basal ganglia function
Visually-guided and volitionally-directed saccades can be studied separately and
compared using the prosaccade task and antisaccade task, respectively. In the prosaccade task,
subjects are instructed to look towards a peripheral target once it appears. The prosaccade task
requires an automatic response. Alternatively, in the antisaccade task, subjects are asked to look
away from the target, specifically to the target’s opposite position. Prior to each trial, the
participant fixates on a spot at the centre of a visual screen termed the fixation point. The
instructions for pro versus antisaccades are conveyed to the subject by the colour of the fixation
dot at the start of each trial; a green fixation point indicates a prosaccade trial and a red fixation
dot indicates an antisaccade trial (Fig 1.3).
Figure 1.2: Neural structures involved in the basal ganglia control of saccadic eye movements.
Adapted from Nambu et al. (2002). CN: Caudate nucleus; GPe: external segment of the globus
pallidus; SC: superior colliculus; SNr: substantia nigra pars reticulata; STN: subthalamic nucleus

11
Compared to prosaccades, the antisaccade motor plan takes longer to develop because a
vector inversion is necessary to transform the representation of the visual stimulus location into
an appropriate motor command. Therefore, the antisaccade task requires at least two additional
processes: 1) the inhibition of the automatic, visually-guided saccade and 2) the generation of a
volitionally-guided saccade (Munoz & Everling, 2004).
A quantitative model that describes this neuronal mechanism and predicts behaviour has
only recently been proposed (Noorani & Carpenter, 2013). This model extrapolates upon the
linear approach to threshold with ergodic rate (LATER) model of decision-making. An action is
triggered once the decision signal reaches the threshold, the timing of which depends on a
variable rate of rise (Carpenter & Williams, 1995). In order to account for the suppression of the
visually-guided saccade, a LATER unit was added that cancels impending responses upon
reaching threshold. This “stop” unit has been used successfully to model reaction time
distributions and incidence of error trials in countermanding tasks, which require a subject to
cancel responses if a “stop” signal is presented (Logan et al., 1984). Therefore, the qualitative
model for the antisaccade tasks involves three LATER units: two units (Pro and Anti) triggering
Figure 1.3: Schematic of prosaccade and antisaccade tasks. During the fixation period, a fixation
dot is displayed on the screen, the colour of which indicates the task type. The fixation dot
disappears and, simultaneously, a grey target dot appears either on the left or the right of the
previously visible fixation dot. Correct saccadic eye movements are depicted by black arrows in
the schematic.

12
saccades in opposite directions and a “stop” unit to suppress the Pro unit (Noorani & Carpenter,
2013). The parameters for Pro and Anti units are identical while the directional inversion in the
antisaccade is accounted for by a 50ms delay (Zhang & Barash, 2000).
Recently, neurophysiological recordings in behaving monkeys have identified three
groups of putative projection neurons within the CN with roles in prosaccade and antisaccade
control (Watanabe & Munoz, 2009). The first neuronal group is comprised of automatic saccade
neurons (ANs), which generate sensory-driven saccades towards the stimulus via the direct
pathway. In the antisaccade paradigm, this would facilitate a direction error saccade. The other
two groups have greater activity prior to antisaccade initiation compared with prosaccade
initiation. Both groups generate volitional saccades and are differentiated by their preferred
directions and, correspondingly, their roles. The contralateral saccade-preferred volitional
neurons (cVNs) facilitate correct antisaccades via the direct pathway. The conflict between the
sensory-driven neurons and contralateral-preferred volitional neurons is resolved by a group of
ipsilateral-preferred volitional neurons (iVNs). This group inputs on the SNr via the indirect
pathway and suppresses direction error saccades. This model for an antisaccade paradigm is
depicted in Fig. 1.4 (Watanabe & Munoz, 2011). This proposed model is substantiated by the
LATER model (see above). Further investigation into the neuronal subsets within the CN could
add insight into the determination of whether these neurons correspond to the units outlined by
the LATER model.

13
1.6 Eye movements affected by PD
It is well-established that saccadic eye movement abnormalities are found in clinical
groups, including PD patients (Amador et al. ̧2006; Briand et al.¸1999; Cameron et al., 2010;
Cameron et al., 2012; Chan et al., 2005; Hood et al., 2007; Rivaud-Perchoux et al., 2007).
Hypometric saccade amplitudes are often reported despite normal saccadic velocity and
amplitude relationships (Jones et al, 1971; Teräväinen & Calne, 1980). The major difference
between PD and control subjects in eye movement performance is seen during antisaccade tasks.
Antisaccade tasks (Fig. 1.3B) require subjects to make saccades away from visual targets (Hallett,
1978). Antisaccades are considered voluntary eye movements due to the requirements of
Figure 1.4: Basal ganglia model during the antisaccade paradigm (Watanabe & Munoz, 2011).
ANs generate sensory-driven saccades towards the stimulus via the direct pathway. cVNs
facilitate correct antisaccades via the direct pathway. The conflict is resolved by iVNs, which
input on the SNr via the indirect pathway and suppress direction error saccades. AN: automatic
(sensory-driven) neuron; BS: brainstem; CN: caudate nucleus; cVN: contralateral volitional
neurons; D1: d1-like dopamine receptors; D2: D2-like dopamine receptors; GPe: external
segment of the globus pallidus; iVN: ipsilateral volitional neurons; SC: superior colliculus; SNr:
substantia nigra pars reticulate; STN: subthalamic nucleus

14
suppressing the automatic response to look at the visual stimulus and generating a voluntary
movement in the opposite direction (Munoz & Everling, 2004). When the antisaccade task was
applied to PD patients, it was determined that PD patients make more direction errors than control
subjects (Briand et al., 1999; Chan et al., 2005). On correct antisaccade trials, PD patients had
longer saccadic reaction times (SRTs) (Amador et al., 2006; Cameron et al.¸2012; Chan et al.,
2005). These results align with the voluntary movement deficiencies that characterize PD.
Interestingly, PD patients are generally found to exhibit normal or even superior saccadic
performance when prosaccades, saccades towards visual targets, are required (Briand et al.,
1999). Previous studies have reported slightly faster SRTs in prosaccades for PD subjects
compared to controls (Briand et al., 1999; Cameron et al., 2012; Chan et al., 2005; Roll et al.,
1996). PD subjects also demonstrated increased proportions of express saccades (SRT of 90-
140ms) (Cameron et al., 2012; Chan et al., 2005).
Considering the important, modulating role that the basal ganglia plays in saccadic eye
movement control, it is not surprising that PD patients exhibit abnormalities in eye movement
tasks. In normal physiological conditions, the action of DA in the SNc increases the excitation of
the frontal cortex (Gerfen et al., 1990). Dopamine promotes the voluntary saccade command to
the motor output regions and suppresses involuntary saccades. In terms of the behavioural task,
this would facilitate correct antisaccades.
In PD, the death of dopaminergic neurons in the SNc disrupts the prefrontal- basal
ganglia circuitry resulting in deficits in voluntary saccade initiation as demonstrated by increased
direction errors and slower SRTs in the antisaccade task in PD patients (Briand et al., 1999;
Amador et al., 2006; Chan et al., 2005). Superior prosaccade performance of PD patients
indicates deficits in automatic response suppression (Chan et al., 2005; Middleton & Strick,
2002). These effects can be attenuated through the administration of levodopa to PD patients;

15
SRT in the prosaccade task is increased and direction error rate in the antisaccade task is reduced
(Hood et al., 2007).
Therefore, dopamine depletion in PD causes an imbalance between voluntary and
involuntary movement. Impaired antisaccade performance coupled by enhanced prosaccade
performance indicates reduced regulatory inhibition on visually-guided saccades. It is also
possible that the neural networks in the PD brain have adapted in response to the basal ganglia’s
dysfunction. Because PD patients are slow to initiate voluntary movements, the brain may have
reduced baseline response inhibition so as to promote all motor commands. In the oculomotor
circuitry, this adaptive mechanism can be detected because structures such as the SC can be relied
upon due to their direct visual-to-motor mapping. In order to determine the neural mechanisms
underlying PD saccade abnormalities, we will focus on how PD subjects prepare for upcoming
actions. Based on hypoactivation in the CN and cortical eye fields, it has been hypothesized that
PD patients make antisaccade direction errors due to improper presetting towards the appropriate
voluntary action (Cameron et al., 2012). We will investigate action preparation in PD subjects
through the measurement of microsaccades made during fixation.
1.7 Microsaccades
Microsaccades are small amplitude, ballistic fixational eye movements that occur at a rate
of 1-2 per second (Engbert & Kliegl, 2002; Martinez-Conde et al., 2013). Microsaccades are
made involuntarily, but can be voluntarily suppressed without training (Bridgeman & Palca,
1980). Along with tremor and drift, microsaccades counteract retinal adaptation by displacing the
retinal image during stationary viewing (Riggs et al., 1953). Microsaccades restore faded vision
during fixation for both foveal and peripheral targets (Martinez-Conde et al., 2006; McCamy et
al., 2012). Other functions include fixation error correction (Otero-Millan et al., 2011) and spatial
resolution improvement during high-acuity tasks (Donner & Hemilä, 2007; Ko et al., 2010).

16
Saccades and microsaccades both perform important roles in vision. Furthermore, recent
studies have found a temporal connection between fixational saccade occurrence and saccade
initiation (Rolfs et al., 2006). Peripheral stimulus presentation induces a general decrease in the
microsaccade frequency with a signature rise in rate occurring at approximately 350 ms after
stimulus appearance (Engbert & Kliegl, 2002; Rolfs et al., 2006). The functional similarities and
temporal relationships between saccades and microsaccades suggest that they share a common
generator and might even exist on the same continuum (Martinez-Conde et al., 2013; Otero-
Millan et al., 2008).
In addition to their visual functions, microsaccades might reflect covert processes.
Previous work has determined that microsaccades can reflect covert attentional states through
their role in visual information processing (Engbert & Kliegl, 2002). Recently, Watanabe et al.
(2013) has hypothesized that microsaccades reflect preparatory processes occurring prior to
saccade execution. Voluntary saccade initiation requires the adoption of an appropriate task set, a
rule about how to behave (Cameron et al., 2012). It is possible that microsaccades can provide an
overt measurement of the brain’s presetting mechanisms.
1.8 Role of microsaccades in action preparation
In order for our behaviour to be predictive rather than reactive, voluntary actions are
preceded by preparatory processes. These preparatory processes are regulated by networks in the
cerebral cortex and the basal ganglia, and ready neural circuits based on environmental cues and
internally-derived goals (Nachev et al., 2008). Voluntary action preparation cannot be measured
directly; however, cognitive models and neural recordings have provided inferential evidence into
the existence of these processes.
As non-human primates prepare eye movements that indicate their choice between
stimuli, FEF neurons associated with both stimuli increase their firing rates. Over time, cells
associated with a preferred stimulus increase or maintain their activity whereas cells associated

17
with the non-preferrred stimulus decrease their activity (Schall, 2002; Thompson et al., 1996).
Since this build-up occurs whether or not a saccade is ultimately made, the activity is not likely
part of the eye movement itself but rather it reflects a preparatory selection process (Thompson et
al., 1996). Furthermore, the growth of firing rates predicts reaction time with fast responses
associated to rapid rises in activity (Smith & Ratcliff, 2004). Using fMRI, preparatory processing
in the FEF was found to be greater in activation for correct antisaccade trials compared to
direction error trials (Cameron et al., 2012).
Voluntary saccades, such as antisaccades, rely on sufficient presetting of a network of
cortical regions and sub-cortical regions in preparation for saccade execution (Munoz & Everling,
2004). Without this presetting activity to favour volitional motor plans, it follows that there would
be an increase in direction error rates in the antisaccade task. This behaviour is seen in PD,
prompting investigations into the effects of BG pathophysiology on preparatory processing
(Watanabe & Munoz, 2009; Watanabe & Munoz, 2010; Watanabe & Munoz, 2011). Cameron et
al. (2012) observed hypo-activation of fMRI activation signals in motor areas involved in
antisaccade generation during the preparatory stages of the saccadic response in PD. Since the
frontal cortical regions are influenced by BG output, it is possible that BG pathophysiology in PD
is responsible for this difference (Alexander et al., 1986; Gerfen et al., 1990).
The studies mentioned previously have relied on neural recordings, fMRI, and cognitive
models to provide insight into covert preparatory processes. It has been hypothesized, however,
that voluntary action preparation can be measured overtly by means of microsaccades. In order to
determine the relationship between microsaccades and voluntary action preparation, Watanabe et
al. (2013) measured microsaccades while participants performed prosaccade and antisaccade
tasks. The prosaccade task is simply visually-guided whereas antisaccade task requires the
suppression of a visually-guided saccade toward the stimulus and the facilitation of a voluntary
saccade away from the stimulus. It was demonstrated that microsaccade occurrence was

18
suppressed by an antisaccade instruction, though this suppression was diminished when subjects
made direction errors. This evidence led to the conclusion that the dual preparatory signals
necessary for sufficient presetting prior to antisaccade execution can be read-out overtly by
measuring microsaccades. In this thesis, I will test whether microsaccades can be used as an overt
measurement of covert preparatory signals in PD.
1.9 Thesis objectives
The main objectives of this thesis are as follows. Firstly, eye movement abnormalities in
PD found in previous studies will be verified. Specifically, I predict that PD subjects will exhibit
slower SRTs and a greater percentage of direction errors in antisaccade tasks, faster SRTs and a
greater percentage of express saccades in prosaccade tasks, and hypometric saccade amplitudes in
comparison to controls (Amador et al.¸ 2006; Briand et al.¸1999; Cameron et al., 2010; Cameron
et al., 2012; Chan et al., 2005; Hood et al., 2007; Rivaud-Perchoux et al., 2007). Secondly,
microsaccade behaviour will be investigated in order to determine if there are differences
between PD and control subjects. It has been previously concluded that microsaccade activity
reflects the covert preparatory processing necessary for antisaccade execution (Watanabe et al.,
2013). I hypothesize that microsaccade rates will be increased in PD, reflecting deficits in
preparatory activity which correlate with poorer performance in the antisaccade task.
Finally, I will correlate error rate in the antisaccade task and microsaccade behaviour to
measures of symptom severity and cognitive impairment. I anticipate that error rate will be
positively correlated with symptom severity, as shown previously (Amador et al., 2006). The
progression of PD is due to further death of dopaminergic neurons resulting in difficulties
initiating volitional movements, including volitional eye movements such as antisaccades. Also,
error rate should be positively correlated with microsaccade rate. Microsaccade rate is suppressed
by antisacccade instruction; however, this suppression is diminished prior to error trials
(Watanabe et al., 2013). I hypothesize that microsaccade rate will be positively correlated with

19
symptom severity. It has been suggested that microsaccades are mediated by the basal ganglia,
specifically, the caudate nucleus (Watanabe et al., 2013). Since PD involves the deterioration of
the dopaminergic nigro-striatal system, it follows that disease advancement would result in
abnormalities in microsaccade control.
Ultimately, I aim to investigate the relationship between microsaccades and preparatory
activity by analysing microsaccade behaviour in PD. Deficits in antisaccade preparatory
processes in PD subjects have recently been identified using fMRI (Cameron et al., 2012). I seek
to determine if these deficits are reflected in microsaccade behaviour. My thesis will support the
role of microsaccades as a direct and non-invasive measurement of preparatory activity.
20
Chapter 2
Methods
2.1 Participants
All procedures were approved by the Human Research Ethics Board at Queen’s
University. All participants provided written informed consent and were compensated for their
participation ($20).
For this study, 23 patients with PD (mean age = 66.4 years, SD ± 9 years) were recruited
from the Movement Disorder Clinic at Kingston General Hospital. All patients were diagnosed
with PD by neurologist Dr. G. Pari from the clinical presentation of at least 2 of the 4 major
motor symptoms that characterize PD: tremor, akinesia/bradykinesia, rigidity, and postural
instability. PD participants did not interrupt their medications for the study due to the fact that
antisaccade deficits are present even while taking dopaminergic medications (Cameron et al.,
2012; Hood et al., 2007). Nineteen of 23 participants were taking levodopa, 10 of which were
additionally taking the controlled-release levodopa. 6 participants were taking a MAO-B
inhibitor: 2 were taking rasagiline and 4 were taking amantadine. 4 participants were taking
ropinirole and 15 participants were taking pramiprexole; both medications are dopamine receptor
agonists. 3 participants were taking the COMT inhibitor entacapone. Lastly, one subject (PD
Subject 13 from Table 1) had undergone deep brain stimulation. The mean levodopa equivalent
dose was 705 mg (SD ± 510 mg) and the mean duration of symptoms was 76 months (SD ± 61
months). Dr. G. Pari conducted the United Parkinson’s Disease Rating Scale (UPDRS) Parts I
and II with each PD participant. The PD subjects self-assessed their activities of daily life for Part
II and their motor symptoms were evaluated for Part III. In addition, Dr. G. Pari provided a
disease severity score based on the modified Hoehn and Yahr staging (Fahn & Elton, 1987; Goetz
et al., 2004). The PD participant group had a mean UPDRS part II score of 11 (SD ± 5) and part

21
III score of 30 (SD ± 13). PD subjects were considered mild/moderate stage based on a mean
Hoehn and Yahr score of 2.4 (SD ± 0.6). Clinical data and participant demographics are shown in
Table 1.
For purposes of comparison to the PD subject group, data from 19 age-matched controls
(mean age = 68.6 years, SD ± 7 years) were also collected. These subjects were spouses or friends
of the PD participants or community members who responded to print advertisements. The
control group did not differ significantly from the patient group in terms of age or years of
education (Table 1).
Participants were tested without corrective lenses; however, all participants confirmed
that the visual stimuli were easily visible. Participants with co-morbid neurological, psychiatric,
or ophthalmic conditions, such as macular degeneration or cataracts, were excluded. Finally, the
Montreal Cognitive Assessment (MoCA) was used as an evaluation of mental status. Although a
score of 26 or higher is considered cognitively normal, a cut-off score of 24 was chosen due to
the simplicity of the task instructions. Every subject corrected their errors by making a secondary
saccade to the correct location, which confirmed their understanding.

22
A: anticholinergic; DBS: deep brain stimulation; E: entacapone; Eq.: equivalent; L: levodopa; L-CR: levodopa controlled-release; M: amantadine;
mg: milligrams; Mo.: months; MoCA: Montreal Cognitive Assessment; P: pramipexole; R: ropinirole; S: rasagiline; SD: standard deviation;
UPDRS; United Parkinson’s Disease Rating Scale
Table 1: Clinical information of PD subjects.

23
2.2 Eye tracking and visual display
Using a video-based binocular eye tracker (Eyelink 1000; SR Research Ltd.), horizontal
and vertical gaze data were collected from each eye at a sampling rate of 500 Hz. A high-speed
camera and infrared illuminator were mounted on the desk in front of the participant and used to
track the pupils. The subject’s head was stabilized with chin and forehead rest bars. The display
screen was adjusted so the top of the display screen was aligned with the centre of the pupillary
plane, as recommended in the Eyelink manual.
Eye-tracking experiments were completed in a darkened room located in Kingston
General Hospital for all subjects except one control subject, for which the eye-tracking apparatus
was set-up in their home. Stimuli were presented on a 17-in LCD monitor placed 58.5 cm from
the subject’s eyes. Calibration and validation were completed using a 9-point grid, immediately
before each trial block. Data was collected as each participant performed the 3 trial blocks.
Participants were encouraged to rest between the blocks.
2.3 Saccade paradigm
The experimental procedure is summarized in Fig. 1.3. Each trial began with the
appearance of a green or red fixation point in the centre of the screen. After a fixation period of
1000ms or 2000ms, the fixation point disappeared with the simultaneous appearance of an
eccentric white target at 10° horizontally to the left or right of centre. The visual stimuli were
circles of 0.5˚ diameter presented on a black background. A photometer was used to measure and
equalize the luminosity of the red, green, and white stimuli. Participants were instructed to look at
the eccentric target if the fixation point was green (prosaccade) and look away from the eccentric
target if the fixation point was red (antisaccade). The eccentric target appeared randomly on the
left or right in equal proportions for prosaccade and antisaccade trials.

24
Participants performed 3 trial blocks each consisting of 120 trials. The first two blocks
consisted of pseudo-randomized trials, with 30 prosaccade/left target, 30 prosaccade/right target,
30 antisaccade/left target, and 30 antisaccade/right target trials. The task type (prosaccade or
antisaccade) and target location (left or right) were randomly interleaved. The first block had a
fixation point duration of 1000ms and the second block had a fixation point duration of 2000ms.
In the third trial block, the fixation point duration alternated from 1000ms to 2000ms in blocks of
ten trials and only prosaccades were used. The target’s location (left or right) was still pseudo-
randomized. Results from the third trial block were only incorporated in the correlational analyses
in order to increase the statistical power of the microsaccade rate calculations. Due to calibration
issues, PD Subject 12 did not complete the third trial block so only results from the first two trial
blocks were used in the rate calculations for this subject.
2.4 Saccade and microsaccade measurement
Saccade measurement relied on the eye position data, which was differentiated to
produce instantaneous horizontal and vertical velocities. The baseline velocity was calculated by
averaging the changes in displacement over time with an upper cutoff of 50°/sec. The mean
baseline velocity represented the mean fixation velocity. The mean fixation velocity plus 1.5
times its standard deviation was used as the threshold velocity for saccade detection. Finally, the
velocity had to remain above that threshold for 5 sample points for it to be considered a saccade.
This approach ensured that noise causing spikes in velocity were not detected as saccades. SRT
was calculated from the time that the peripheral target appeared to when the threshold velocity for
saccade detection was held for at least 5 sample points
Microsaccades were detected using an algorithm similar to that of Martinez-Conde and
colleagues (Martinez-Conde et al., 2000). The eye position data were differentiated to produce
instantaneous horizontal and vertical velocities. We then used two threshold values during the
fixation period to determine when the eyes were stationary and when they were making a
25
microsaccade. In order to be considered a microsaccade, the instantaneous eye direction could not
change more than 15o (threshold 1) and the instantaneous eye speed was at least 8
o/sec (threshold
2). The speed threshold was chosen such that it gave the best main sequence as described by
Zuber and colleagues (1965). Finally, a microsaccade was defined as a sequence in which the eye
moved for a period of at least 6 sample points. From the eye movement data, the onset and
termination of all microsaccades was calculated, along with the peak velocity, magnitude, and
direction. An amplitude between 0.2-2° was necessary to be considered a microsaccade in order
to exclude noise but include larger amplitude microsaccades (Brien et al., 2009; Watanabe et al.,
2013).
2.5 Behavioural analysis
Analysis of behavioural data was completed using custom-made scripts in Matlab v8.0
(The MathWorks Inc., Natick, MA, USA). No differences were seen across rightward and
leftward saccade trials; therefore all trials were pooled together. Correct trials were separated
from incorrect trials on the basis of direction errors and anticipatory errors. The trial was marked
as a direction error trial if a saccade was made to the visual target in the antisaccade task or to the
location opposite to the target in the prosaccade task. Trials in which a participant made a
direction error in the prosaccade or antisaccade task are known as error prosaccade trials and
error antisaccade trials, respectively. Anticipatory errors have SRTs less than 90ms, which is
faster than the conduction time of the shortest neural pathway from the retina to the eye muscles
(Fischer & Boch, 1983). Trials in which subjects failed to respond were excluded from analysis.
Express saccades were defined as saccades with SRTs between 90-140ms, consistent
with previous research (Chan et al., 2005). An independent t-test was conducted to analyze
express saccades in prosaccade trials. Express saccades in antisaccade trials were not analyzed
because they cannot be generated due to the physiological pathways involved in this more
complex task (Everling et al., 1998). Cumulative SRT distributions were analyzed using a two-

26
sample non-parametric Kolmogorov-Smirnov test. Similarly to the saccade characteristics, the
probability distributions shown are the average distributions of each subject pool.
Mean values of saccade characteristics were determined by finding the mean values of
each participant and then calculating the mean for each subject group from these values. Using
SPSS Statistics v20 (IBM, Chicago, IL, USA), 2x2 repeated measures analysis of variance
(ANOVA) tests were performed on these means (mean SRT, mean amplitude, and percentage of
direction errors). The variables used were Group with two levels (PD, controls) and Task with
two levels (prosaccade, antisaccade).
The main sequence plots of microsaccades were fitted to a linear regression because it
has been shown previously that peak velocities of microsaccades increase linearly with the log of
their amplitudes but the relationship approaches linearity at low amplitudes (Otero-Millan et al.,
2008; Watanabe et al., 2013; Zuber et al., 1965). Then, a one-way ANOVA was performed to test
for significant differences between the slopes of the fitted regression lines. Microsaccade
directions were plotted in circular histograms termed rose plots. These plots were constructed by
first calculating the percentage of microsaccades within each direction bin. The plots display the
average percentage of each bin for the subject group. A Wilcoxon Rank Sum Test was used to
analyze differences in the distributions of angles. The rose plots indicate microsaccade directions
during fixation from 400ms until target appearance.
Microsaccade rate diagrams were plotted based on the mean microsaccade rates of
subject groups calculated from the individual subject means. Differences in rates were analyzed
using the Wilcoxon Rank Sum Test at every millisecond. The greyscale colour bar indicates
levels of significance from p = 0.20 and below (e.g. Figs. 3.6 and 3.7).
Correlational analyses were conducted using the eye movement parameters of error rate
on antisaccade trials and microsaccade rates in all three trial blocks. Data from the third trial
block of prosaccades only was used in order to increase the statistical power of the analyses.

27
Microsaccade rate was calculated based on the final 400ms of fixation until target appearance.
Linear regression analysis was conducted using Microsoft Excel 2010 v14.0 (Microsoft,
Redmond, WA, USA).

28
Chapter 3
Results
3.1 Clinical evaluation and cognitive assessment
All of the 23 patients recruited for this study underwent a clinical evaluation of symptoms
with a neurologist. Scores from the UPDRS Parts I and II, the Hoehn-Yahr scale, and medications
for each participant can be found in Table 1. Most patients (17 of 19) fell within the range of 2.0-
3.0 on the Hoehn-Yahr staging which indicates mild to moderate bilateral disability. The
remaining two patients scored 1.5 and 4.0, corresponding to unilateral involvement and severe
disability, respectively. All participants were cognitively evaluated using the MoCA. Mean
MoCA scores, age, and years of education did not differ significantly between PD and control
groups.
3.2 Saccade behaviour
Saccade behavior was analyzed to verify that previous eye movement abnormalities
found in PD were reproduced in the current investigation. Cumulative SRT distributions were
analyzed using the non-parametric Kolmogorov-Smirnov test to determine if quantitative
differences in SRT distributions exist between PD and control subjects in prosaccade and
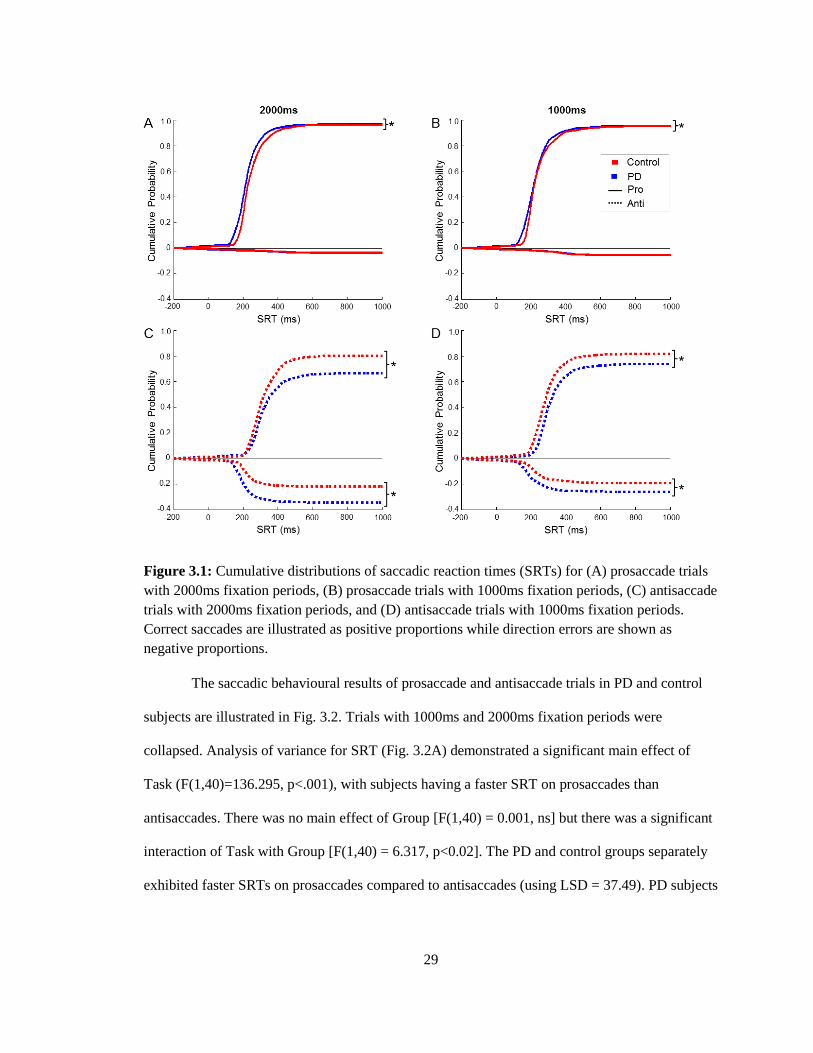
antisaccade tasks (Fig. 3.1). Significant differences were found in SRT distributions between PD
and control subjects for trials with 2000ms fixation periods (Fig. 3.1A + C) and 1000ms fixation
periods (Fig. 3.1B + D). For 2000ms, differences were found in correct prosaccades (K = 0.1429,
p < .001), correct antisaccades (K = 0.0785, p = .0109), and incorrect antisaccades (K = 0.2592, p
< .001). Similarly for 1000ms, differences were found in correct prosaccades (K = 0.1266, p <
.001), correct antisaccades (K = 0.1669, p < .001), and incorrect antisaccades (K = 0.2411, p <
.001).
29
Figure 3.1: Cumulative distributions of saccadic reaction times (SRTs) for (A) prosaccade trials
with 2000ms fixation periods, (B) prosaccade trials with 1000ms fixation periods, (C) antisaccade
trials with 2000ms fixation periods, and (D) antisaccade trials with 1000ms fixation periods.
Correct saccades are illustrated as positive proportions while direction errors are shown as
negative proportions.
The saccadic behavioural results of prosaccade and antisaccade trials in PD and control
subjects are illustrated in Fig. 3.2. Trials with 1000ms and 2000ms fixation periods were
collapsed. Analysis of variance for SRT (Fig. 3.2A) demonstrated a significant main effect of
Task (F(1,40)=136.295, p<.001), with subjects having a faster SRT on prosaccades than
antisaccades. There was no main effect of Group [F(1,40) = 0.001, ns] but there was a significant
interaction of Task with Group [F(1,40) = 6.317, p<0.02]. The PD and control groups separately
exhibited faster SRTs on prosaccades compared to antisaccades (using LSD = 37.49). PD subjects

30
tended towards faster SRT in prosaccade trials and slower SRT in antisaccade trials compared to
controls but these differences were not significant.
The express saccade epoch was defined as 90-140ms, consistent with previous literature
(Chan et al., 2005) (Fig. 3.2B). An independent t-test revealed that the PD group made a
significantly greater proportion of express saccades on prosaccade trials compared to controls
(t(23)= -2.817, p=.01).
Analysis of variance of direction errors (Fig. 3.2C) showed a main effect of Task
(F(1,40)=61.117, p<.001) but no main effect of Group (F(1,40)=3.758, ns). There was a
significant interaction of Task with Group (F(1,40)=4.704, p<0.05). Both PD and control groups
separately had a higher error percentage on the antisaccade task compared to the prosaccade task.
There was no significant difference in error rate between groups on the prosaccade task; however,
PD subjects had a higher error rate compared to controls in the antisaccade task. Direction errors
were also compared between 1000ms and 2000ms fixation duration antisaccade trials for PD and
control groups. There was a main effect of Group (F(1,40)=4.222, p<.05), as expected, but also a
main effect of Fixation Duration (F(1,40)=8.070, p<.01) indicating that both PD and control
groups make more direction errors in 2000ms antisaccade trials compared to 1000ms trials. There
was no significant interaction of Fixation Duration with Group (F(1,40)=3.010, ns).
For saccadic amplitude (Fig. 3.2D), analysis of variance demonstrated a significant main
effect of Group (F(1,40)=9.072, p<.01) with PD subjects producing hypometric saccadic
amplitudes compared to controls, as shown previously (Jones & Dejong, 1971). However, there
was no main effect of Task (F(1,40)=1.424, ns).

31
3.3 Microsaccade characteristics
Advancements in eye movement detection technology have permitted the recording of
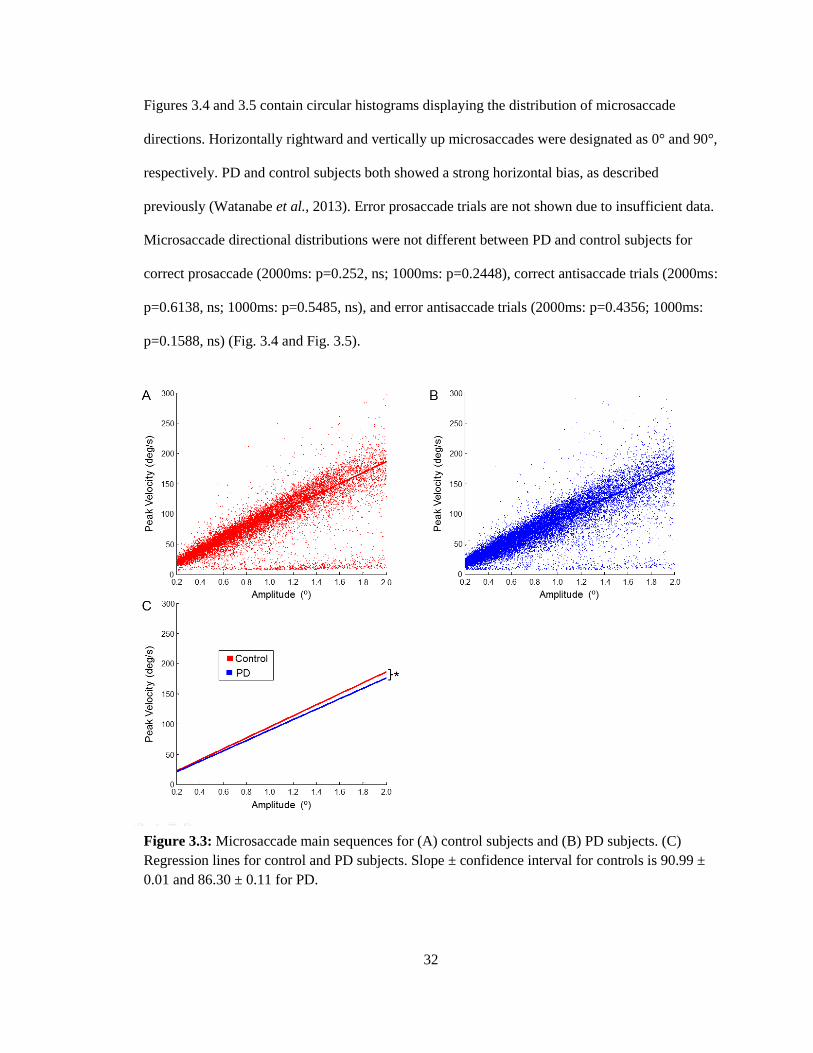
microsaccades during fixational periods of eye movement tasks. Microsaccade main sequences
for PD and control subjects are shown in Figure 3.3. Consistent with previous studies, the peak
velocities increased linearly with their amplitudes (Watanabe et al. ̧2013; Zuber et al., 1965;
Otero-Millan et al., 2008). There was a slight but significant difference between the slopes of PD
(86.30 ± 0.11) and control subjects (90.99 ± 0.01) (F(1,35825)= 123.94, p<.001), indicating that
PD microsaccades have a lower peak velocity than control microsaccades per saccade amplitude.
Figure 3.2: Saccade characteristics of PD and control subjects for prosaccades and antisaccades.
(A) Mean saccadic reaction time (SRT) on correct trials. (B) Mean percentage of express
saccades (90-140ms) on correct trials. (C) Mean percentage of direction errors on antisaccade
trials. (D) Mean saccadic amplitude on correct trials. Targets were 10° from the fixation point.
Error bars represent the standard error of the mean (SE). Results from trials with 1000ms and
2000ms fixation periods were collapsed.
32
Figures 3.4 and 3.5 contain circular histograms displaying the distribution of microsaccade
directions. Horizontally rightward and vertically up microsaccades were designated as 0° and 90°,
respectively. PD and control subjects both showed a strong horizontal bias, as described
previously (Watanabe et al., 2013). Error prosaccade trials are not shown due to insufficient data.
Microsaccade directional distributions were not different between PD and control subjects for
correct prosaccade (2000ms: p=0.252, ns; 1000ms: p=0.2448), correct antisaccade trials (2000ms:
p=0.6138, ns; 1000ms: p=0.5485, ns), and error antisaccade trials (2000ms: p=0.4356; 1000ms:
p=0.1588, ns) (Fig. 3.4 and Fig. 3.5).
Figure 3.3: Microsaccade main sequences for (A) control subjects and (B) PD subjects. (C)
Regression lines for control and PD subjects. Slope ± confidence interval for controls is 90.99 ±
0.01 and 86.30 ± 0.11 for PD.

33
Figure 3.4: Rose plots (circular histograms) of microsaccade directions for trials with 2000ms
fixation periods. Comparison of PD and control subjects for microsaccades preceding (A) correct
prosaccade trials, (B) correct antisaccade trials, and (C) error antisaccade trials. Proportions of
microsaccades during the fixational epoch of 400ms until target appearance are displayed in 50
bins of direction.

34
3.4 Microsaccade rates
The temporal dynamics of microsaccade occurrence during the fixation period is
displayed in Figs. 3.6, 3.7 and 3.8. Figure 3.6 compares PD and control microsaccade rates for all
trials separately for 1000ms and 2000ms fixation periods. In the trials with 1000ms fixation
periods, the microsaccade rates of PD subjects only diverted from controls around 600ms prior to
target appearance. However, rates were consistently higher in PD subjects compared to controls
in trials with 2000ms fixation periods (Fig. 3.6A).
Figure 3.5: Rose plots (circular histograms) of microsaccade directions for trials with 1000ms
fixation periods. Comparison of PD and control subjects for microsaccades preceding (A) correct
prosaccade trials, (B) correct antisaccade trials, and (C) error antisaccade trials. Proportions of
microsaccades during the fixational epoch of 400ms until target appearance are displayed in 50
bins of direction.

35
Figure 3.7 includes only correct trials and separates prosaccade trials from antisaccade
trials for 2000ms and 1000ms fixation periods. As in Figure 3.6B, the microsaccade rate of PD
subjects was higher than controls around 600ms to target appearance in the trials with 1000ms
fixation periods (Fig. 3.7B + D). The microsaccade rate for PD subjects also remains higher in
correct prosaccades for 100ms after target appearance (Fig. 3.7B). In trials with 2000ms fixation
periods, the microsaccade rate was consistently higher in PD subjects compared to controls. This
trend was most apparent in the range of 1600ms to 1000ms until target appearance for correct
prosaccades and 1600ms to 1400ms until target appearance for correct antisaccades.
Figure 3.6: Time courses of microsaccade rates of PD and control subjects in (A) all trials with
2000ms fixation periods, (B) all trials with 1000ms fixation periods. The greyscale colour bar
indicates microseconds at which microsaccade rates are divergent with varying levels of
significance(p ≤ 0.20).

36
In Fig. 3.8, microsaccade rates for error antisaccade trials are compared to correct
antisaccade trials separately with 2000ms and 1000ms fixation periods for PD and control
subjects. This comparison was completed based on a study by Watanabe et al. (2013) which
demonstrated a higher rate of microsaccades prior to error trials compared to correct trials.
Despite these previous findings, our analysis did not show consistent results.
Figure 3.7: Time courses of microsaccade rates of PD and control subjects in (A) correct
prosaccade trials with 2000ms fixation periods, (B) correct prosaccade trials with 1000ms
fixation periods, (C) correct antisaccade trials with 2000ms fixation periods, (D) correct
antisaccade trials with 1000ms fixation periods. The greyscale colour bar indicates microseconds
at which microsaccade rates are divergent with varying levels of significance(p ≤ 0.20).

37
3.5 Correlational analysis
Correlational analyses were conducted in order to determine if significant relationships
exist between saccadic measurements and cognitive test scores or symptom assessment scores.
Error rate on the antisaccade task was positively correlated with Hoehn-Yahr scores (r(23)=0.599,
p=.0025) and UPDRS scores (r(23)=0.510, p=.013) (Figs. 3.9A + B). This result indicates that
deficiencies in behavioural control might result from advanced disease. Correlational analysis
between error rate and microsaccade rate was completed in order to determine if preparatory
activity levels, measured by microsaccade rate, are related to deficits in behavioural control (error
Figure 3.8: Time courses of microsaccade rates comparing correct and error antisaccade trials in
(A) trials with 2000ms fixation periods (control subjects), (B) trials with 1000ms fixation periods
(control subjects), (C) trials with 2000ms fixation periods (control subjects), (D) trials with
1000ms fixation periods (PD subjects). The greyscale colour bar indicates microseconds at which
microsaccade rates are divergent with varying levels of significance (p ≤ 0.20).

38
rate). Error rate was positively correlated to microsaccade rate for PD subjects (r(23)=0.464,
p=.026) but not for control subjects (r(19)=0.101, ns).
Correlational analyses with microsaccade rate was completed to add insight into what
could be affecting microsaccade rate. Microsaccade rate was negatively correlated with MoCA
scores for PD subjects (r(23)= -0.480, p=.020), but not control subjects (r(19)=0.379, ns) (Fig.
3.9D). Therefore, PD subjects with low MoCA scores had higher rates of microsaccades but, in
contrast, MoCA scores did not have an effect on microsaccade rate in control subjects.
Furthermore, microsaccade rate was positively correlated to Hoehn-Yahr scores (r(23)=0.418,
p=.047) (Fig. 3.9E) suggesting that microsaccade rate, like error rate, might be affected by
advanced disease. Finally, there was a significant negative correlation between MoCA scores and
UPDRS (r(23)=0.475, p=.022) (not reported in Table 2). Lower MoCA scores may be associated
with more advanced disease as measured by the UPDRS due to the cognitive decline associated
with PD (Amador et al., 2006).
Significant correlations are bolded in red for control subjects (none found) and blue for PD
subjects. MoCA: Montreal Cognitive Assessment; UPDRS: United Parkinson’s Diagnostic
Rating Scale
Table 2: R-values for correlations between saccade measurements and cognitive or symptom
assessments.

39

40
Chapter 4
Discussion
The objective of this study was to investigate microsaccade behaviour in PD subjects
using the prosaccade and antisaccade tasks. Our hypothesis was that PD subjects would have
elevated microsaccade rates, reflecting deficits in preparatory activity in terms of impaired
advanced saccade suppression and correlating with poorer performance in the antisaccade task.
The PD subject group exhibited the same eye movement abnormalities that are routinely observed
in PD: a greater percentage of direction errors in the antisaccade task, a greater percentage of
express saccades in prosaccade trials, and hypometric saccade amplitudes compared to controls
(Amador et al. ̧2006; Briand et al.¸1999; Cameron et al., 2010; Cameron et al., 2012; Chan et al.,
2005; Hood et al., 2007; Rivaud-Perchoux et al., 2007). We also examined the spatial distribution
of microsaccades and the temporal modulation of microsaccade rate during the instructed fixation
period prior to stimulus appearance. We found that microsaccades were primarily horizontal in
direction and the rate of microsaccade occurrence decreased over time from the start of fixation to
target onset, as reported in Watanabe et al., 2013. The rate of microsaccades tended to be higher
in PD compared to controls, especially in the 2000ms fixation period (Fig. 3.6). Importantly, we
correlated the error rate and microsaccade rate to measures of disease symptom severity and
cognitive impairment. The results indicated that error rate on the antisaccade task was positively
correlated with symptom severity. Error rate was also positively correlated to microsaccade rate
in PD subjects, which indicates that a lack of suppression of microsaccades corresponds to
increased error rate. The positive correlation between microsaccade rate and Hoehn-Yahr score
suggests that PD pathology affects microsaccade suppression. Ultimately, these results indicate
that diminished preparatory activity in PD as previously determined through the use of fMRI can
also be observed by means of microsaccade measurement. Microsaccades reflect preparatory

41
activity by indicating deficits in advanced saccade suppression. Their non-invasive measurement
provides a promising alternative to scanning in the study of preparatory activity in humans.
4.1 Saccade control abnormalities in PD
The antisaccade deficits we observed in PD in the current study were similar to those
described previously (Amador et al.¸ 2006; Briand et al.¸1999; Cameron et al., 2010; Cameron et
al., 2012; Chan et al., 2005; Hood et al., 2007; Rivaud-Perchoux et al., 2007). PD subjects
performed a greater number of direction errors in the antisaccade task (Fig. 3.2C). Direction error
rate on the antisaccade task was found to be positively correlated to Hoehn-Yahr and UPDRS
scores (Table 2; Fig. 3.9A + B) but not correlated to MoCA scores (Table 2). PD subjects tended
to have slower SRTs in correct antisaccade trials (Fig. 3.1C + D; Fig. 3.2A) whereas previous
studies found significant results (Amador et al., 2006; Briand et al., 1999; Chan et al., 2005).
These results indicate that PD subjects have impaired control over voluntary movement.
Significant positive correlations between error rate and measures of disease progression suggest
that PD pathology is responsible for voluntary saccade deficits.
In contrast, PD subjects exhibited superior performance in the prosaccade task. PD
subjects only tended towards faster SRTs in prosaccade trials in this investigation (Fig. 3.2A) but
several studies have replicated this result, which suggests slight enhancement in PD subjects
(Briand et al., 1999; Cameron et al., 2012; Chan et al., 2005; Roll et al., 1996). Other previous
findings support the result of superior performance of PD subjects in visually-guided tasks. PD
subjects off their medications executed fewer direction errors in prosaccade trials compared to
controls (Cameron et al., 2012) and PD subjects had shorter SRTs on a reflexive visual-
orientating task (Briand et al., 2001).
Impaired antisaccade performance coupled with enhanced prosaccade performance
indicates an imbalance between voluntary and involuntary movement in PD. This trade-off is
apparent in the visual tasks described above, as well as in other cognitive tests. In the Stroop task,

42
subjects are presented with colour or neutral words and must verbally identify the font colour. PD
subjects performed poorly due to difficulty with suppressing the reflexive response to read the
words (Henik et al., 1993). A model by Sereno and Holzman (1995) suggests that the impairment
of the voluntary saccadic system results in the enhancement of the involuntary saccade system.
The model proposes that voluntary saccades and involuntary saccades are controlled by two
separate attentional systems, and the voluntary eye movement system tonically inhibits the
involuntary system. Although this “tonic inhibition” model originally accounted for eye
movements in schizophrenia, it fits the saccadic eye movement abnormalities commonly
observed in PD (Chan et al., 2005). The disinhibition of involuntary movement may serve an
adaptive purpose. PD neural circuitry may compensate for the slow initiation of voluntary
movement by reducing saccadic response inhibition.
4.2 General characteristics of microsaccades
Before comparing microsaccade results between PD subjects and controls, it is prudent to
examine the general characteristics of microsaccades. Like saccades, microsaccades are binocular
and conjugate (Ditchburn & Ginsborg, 1953; Krauskopf et al., 1960; Lord, 1951). The main
sequence of microsaccades (Fig. 3.3) depicts a velocity-amplitude relationship consistent with
saccade main sequences, as shown previously (Otero-Millan et al., 2008; Watanabe et al., 2013;
Zuber et al., 1965).
The similarity of physical and functional properties between saccades and microsaccades
indicate that they likely share a common generator (Martinez-Conde et al., 2013; Otero-Millan et
al., 2008). Indeed, a continuous representation of saccade directions and amplitudes exists in the
SC with the smallest amplitude saccades represented in the rostral pole (Munoz & Wurtz, 1993;
Robinson, 1972). Inactivation of the rostral SC results in decreased microsaccade rates (Hafed et
al., 2009). Equivalent microsaccade activity has also been found in all brainstem neural

43
populations associated with saccades except for inhibitory burst neurons, which have yet to be
investigated for connections to microsaccades (Martinez-Conde et al., 2013).
The temporal relationship between saccades and microsaccades also suggest a common
generator (Hafed & Ignaschchenkova, 2013). Microsaccade occurrence before stimulus
appearance prolonged pro- and antisaccade reaction times, possibly due to competitive
interactions between different saccade commands (Rolfs et al., 2006; Watanabe et al., 2013).
Microsaccade rates must decline prior to saccades execution so saccades are not delayed and the
task is completed efficiently. It is possible that the mechanism that facilitates saccade initiation
completes this role by suppressing microsaccades.
If microsaccade rates only reflected saccade facilitation, microsaccade rates prior to
prosaccades should be lower than rates preceding antisaccade trials considering the faster SRTs in
the prosaccade task. Instead, microsaccade rates were shown previously to be lower prior to
correct antisaccade trials than correct prosaccade trials (Watanabe et al., 2013). Therefore,
microsaccades might also be reflecting saccade suppression mechanisms. Correct antisaccade
performance requires the suppression of automatic visually-triggered saccades (Munoz &
Everling, 2004) and this process is reflected in the lower microsaccade rates preceding
antisaccades. Higher microsaccade rates were also found prior to error antisaccade trials
compared to correct antisaccade trials (Watanabe et al., 2013) demonstrating that a lack of
saccade suppression, as reflected in increased microsaccade rates, results in a direction error. In
the current study, we did not reproduce this result (Fig. 3.8) due to several methodological
differences such as using older adults as opposed to healthy, young adults. However, error
antisaccade rates were positively correlated with microsaccade rates in PD subjects (Table 2; Fig.
3.9C).
Microsaccade rates were higher prior to prosaccades compared to antisaccades and prior
to error trials compared to correct trials, suggesting that microsaccades not only reflect saccade

44
facilitation but also saccade suppression. Because saccades and microsaccades likely share a
common generator (Otaro-Millan et al., 2008), it is possible that microsaccade output during
fixation provides insight into the mechanisms responsible for saccade preparation.
4.3 Microsaccades in PD
The slope of the main sequence of PD microsaccades was significantly lower than that of
control subjects (Fig. 3.3). Hypometric amplitudes were found in PD saccadic eye movements
(Fig. 3.2D) (Jones & Dejong, 1971) so it is likely that microsaccades exhibit the same deficit,
especially if microsaccades and saccades exist on a continuum with a common generator. No
differences were found in microsaccade distribution between PD and controls (Fig. 3.4)
indicating that the same spatial areas are being sampled by each group. Microsaccades trigger
spike rate increases in the primary visual cortex and the lateral geniculate nucleus (Martinez-
Conde et al., 2000; Martinez-Conde et al., 2002). By evoking transient responses in visual
neurons, microsaccades create illusory motion in a static pattern thereby increasing visibility
(Otero-Millan et al., 2012). Indeed, this discrete sampling strategy could be superior to smooth
visual scanning for information processing (Martinez-Conde et al., 2000). The primarily
horizontal distribution of microsaccades may indicate the location of subjects’ covert attention to
the two possible target locations in this task. The location of covert attention might bias the
direction of microsaccades due to extensive overlap between attention control and saccade
generation neural circuitry (Corbetta et al., 1998; Engbert & Kliegl, 2003; Hafed & Clark, 2002).
Figure 3.6 demonstrates the same overall trend of microsaccade occurrence over time for
PD subjects and controls. As stated in the previous section, microsaccades are suppressed as the
time of target appearance approaches presumably to optimize the saccade control system for the
upcoming eye movement. While the average microsaccade rate of PD subjects tended to be
higher compared to controls in trials with 1000ms fixation periods, the difference was significant
in the trials with 2000ms fixation periods. Therefore, PD subjects exhibit diminished suppression

45
of microsaccades, a deficiency highlighted by a longer fixation period. It might be that the
1000ms trial block does not provide enough time during fixation for the infrequent incidence of
microsaccades to significantly differ between groups.
One could reason that the enhanced discrepancy between PD and control microsaccade
rates in the 2000ms fixation duration trial block is explainable by an increased error rate in the
2000ms fixation duration block compared to the 1000ms block. Watanabe et al. (2013)
demonstrated that microsaccade rates were increased prior to error trials compared to correct
trials. As seen in Figure 3.1, more errors were made in the 2000ms fixation duration trial block
compared to the 1000ms block. As expected, PD subjects made more errors than controls but
there was no significant interaction. Because PD and control groups both increased their direction
error rates in the 2000ms trial block, the enhanced discrepancy between group microsaccade rates
cannot be explained by an increased difference in error rate.
Although microsaccade rates between correct and error antisaccade trials did not differ
significantly, a positive correlation was found between microsaccade rate and antisaccade error
rate for PD subjects (Table 2 + Fig. 3.9C). This suggests that PD subjects who made more
microsaccades had a greater error rate even though the microsaccade rate did not differentiate
prior to correct and error trials. Microsaccade rate was also negatively correlated to MoCA score
for PD subjects only, which is likely due to the cognitive deficits associated with PD (Amador et
al., 2006; Dubois & Pillon, 1996; Gill et al., 2008). Indeed, a positive correlation was found
between microsaccade rate and Hoehn-Yahr score (Table 2; Fig. 3.9E)
Separating correct trials by task demonstrated higher microsaccade rates for PD subjects
versus controls in both prosaccades and antisaccades (Fig. 3.7). The diminished rate of decline of
microsaccade rate in PD subjects indicates that the mechanism that suppresses microsaccades is
operating abnormally regardless of task.

46
4.4 The role of the basal ganglia
The prosaccade and antisaccade tasks are routinely used to test flexible control over
behaviour (Everling & Fischer, 1998; Hallett, 1978). The prosaccade task is visually-guided
because the stimulus location matches the saccade goal. In contrast, the antisaccade task
decouples the stimulus location and saccade goal (Munoz & Everling, 2004). In the case of the
antisaccade task, the frequent incidence of direction errors (Fig. 3.2B) and differences in SRT
distribution (Fig. 3.1) indicate that there are two incompatible motor plans in competition
(Everling & Fischer, 1998; Munoz & Everling, 2004).
The anatomical pathways within the BG support its role as an action selector (Watanabe
& Munoz, 2009; Watanabe & Munoz, 2011). Neurons within the CN of the BG receive input
from frontal cortical regions and give rise to the direct and indirect pathways through their
GABAergic projections to the SNr and GPe, respectively. The direct pathway results in a
disinhibition of the SC whereas the indirect pathway inhibits the SC (Hikosaka et al., 2000;
Parent & Hazrati, 1994; Smith et al., 1998). The counteracting effects of these pathways permit
the modulation of SC activation thereby exerting control over the initiation of saccadic eye
movements.
Cortical signals encoding visually-guided responses and volitional responses input into
the CN (Alexander et al., 1986; Hikosaka et al., 2000). Since only one action can be produced,
the BG modulates the incoming signals to generate the desired response. The antisaccade task is
commonly used to test BG function due to the conflict presented between motor plans encoding
visually-guided responses (direction errors) and voluntary responses (correct antisaccades)
(Briand et al., 1999; Munoz & Everling, 2004; Watanabe & Munoz, 2009).
It has been recently suggested that 3 groups of neurons within the CN perform this
conflict resolution task (Watanabe & Munoz, 2009). Cortical signals encoding the visually-
guided response trigger activity within CN sensory-driven neurons, which would generate a

47
direction error in the antisaccade task. Cortical signals encoding the volitional antisaccade
response trigger activity in two groups of volitional neurons in the CN. Contralateral saccade-
preferred volitional neurons generate the correct antisaccade response, which requires additional
time to invert the visual stimulus saccade vector into the appropriate motor command hence the
slower SRT in correct antisaccade trials compared to correct prosaccade trials (Fig. 3.2A) (Munoz
& Everling, 2004). The remaining group of CN neurons, ipsilateral saccade-preferred volitional
neurons, resolves the conflict between the previous groups by suppressing direction error
saccades via the indirect pathway. Because the antisaccade motor plan requires more time to
generate, the prosaccade motor plan must be suppressed while the antisaccade motor plan is
generated in order to perform a correct antisaccade. A lack of suppression of the prosaccade
motor plan results in a direction error. This architecture matches the model proposed by Noorani
& Carpenter (2013), which accounts precisely for the SRT distributions and error responses found
in subjects performing the antisaccade task.
Along with cortical inputs, the CN also receives input from the SNc. The SNc decreases
the inhibitory outflow of the BG by facilitating the direct pathway and inhibiting the indirect
pathway (Albin et al., 1989; Delong, 1990; Gerfen et al., 1990). In PD, dopaminergic neuronal
death in the SNc results in a dominance of the indirect pathway over the direct pathway (Kravitz
et al., 2010; Watanabe & Munoz, 2011). Diminished BG output results in less excitation of the
cortex so volitional motor plans are not facilitated. Dopamine depletion explains the deficits in
visually-guided saccade suppression observed in PD. Indeed, administering levodopa to PD
subjects increases SRT in the prosaccade task and reduces error rate in the antisaccade task (Hood
et al., 2007).
If microsaccades reflect action preparatory processes, it follows that the BG would be
involved. While the specific mechanism that triggers microsaccades is currently unknown,
several models place the SC in a centralized role (Hafed et al., 2009; Otero-Millan et al., 2011;

48
Rolfs et al., 2008). SC fluctuations that trigger microsaccades are attributed to neural noise and
fixation error (Otero-Millan et al., 2011). Higher rates of microsaccades in PD subjects compared
to controls suggest that the BG can induce microsaccades. The BG is a major input into the SC,
sending GABAergic projections to the SC’s intermediate layer (Fig. 1.1) (Hikosaka & Wurtz,
1983; Mohler & Wurtz, 1976; Sparks, 1986). The activity within the direct and indirect pathways
during fixation reflects preparatory mechanisms of saccade facilitation and suppression,
respectively. These signals could cause the fluctuations in the SC which result in changes in
microsaccade rates.
Indeed, errors in antisaccade trials do not originate in the motor execution of the
voluntary eye movement. Rather, the CN and select cortical areas exhibit hypoactivation during
the preparatory phase (Cameron et al. ̧2012). PD subjects were less efficient at establishing a
voluntary task set in networks controlling voluntary movement. Therefore, sufficient action
preparation is crucial to voluntary saccade performance. We suggest that the higher microsaccade
rates observed in PD patients correspond to deficits in task set establishment and provide an overt
measure of saccade preparatory processes (Watanabe et al., 2013).
4.5 Limitations and future directions
There are several limitations associated with recruiting eligible participants from an
elderly clinical population such as PD. At advanced age, it is challenging to find subjects who are
cognitively normal without ophthalamic conditions. In the current study, the MoCA cut-off score
was lowered below cognitively normal acceptability at the risk of confounding the results in order
to include more participants. Although a score of 26 or higher is considered cognitively normal,
individuals with scores of 24 to 26 were included for analysis. Importantly, every subject
corrected their errors by making a secondary saccade to the correct location, which confirmed
their understanding. PD participants were not asked to interrupt their medications because eye
movement abnormalities are observable while participants are on medications (Cameron et al.,

49
2012; Hood et al., 2007). However, testing PD participants off-medication has been shown to
enhance PD saccadic abnormalities and alter fMRI activation patterns (Cameron et al., 2012). It is
possible that microsaccade rates would be increased if PD subjects interrupted their medications
prior to behavioural testing. PD itself sets its own challenges on finding significant results. PD
subject groups show increased intra-subject variability (Chan et al., 2005) compared to control
groups.
This study provides preliminary results connecting microsaccade occurrence with BG
dysfunction. Expanding this investigation to other major patient centres will increase the sample
size and overcome the limitations of recruitment and intra-subject variability listed above. Eye-
trackers are now being placed in several hospitals in Ontario to capture more PD patients using
this study’s behavioural paradigm. Furthermore, the portability of the eye-tracker will permit the
participation of PD patients who live remotely.
Behavioural studies that include larger sample sizes and at-risk populations would
increase the statistical significance of our microsaccade results. Probing microsaccades in other
disorders involving BG dysfunction with known saccade abnormalities, such as Huntington’s
Disease (Lasker et al., 1987; Leigh et al., 1983) and Progressive Supranuclear Palsy (Pierrot-
Deseilligny et al., 1989) would add insight to the BG’s role in microsaccade suppression.
Neurophysiological recordings from BG nuclei in parkinsonian monkeys could help target the
specific nucleus triggering microsaccades. Overall, future research into microsaccade rates will
determine whether microsaccades adequately reflect action preparation. If so, microsaccades can
be a non-invasive measurement of cognitive mechanisms such as task set preparation and
decision making. Clinically, microsaccades may be used as a potential biomarker to detect BG
dysfunction.

50
4.6 Summary and conclusions
The results of this study indicate that PD subjects have increased microsaccade rates
compared to controls during saccadic preparation. Higher microsaccade rates were correlated to
increased error rates on the antisaccade task and higher Hoehn-Yahr scores indicating disease
severity. Our results support the hypothesis that microsaccades can be used as a non-invasive
measure of action preparation in terms of saccade facilitation and suppression (Watanabe et al.,
2013). To our knowledge, this study is the first to investigate the effect of BG dysfunction on
microsaccades in the PD population. We have demonstrated that the BG plays a pivotal role in
the generation and suppression of microsaccades. Future studies are required to identify the
specific neural correlates within the BG that give rise to microsaccades. Overall, microsaccades
have the potential to be useful overt measurements of action preparation and BG dysfunction in
clinical populations.

51
References
Albin, R. L., Young, A. B., & Penney, J. B. (1989). The functional anatomy of basal ganglia
disorders. Trends in neurosciences, 12(10), 366-375.
Alexander, G. E., DeLong, M. R., & Strick, P. L. (1986). Parallel organization of functionally
segregated circuits linking basal ganglia and cortex. Annual review of neuroscience, 9(1),
357-381.
Amador, S. C., Hood, A. J., Schiess, M. C., Izor, R., & Sereno, A. B. (2006). Dissociating
cognitive deficits involved in voluntary eye movement dysfunctions in Parkinson’s
disease patients. Neuropsychologia, 44, 1475-1482.
Berardelli, A., Rothwell, J. C., Thompson, P. D., & Hallett, M. (2001). Pathophysiology of
bradykinesia in Parkinson’s disease. Brain, 124, 2131-2146.
Bergman, H. & Deuschl, G. (2002). Pathophysiology of Parkinson’s disease: from clinical
neurology to basic neuroscience and back. Movement Disorders, 17(S3), S28-S40.
Braak, H., Tredici, K. D., Rüb, U., de Vos, R. A. & Jansen Steur E.N. & Braak, E. (2003).
Staging of brain pathology related to sporadic Parkinson’s disease. Neurobiology of
Aging. 24, 197-211.
Briand, K. A., Hening, W., Poizner, H., & Sereno, A. B. (2001). Automatic orienting of
visuospatial attention in Parkinson's disease. Neuropsychologia, 39(11), 1240-1249.
Briand, K. A., Strallow, D., Hening, W., Poizner, H., & Sereno, A. B. (1999). Control of
voluntary and reflexive saccades in Parkinson’s disease. Experimental Brain Research,
129(1), 38-48.
Bridgeman, B. & Palca, J. (1980). The role of microsaccades in high acuity observational tasks.
Vision Research, 20, 813-817.
Brien, D. C., Corneil, B. D., Fecteau, J. H., Bell, A. H., & Munoz, D. P. (2009). The behavioral
and neurophysiological modulation of microsaccades in monkeys. Journal of Eye
Movement Research, 3, 1-12.
Calne, D. (2005). A definition of Parkinson’s disease. Parkinsonism & Related Disorders, 11
(S1), S39-S40.
Calne, D. B., Snow, B. J., & Lee, C. (1992). Criteria for diagnosing Parkinson’s disease. Annals
of Neurology, 32 (S1), S125-S127.
Cameron, I. G. M., Pari, G., Alahyane, N., Brien, D. C., Coe, B. C., Stroman, P. W., et al. (2012).
Impaired executive function signals in motor brain regions in Parkinson’s disease.
Neuroimage, 60(2), 1156-1170.

52
Cameron, I. G., Watanabe, M., Pari, G., & Munoz, D. P. (2010). Executive impairment in
Parkinson's disease: response automaticity and task switching. Neuropsychologia, 48(7),
1948-1957.
Carpenter, R. H. & Williams, M. L. (1995). Neural computation of log likelihood in control of
saccadic eye movements. Nature, 377, 59-62.
Chan, F., Armstrong, I. T., Pari, G., Riopelle, R. J., & Munoz, D. P. (2005). Deficits in saccadic
eye-movement control in Parkinson’s disease. Neuropsychologia, 43(5), 784-796.
Chen, J. J. & Swope, D. M. (2003). Essential Tremor: Diagnosis and Treatment.
Pharmacotherapy: The Journal of Human Pharmacology and Drug Therapy. 23(9),
1105-1122.
Chimoto, S., Iwamoto, Y., Shimazu, H., & Yoshida, K. (1996) Functional connectivity of the
superior colliculus with saccade-related brain stem neurons in the cat. Progress in Brain
Research, 112, 157-165.
Coe, B., Tomihara, K., Matsuzawa, M. & Hikosaka, O. (2002). Visual and anticipatory bias in
three cortical eye fields of the monkey during an adaptive decision-making task. Journal
of Neuroscience, 22, 5081–5090.
Collewijn, H., Erkelens, C. J., & Steinman, R. M. (1988). Binocular co-ordination of human
horizontal saccadic eye movements. The Journal of Physiology, 404(1), 157-182.
Corbetta, M., Akbudak, E., Conturo, T. E., Snyder, A. Z., Ollinger, J. M., Drury, H. A., ... &
Shulman, G. L. (1998). A common network of functional areas for attention and eye
movements. Neuron, 21(4), 761-773.
Davidsdottir, S., Cronin-Golomb, A., & Lee, A. (2005). Visual and spatial symptoms in
Parkinson’s disease. Vision research, 45(10), 1285-1296.
DeLong, M. R. (1990). Primate models of movement disorders of basal ganglia origin. Trends in
neurosciences, 13(7), 281-285.
Dias, E. C. & Segraves, M. A. (1999). Muscimol-induced inactivation of monkey frontal eye
field: effects on visually and memory-guided saccades. Journal of neurophysiology, 81,
2191–2214.
Ditchburn, R. W. & Ginsborg, B. L. (1953). Involuntary eye movements during fixation. Journal
of Physiology, 119, 1-17.
Donner, K., & Hemilä, S. (2007). Modelling the effect of microsaccades on retinal responses to
stationary contrast patterns. Vision research, 47(9), 1166-1177.
Dubois, B., & Pillon, B. (1996). Cognitive deficits in Parkinson’s disease. Journal of
neurology, 244(1), 2-8.

53
Engbert, R. & Kliegl, R. (2002). Microsaccades uncover the orientation of covert attention.
Vision Research, 43(9), 1035-1045.
Everling, S., Dorris, M. C., & Munoz, D. P. (1998). Reflex suppression in the anti-saccade task is
dependent on prestimulus neural processes. Journal of neurophysiology, 80(3), 1584-
1589.
Everling, S., & Fischer, B. (1998). The antisaccade: a review of basic research and clinical
studies. Neuropsychologia, 36(9), 885-899.
Fahn, S., Elton, R. L. & UPDRS Program Members. (1987). Unified Parkinson’s disease rating
scale. In: Fahn, S., Marsden, C. D., Goldstein, M., Calne, D. B. (Eds.) Recent
developments in Parkinson’s disease, Vol. 2. (pp. 153-163, 293-304). Florham Park, NJ:
MacMillan Healthcare Information.
Fischer, B. & Boch, R. (1983). Saccadic eye movements after extremely short reaction times in
the monkey. Brain research 260(1), 21-26.
Gaymard, B., Ploner, C. J., Rivaud, S., Vermersch, A. I., & Pierrot-Deseilligny, C. (1998).
Cortical control of saccades. Experimental Brain Research, 123(1-2), 159-163.
Gerfen, C. R., Engber, T. M., Mahan, L. C. Susel, Z., Chase, T. N., Monsma, F. J., & Sibley, D.
R. (1990). D1 and D2 dopamine receptor-regulated gene expression of striatonigral and
striatopallidal neurons. Science, 250(4986), 1429-1432.
Gill, D. J., Freshman, A., Blender, J. A., & Ravina, B. (2008). The Montreal cognitive assessment
as a screening tool for cognitive impairment in Parkinson's disease. Movement
disorders, 23(7), 1043-1046.
Goetz, C. G., Poewe, W., Rascol, O., Sampaio, C., Stebbins, G. T., Counsell, C., … & Seidl, L.
(2004). Movement disorder society task force report on the Hoehn and Yahr Staging
Scale: status and recommendations. Movement Disorders, 19(9), 1020-1028.
Greenfield, J. G. & Bosanquet, F. D. (1953). The brainstem lesions in parkinsonism. Journal of
Neurology, Neurosurgery, & Psychiatry, 16, 213-226.
Guitton, D., Buchtel, H. A. & Douglas, R. M. (1985). Frontal lobe lesions in man cause
difficulties in suppressing reflexive glances and in generating goal-directed saccades.
Experimental Brain Research, 58, 455–472.
Hallett, P. E. (1978). Primary and secondary saccades to goals defined by instructions. Vision
research, 18(10), 1279-1296.
Harnois C. & Di Paulo, T. (1990). Decreased dopamine in the retinas of patients with Parkinson’s
disease. Investigative Ophthalmology & Visual Science, 31(11), 2473-2475.

54
Hartmann-von Monakow, K., Akert, K., & Künzle, H. (1978). Projections of the precentral motor
cortex and other cortical areas of the frontal lobe to the subthalamic nucleus in the
monkey. Experimental Brain Research, 33(3-4), 395-403.
Hafed, Z. M., & Clark, J. J. (2002). Microsaccades as an overt measure of covert attention
shifts. Vision research, 42(22), 2533-2545.
Hafed, Z. M., Goffart, L. & Krauzlis, R. J. (2009). A neural mechanism for microsaccade
generation in the primate superior colliculus. Science, 323(5916), 940-943.
Hafed, Z. M., & Ignashchenkova, A. (2013). On the dissociation between microsaccade rate and
direction after peripheral cues: Microsaccadic inhibition revisited. The Journal of
Neuroscience, 33(41), 16220-16235.
Henik, A., Singh, J., Beckley, D. J., & Rafal, R. D. (1993). Disinhibition of automatic word
reading in Parkinson's disease. Cortex, 29(4), 589-599.
Hikosaka, O., Takikawa, Y., & Kawagoe, R. (2000). Role of the basal ganglia in the control of
purposive saccadic eye movements. Physiological Reviews, 80(3), 953-978.
Hikosaka, O., & Wurtz, R. H. (1983). Visual and oculomotor functions of monkey substantia
nigra pars reticulata. IV. Relation of substantia nigra to superior colliculus. Journal of
neurophysiology, 49(5), 1285-1301.
Hood, A. J., Amador, S. C., Cain, A. E., Briand, K. A., Al-Refai, A. H., Schiess, M. C., &
Sereno, A. B. (2007). Levodopa slows prosaccades and improves antisaccades: An eye
movement study in Parkinson’s disease. Journal of Neurology Neurosurgery &
Psychiatry, 78(6), 565-570.
Hughes, A. J., Daniel, S. E., Blankson, S., Lees, A. J. (1993). A clinicopathologic study of 100
cases of Parkinson's disease. Archives of Neurology, 50(2), 140-148.
Jankovic, J. (2008). Parkinson’s disease: clinical features and diagnosis. Journal of Neurology,
Neurosurgery & Psychiatry, 79(4), 368-376.
Jenner, P., Morris, H. R., Robbins, T. W., Goedert, M., Hardy, J., Ben-Shlomo, Y. … & Brooks,
D. (2013). Parkinson’s disease: the debate on the clinical phenomenology, aetiology,
pathology and pathogenesis. Journal of Parkinson’s Disease, 3(1), 1-11.
Jiang, H., Stein, B. E., & McHaffie, J. G. (2003). Opposing basal ganglia processes shape
midbrain visuomotor activity bilaterally. Nature, 423(6943), 982-986.
Jones, G. M & Dejong, J. D. (1971). Dynamic Characteristics of Saccadic Eye Movements in
Parkinson’s Disease. Experimental neurology, 31(1), 17-31.
Ko, H. K., Poletti, M., & Rucci, M. (2010). Microsaccades precisely relocate gaze in a high visual
acuity task. Nature neuroscience, 13(12), 1549-1553.

55
Krauskopf, J., Cornsweet, T. N., & Riggs, L. A. (1960). Analysis of eye movements during
monocular and binocular fixation. Journal of the Optical Society of America.
Kravitz, A. V., Freeze, B. S., Parker, P. R., Kay, K., Thwin, M. T., Deisseroth, K., & Kreitzer, A.
C. (2010). Regulation of parkinsonian motor behaviours by optogenetic control of basal
ganglia circuitry. Nature, 466(7306), 622-626.
Langston, J. W., Ballard, P., Tetrud, J. W., & Irwin, I. (1983). Chronic Parkinsonism in humans
due to a product of meperidine-analog synthesis. Science, 219(4587), 979-980.
Lasker, A. G., Zee, D. S., Hain, T. C., Folstein, S. E., & Singer, H. S. (1987). Saccades in
Huntington's disease Initiation defects and distractibility. Neurology, 37(3), 364-364.
Leigh, R. J., Newman, S. A., Folstein, S. E., Lasker, A. G., & Jensen, B. A. (1983). Abnormal
ocular motor control in Huntington's disease. Neurology,33(10), 1268-1268.
Leigh, R. J., & Zee, D. S. (1999). The neurology of eye movements (Vol. 90). New York: Oxford
University Press.
Litvan, I., Agid, Y., Calne, D., Campbell, G., Dubois, B., Duvoisin, R. C., … & Zee, D. S.(1996).
Clinical research criteria for the diagnosis of progressive supranuclear palsy (Steele-
Richardson-Olszewski syndrome) Report of the NINDS-SPSP International Workshop.
Neurology, 47(1), 1-9.
Litvan, I., Bhatia, K. P., Burn, D. J., Goetz, C. G., Lang, A. E., McKeith, I., ... & Wenning, G. K.
(2003). SIC Task Force appraisal of clinical diagnostic criteria for parkinsonian disorders.
Movement Disorders, 18(5), 467-486.
Logan, G. D., Cowan, W. B. & Davis, K. A. (1984). On the ability to inhibit responses in simple
and choice reaction time tasks: a model and a method. Journal of Experimental
Psychology: Human Perception and Performance, 10(2), 276.
Lord, M. P. (1951). Measurement of binocular eye movements of subjects in the sitting
position. The British journal of ophthalmology, 35(1), 21.
Martinez-Conde, S., Macknik, S. L., & Hubel, D. H. (2000). Microsaccadic eye movements and
firing of single cells in the striate cortex of macaque monkeys. Nature Neuroscience,
3(3), 251-258.
Martinez-Conde, S., Macknik, S. L., & Hubel, D. H. (2002). The function of bursts of spikes
during visual fixation in the awake primate lateral geniculate nucleus and primary visual
cortex. Proceedings of the National Academy of Sciences, 99(21), 13920-13925.
Martinez-Conde, S., Macknik, S. L., Troncoso, X. G., & Dyar, T. A. (2006). Microsaccades
counteract visual fading during fixation. Neuron, 49(2), 297-305.

56
Martinez-Conde, S., Otero-Millan, J., & Macknik, S. L. (2013). The impact of microsaccades on
vision: towards a unified theory of saccadic function. Nature Reviews Neuroscience,
14(2), 83-96.
McCamy, M. B., Otero-Millan, J., Macknik, S. L., Yang, Y., Troncoso, X. G., Baer, S. M., ... &
Martinez-Conde, S. (2012). Microsaccadic efficacy and contribution to foveal and
peripheral vision. The Journal of Neuroscience, 32(27), 9194-9204.
Middleton, F. A., & Strick, P. L. (2002). Basal-ganglia ‘projections’ to the prefrontal cortex of
the primate. Cerebral Cortex, 12(9), 926-935.
Mohler, C. W., & Wurtz, R. H. (1976). Organization of monkey superior colliculus: intermediate
layer cells discharging before eye movements. Journal of Neurophysiology, 39(4), 722-
744.
Moschovakis, A. K., Scudder, C. A., & Highstein, S. M. (1996). The microscopic anatomy and
physiology of the mammalian saccadic system. Progress in neurobiology, 50(2), 133-
254.
Munoz, D. P. (2002). Commentary: saccadic eye movements: overview of neural circuitry.
Progress in brain research, 140, 89-96.
Munoz, D. P., Dorris, M. C., Pare, M., & Everling, S. (2000). On your mark, get set: Brainstem
circuitry underlying saccade initiation. Canadian Journal of Physiology and
Pharmacology, 78(11), 934-944.
Munoz, D. P., & Everling, S. (2004). Look away: the anti-saccade task and the voluntary control
of eye movement. Nature Reviews Neuroscience, 5(3), 218-228.
Munoz, D. P., & Wurtz, R. H. (1993). Fixation cells in monkey superior colliculus. I.
Characteristics of cell discharge. Journal of neurophysiology,70(2), 559-575.
Nachev, P., Kennard, C., & Husain, M. (2008). Functional role of the supplementary and pre-
supplementary motor areas. Nature Reviews Neuroscience, 5, 218-228.
Nambu, A., Tokuno, H., Hamada, I., Kita, H., Imanishi, M., Akazawa, T., ... & Hasegawa, N.
(2000). Excitatory cortical inputs to pallidal neurons via the subthalamic nucleus in the
monkey. Journal of neurophysiology, 84(1), 289-300.
Nambu, A., Tokuno, H. & Takada, M. (2002). Functional significance of the cortico-subthalamo-
pallidal ‘hyperdirect’ pathway. Neuroscience Research, 43(2), 111-117.
Niijima, K. & Yoshida, M. (1982) Electrophysiological evidence for branching nigral projections
to pontine reticular formation, superior colliculus, and thalamus. Brain Research, 239(1),
279-282.
57
Noorani, I. & Carpenter, R. H. S. (2013). Antisaccades as decisions: LATER model predicts
latency distributions and error responses. European Journal of Neuroscience, 37, 330-
338.
Otero-Millan, J., Macknik, S. L., & Martinez-Conde, S. (2012). Microsaccades and blinks trigger
illusory rotation in the “Rotating Snakes” illusion. The Journal of Neuroscience, 32(17),
6043-6051.
Otero-Millan, J., Macknik, S. L., Serra, A., Leigh, R. J., & Martinez-Conde, S. (2011). Triggering
mechanisms in microsaccade and saccade generation: a novel proposal. Annals of the
New York Academy of Sciences, 1233(1), 107-116.
Otero-Millan, J., Troncoso, X. G., Macknik, S. L. Serrano-Pedraza, I., & Martinez-Conde, S.
(2008). Saccade and microsaccades during visual fixation, exploration, and search:
foundations for a common saccadic generator. Journal of Vision, 8(14).
Parent, A., & Hazrati, L. N. (1994). Multiple striatal representation in primate substantia
nigra. Journal of Comparative Neurology, 344(2), 305-320.
Pierrot-Deseilligny, C., Rivaud, S., Gaymard, B. & Agid, Y. (1991). Cortical control of reflexive
visually-guided saccades. Brain, 114, 1473–1485.
Priyadarshi, A., Khuder, S. A., Schaub, E. A., & Priyadarshi, S. S. (2001). Environmental risk
factors and Parkinson's disease: a metaanalysis. Environmental research, 86(2), 122-127.
Rascol, O., Payoux, P., Ory, F., Ferreira, J. J., Brefel-Courbon, C., & Montastruc, J. (2003).
Limitations of current Parkinson’s disease therapy. Annals of Neurology, 53(S3), S3-S15.
Rehman, H. U. (1999). Progressive supranuclear palsy. Postgraduate Medical Journal, 76(896),
333-336.
Riggs, L. A., Ratliff, F., Cornsweet, J. C., & Cornsweet, T. N. (1953). The disappearance of
stadily fixated visual test objects. Journal of the Optical Society of America, 43(6), 495-
501.
Rivaud, S., Muri, R. M., Gaymard, B., Vermersch, A. I. & Pierrot-Deseilligny, C. (1994). Eye
movement disorders after frontal eye field lesions in humans. Experimental Brain
Research, 102, 110–120.
Robinson, D. A. (1972). Eye movements evoked by collicular stimulation in the alert monkey.
Vision research, 12(11), 1795-1808.
Rodgers, C. K., Munoz, D. P., Scott, S. H., & Paré, M. (2006). Discharge properties of monkey
tectoreticular neurons. Journal of neurophysiology, 95(6), 3502-3511.
Rolfs, M., Kliegl, R., & Engbert, R. (2008). Toward a model of microsaccade generation: The
case of microsaccadic inhibition. Journal of Vision, 8(11).

58
Rolfs, M., Laubrock, J., & Kliegl, R. (2006). Shortening and prolongation of saccade latencies
following microsaccades. Experimental Brain Research, 169(3), 363-376.
Roll, A., Wierzbicka, M. M., & Wolf, W. (1996). The “gap paradigm” leads to express-like
saccadic reaction times in Parkinson's disease. Experimental brain research, 111(1), 131-
138.
Russo, G. S., & Bruce, C. J. (1994). Frontal eye field activity preceding aurally guided saccades.
Journal of neurophysiology, 71(3), 1250-1253.
Samii, A. (2008). Cardinal Features of Early Parkinson’s Disease. In S. A. Factor & W. J. Weiner
(Eds.), Parkinson’s disease: diagnosis and clinical management - 2nd ed. (pp. 45-54).
New York: Demos Medical Publishing.
Schall, J. D. (2002). The neural selection and control of saccades by the frontal eye field.
Philosophical Transactions of the Royal Society – Biological Sciences, 357 (1424), 1073-
1082.
Schiller, P. H., Sandell, J. H., & Maunsell, J. H. (1987). The effect of frontal eye field and
superior colliculus lesions on saccadic latencies in the rhesus monkey. Journal of
neurophysiology, 57(4), 1033-1049.
Schiller, P. H. & Stryker, M. (1972) Single-unit recording and stimulation in superior colliculus
of the alert rhesus monkey. Journal of neurophysiology, 35(6), 915-924.
Scudder, C. A., Kaneko, C. R., & Fuchs, A. F. (2002). The brainstem burst generator for saccadic
eye movements. Experimental Brain Research, 142(4), 439-462.
Sereno, A. B., & Holzman, P. S. (1995). Antisaccades and smooth pursuit eye movements in
schizophrenia. Biological psychiatry, 37(6), 394-401.
Smith, P. L. & Ratcliff., R. (2004). Psychology and neurobiology of simple decisions. Trends in
Neurosciences, 27(3), 161-168.
Smith, Y., Bevan, M.D., Shink, E. & Bolam, J.P. (1998). Microcircuitry of the direct and indirect
pathways of the basal ganglia.Neuroscience, 86, 353–387.
Sommer, M. A. & Tehovnik, E. J. Reversible inactivation of macaque frontal eye field. (1997).
Experimental Brain Research, 116, 229–249.
Sparks, D. L. (1986) Translation of sensory signals into commands for control of saccadic eye
movements: role of primate superior colliculus. Physiological Reviews, 66(1), 118-171.
Sparks, D. L. (2002) The brainstem control of saccadic eye movements. Nature Reviews
Neuroscience, 3(12), 952-964.
Statistics Canada. (2013). Table 105-1300 - Neurological conditions, by age group and sex,
household population aged 0 and over, 2010/2011, occasional (number unless otherwise

59
noted), CANSIM (database). Accessed: 2013-08-01 from Statistics Canada:
http://www5.statcan.gc.ca/cansim/a05?lang=eng&id=1051300&pattern=1051300&search
TypeByValue=1&p2=35
Stein, B. E., & Meredith, M. A. (1993). The merging of the senses. The MIT Press.
Takakusaki, K., Saitoh, K., Harada, H., & Kashiwayanagi, M. (2004). Role of basal ganglia-
brainstem pathways in the control of motor behaviors. Neuroscience Research, 50(2),
137-151.
Teräväinen, H. & Calne, D.B. (1980). Studies of parkinsonian movement: 1. Programming and
execution of eye movements. Acta Neurologica Scandinavica, 62(3), 137-148.
Thompson, K. G., Bichor, N. P., & Schall, J. D. (1996). Dissociation of visual discrimination
from saccade programming in macaque frontal eye field. Journal of neurophysiology,
77(2), 1046-1050.
Warner, T. T. & Schapira, V. (2003). Genetic and environmental factors in the cause of
Parkinson’s disease. Annals of Neurology, 53(S3), S16-S25.
Watanabe, M., Matsuo, Y., Zha, L., Munoz, D. P., & Kobayashi, Y. (2013). Fixational saccades
reflect volitional action preparation. Journal of neurophysiology, 110(2), 522-535.
Watanabe, M., & Munoz, D. P. (2009). Neural correlates of conflict resolution between automatic
and volitional actions by basal ganglia. European Journal of Neuroscience, 30(11), 2165-
2176.
Watanabe, M., & Munoz, D. P. (2010). Presetting basal ganglia for volitional actions. The
Journal of Neuroscience, 30(30), 10144-10157.
Watanabe, M. & Munoz, D.P. (2011). Probing basal ganglia functions by saccade eye
movements. European Journal of Neuroscience, 33, 2070-2090.
Westheimer, G. (1954). Mechanism of saccadic eye movements. Archives of Ophthalmology,
52(5), 710.
Wolters, E. C. (2009). Non-motor extranigral signs and symptoms in Parkinson’s disease.
Parkinsonism and Related Disorders, 15(S3), S6-S12.
Zhang, M. & Barash, S. (2000). Neuronal switching of sensorimotor transformations for
antisaccades. Nature, 408, 971-975.
Zuber, B. L., Stark, L., & Cook, G. (1965). Microsaccades and the velocity-amplitude
relationship for saccadic eye movements. Science, 150, 1459-1460.