microsimulation model design in lower manhattan: … model design in lower manhattan: a street...
TRANSCRIPT

Microsimulation Model Design in Lower Manhattan: A Street Management Approach
Transportation Research Board Session 278January 12, 2009
Trent Lethco, ArupVaranesh Singh, ArupS. Brian Huey, ArupPeter Dunn, Arup
Suchi Sanagavarapu, New York City DOT

Acknowledgements
• New York City Department of Transportation (NYCDOT)• Steven Weber – Assistant Commissioner for Strategic Planning• Luis Sanchez – Lower Manhattan Borough Commissioner
• New York City Economic Development Corporation (NYCEDC)
• Michael Taylor – Senior Project Manager
• Lower Manhattan Development Corporation (LMDC)• Philip Plotch – Director of World Trade Center Redevelopment and Special
Projects
This study was made possible by a grant from the Lower Manhattan Development Corporation, which is funded through Community Development Block Grants from the U.S. Department of Housing and Urban Development.
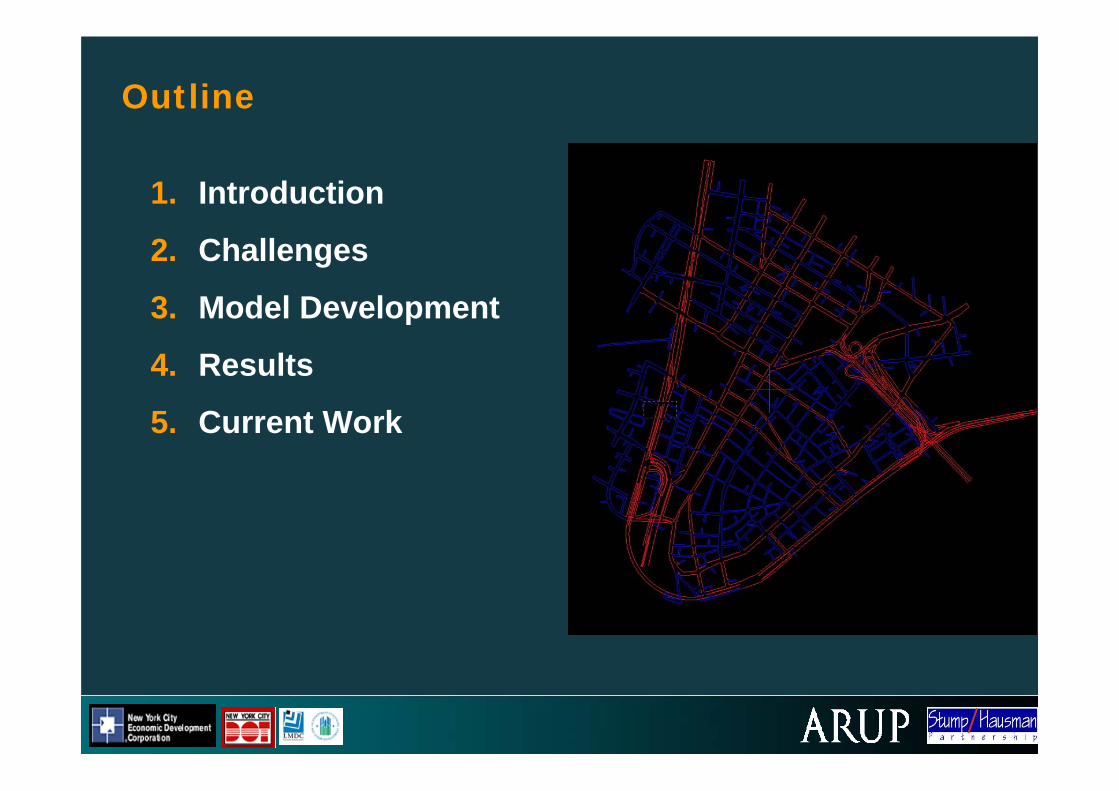
Outline
1. Introduction
2. Challenges
3. Model Development
4. Results
5. Current Work

Introduction
• Lower Manhattan Street Management Project• Multi-year, transportation planning services contract with
NYCDOT and NYCEDC• Scope of work includes:
• Traffic Simulation Model• Placard Parking Analysis• Bus Management Analysis• Other Traffic Analyses

Lower Manhattan at a Glance
• 1 sq mile dense urban neighborhood
• Fourth largest central business district in America
• Over 318,000 employees
• 145% increase in residential population since 2001
• Over 8 million annual visitorsWall Street
Seaport
City HallWFC
World Trade Center
BatteryPark

Model Purpose
• Comprehensive, detailed traffic model• Appropriate for technical and non-technical audience• Manage street operations resulting from:
• Construction closures• Network changes• Planning and security scenarios
Source: LMCCC/LiRo
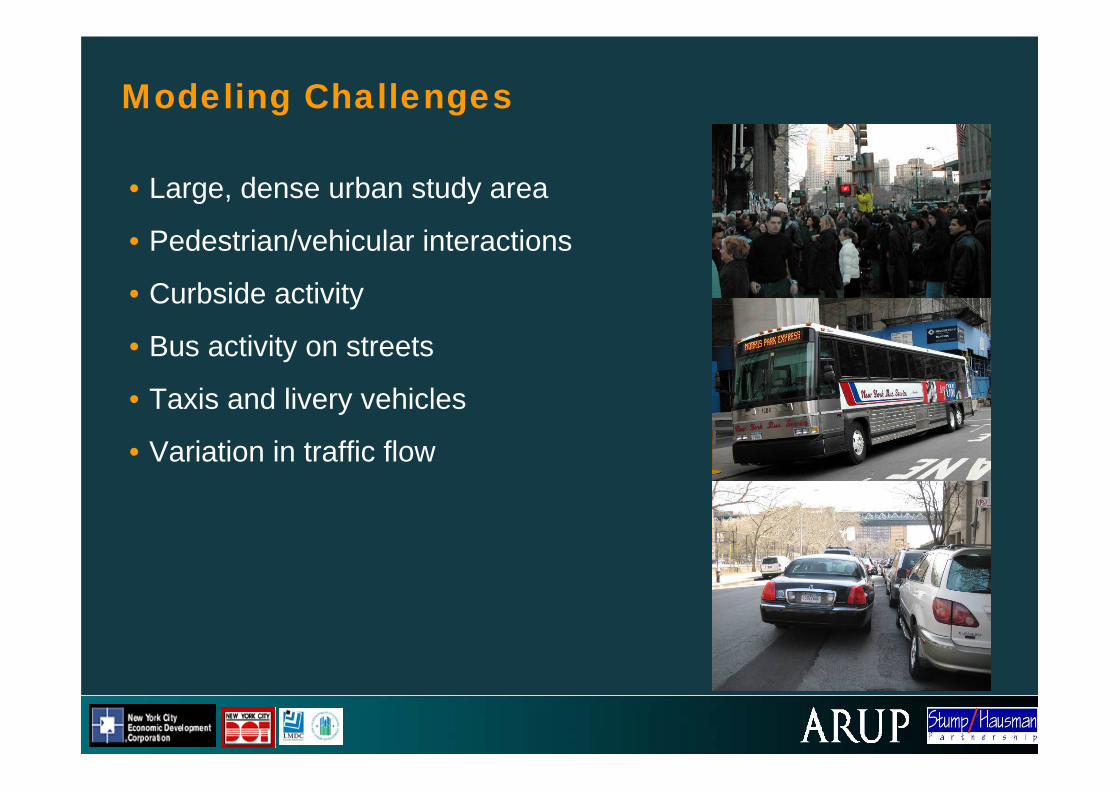
Modeling Challenges
• Large, dense urban study area
• Pedestrian/vehicular interactions
• Curbside activity
• Bus activity on streets
• Taxis and livery vehicles
• Variation in traffic flow
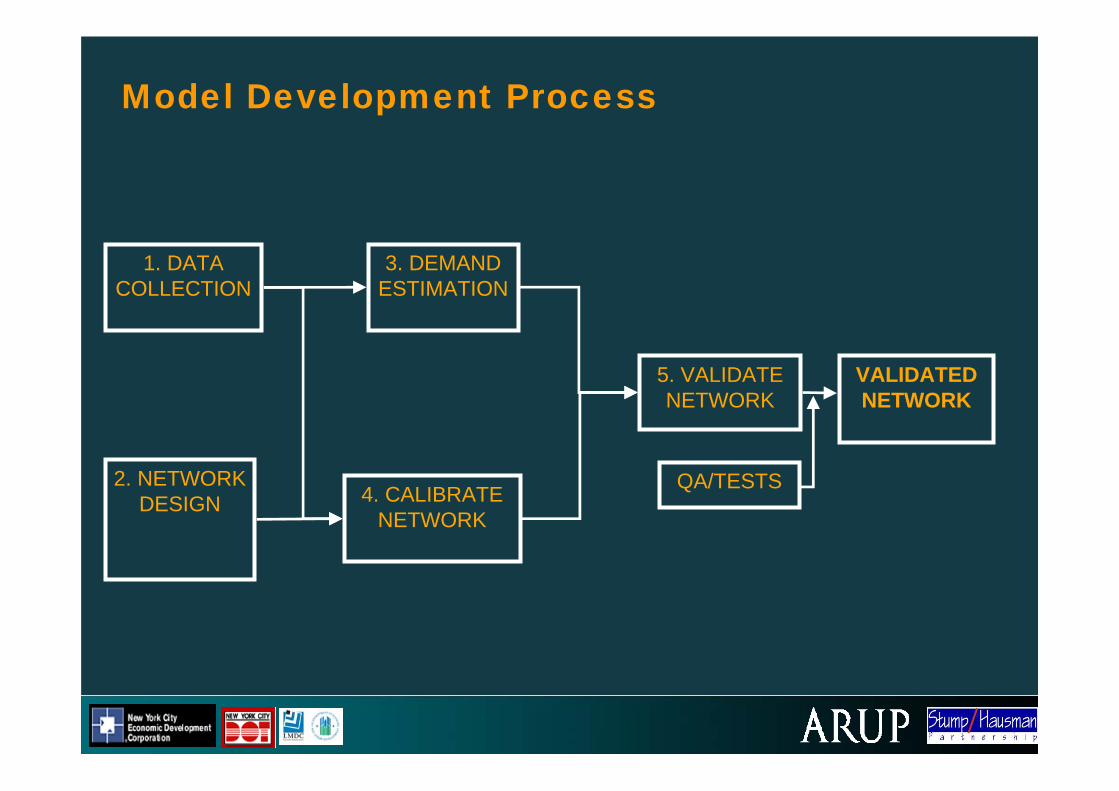
Model Development Process
5. VALIDATENETWORK
4. CALIBRATE NETWORK
2. NETWORK DESIGN
1. DATA COLLECTION
3. DEMAND ESTIMATION
VALIDATED NETWORK
QA/TESTS

1. Data Collection
• Surveys• Vehicle and pedestrian counts• Parking (on and off street)• Travel time
• Existing data sources• BPM• 2000 Census (JTW)• Brooklyn Bridge counts
• Network configuration• Aerial photography• Site visits/photos

2. Network Design – Link Categories
• Systematic and functionalapproach to categorization
• Guided by LM Street Management Framework
• Informed major/minor designation, speed, widths and cost factors
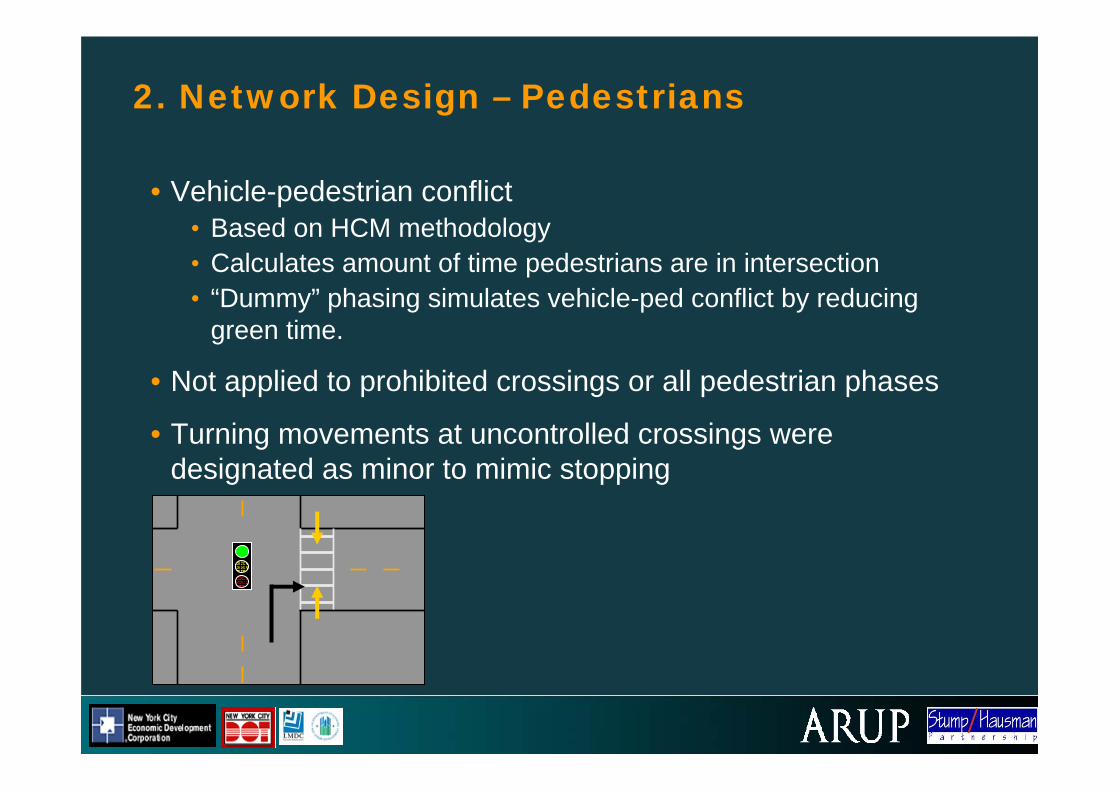
2. Network Design – Pedestrians
• Vehicle-pedestrian conflict• Based on HCM methodology• Calculates amount of time pedestrians are in intersection• “Dummy” phasing simulates vehicle-ped conflict by reducing
green time.
• Not applied to prohibited crossings or all pedestrian phases
• Turning movements at uncontrolled crossings were designated as minor to mimic stopping

3. Demand Estimation
• Pattern matrix based on regional model demands
• 159 Zones, > 25,000 possible O/D pairs
• 8 O-D matrices – separated by vehicle and trip type
• Hierarchical estimation process1. External cordons2. Off Street destinations3. On street parking4. Screenline traffic5. Turns6. Vehicle types

4. Calibration
• Calibration ensures that the model adequately reflects the observed traffic behavior, volume and travel times:
• Physical network (stop lines, curbs, junctions)• Link costs• Assignment parameters• Visual calibration based on site visits
• Allowance for prohibited movements
• Validation is an independent check of the calibrated model to assess its accuracy and confirm that the model is fit for purpose

5. Validation
• Performance criteria adopted from US and International guidelines
• GEH – applied to link and turn flows• R squared – applied to link and turn flows• Percent Difference – applied to screenline and
travel time
• Four criteria:• Screenlines• Individual Link Flows• Turning Movements• Travel Times volumeobservedC
volumemodeledM
)(2 2
==
+−
=
whereCMCMGEH
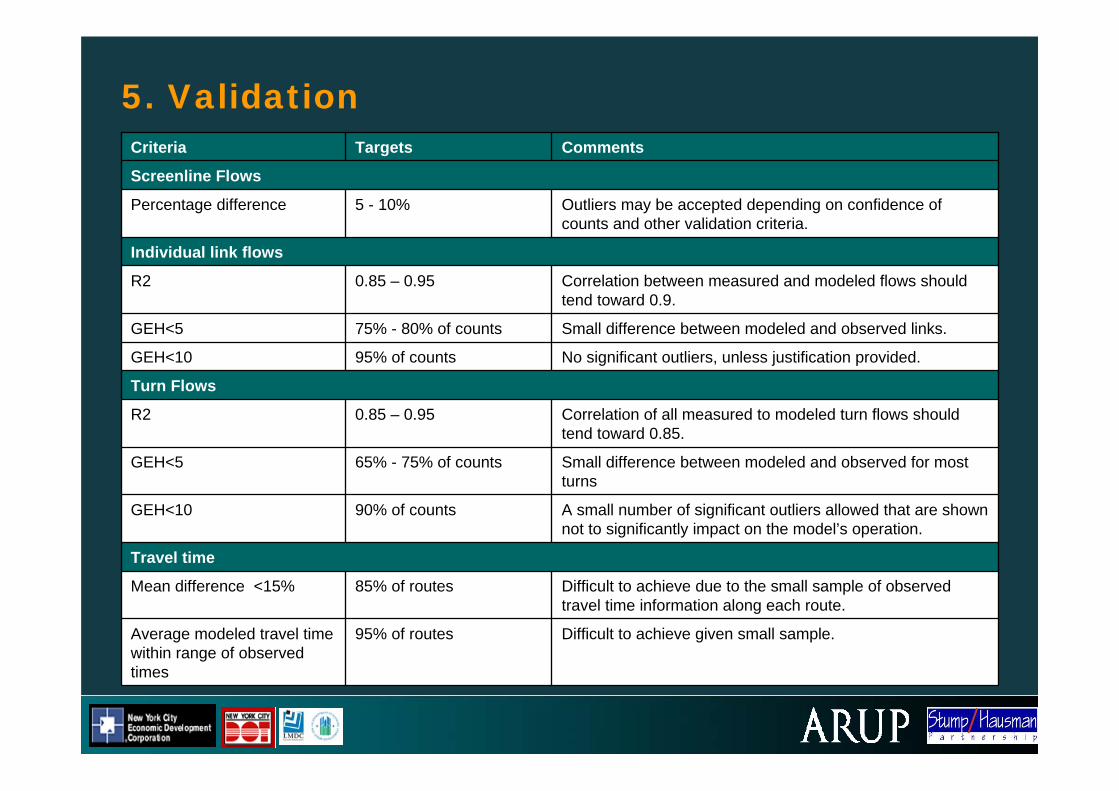
5. Validation
Difficult to achieve given small sample.95% of routesAverage modeled travel time within range of observed times
Difficult to achieve due to the small sample of observed travel time information along each route.
85% of routesMean difference <15%
Travel time
A small number of significant outliers allowed that are shown not to significantly impact on the model’s operation.
90% of countsGEH<10
Small difference between modeled and observed for most turns
65% - 75% of countsGEH<5
Correlation of all measured to modeled turn flows should tend toward 0.85.
0.85 – 0.95R2
Turn Flows
No significant outliers, unless justification provided. 95% of countsGEH<10
Small difference between modeled and observed links.75% - 80% of countsGEH<5
Correlation between measured and modeled flows should tend toward 0.9.
0.85 – 0.95R2
Individual link flows
Outliers may be accepted depending on confidence of counts and other validation criteria.
5 - 10%Percentage difference
Screenline Flows
CommentsTargetsCriteria

Results
Doesn’t achieve targets 6%22%95% of routesAverage modeled travel time within range of observed times
Doesn’t achieve targets 11%50%85% of routesMean difference <15%
Travel Time
Acceptable94%91%90% of countsGEH<10
Acceptable – AM slightly low
70%63%65% - 75% of countsGEH<5
Acceptable0.980.950.85 – 0.95R2
Turn Flows
Acceptable98%96%95% of countsGEH<10
Acceptable – AM slightly low
84%74%75% - 80% of countsGEH<5
Acceptable0.990.990.85 – 0.95R2
Individual Link Flows
AcceptableAll <7%All <6%5 – 10%Percent difference
Screenline Flows
CommentsAchieved PM
Achieved AM
TargetsCriteria

Lessons Learned
• Client collaboration is essential
• Data collection is important
• Few urban microsimulation standards and guidelines
• Travel times are variable requiring careful attention

Current Work
• Model expansion
• Agent-based pedestrian simulation
• Additional data collection
• Seamless linkage to regional model

Thank you