microsoft excel 2007 and tools for statistical analysis excel 2007 and tools for statistical...
TRANSCRIPT

Microsoft Excel 2007 and Tools for Statistical Analysis
David R. Anderson, Dennis J. Sweeney, and Thomas A. Williams
Microsoft Excel 2007, part of the Microsoft Office 2007 system, is a spreadsheet programthat can be used to organize and analyze data, perform complex calculations, and createa wide variety of graphical displays. We assume readers of this primer are familiar withbasic Excel operations such as selecting cells, entering formulas, copying, and so on. But,we do not assume readers are familiar with Excel 2007 or the use of Excel for statisticalanalysis.
The purpose of this primer is twofold. First, we provide an overview of Excel 2007 anddiscuss the basic operations needed to work with Excel 2007 workbooks and worksheets.Second, we provide an overview of the tools that are available for conducting statisticalanalysis with Excel. These include Excel functions and formulas which allow users to con-duct their own analyses and add-ins that provide more comprehensive analysis tools.
Excel’s Data Analysis add-in, included with the basic Excel system, is a valuable toolfor conducting statistical analysis. In the last section of this primer we provide instructionsfor installing the Data Analysis add-in. Other add-ins have been developed by outside sup-pliers to supplement the basic statistical capabilities provided by Excel. In the last sectionwe also discuss two commercially available add-ins developed by Palisade Corporation:StatTools and PrecisionTree.
OVERVIEW OF MICROSOFT EXCEL 2007
When using Excel for statistical analysis, data is displayed in workbooks, each of whichcontains a series of worksheets that typically include the original data as well as any re-sulting analyses, including charts. Figure 1 shows the layout of a blank workbook createdeach time Excel is opened. The workbook is named Book1, and consists of three worksheetsnamed Sheet1, Sheet2, and Sheet3. Excel highlights the worksheet currently displayed(Sheet1) by setting the name on the worksheet tab in bold. To select a different worksheetsimply click on the corresponding tab. Note that cell A1 is initially selected.
The wide bar located across the top of the workbook is referred to as the Ribbon. Tabs,located at the top of the Ribbon, provide quick access to groups of related commands. Thereare eight tabs: Home; Insert; Page Layout; Formulas; Data; Review; View, and Add-Ins.Each tab contains a series of groups of related commands. Note that the Home tab is se-lected when Excel is opened. Figure 2 displays a portion of the Home tab. Under the Hometab there are seven groups of related commands: Clipboard; Font; Alignment; Number;Styles; Cells; and Editing. Commands are arranged within each group. For example, tochange selected text to boldface, click the Home tab and click the Bold button in the Fontgroup.
Figure 3 illustrates the location of the Office Button, the Quick Access Toolbar, and theFormula Bar. When you click the Office Button, Excel provides a list of workbook optionssuch as opening, saving, and printing (worksheets). The Quick Access Toolbar allows youto quickly access these workbook options. For instance, the Quick Access Toolbar shownin Figure 3 includes an Open button that can be used to open files without having tofirst click the Office Button. To add or remove features on the Quick Access Toolbar clickthe Customize Quick Access Toolbar button on the Quick Access Toolbar.
A workbook is a filecontaining one or moreworksheets.
ASW_MBS_Primer_Web.qxd 11/1/07 1:41 PM Page 1

The Formula Bar contains a Name box, the Insert Function button , and a Formulabox. In Figure 3, “A1” appears in the Name box because cell A1 is selected. You can selectany other cell in the worksheet by using the mouse to move the cursor to another cell andclicking or by typing the new cell location in the name box. The Formula box is used to dis-play the formula in the currently selected cell. For instance, if you had entered �A1�A2into cell A3, whenever you select cell A3 the formula �A1�A2 will be shown in theFormula box. This feature makes it very easy to see and edit a formula in a particular cell.The Insert Function button allows you to quickly access all of the functions available inExcel. Later we show how to find and use a particular function.
2 Microsoft Excel 2007 and Tools for Statistical Analysis
Tabs Contain Namesof Worksheets
Name ofWorkbook Ribbon
Cell A1 isselected
FIGURE 1 BLANK WORKBOOK CREATED WHEN EXCEL IS OPENED
ASW_MBS_Primer_Web.qxd 11/1/07 1:41 PM Page 2

Microsoft Excel 2007 and Tools for Statistical Analysis 3
Home Tab
FontGroup
ClipboardGroup
AlignmentGroup
NumberGroup
FIGURE 2 PORTION OF THE HOME TAB
Quick AccessToolbar
InsertFunction Button
FormulaBox
FormulaBar
NameBox
Click Button to CustomizeQuick Access Toolbar
OfficeButton
FIGURE 3 EXCEL 2007 OFFICE BUTTON, QUICK ACCESS TOOLBAR, AND FORMULA BAR
ASW_MBS_Primer_Web.qxd 11/1/07 1:41 PM Page 3

Basic Workbook OperationsFigure 4 illustrates the worksheet options that can be performed after right clicking ona worksheet tab. For instance, to change the name of the current worksheet from “Sheet1”to “Data,” right click the worksheet tab named “Sheet1” and select the Rename option. Thecurrent worksheet name (Sheet1) will be highlighted. Then, simply type the new name(Data) and press the Enter key to rename the worksheet.
Suppose that you wanted to create a copy of “Sheet1.” After right clicking the tabnamed “Sheet1,” select the Move or Copy option. When the Move or Copy dialog box ap-pears, select Create a Copy and click OK. The name of the copied worksheet will appear as“Sheet1 (2).” You can then rename it, if desired.
To add a worksheet to the workbook, right click any worksheet tab and select the Insertoption; when the Insert dialog box appears, select Worksheet and click OK. An additionalblank worksheet titled “Sheet 4” will appear in the workbook. You can also insert a newworksheet by clicking the Insert Worksheet tab button that appears to the right of thelast worksheet tab displayed. Worksheets can be deleted by right clicking the worksheet taband choosing Delete. After clicking Delete, a window will appear warning you that any dataappearing in the worksheet will be lost. Click Delete to confirm that you do want to deletethe worksheet. Worksheets can also be moved to other workbooks or a different position inthe current workbook by using the Move or Copy option.
Creating, Saving, and Opening Files Data can be entered into an Excel worksheet by manually entering the data into the work-sheet or by opening another workbook that already contains the data. As an illustration ofmanually entering, saving, and opening a file we will use an example from Chapter 2 of theAnderson, Sweeney, and Williams statistics texts involving data for a sample of 50 softdrink purchases. The original data are shown in Table 1.
Suppose you have just opened Excel and want to work with this data. A blank workbookcontaining three worksheets will be displayed. The soft drink data can now be entered man-ually by simply typing it into one of the worksheets. If Excel is currently running and noblank workbook is displayed, you can create a blank workbook using the following steps:
Step 1: Click the Office buttonStep 2: Click New in the list of options
4 Microsoft Excel 2007 and Tools for Statistical Analysis
FIGURE 4 WORKSHEET OPTIONS OBTAINED AFTER RIGHT CLICKING ON A WORKSHEET TAB
ASW_MBS_Primer_Web.qxd 11/1/07 1:41 PM Page 4

Step 3: When the New Workbook dialog box appears:Select Blank and recent under TemplatesDouble click Blank Workbook
A new workbook containing three worksheets labeled Sheet1, Sheet2, and Sheet3 willappear.
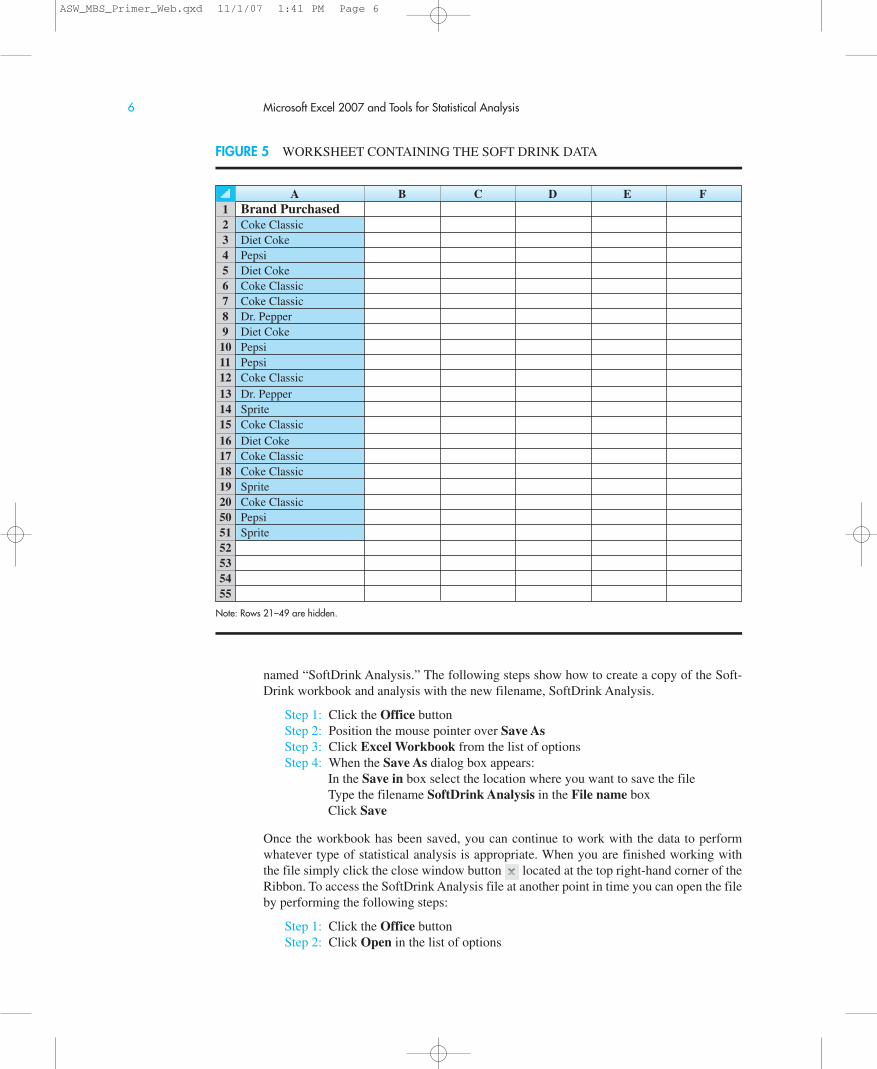
Suppose we want to enter the data for the sample of 50 soft drink purchases into Sheet1of the new workbook. First, we enter the label “Brand Purchased” into cell A1; then, weenter the data for the 50 soft drink purchases into cells A2:A51. As a reminder that thisworksheet contains the data, we will change the name of the worksheet from “Sheet1” to“Data” using the procedure described previously. Figure 5 shows the data worksheet wehave just developed.
Before doing any analysis with these data, we recommend that you first save the file;this will save you from having to reenter the data in case something happens that causesExcel to close. To save the workbook using the filename SoftDrink we perform thefollowing steps:
Step 1: Click the Office buttonStep 2: Click Save As in the list of options Step 3: When the Save As dialog box appears:
In the Save in box select the location where you want to save the fileType the filename SoftDrink in the File name boxClick Save
Excel’s Save command is designed to save the file as an Excel 2007 workbook. As you workwith the file to do statistical analysis you should follow the practice of periodically savingthe file so you will not lose any statistical analysis you may have performed. Simply fol-low the procedure described above using the Save command.
Sometimes you may want to create a copy of an existing file. For instance, suppose youwould like to save the soft drink data and any resulting statistical analysis in a new file
Microsoft Excel 2007 and Tools for Statistical Analysis 5
Coke Classic Sprite PepsiDiet Coke Coke Classic Coke ClassicPepsi Diet Coke Coke ClassicDiet Coke Coke Classic Coke ClassicCoke Classic Diet Coke PepsiCoke Classic Coke Classic Dr. PepperDr. Pepper Sprite Coke ClassicDiet Coke Pepsi Diet CokePepsi Coke Classic PepsiPepsi Coke Classic PepsiCoke Classic Coke Classic PepsiDr. Pepper Pepsi PepsiSprite Coke Classic Coke ClassicCoke Classic Sprite Dr. PepperDiet Coke Dr. Pepper PepsiCoke Classic Pepsi SpriteCoke Classic Diet Coke
TABLE 1 DATA FROM A SAMPLE OF 50 SOFT DRINK PURCHASES
Keyboard shortcut: To savethe file, press CTRL�S
ASW_MBS_Primer_Web.qxd 11/1/07 1:41 PM Page 5
named “SoftDrink Analysis.” The following steps show how to create a copy of the Soft-Drink workbook and analysis with the new filename, SoftDrink Analysis.
Step 1: Click the Office buttonStep 2: Position the mouse pointer over Save AsStep 3: Click Excel Workbook from the list of options Step 4: When the Save As dialog box appears:
In the Save in box select the location where you want to save the fileType the filename SoftDrink Analysis in the File name boxClick Save
Once the workbook has been saved, you can continue to work with the data to performwhatever type of statistical analysis is appropriate. When you are finished working withthe file simply click the close window button located at the top right-hand corner of theRibbon. To access the SoftDrink Analysis file at another point in time you can open the fileby performing the following steps:
Step 1: Click the Office buttonStep 2: Click Open in the list of options
6 Microsoft Excel 2007 and Tools for Statistical Analysis
FIGURE 5 WORKSHEET CONTAINING THE SOFT DRINK DATA
A B C D E F1 Brand Purchased2 Coke Classic3 Diet Coke4 Pepsi5 Diet Coke6 Coke Classic7 Coke Classic8 Dr. Pepper9 Diet Coke10 Pepsi11 Pepsi12 Coke Classic13 Dr. Pepper14 Sprite15 Coke Classic16 Diet Coke17 Coke Classic18 Coke Classic19 Sprite20 Coke Classic50 Pepsi51 Sprite52535455
Note: Rows 21–49 are hidden.
ASW_MBS_Primer_Web.qxd 11/1/07 1:41 PM Page 6

Step 3: When the Open dialog box appears:In the Look in box select the location where you previously saved the fileEnter the filename SoftDrink in the File name boxClick Open
The procedures we showed for saving or opening a workbook begin by clicking on theOffice Button to access the Save and Open commands. Once you have used Excel forawhile you will probably find it more convenient to add these commands to the QuickAccess Toolbar.
USING EXCEL FUNCTIONS
Excel 2007 provides a wealth of functions for data management and statistical analysis. Ifwe know what function is needed, and how to use it, we can simply enter the function intothe appropriate worksheet cell. However, if we are not sure what functions are availableto accomplish a task or are not sure how to use a particular function, Excel can provideassistance.
Finding the Right Excel FunctionTo identify the functions available in Excel, click the Formulas tab on the Ribbon and thenclick the Insert Function button in the Function Library group. Alternatively click thebutton on the formula bar. Either approach provides the Insert Function dialog box shownin Figure 6.
Microsoft Excel 2007 and Tools for Statistical Analysis 7
FIGURE 6 INSERT FUNCTION DIALOG BOX
ASW_MBS_Primer_Web.qxd 11/1/07 1:41 PM Page 7
The Search for a function box at the top of the Insert Function dialog box enables usto type a brief description of what we want to do. After doing so and clicking Go, Excelwill search for and display, in the Select a function box, the functions that may accomplishour task. In many situations, however, we may want to browse through an entire categoryof functions to see what is available. For this task, the Or select a category box is helpful.It contains a drop-down list of several categories of functions provided by Excel. Figure 6shows that we selected the Statistical category. As a result, Excel’s statistical functions ap-pear in alphabetic order in the Select a function box. We see the AVEDEV function listedfirst, followed by the AVERAGE function, and so on.
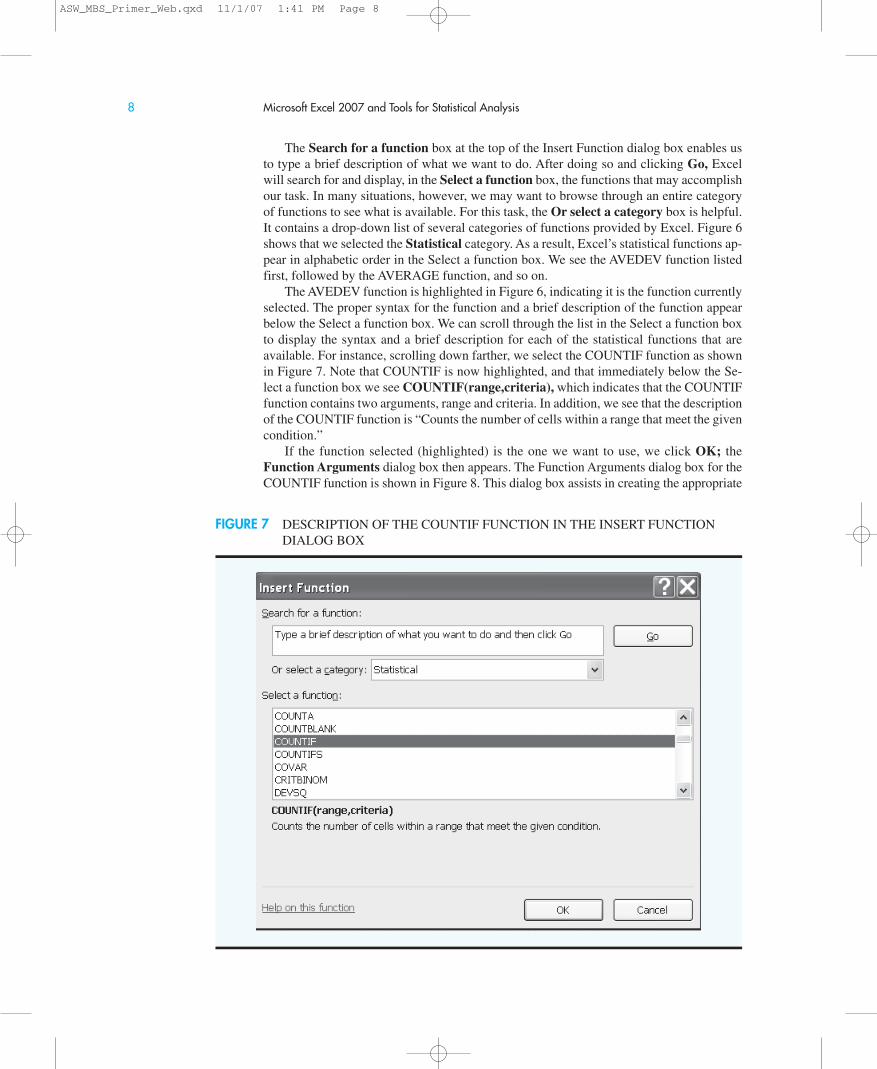
The AVEDEV function is highlighted in Figure 6, indicating it is the function currentlyselected. The proper syntax for the function and a brief description of the function appearbelow the Select a function box. We can scroll through the list in the Select a function boxto display the syntax and a brief description for each of the statistical functions that areavailable. For instance, scrolling down farther, we select the COUNTIF function as shownin Figure 7. Note that COUNTIF is now highlighted, and that immediately below the Se-lect a function box we see COUNTIF(range,criteria), which indicates that the COUNTIFfunction contains two arguments, range and criteria. In addition, we see that the descriptionof the COUNTIF function is “Counts the number of cells within a range that meet the givencondition.”
If the function selected (highlighted) is the one we want to use, we click OK; theFunction Arguments dialog box then appears. The Function Arguments dialog box for theCOUNTIF function is shown in Figure 8. This dialog box assists in creating the appropriate
8 Microsoft Excel 2007 and Tools for Statistical Analysis
FIGURE 7 DESCRIPTION OF THE COUNTIF FUNCTION IN THE INSERT FUNCTIONDIALOG BOX
ASW_MBS_Primer_Web.qxd 11/1/07 1:41 PM Page 8

arguments for the function selected. When finished entering the arguments, we click OK;Excel then inserts the function into a worksheet cell.
Inserting a Function into a Worksheet CellWe will now show how to use the Insert Function and Function Arguments dialog boxes toselect a function, develop its arguments, and insert the function into a worksheet cell.
Suppose we want to construct a frequency distribution for the soft drink purchase datain Table 1. Figure 9 displays an Excel worksheet containing the soft drink data and labelsfor the frequency distribution we would like to construct. We see that the frequency of CokeClassic purchases will go into cell D2, the frequency of Diet Coke purchases will go intocell D3, and so on. Suppose we want to use the COUNTIF function to compute thefrequencies and would like some assistance from Excel.
Step 1: Select cell D2Step 2: Click on the formula barStep 3: When the Insert Function dialog box appears
Select Statistical in the Or select a category boxSelect COUNTIF in the Select a function boxClick OK
Step 4: When the Function Arguments dialog box appear (see Figure 10)Enter $A$2:$A$51 in the Range boxEnter C2 in the Criteria box (At this point, the value of the function will appear
on the next-to-last line of the dialog box. Its value is 19.)Click OK
Step 5: Copy cell D2 to cells D3:D6
The worksheet then appears as in Figure 11. The formula worksheet is in the back-ground; the value worksheet appears in the foreground. The formula worksheet shows that
Microsoft Excel 2007 and Tools for Statistical Analysis 9
FIGURE 8 FUNCTION ARGUMENTS DIALOG BOX FOR THE COUNTIF FUNCTION
ASW_MBS_Primer_Web.qxd 11/1/07 1:41 PM Page 9

10 Microsoft Excel 2007 and Tools for Statistical Analysis
FIGURE 10 COMPLETED FUNCTION ARGUMENTS DIALOG BOX FOR THE COUNTIF FUNCTION
the COUNTIF function was inserted into cells D2:D6. The value worksheet shows theproper class frequencies as computed.
We illustrated the use of Excel’s capability to provide assistance in using the COUNTIFfunction. The procedure is similar for all Excel functions. This capability is especially help-ful if you do not know what function to use or forget the proper name and/or syntax for afunction.
FIGURE 9 EXCEL WORKSHEET WITH SOFT DRINK DATA AND LABELS FORTHE FREQUENCY DISTRIBUTION WE WOULD LIKE TO CONSTRUCT
A B C D E F1 Brand Purchased Soft Drink Frequency2 Coke Classic Coke Classic3 Diet Coke Diet Coke4 Pepsi Dr. Pepper5 Diet Coke Pepsi-Cola6 Coke Classic Sprite7 Coke Classic8 Dr. Pepper9 Diet Coke10 Pepsi45 Pepsi46 Pepsi47 Pepsi48 Coke Classic49 Dr. Pepper50 Pepsi51 Sprite52
ASW_MBS_Primer_Web.qxd 11/1/07 1:41 PM Page 10

Microsoft Excel 2007 and Tools for Statistical Analysis 11
FIGURE 11 EXCEL WORKSHEET SHOWING THE USE OF EXCEL’S COUNTIF FUNCTIONTO CONSTRUCT A FREQUENCY DISTRIBUTION
A B C D E1 Brand Purchased Soft Drink Frequency2 Coke Classic Coke Classic �COUNTIF($A$2:$A$51,C2)3 Diet Coke Diet Coke �COUNTIF($A$2:$A$51,C3)4 Pepsi Dr. Pepper �COUNTIF($A$2:$A$51,C4)5 Diet Coke Pepsi-Cola �COUNTIF($A$2:$A$51,C5)6 Coke Classic Sprite �COUNTIF($A$2:$A$51,C6)7 Coke Classic8 Dr. Pepper9 Diet Coke10 Pepsi45 Pepsi46 Pepsi47 Pepsi48 Coke Classic49 Dr. Pepper50 Pepsi51 Sprite52
USING EXCEL ADD-INS
Excel’s Data Analysis Add-InExcel’s Data Analysis add-in, included with the basic Excel package, is a valuable tool forconducting statistical analysis. Before you can use the Data Analysis add-in it must be in-stalled. To see if the Data Analysis add-in has already been installed, click the Data tab onthe Ribbon. In the Analysis Group you should see the Data Analysis command. If you donot have an Analysis Group and/or the Data Analysis Command does not appear in theAnalysis Group, you will need to install the Data Analysis Add-In. The steps needed to in-stall the Data Analysis Add-In are as follows:
Step 1: Click the Office ButtonStep 2: Click Excel Options (on the taskbar at the bottom)Step 3: When the Excel Options dialog box appears:
Select Add-Ins from the list of options (on the pane on the left)In the Manage box, select Excel Add-Ins (in the next to last row)Click Go
A B C D E1 Brand Purchased Soft Drink Frequency2 Coke Classic Coke Classic 193 Diet Coke Diet Coke 84 Pepsi Dr. Pepper 55 Diet Coke Pepsi-Cola 136 Coke Classic Sprite 57 Coke Classic8 Dr. Pepper9 Diet Coke10 Pepsi45 Pepsi46 Pepsi47 Pepsi48 Coke Classic49 Dr. Pepper50 Pepsi51 Sprite52
ASW_MBS_Primer_Web.qxd 11/1/07 1:41 PM Page 11

Step 4: When the Add-Ins dialog box appears:Select Analysis ToolPakClick OK
Outside Vendor Add-InsOne of the leading companies in the development of Excel add-ins for statistical and deci-sion analysis is Palisade Corporation. In the third edition of our text Modern BusinessStatistics With Microsoft Excel, we use two Excel add-ins developed by Palisade: StatToolsand PrecisionTree. StatTools provides a powerful statistics toolset that enables users to per-form statistical analysis in the familiar Microsoft Office environment. And PrecisionTreeenables users to quickly develop and analyze decision trees in an Excel framework.
In the appendix to Chapter 1 of Modern Business Statistics, 3rd edition, we illustratehow to download and install the StatTools add-in and provide a brief introduction to usingthe software. In several appendices throughout the text we show how StatTools can be usedwhen no corresponding basic Excel procedure is available or when additional statistical ca-pabilities would be useful. The appendix to the decision analysis chapter of the text showshow to install and use PrecisionTree.
Typically the add-ins offered with textbooks are designed primarily for classroom use.StatTools and PrecisionTree, however, were developed for commercial applications. As aresult, students who learn how to use StatTools and PrecisionTree will be able to continueusing these products throughout their professional career.
12 Microsoft Excel 2007 and Tools for Statistical Analysis
ASW_MBS_Primer_Web.qxd 11/1/07 1:41 PM Page 12