microsoft excel 2013 enhanced - class news · pdf filemicrosoft® excel® 2013 enhanced...
TRANSCRIPT

Microsoft ® Excel® 2013 Enhanced
Tutorial 5: Working with Excel Tables,
PivotTables, and PivotCharts

XPXPXP
© 2016 Cengage Learning®. May not be scanned, copied or duplicated, or posted to a
publicly accessible website, in whole or in part.Enhanced New Perspectives on Microsoft Excel 2013 2
Objectives
• Explore a structured range of data
• Freeze rows and columns
• Plan and create an Excel table
• Rename and format an Excel table
• Add, edit, and delete records in an Excel table
• Sort data

XPXPXP
© 2016 Cengage Learning®. May not be scanned, copied or duplicated, or posted to a
publicly accessible website, in whole or in part.Enhanced New Perspectives on Microsoft Excel 2013 3
Objectives
• Filter data using filter buttons
• Filter an Excel table with a slicer
• Insert a Total row to summarize an Excel table
• Split a worksheet into two panes
• Insert subtotals into a range of data
• Use Outline buttons to show or hide details

XPXPXP
© 2016 Cengage Learning®. May not be scanned, copied or duplicated, or posted to a
publicly accessible website, in whole or in part.Enhanced New Perspectives on Microsoft Excel 2013 4
Objectives
• Create and modify a PivotTable
• Apply PivotTable styles and formatting
• Filter a PivotTable
• Insert a slicer to filter a PivotTable
• Insert a recommended pivot table
• Create a PivotChart
XPXPXP
© 2016 Cengage Learning®. May not be scanned, copied or duplicated, or posted to a
publicly accessible website, in whole or in part.Enhanced New Perspectives on Microsoft Excel 2013 5
Visual Overview:Elements of an Excel Table

XPXPXP
© 2016 Cengage Learning®. May not be scanned, copied or duplicated, or posted to a
publicly accessible website, in whole or in part.Enhanced New Perspectives on Microsoft Excel 2013 6
Visual Overview:Elements of an Excel Table

XPXPXP
© 2016 Cengage Learning®. May not be scanned, copied or duplicated, or posted to a
publicly accessible website, in whole or in part.Enhanced New Perspectives on Microsoft Excel 2013 7
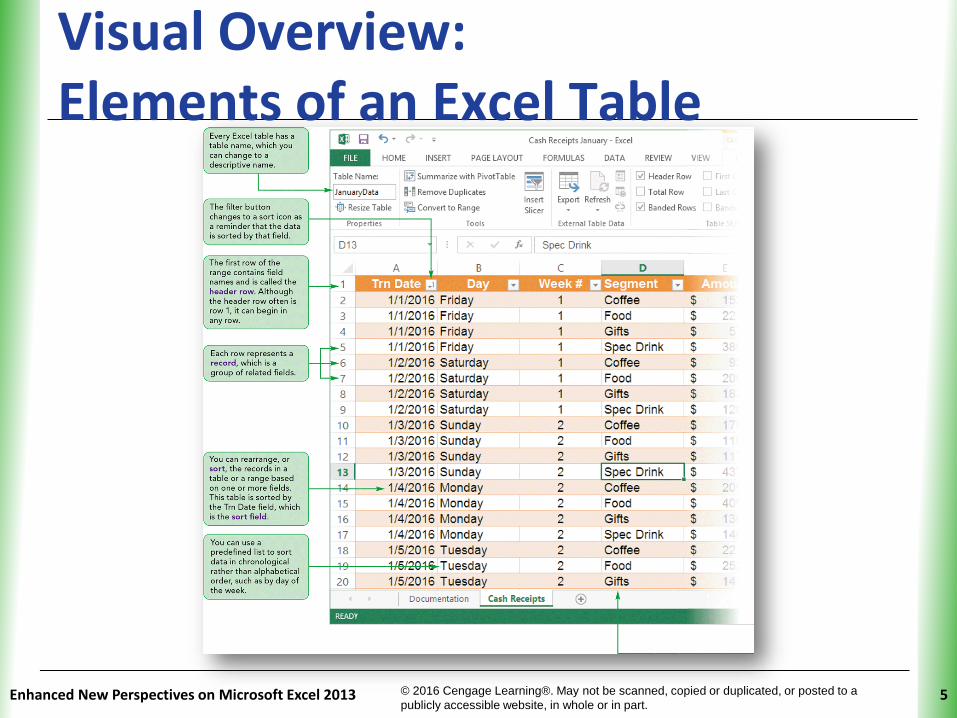
Planning a Structured Range of Data• A collection of similar data can be structured
in a range of columns and rows, representing fields and records, respectively
– Each column represents a field, which is a single piece of data
– Each row represents a record, which is a group of related fields
• A structured range of data is commonly referred to as a list or table

XPXPXP
© 2016 Cengage Learning®. May not be scanned, copied or duplicated, or posted to a
publicly accessible website, in whole or in part.Enhanced New Perspectives on Microsoft Excel 2013 8
Planning a Structured Range of Data• Data definition table
– Documentation that lists the fields to be maintained for each record and a description of the information each field will include

XPXPXP
© 2016 Cengage Learning®. May not be scanned, copied or duplicated, or posted to a
publicly accessible website, in whole or in part.
Planning a Structured Range of Data• Common operations for working with data:
– Add, edit, and delete data in the range
– Sort the data range
– Filter to display only rows that meet specified criteria
– Insert formulas to calculate subtotals
– Create summary tables based on the data in the range (usually with PivotTables)
Enhanced New Perspectives on Microsoft Excel 2013 9

XPXPXP
© 2016 Cengage Learning®. May not be scanned, copied or duplicated, or posted to a
publicly accessible website, in whole or in part.Enhanced New Perspectives on Microsoft Excel 2013 10
Planning a Structured Range of Data• Creating an Effective Structured Range of Data
– Enter field names in top row of range
– Use short, descriptive field names
– Format field names to distinguish header row from data
– Enter the same kind of data in a field
– Separate data (including header row) from other information in the worksheet by at least one blank row and one blank column

XPXPXP
© 2016 Cengage Learning®. May not be scanned, copied or duplicated, or posted to a
publicly accessible website, in whole or in part.Enhanced New Perspectives on Microsoft Excel 2013 11
Freezing Rows and Columns
• Freezing a row or column keeps headings visible as you work with data in a large worksheet

XPXPXP
© 2016 Cengage Learning®. May not be scanned, copied or duplicated, or posted to a
publicly accessible website, in whole or in part.
Creating an Excel Table
• Excel tables make it easier to identify, manage, and analyze the groups of related data
• When a structured range of data is converted into an Excel table, you see the following:
– A filter button in each cell of the header row
– The range formatted with a table style
– A sizing handle (a small triangle) in the lower-right corner of the last cell of the table
– The TABLE TOOLS DESIGN tab on the ribbon
Enhanced New Perspectives on Microsoft Excel 2013 12

XPXPXP
Enhanced New Perspectives on Microsoft Excel 2013 13
Creating an Excel Table
XPXPXP
© 2016 Cengage Learning®. May not be scanned, copied or duplicated, or posted to a
publicly accessible website, in whole or in part.Enhanced New Perspectives on Microsoft Excel 2013 14
Creating an Excel Table
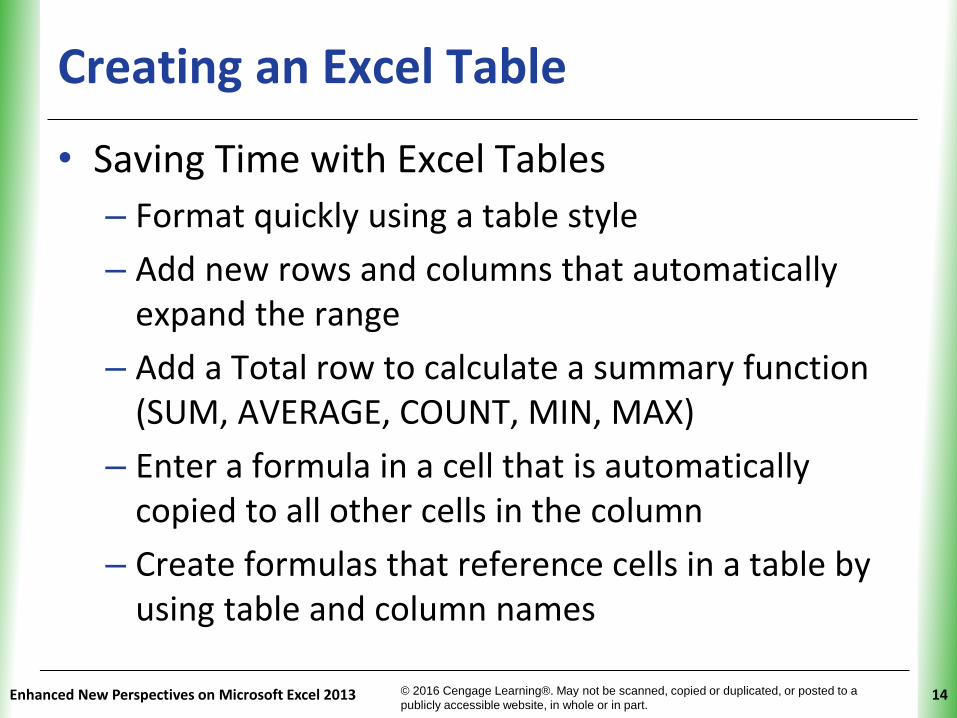
• Saving Time with Excel Tables
– Format quickly using a table style
– Add new rows and columns that automatically expand the range
– Add a Total row to calculate a summary function (SUM, AVERAGE, COUNT, MIN, MAX)
– Enter a formula in a cell that is automatically copied to all other cells in the column
– Create formulas that reference cells in a table by using table and column names

XPXPXP
© 2016 Cengage Learning®. May not be scanned, copied or duplicated, or posted to a
publicly accessible website, in whole or in part.Enhanced New Perspectives on Microsoft Excel 2013 15
Creating an Excel Table
• Renaming an Excel Table
– Each Excel table in a workbook must have a unique name
– Descriptive names make it easier to identify a table by its content
– Table names must start with a letter or an underscore but can use any combination of letters, numbers, and underscores for the rest of the name
– Table names cannot include spaces

XPXPXP
© 2016 Cengage Learning®. May not be scanned, copied or duplicated, or posted to a
publicly accessible website, in whole or in part.
Modifying an Excel Table
• Can modify an Excel table by adding or removing table elements or by changing the table’s formatting
• Can display or hide the following:
– Header row
– Total row
– First column
– Last column
– Banded rows
– Banded columns
– Filter buttons
Enhanced New Perspectives on Microsoft Excel 2013 16

XPXPXP
© 2016 Cengage Learning®. May not be scanned, copied or duplicated, or posted to a
publicly accessible website, in whole or in part.Enhanced New Perspectives on Microsoft Excel 2013 17
Maintaining Data in an Excel Table
• As you develop a worksheet with an Excel table, you may need to:
– Add new records to the table
– Find and edit existing records in the table
– Delete records from the table
• Adding Records
– Add a record in the first blank row
– Add a record in a specific location by inserting a row within the table for the new record

XPXPXP
© 2016 Cengage Learning®. May not be scanned, copied or duplicated, or posted to a
publicly accessible website, in whole or in part.
Maintaining Data in an Excel Table
• Finding and Editing Records
– You can manually scroll through the table to find a specific record
– Quicker way to locate a record is to use the Find command
– When using the Find or Replace command, it is best to start at the top of a worksheet to ensure that all cells in the table are searched
Enhanced New Perspectives on Microsoft Excel 2013 18

XPXPXP
© 2016 Cengage Learning®. May not be scanned, copied or duplicated, or posted to a
publicly accessible website, in whole or in part.
Maintaining Data in an Excel Table
• Deleting a Record
– Three ways to delete records:
• Select a cell in each record you want to delete, click the Delete button arrow in the Cells group on the HOME tab, and then click Delete Table Rows
• Delete a field by selecting a cell in the field you want to delete, clicking the Delete button arrow, and then clicking Delete Table Columns
• Use the Remove Duplicates dialog box to locate and remove records that have the same data in selected columns
Enhanced New Perspectives on Microsoft Excel 2013 19

XPXPXP
© 2016 Cengage Learning®. May not be scanned, copied or duplicated, or posted to a
publicly accessible website, in whole or in part.
Maintaining Data in an Excel Table
Enhanced New Perspectives on Microsoft Excel 2013 20
XPXPXP
© 2016 Cengage Learning®. May not be scanned, copied or duplicated, or posted to a
publicly accessible website, in whole or in part.
Sorting Data
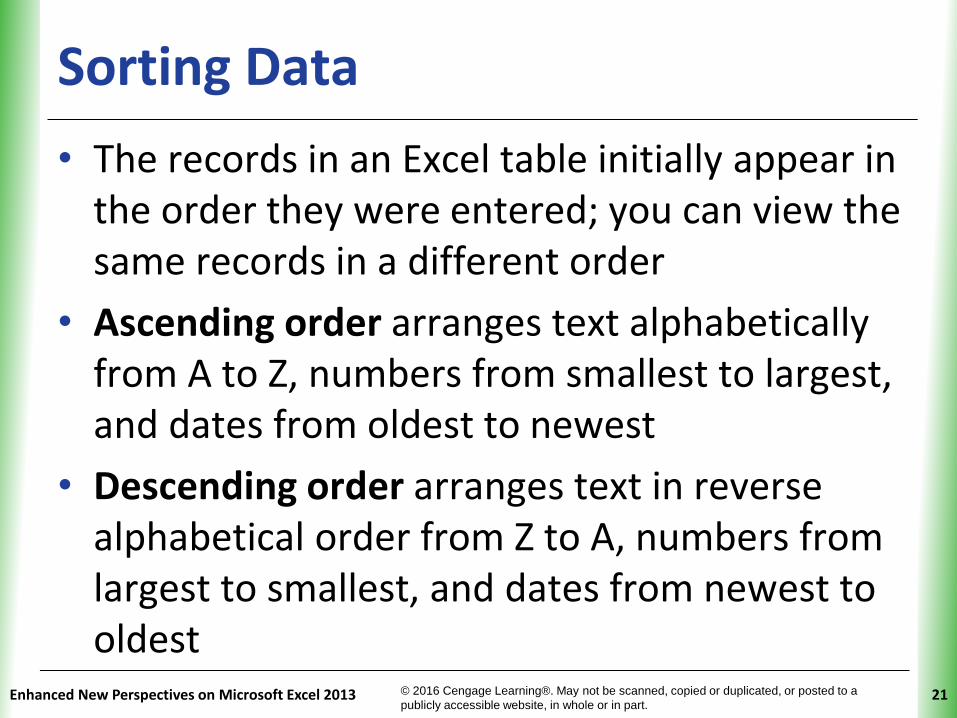
• The records in an Excel table initially appear in the order they were entered; you can view the same records in a different order
• Ascending order arranges text alphabetically from A to Z, numbers from smallest to largest, and dates from oldest to newest
• Descending order arranges text in reverse alphabetical order from Z to A, numbers from largest to smallest, and dates from newest to oldest
Enhanced New Perspectives on Microsoft Excel 2013 21

XPXPXP
© 2016 Cengage Learning®. May not be scanned, copied or duplicated, or posted to a
publicly accessible website, in whole or in part.Enhanced New Perspectives on Microsoft Excel 2013 22
Sorting Data
• Sorting One Column Using the Sort Buttons
– Use the Sort A to Z button or the Sort Z to A button to sort data quickly with one sort field

XPXPXP
© 2016 Cengage Learning®. May not be scanned, copied or duplicated, or posted to a
publicly accessible website, in whole or in part.Enhanced New Perspectives on Microsoft Excel 2013 23
Sorting Data
• Sorting Multiple Columns Using the Sort Dialog Box
– The first sort field is called the primary sort field
– The second sort is called the secondary sort field
– Up to 64 sort fields possible

XPXPXP
Enhanced New Perspectives on Microsoft Excel 2013 24
Sorting Data
XPXPXP
© 2016 Cengage Learning®. May not be scanned, copied or duplicated, or posted to a
publicly accessible website, in whole or in part.Enhanced New Perspectives on Microsoft Excel 2013 25
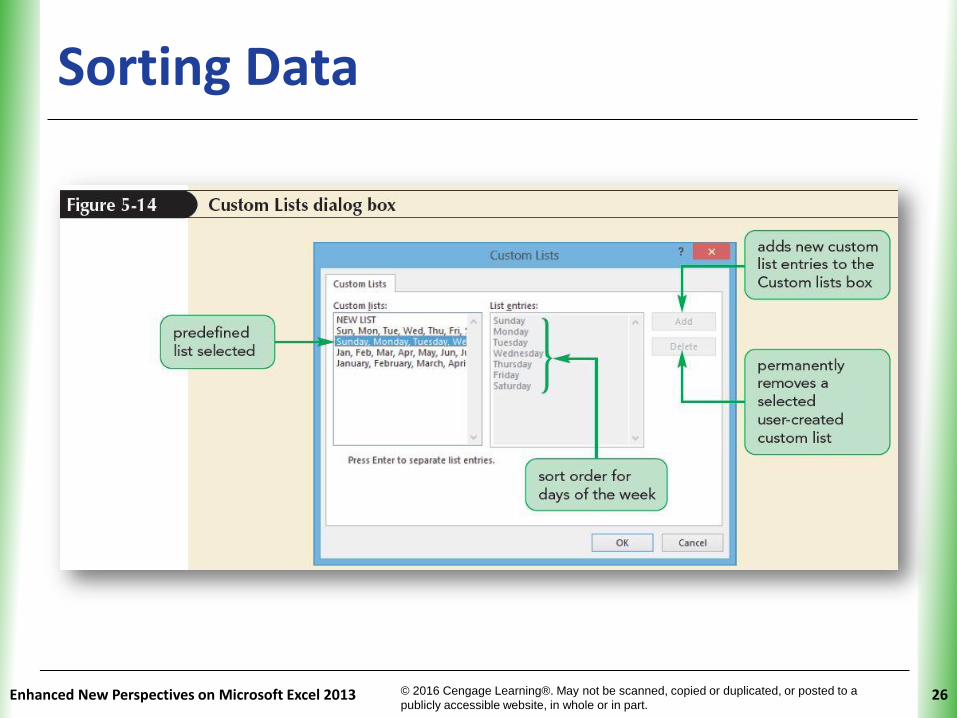
Sorting Data
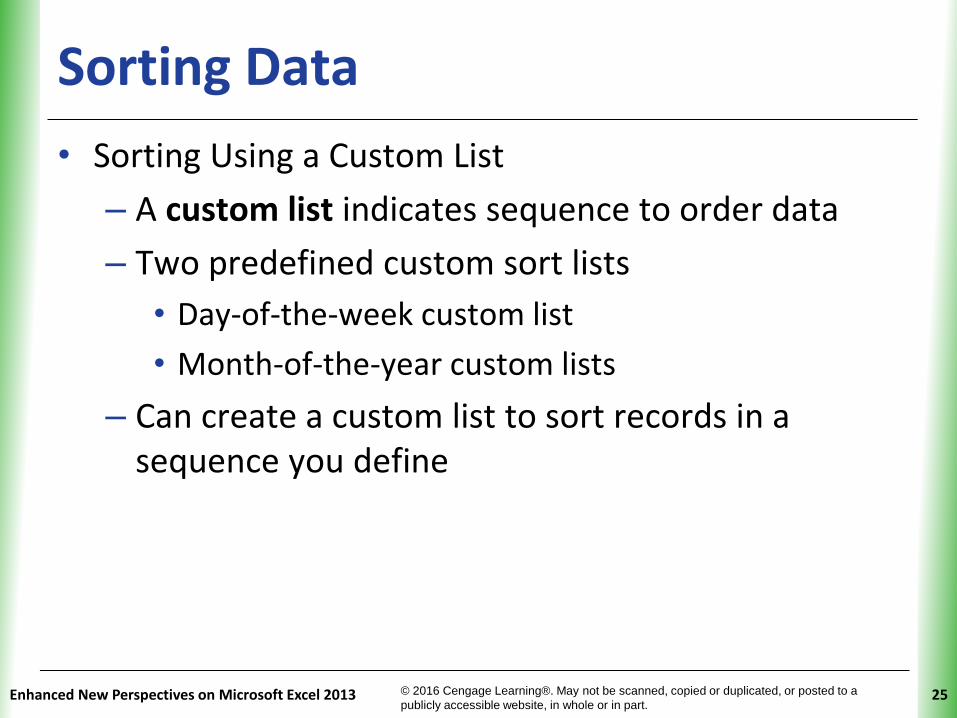
• Sorting Using a Custom List
– A custom list indicates sequence to order data
– Two predefined custom sort lists
• Day-of-the-week custom list
• Month-of-the-year custom lists
– Can create a custom list to sort records in a sequence you define
XPXPXP
© 2016 Cengage Learning®. May not be scanned, copied or duplicated, or posted to a
publicly accessible website, in whole or in part.
Sorting Data
Enhanced New Perspectives on Microsoft Excel 2013 26
XPXPXP
© 2016 Cengage Learning®. May not be scanned, copied or duplicated, or posted to a
publicly accessible website, in whole or in part.Enhanced New Perspectives on Microsoft Excel 2013 27
Visual Overview: Filtering Table Data

XPXPXP
© 2016 Cengage Learning®. May not be scanned, copied or duplicated, or posted to a
publicly accessible website, in whole or in part.Enhanced New Perspectives on Microsoft Excel 2013 28
Visual Overview: Filtering Table Data

XPXPXP
© 2016 Cengage Learning®. May not be scanned, copied or duplicated, or posted to a
publicly accessible website, in whole or in part.Enhanced New Perspectives on Microsoft Excel 2013 29
Filtering Data
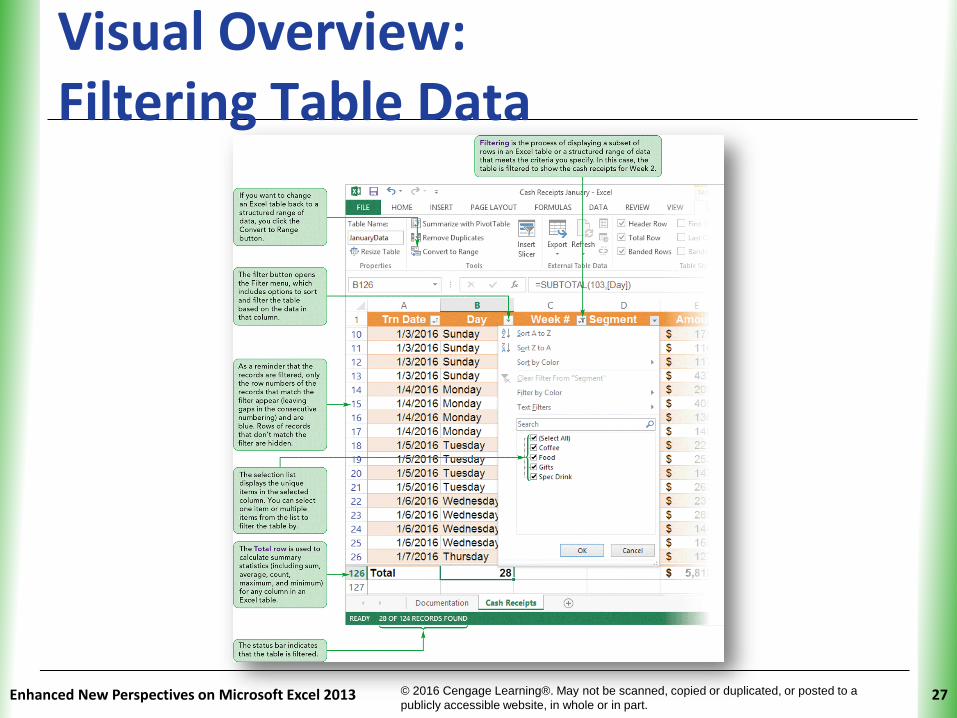
• Filtering temporarily hides any records that do not meet specified criteria
• After data is filtered, it can be:
– Sorted
– Copied
– Formatted
– Charted
– Printed

XPXPXP
© 2016 Cengage Learning®. May not be scanned, copied or duplicated, or posted to a
publicly accessible website, in whole or in part.Enhanced New Perspectives on Microsoft Excel 2013 30
Filtering Data
• Filtering Using One Column
– Click a filter button to open the Filter menu for that field
– Use options on AutoFilter menu to create three types of filters:
• By cell colors or font colors
• By a specific text, number, or date filter
• By selecting exact values

XPXPXP
Enhanced New Perspectives on Microsoft Excel 2013 31
Filtering Data

XPXPXPFiltering Data
Enhanced New Perspectives on Microsoft Excel 2013 32

XPXPXP
© 2016 Cengage Learning®. May not be scanned, copied or duplicated, or posted to a
publicly accessible website, in whole or in part.Enhanced New Perspectives on Microsoft Excel 2013 33
Filtering Data
• Filtering Using Multiple Columns
– Filter by one or more of the other columns
– Further restricts records that appear in a filtered table
– Each additional filter is applied to currently filtered data and further reduces records that are displayed

XPXPXP
© 2016 Cengage Learning®. May not be scanned, copied or duplicated, or posted to a
publicly accessible website, in whole or in part.Enhanced New Perspectives on Microsoft Excel 2013 34
Filtering Data
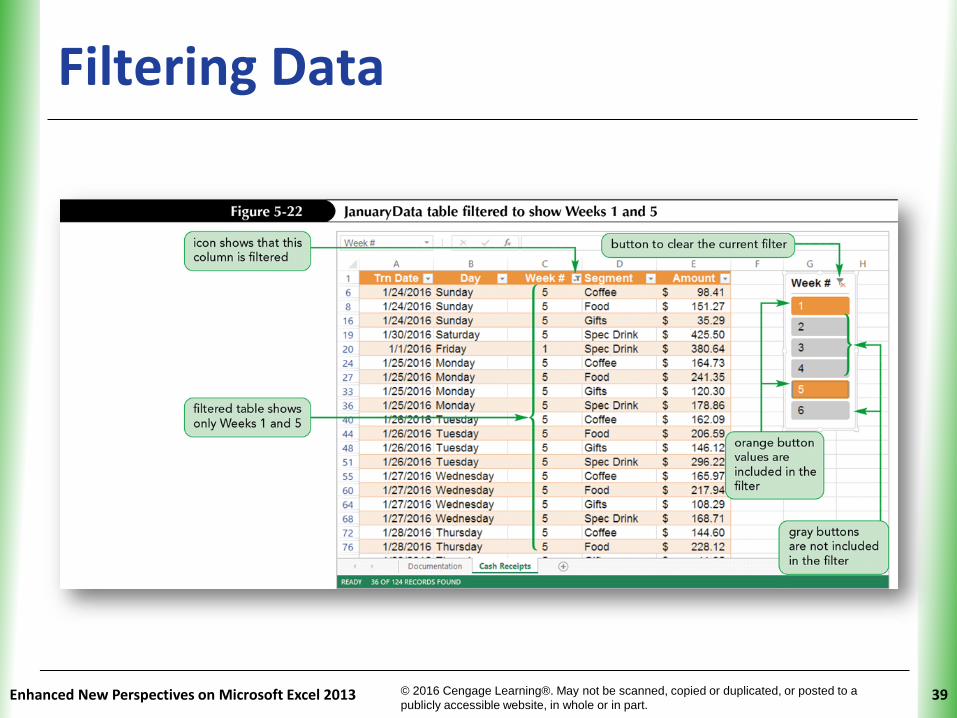
• Clearing Filters
– To redisplay all data in a filtered table, clear (or remove) the filters
– When one filter is cleared from a column, other filters are still applied
• Selecting Multiple Filter Items
– Uses the OR condition
– Requires that only one of the selected criteria be true for a record to be displayed

XPXPXP
© 2016 Cengage Learning®. May not be scanned, copied or duplicated, or posted to a
publicly accessible website, in whole or in part.Enhanced New Perspectives on Microsoft Excel 2013 35
Filtering Data
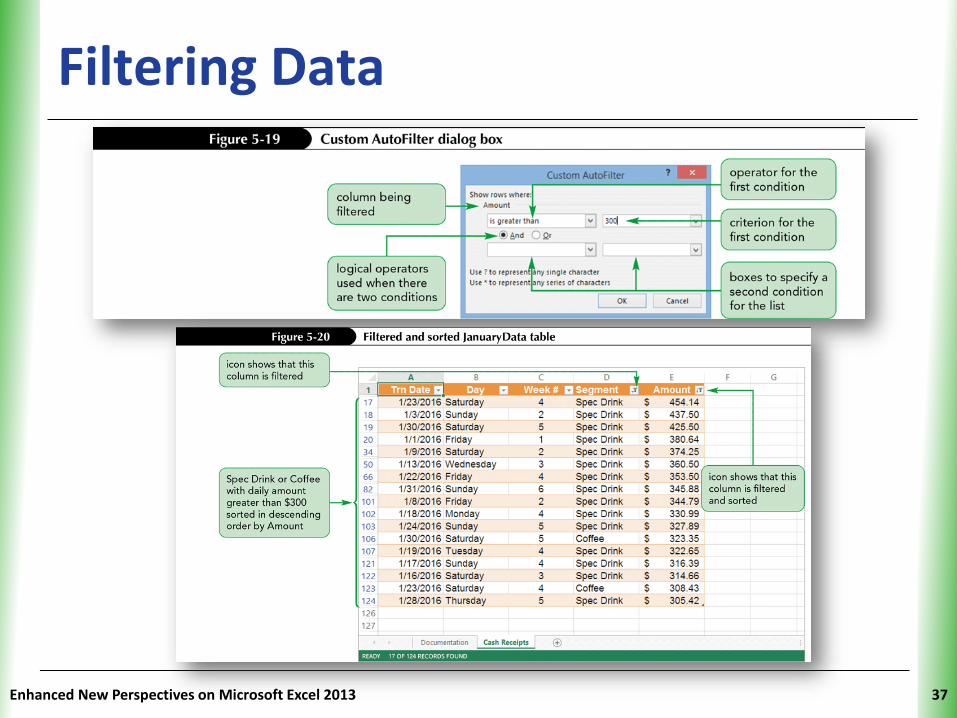
• Creating Criteria Filters to Specify More Complex Criteria
– Criteria filters enable you to specify various conditions in addition to those that are based on an “equals” criterion
– The types of criteria filters available change depending on whether the data in a column contains text, numbers, or dates

XPXPXP
© 2016 Cengage Learning®. May not be scanned, copied or duplicated, or posted to a
publicly accessible website, in whole or in part.
Filtering Data
Enhanced New Perspectives on Microsoft Excel 2013 36
XPXPXP
Enhanced New Perspectives on Microsoft Excel 2013 37
Filtering Data

XPXPXP
© 2016 Cengage Learning®. May not be scanned, copied or duplicated, or posted to a
publicly accessible website, in whole or in part.
Filtering Data
• Creating a Slicer to Filter Data in an Excel Table
– You can create one or more slicers to filter a table
– Every slicer consists of an object that contains a button for each unique value in that field
– An advantage: a slicer clearly shows what filters are currently applied
– A disadvantage: a slicer can take up a lot of space or hide data if there isn’t a big enough blank area near the table
– You can format the slicer and its buttons, changing its style, height, and width
Enhanced New Perspectives on Microsoft Excel 2013 38
XPXPXP
© 2016 Cengage Learning®. May not be scanned, copied or duplicated, or posted to a
publicly accessible website, in whole or in part.
Filtering Data
Enhanced New Perspectives on Microsoft Excel 2013 39

XPXPXP
© 2016 Cengage Learning®. May not be scanned, copied or duplicated, or posted to a
publicly accessible website, in whole or in part.Enhanced New Perspectives on Microsoft Excel 2013 40
Using the Total Row to CalculateSummary Statistics• Used to calculate summary statistics (sum,
average, count, maximum, and minimum) for any column in a table

XPXPXP
Enhanced New Perspectives on Microsoft Excel 2013 41
Using the Total Row to CalculateSummary Statistics

XPXPXP
© 2016 Cengage Learning®. May not be scanned, copied or duplicated, or posted to a
publicly accessible website, in whole or in part.Enhanced New Perspectives on Microsoft Excel 2013 42
Splitting the Worksheet Window into Panes• Easily view data from several areas of the
worksheet at the same time

XPXPXP
© 2016 Cengage Learning®. May not be scanned, copied or duplicated, or posted to a
publicly accessible website, in whole or in part.Enhanced New Perspectives on Microsoft Excel 2013 43
Inserting Subtotals
• Subtotal command
– Offers many kinds of summary information (counts, sums, averages, minimums, maximums)
– Inserts a subtotal row into range for each group of data
– Adds a grand total row below last row of data
– Cannot be used in an Excel table
– You must first convert the Excel table to a normal range

XPXPXP
© 2016 Cengage Learning®. May not be scanned, copied or duplicated, or posted to a
publicly accessible website, in whole or in part.
Inserting Subtotals
• Need to sort data so that records with the same value in a specified field are grouped together before using Subtotal command
Enhanced New Perspectives on Microsoft Excel 2013 44

XPXPXP
© 2016 Cengage Learning®. May not be scanned, copied or duplicated, or posted to a
publicly accessible website, in whole or in part.Enhanced New Perspectives on Microsoft Excel 2013 45
Inserting Subtotals
• Using the Subtotal Outline View
– Control the level of detail with buttons
• Level 3: Most detail
• Level 2: Subtotals and grand total, but not individual records
• Level 1: Only the grand total

XPXPXP
© 2016 Cengage Learning®. May not be scanned, copied or duplicated, or posted to a
publicly accessible website, in whole or in part.Enhanced New Perspectives on Microsoft Excel 2013 46
Visual Overview:PivotTable and PivotChart

XPXPXP
© 2016 Cengage Learning®. May not be scanned, copied or duplicated, or posted to a
publicly accessible website, in whole or in part.Enhanced New Perspectives on Microsoft Excel 2013 47
Visual Overview:PivotTable and PivotChart

XPXPXP
© 2016 Cengage Learning®. May not be scanned, copied or duplicated, or posted to a
publicly accessible website, in whole or in part.Enhanced New Perspectives on Microsoft Excel 2013 48
Analyzing Data with PivotTables
• When a table contains large amounts of data, it often becomes difficult to obtain a clear view of that information
• PivotTables help organize data by summarizing data into categories using functions (COUNT, SUM, AVERAGE, MAX, MIN)
• Provide ability to “pivot” the table (rearrange, hide, and display different category fields to provide alternative views of the data)

XPXPXP
© 2016 Cengage Learning®. May not be scanned, copied or duplicated, or posted to a
publicly accessible website, in whole or in part.
Creating a PivotTable
• Useful first step is plan the PivotTable layout
Enhanced New Perspectives on Microsoft Excel 2013 49

XPXPXP
© 2016 Cengage Learning®. May not be scanned, copied or duplicated, or posted to a
publicly accessible website, in whole or in part.Enhanced New Perspectives on Microsoft Excel 2013 50
Creating a PivotTable
• Use PivotTable dialog box to select data to analyze and location of the PivotTable report

XPXPXP
© 2016 Cengage Learning®. May not be scanned, copied or duplicated, or posted to a
publicly accessible website, in whole or in part.Enhanced New Perspectives on Microsoft Excel 2013 51
Creating a PivotTable
• Adding Fields to a PivotTable
– Fields that contain summary data are Values fields
– Fields that group the values in the PivotTable are Category fields
– Add fields to a PivotTable from the PivotTable Fields pane, which is divided into two sections:
• The upper section (the Fields section) lists the names of each field in the data source
• Select a field check box or drag the field into the lower section to add that field to the FILTERS, ROWS, COLUMNS, or VALUES area

XPXPXP
Enhanced New Perspectives on Microsoft Excel 2013 52
Creating a PivotTable

XPXPXP
© 2016 Cengage Learning®. May not be scanned, copied or duplicated, or posted to a
publicly accessible website, in whole or in part.
Creating a PivotTable
• Changing the Layout of a PivotTable
– You can add, remove, and rearrange fields to change the PivotTable’s layout
– After you create a PivotTable, you can view the same data in different ways
– Each time you make a change in the areas section of the PivotTable Fields pane, the PivotTable layout is rearranged
Enhanced New Perspectives on Microsoft Excel 2013 53

XPXPXP
© 2016 Cengage Learning®. May not be scanned, copied or duplicated, or posted to a
publicly accessible website, in whole or in part.Enhanced New Perspectives on Microsoft Excel 2013 54
Creating a PivotTable
• Formatting a PivotTable
– Quickly format a PivotTable report using one of the built-in styles available
– Format cells in a PivotTable the same way that you format cells in a worksheet

XPXPXP
© 2016 Cengage Learning®. May not be scanned, copied or duplicated, or posted to a
publicly accessible website, in whole or in part.Enhanced New Perspectives on Microsoft Excel 2013 55
Filtering a PivotTable
• To analyze the data in a PivotTable, you might want to show only a portion of the total data
• You can do this by filtering the PivotTable
• Adding a Field to the FILTERS Area
– Add a report filter to a PivotTable to create a filtered view of the PivotTable report
– Filter PivotTable fields to focus on a subset of items in that field

XPXPXP
© 2016 Cengage Learning®. May not be scanned, copied or duplicated, or posted to a
publicly accessible website, in whole or in part.
Filtering a PivotTable
Enhanced New Perspectives on Microsoft Excel 2013 56

XPXPXP
© 2016 Cengage Learning®. May not be scanned, copied or duplicated, or posted to a
publicly accessible website, in whole or in part.
Filtering a PivotTable
• Filtering PivotTable Fields
– Another way to filter field items in a PivotTable is using the Filter menu
• Open by clicking the Row Labels filter button or the Column Labels filter button
• Then check or uncheck items to show or hide them
Enhanced New Perspectives on Microsoft Excel 2013 57

XPXPXP
© 2016 Cengage Learning®. May not be scanned, copied or duplicated, or posted to a
publicly accessible website, in whole or in part.
Filtering a PivotTable
Enhanced New Perspectives on Microsoft Excel 2013 58

XPXPXP
© 2016 Cengage Learning®. May not be scanned, copied or duplicated, or posted to a
publicly accessible website, in whole or in part.
Filtering a PivotTable
• Creating a Slicer to Filter a PivotTable
– Another way to filter a PivotTable is with a slicer
– Can create a slicer for any field in the PivotTable Fields pane
– The slicer contains a button for each unique value in that field
– You can format the slicer and its buttons, changing its style, height, and width
– You can create more than one slicer at a time
Enhanced New Perspectives on Microsoft Excel 2013 59

XPXPXP
© 2016 Cengage Learning®. May not be scanned, copied or duplicated, or posted to a
publicly accessible website, in whole or in part.
Filtering a PivotTable
Enhanced New Perspectives on Microsoft Excel 2013 60

XPXPXP
© 2016 Cengage Learning®. May not be scanned, copied or duplicated, or posted to a
publicly accessible website, in whole or in part.
Refreshing a PivotTable
• You cannot change data directly in a PivotTable; you must edit the data source on which the PivotTable is created
• PivotTables are not updated automatically when the source data for the PivotTable is updated
• After you edit the underlying data, you must refresh, or update, the PivotTable report to reflect the revised calculations
Enhanced New Perspectives on Microsoft Excel 2013 61

XPXPXP
© 2016 Cengage Learning®. May not be scanned, copied or duplicated, or posted to a
publicly accessible website, in whole or in part.
Creating a Recommended PivotTable• The Recommended PivotTables dialog box
previews PivotTables based on the source data
• Lets you see different options so you can choose the one best meeting your needs
Enhanced New Perspectives on Microsoft Excel 2013 62

XPXPXP
© 2016 Cengage Learning®. May not be scanned, copied or duplicated, or posted to a
publicly accessible website, in whole or in part.Enhanced New Perspectives on Microsoft Excel 2013 63
Creating a PivotChart
• A PivotChart is a graphical representation of the data in a PivotTable
• Allows you to interactively add, remove, filter, and refresh data fields
• PivotCharts can have all the same formatting as other charts, including layouts and styles
• You can move and resize chart elements, or change formatting of individual data points

XPXPXP
© 2016 Cengage Learning®. May not be scanned, copied or duplicated, or posted to a
publicly accessible website, in whole or in part.
Creating a PivotChart
Enhanced New Perspectives on Microsoft Excel 2013 64

XPXPXP
© 2016 Cengage Learning®. May not be scanned, copied or duplicated, or posted to a
publicly accessible website, in whole or in part.
Creating a PivotChart
• The PIVOTCHART TOOLS contextual tabs enable you to work with and format the selected PivotChart the same way as an ordinary chart
• A PivotChart and its associated PivotTable are linked; when you modify one, the other also changes
• Can quickly display different views of the PivotChart by using the chart filter buttons on the PivotChart to filter the data
Enhanced New Perspectives on Microsoft Excel 2013 65