microstate response-time performance profiling … · microstate response-time performance...
TRANSCRIPT

Oracle Internals
Volume 4 Issue 10 January 2003Getting optimum performance for mission-critical Oracle systems is an extremely complex task. For senior Oracle DBAs, measuring internal services waits within an Oracle database is a critical aspect of advanced response-time profiling. This article is extremely complex because the internals of Oracle response-time are, by their nature, very complex. However, this article provides an excellent overview of the complex world of Oracle response-time, and a good starting point for those Oracle professionals who wish to become intimate with Oracle internal response-time mechanisms. This is not a trivial article; it may require several read-ings to fully understand the internal response-time mechanisms and the commands that are used to gather the response-time information, but it is worthwhile if your goal is to fully understand the complex interactions between Oracle and the operating system.
GoalSolving performance-related problems requires an understanding of the measurement tech-niques. The accuracy of measurements is an important factor in all types of research. How-ever, there are no 100-percent accurate measurements in Nature; there are always some distortions in the measurements. How can a method be accepted as an accurate method? The answer depends on the impact of measurement errors.
The goal of this article is to adapt microstate accounting, which is a more accurate mea-surement technique provided by OS (operating system) vendors, to database management systems (DBMSs).
Microstate Response-time Performance Profiling (MRRP) for Oracle is not a new perfor-mance modeling technique, but it is a new performance profiling technique for Oracle. It adapts microstate accounting to Oracle by using universal response time performance mod-eling.
In this article, Oracle and UNIX are used as the DBMS and OS, respectively. However, the concept can be easly adapted to other DBMS.
The following articles should be read prior to reading this article:
� “Response Time Analysis for Oracle Based Systems”1
� “Yet Another Performance Profiling (YAPP)”2
� “How Busy Is the CPU, Really?”3
� “Prying into Processes and Workloads”4
Microstate Response-time Performance Profiling (MRPP-1.0.2)Danisment Gazi Unal
From the Editor–Don Burleson
For senior Oracle DBAs, measur-ing internal waits within an Ora-cle database is a critical aspect of advanced response-time profil-ing. Entire industries have been built around the use of Oracle 10046 wait dump analysis. The internals of Oracle wait events are, by their nature, very com-plex. This article contains an excellent overview of the com-plex world of Oracle wait analy-sis and a good starting-point for those Oracle professionals who wish to become intimate with Oracle internal mechanisms. This is not a trivial article; it may require several readings to understand the internal wait mechanisms and the commands used to gather wait information. The investment is worthwhile if your goal is to fully understand the complex interactions between Oracle and the operat-ing system.
EditorDon Burlesonwww.dba-oracle.com
Adana,Turkey
� Continued on Page 2

2
Microstate Response-Time Performance Profiling (MRPP)
Measurement of Oracle Services and Waits in OS LevelMeasurement of Oracle Services in OS LevelOracle measures CPU usage by the CPU used by this ses-sion statistic. This is done via getrusage() or times() sys-tem calls depending on platforms. Exhibit 1 shows a sample output.
Oracle uses the getrusage() system call to find CPU usage in user mode(ru_utime), and CPU usage in kernel mode or system mode(ru_stime).
Measurement of Oracle Waits in OS LevelThere are three wait mechanisms in Oracle according to wait measurement techniques:
1. Synchronous wait mechanism
2. Asynchronous wait mechanism
3. Timed out wait mechanism
Synchronous Wait Mechanism. In this mechanism, after wait is requested, Oracle process is immediately put into the OS wait-queue. Until wait-event is completed, process sleeps in OS wait-queue. When wait-event is
Exhibit 1. Test Case: strace Command Output on SuSELinux 7.2/Oracle 8.1.7
19:56:05 gettimeofday({1000781765, 366717}, NULL) = 019:56:05 getrusage(RUSAGE_SELF, {ru_utime={0, 80000}, ru_stime={0, 10000}, ...}) = 019:56:05 gettimeofday({1000781765, 367403}, NULL) = 0
� Continued on Page 3
Oracle Internals Copyright 2002 CRC Press LLCJanuary 2003 All Rights Reserved
Oracle Internals
Publisher Richard O’Hanleyro’[email protected]
Consulting Editor Don [email protected]
Editor Richard O’Hanleyro’[email protected]
Project Editors Andrea DembyGerry Jaffe
Copyright©2002 Oracle Internals is a registered trademark owned by CRC Press LLC. All rights reserved. No part of this newsletter may be reproduced in any form—by microfilm, xerography, or otherwise—or incorporated into any information retrieval system without the written permission of the copyright owner.
TrademarksOracle is a registered trademark of Oracle Corp. All brand and product names in this publication are trade names, service marks, trademarks, or registered trademarks of their respective owners. Neither Auerbach Publications nor CRC Press LLC is associated with any product or vendor mentioned in this publication.
Send Information to PostmasterRichard O’Hanley Send address changes to:Auerbach Publications Oracle Internals345 Park Ave. South, 10th Floor Auerbach PublicationsNew York, NY 10010 CRC Press LLC
2000 NW Corporate Blvd. Boca Raton, FL 33431
• • • • • • • • • • • • • • • • • • • • • • • • • • • • • • • • • • • • • • • • • • • • • • • • • • • • • • • • • • • • • • • • • • • • • • • • • • • • • • • • • • • • • • • • • • • • • • • • • • • • • • • • • • • • • • • • • • • • • • • • •Oracle Internals (ISSN 1522-8584) is published monthly by Auerbach Publications, CRC Press LLC, 2000 NW Corporate Blvd., Boca Raton, FL 33431. Periodicals postage paid at Boca Raton and other mailing offices. The subscription rate is $145/year in the U.S. Prices elsewhere vary. Printed in USA. For orders call 1-800-272-7737. Requests to publish material or to incorporate material into computerized databases or any other electronic form, or for other than individual or internal distribution, should be addressed to Auerbach Publications, Editorial Services, 2000 NW Corporate Blvd., Boca Raton, FL 33431. All rights, including translation into other languages, reserved by the publisher in the U.S., Great Britain, Mexico, and all countries participating in the International Copyright Convention and the Pan American Copyright Convention. Authorization to photocopy items for internal or personal use, or the personal or internal use of specific clients, may be granted by CRC Press LLC, provided that $20.00 per article photocopied is paid directly to Copyright Clearance Center, 222 Rosewood Drive, Danvers, MA 01923 USA. The fee code for users of the Transactional Reporting Service is ISSN 1522-8584/02/$20.00+$0.00. The fee is subject to change without notice. For organizations that have been granted a photocopy license by the CCC, a separate system of payment has been arranged. Product or corporate names may be trademarks or registered trademarks, and are only used for identification and explanation, without intent to infringe.

Microstate Response-Time Performance Profiling (MRPP)
completed, OS kernel posts the waiting process and makes it runnable.
Oracle uses gettimeofday() system call before and after wait-event. The time difference between them is updated in dictionary as wait-time of event. Exhibit 2 shows a sample output.
Oracle gets time by gettimeofday() system call before and after pread() system call. The difference between them is added to wait-time of wait-event.
Some wait-events that use the synchronous wait mechanism include:
� db file scattered read� db file sequential read� SQL*Net message from client� SQL*Net message to client
V$SESSION_EVENT.TOTAL_TIMEOUTS and V$SYSTEM_EVENT.TOTAL_TIMEOUTS are always 0 for this type of wait-event.
Asynchronous Wait Mechanism. Async I/O rou-tines provide the ability to do real asynchronous I/O in an application. This is accomplished by allowing the calling process or thread to continue processing after issuing a read or write and receive notification either upon com-pletion of the I/O operation or of an error condition that prevented the I/O from being completed.7
Oracle uses the asynchronous wait mechanism in asynchronous I/O (AIO) operations. By this mechanism, process does not enter wait-queue immediately after the AIO request is submitted. So, while the AIO operation is continuing on disk, process continues its computations
on CPU. That is, service and wait can be implemented in parallel.
From an Oracle perspective, the wait-time during AIO is the actual wait-time in user level, not in OS level. The process does not start waiting immediately; it starts wait-ing if there is nothing to do on CPU.
Here are some wait-events that use the asynchronous wait mechanism if AIO is available in both Oracle and OS:
� Direct path read� Direct path write
Timed Out Wait Mechanism. In the timed-out mechanism, process does not have to wait for posting by OS kernel. Process wakes up after a specific timeout and checks if resource is available. If resource is available, process gets it; if not, process goes to sleep again. The wait-time is updated in each timeout.
Process timer information is written to OS timer queue, which includes process current timeout informa-tion. This timeout information is calculated/updated at each clock cycle by an OS-specific algorithm.
If there are a lot of timed-out based waits in a data-base, OS kernel CPU usage may become high because OS kernel calculates/updates OS timer queue.
V$SESSION_EVENT.TOTAL_TIMEOUTS and V$SYSTEM_EVENT.TOTAL_TIMEOUTS are incre-mented in each timeout.
There are two mechanisms to implement timeouts:
1. FIFO ordered timeouts2. Non-ordered timeouts
Exhibit 2. Test Case: strace Command Output on SuSELinux 7.2/Oracle 8.1.7
15:26:02.348478 gettimeofday({1003530362, 348525}, NULL) = 015:26:02.348564 gettimeofday({1003530362, 348588}, NULL) = 015:26:02.348659 pread(409,“\6\2\0\0\240\27\200\0\325\227\7\0\0\0\2\0\0\0\0\0\1\0\7\0_\f\0\0\210I\7\0\0\0\24P\2\6\3\0\30/\200\0\0\0\0\0\0\0\0\0\0\0\0\0\0\0\0\0\0\0\0\0\0\0\0\0\0\0\0\0\0\0\0\0\0\0\0\0\0\0\0\0\0\0\0\0\0\0\0\0\0\1\236\0\0\0N\1\354\3R\6R\6\0\0\236\0\1\0\2\0\3\0\4\0\5\0”...,2048, 12386304) = 204815:26:02.348995 gettimeofday({1003530362, 349035}, NULL) = 015:26:02.349174 gettimeofday({1003530362, 349209}, NULL) = 015:26:02.349260 write(6, “WAIT #1: nam=\'db file sequential read\' ela= 0 p1=2 p2=6048 p3=1”, 63) = 6315:26:02.349341 write(6, “\n”, 1) = 1
Copyright 2002 CRC Press LLC Oracle InternalsAll Rights Reserved January 2003 3

4
Microstate Response-Time Performance Profiling (MRPP)
The FIFO (first-in, first-out) ordered timeout mechanism is used by wait-events that need serializations. This mech-anism uses the semaphore facilities of OS. Semaphore operations include hardware-based atomic instructions to protect critical sections in source code, and processes are queued in FIFO order in semaphore operations.
Before waiting, process sets OS alarm clock (normally three seconds, but changes according to wait events) using setitimer() system call. When timeout occurs, a SIGALRM signal is delivered by OS to waiting process. If a SIGALRM signal is received by a waiting process and resource is not still available, OS alarm clock is set again for that process, so timer is restarted; if resource is avail-able, timer is switched off using setitimer() system call and process gets resource.
FIFO ordered timeouts are postable. That means waiting process can be posted by OS kernel before time-out occurs. This mechanism has the pseudo code shown in Exhibit 3.
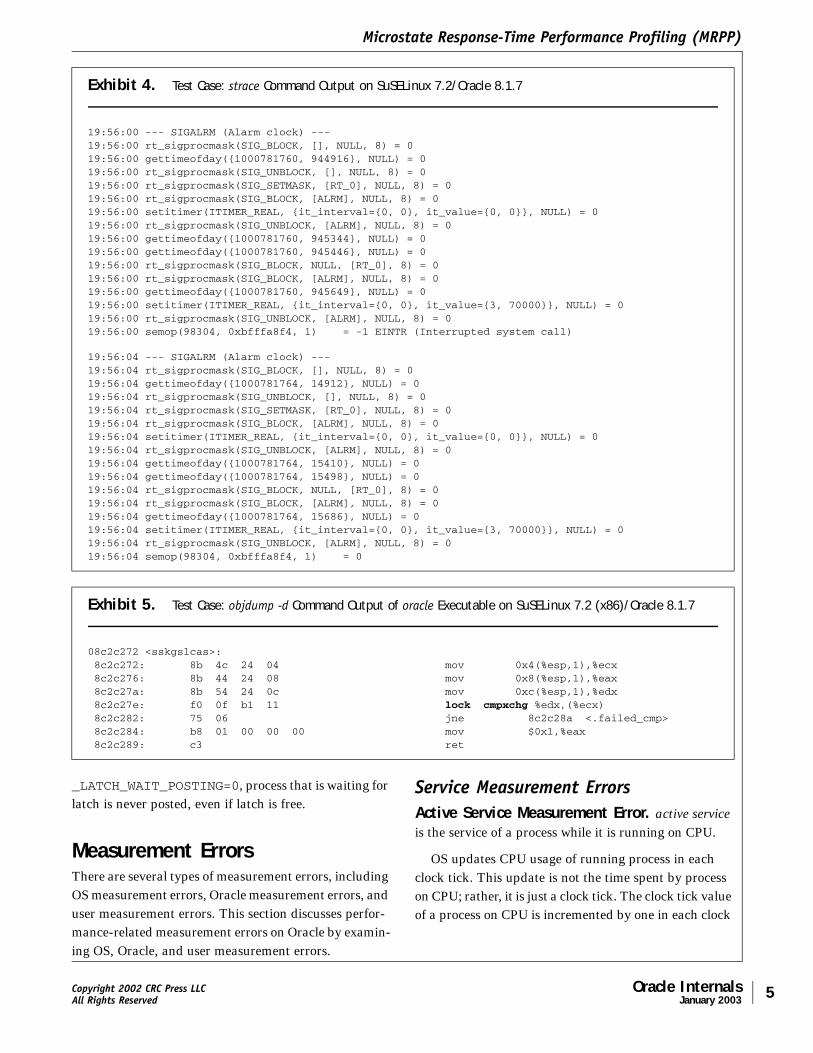
Here are the system calls of a process while waiting for locked resources in enqueue (TX) wait-event. As seen in Exhibit 4, there is a loop running around each three seconds.
Some wait-events that use FIFO ordered timeouts wait mechanism include:
� Free buffer waits� Write complete waits� Buffer busy waits� Enqueue
A non-ordered timeout mechanism is used by wait-event which requires timeout mechanism without an order. A latch free wait event uses non-ordered timeouts. Because latch operations do not need to be done in FIFO
order, there is no need for a semaphore queue for latch free wait-event. Atomic instructions such as test-and-set, compare-and-swap, etc. are sufficient, instead of expen-sive semaphore operations. That is why Oracle does not use semaphores in latch operations.
Exhibit 5 lists some assembly codes. The function sskgslcas ( ) includes a compare-and-swap instruc-tion called lock cmpxchg.
The lock prefix invokes a locked (atomic) read-mod-ify-write operation when modifying a memory operand.6
If a process tries to get a latch in willing-to-wait mode, it spins CPU by _SPIN_COUNT times on multi-processor systems. If _SPIN_COUNT is greater than 1 on single-processor machines, it is ignored.
If a process cannot get latch after spinning, it sleeps by using select() system call. The select() system call can measure timeout values down to microseconds.
As seen in Exhibit 6, Oracle does not use file descriptors in select() to check if there is available data for file descrip-tors. Just the <timeout> value is used. By using select() sys-tem call in this way, select() system call causes sleep until <timeout> occurs unless process is interrupted by a signal.
There are two mechanisms to implement non-ordered timeouts:
1. Postable non-ordered timeouts
2. Non-postable non-ordered timeouts
If _LATCH_WAIT_POSTING=1, which is the default, waiting process can be interrupted for library cache and shared pool latches only, and gets these latches. If _LATCH_WAIT_POSTING>1, waiting process can be interrupted for all latches, and gets latches. If
Exhibit 3. Pseudo Code for FIFO Ordered Timeouts Wait Mechanism
while (resource_not_available) { setitimer(); if (semop()==0) break; // if TRUE resource is available, // otherwise sleeps by using semaphore if (SIGALRM) // signal handling { if (resource_is_available) break; } }
Oracle Internals Copyright 2002 CRC Press LLCJanuary 2003 All Rights Reserved
Microstate Response-Time Performance Profiling (MRPP)
_LATCH_WAIT_POSTING=0, process that is waiting for latch is never posted, even if latch is free.
Measurement ErrorsThere are several types of measurement errors, including OS measurement errors, Oracle measurement errors, and user measurement errors. This section discusses perfor-mance-related measurement errors on Oracle by examin-ing OS, Oracle, and user measurement errors.
Service Measurement ErrorsActive Service Measurement Error. active service is the service of a process while it is running on CPU.
OS updates CPU usage of running process in each clock tick. This update is not the time spent by process on CPU; rather, it is just a clock tick. The clock tick value of a process on CPU is incremented by one in each clock
Exhibit 4. Test Case: strace Command Output on SuSELinux 7.2/Oracle 8.1.7
19:56:00 --- SIGALRM (Alarm clock) ---19:56:00 rt_sigprocmask(SIG_BLOCK, [], NULL, 8) = 019:56:00 gettimeofday({1000781760, 944916}, NULL) = 019:56:00 rt_sigprocmask(SIG_UNBLOCK, [], NULL, 8) = 019:56:00 rt_sigprocmask(SIG_SETMASK, [RT_0], NULL, 8) = 019:56:00 rt_sigprocmask(SIG_BLOCK, [ALRM], NULL, 8) = 019:56:00 setitimer(ITIMER_REAL, {it_interval={0, 0}, it_value={0, 0}}, NULL) = 019:56:00 rt_sigprocmask(SIG_UNBLOCK, [ALRM], NULL, 8) = 019:56:00 gettimeofday({1000781760, 945344}, NULL) = 019:56:00 gettimeofday({1000781760, 945446}, NULL) = 019:56:00 rt_sigprocmask(SIG_BLOCK, NULL, [RT_0], 8) = 019:56:00 rt_sigprocmask(SIG_BLOCK, [ALRM], NULL, 8) = 019:56:00 gettimeofday({1000781760, 945649}, NULL) = 019:56:00 setitimer(ITIMER_REAL, {it_interval={0, 0}, it_value={3, 70000}}, NULL) = 019:56:00 rt_sigprocmask(SIG_UNBLOCK, [ALRM], NULL, 8) = 019:56:00 semop(98304, 0xbfffa8f4, 1) = -1 EINTR (Interrupted system call)
19:56:04 --- SIGALRM (Alarm clock) ---19:56:04 rt_sigprocmask(SIG_BLOCK, [], NULL, 8) = 019:56:04 gettimeofday({1000781764, 14912}, NULL) = 019:56:04 rt_sigprocmask(SIG_UNBLOCK, [], NULL, 8) = 019:56:04 rt_sigprocmask(SIG_SETMASK, [RT_0], NULL, 8) = 019:56:04 rt_sigprocmask(SIG_BLOCK, [ALRM], NULL, 8) = 019:56:04 setitimer(ITIMER_REAL, {it_interval={0, 0}, it_value={0, 0}}, NULL) = 019:56:04 rt_sigprocmask(SIG_UNBLOCK, [ALRM], NULL, 8) = 019:56:04 gettimeofday({1000781764, 15410}, NULL) = 019:56:04 gettimeofday({1000781764, 15498}, NULL) = 019:56:04 rt_sigprocmask(SIG_BLOCK, NULL, [RT_0], 8) = 019:56:04 rt_sigprocmask(SIG_BLOCK, [ALRM], NULL, 8) = 019:56:04 gettimeofday({1000781764, 15686}, NULL) = 019:56:04 setitimer(ITIMER_REAL, {it_interval={0, 0}, it_value={3, 70000}}, NULL) = 019:56:04 rt_sigprocmask(SIG_UNBLOCK, [ALRM], NULL, 8) = 019:56:04 semop(98304, 0xbfffa8f4, 1) = 0
Exhibit 5. Test Case: objdump -d Command Output of oracle Executable on SuSELinux 7.2 (x86)/Oracle 8.1.7
08c2c272 <sskgslcas>: 8c2c272: 8b 4c 24 04 mov 0x4(%esp,1),%ecx 8c2c276: 8b 44 24 08 mov 0x8(%esp,1),%eax 8c2c27a: 8b 54 24 0c mov 0xc(%esp,1),%edx 8c2c27e: f0 0f b1 11 lock cmpxchg %edx,(%ecx) 8c2c282: 75 06 jne 8c2c28a <.failed_cmp> 8c2c284: b8 01 00 00 00 mov $0x1,%eax 8c2c289: c3 ret
Copyright 2002 CRC Press LLC Oracle InternalsAll Rights Reserved January 2003 5

6
Microstate Response-Time Performance Profiling (MRPP)
tick. Whether or not running on CPU is not important. If process is on CPU but waits for an event such as fetching from memory, then clock tick is assigned to process.
When Oracle uses getrusages() system call, getru-sages() converts tick numbers to time by dividing tick numbers by HZ value of OS. A typical HZ value is 100 ticks per second, which means a typical clock tick rate is 10 milliseconds (ms) per tick.
This method causes some measurement errors called active service measurement errors. Exhibit 7 shows the measurement error samples.
Measurement errors include:
� Phase 1: process runs 5 ms. It starts after clock tick 0 and relinquishes CPU before clock tick 1. When clock tick 1 occurs, OS kernel will not be able to update process CPU usage because pro-cess is not running on CPU.
• Result: process CPU time, which is 5 ms, was lost.
� Phase 2: process runs 5 ms. It starts before clock tick 2 and relinquishes CPU before clock tick 3. When clock tick 2 occurs, this clock tick is assigned to current running process. This means that the tick number of current running process is incre-mented by one. Because each clock tick is 10 ms, process CPU usage is incremented by 10 ms.
• Result: although process CPU time is 5 ms, 10 ms are measured. CPU time was measured higher.
� Phase 3: process runs 15 ms. It starts before clock tick 4 and relinquishes CPU before clock tick 5. When clock tick 4 occurs, this clock tick is assigned to current running process. That is, the tick num-ber of current running process is incremented by one. Because each clock tick is 10 ms, process CPU usage is incremented by 10 ms. The process keeps
Exhibit 6. Test Case: strace Command Output on SuSELinux 7.2/Oracle 8.1.7
16:56:07.107143 gettimeofday({1003708567, 107165}, NULL) = 016:56:07.107199 gettimeofday({1003708567, 107221}, NULL) = 016:56:07.107251 gettimeofday({1003708567, 107271}, NULL) = 016:56:07.107525 gettimeofday({1003708567, 107585}, NULL) = 016:56:07.107698 select(0, [], [], [], {0, 10001}) = 0 (Timeout)16:56:07.172634 gettimeofday({1003708567, 172688}, NULL) = 016:56:07.172787 gettimeofday({1003708567, 172815}, NULL) = 016:56:07.172866 write(6, “WAIT #1: nam=\'latch free\' ela= 7 p1=1343645620 p2=66 p3=0”, 57) = 5716:56:07.172955 write(6, “\n”, 1) = 1
Exhibit 7. CPU Measurement Errors
10 ms 10 ms 10 ms 10 ms 10 ms
Clo
ck ti
ck 0
Clo
ck ti
ck 1
Clo
ck ti
ck 2
Clo
ck ti
ck 3
Clo
ck ti
ck 4
Clo
ck ti
ck 5
Measured: 00 msReal: 05 ms
Measured: 10 msReal: 05 ms
Measured: 10 msReal: 15 ms
5 ms 5 ms 15 ms
Phase 1 Phase 2 Phase 3
Oracle Internals Copyright 2002 CRC Press LLCJanuary 2003 All Rights Reserved

Microstate Response-Time Performance Profiling (MRPP)
running after clock tick 4, and this remaining time is not measured because process relinquishes CPU before clock tick 5.
• Result: although process CPU time is 15 ms, 10 ms are measured. CPU time was measured lower.
The error is minimal at high usage levels, but ranges up to 80 percent or more at low levels. The problem is that usage is underreported, and the range of error increases on faster CPUs. At a real usage level of 5 per-cent busy, one will often see vmstat reporting that the system is only 1 percent busy.3
Active Wait Measurement Errors. When a process runs in OS perspective, but it seems like a wait in user perspective, that process is in active wait. There are two types of active waits in Oracle:
1. Latch-spinning
2. Wait-loop
Because the time spent for these operations is included in service time, it may cause measurement errors. This type of error is called an active wait measurement error.
Spinning time is included in the CPU used by this ses-sion statistic. That is, although process is waiting in user perspective, the time spent in spinning is included in both OS perspective and Oracle perspective. This means that latch-spinnings are seen as if running.
Oracle wait-events wake up in a loop for wait-events that implement timed out wait mechanism until they get resources. This loop occupies CPU.
Exhibit 8 shows a sample enqueue (TX) wait-event of DELETE operation. Most CPU usage in a wait-loop is done in kernel mode. There is little time spent in user mode (see Exhibit 9).
CPU used by this session is updated after DELETE statement is completed, and this statistic also includes time spent in CPU during wait-loop. That is, CPU used by this session includes CPU usage although process is waiting.
Exhibit 8. Test Case: SuSELinux 7.2/Oracle 8.1.7 and strace Command for OS Side
TIME STATISTICS BEFORE DELETE OPERATION:
In Oracle side:
SID NAME VALUE---------- ---------------------------------------------- ---------- 9 CPU used when call started 1 9 CPU used by this session 1 9 OS User time used 5 9 OS System time used 14 rows selected.
In OS side:
21:19:57.303910 getrusage(RUSAGE_SELF, {ru_utime={0, 50000}, ru_stime={0, 10000}, ...}) = 0
A SNAPSHOT OF TIME STATISTICS IN WAIT-LOOP:
In Oracle side:
SID NAME VALUE---------- --------------------------------------------- ---------- 9 CPU used when call started 1 9 CPU used by this session 1 9 OS User time used 15 9 OS System time used 1144 rows selected.
In OS side:
22:36:18.468218 getrusage(RUSAGE_SELF, {ru_utime={0, 150000}, ru_stime={1, 140000}, ...}) = 0
Copyright 2002 CRC Press LLC Oracle InternalsAll Rights Reserved January 2003 7

8
Microstate Response-Time Performance Profiling (MRPP)
Exhibit 10 shows a sample enqueue wait-event of the DELETE operation. As seen, the wait-loop impact increases while enqueued sessions are increased. Here are the interpretations for the following timed terms:
� Average wait-loop elapsed time
� Average wait-loop CPU time� Average wait-loop utilization� Average wait-loop impact in system level
Wait-loop elapsed time shows the approximate time spent in wait-loops. It includes time spent of all possible
Exhibit 9. Time Statistics after DELETE Operation
In Oracle side:
SID NAME VALUE---------- --------------------------------------------- ---------- 9 CPU used when call started 1 9 CPU used by this session 124 9 OS User time used 15 9 OS System time used 1144 rows selected.
In OS side:
22:36:33.101442 getrusage(RUSAGE_SELF, {ru_utime={0, 150000}, ru_stime={1, 140000}, ...}) = 0
Exhibit 10. Test Case: 766 MHz SuSELinux 7.2/Oracle 8.1.7
Total sessions: 10
Enqueued sessions: 1
Vmstat:
procs memory swap io system cpur b w swpd free buff cache si so bi bo in cs us sy id0 0 0 30664 9628 1164 78580 0 0 0 8 103 84 0 0 100Wait-loop impact per session: 1.670 ms
Total sessions: 60
Enqueued sessions: 51
Vmstat:
procs memory swap io system cpur b w swpd free buff cache si so bi bo in cs us sy id0 0 0 57240 1396 520 45552 0 0 0 4 102 106 0 1 99Wait-loop impact per session: 1.688 ms
Total sessions: 210
Enqueued sessions: 202
Vmstat:
procs memory swap io system cpur b w swpd free buff cache si so bi bo in cs us sy id0 0 1 248948 1504 476 37776 0 0 0 12 110 187 1 5 94Wait-loop impact per session: 1.752 ms
Oracle Internals Copyright 2002 CRC Press LLCJanuary 2003 All Rights Reserved

Microstate Response-Time Performance Profiling (MRPP)
events in wait-loops, such as CPU usage, OS activities such page faults, context switches, etc.
Exhibit 11 shows a wait-loop that has average values. The first instruction starts at 14:38:24.736238, and the last instruction (semop) starts at 14:38:24.737990. The time difference between them is 0.001752 seconds, equal to 1.752 ms wall-clock time. This is an average value and does not include time spent in the semop() system call. So, the average wait-loop elapsed time is 1.752 ms.
Exhibit 12 shows a CPU usage summary of wait-loop system calls that has average values. There are 13 semop() system calls. Because each loop includes one semop() system call, there are 13 loops in this sample. It was found that the kernel mode is predominantly used in wait-loops. So, the time spent in system calls can be approximately accepted as the average wait-loop CPU time. Thus, the average wait-loop CPU time = 0.000443/13 = 0.034 ms.
Wait-loop utilization = 100* (average wait-loop CPU usage) / (average wait-loop elapsed time)
= 100 * (0,034/1.752)
= 1.94%
The wait-loop utilization is too low. This means that most of the time in the wait-loop was spent in OS-specific tasks such as page faults, context switches, etc. These OS tasks were recorded to enqueue wait-event by Oracle.
The wait-loop impact may be small in session level. However, it becomes larger when the number of sessions increases. For example:
wait-loop impact in system level = (wait-loop impact per session) * (average timed out sessions)
= 1.752 ms * (202)
= 353,904 ms
= 0.354 sec
Because enqueue timeout normally occurs every three seconds in this test case, there will be 0.354 seconds total
Exhibit 11. Wait-Loop System Calls
14:38:24.736238 --- SIGALRM (Alarm clock) ---14:38:24.736782 rt_sigprocmask(SIG_BLOCK, [], NULL, 8) = 014:38:24.736937 gettimeofday({944433504, 736967}, NULL) = 014:38:24.737007 rt_sigprocmask(SIG_UNBLOCK, [], NULL, 8) = 014:38:24.737091 rt_sigprocmask(SIG_SETMASK, [RT_0], NULL, 8) = 014:38:24.737183 rt_sigprocmask(SIG_BLOCK, [ALRM], NULL, 8) = 014:38:24.737269 setitimer(ITIMER_REAL, {it_interval={0, 0}, it_value={0, 0}}, NULL) = 014:38:24.737341 rt_sigprocmask(SIG_UNBLOCK, [ALRM], NULL, 8) = 014:38:24.737428 gettimeofday({944433504, 737452}, NULL) = 014:38:24.737531 gettimeofday({944433504, 737562}, NULL) = 014:38:24.737610 rt_sigprocmask(SIG_BLOCK, NULL, [RT_0], 8) = 014:38:24.737699 rt_sigprocmask(SIG_BLOCK, [ALRM], NULL, 8) = 014:38:24.737779 gettimeofday({944433504, 737806}, NULL) = 014:38:24.737844 setitimer(ITIMER_REAL, {it_interval={0, 0}, it_value={3, 70000}}, NULL) = 014:38:24.737912 rt_sigprocmask(SIG_UNBLOCK, [ALRM], NULL, 8) = 014:38:24.737990 semop(98304, 0xbfffa5c4, 1) = -1 EINTR (Interrupted system call)
Exhibit 12. CPU Usage Summary of Wait-Loop System Calls
oracle@linux:~/test5 > strace -p 714 -tt -c% time seconds usecs/call calls errors syscall------ ----------- ----------- --------- --------- ---------------- 52.82 0.000234 2 109 rt_sigprocmask 22.57 0.000100 2 55 gettimeofday 21.67 0.000096 3 28 setitimer 2.93 0.000013 1 13 13 semop------ ----------- ----------- --------- --------- ----------------100.00 0.000443 205 13 total
Copyright 2002 CRC Press LLC Oracle InternalsAll Rights Reserved January 2003 9

10
Microstate Response-Time Performance Profiling (MRPP)
wait-loop impact every three seconds. This means that the total wait-loop impact will be increased every three seconds. Because time spent in wait-loops is recorded as relevant Oracle wait-events, it distorts Oracle wait-events.
Wait Measurement ErrorsInactive Wait Measurement Errors. If a running process is stopped by Oracle process itself, its called pro-cess is in inactive wait. Sleeping during inactive waits is controlled by Oracle. That is, inactive waits are Oracle wait-events.
If a process completes its waiting or wait-timeout occurs, it does not get the CPU immediately. It is put into the ready (runnable) queue first. Then, when a CPU is assigned, the process is determined by CPU Scheduler. Operations from taking the process from wait-queue to assigning the CPU to a process are done by OS kernel.
When an Oracle process gets CPU, it updates its wait-time. This wait-time includes wait-time in wait-queue, wait-time in ready (runnable) queue, preemption latency time, context switch time, and any operations such as swapping, paging etc. during Oracle waits. This means there are some other operations included in Oracle waits. Time spent in these non-Oracle operations are called inac-tive wait measurement errors. Inactive wait measurement errors make Oracle waits distorted and overvalued.
Exhibit 13 shows a sample measurement error. An Ora-cle process slept 1 centisecond (10,001 microseconds) on wait-queue by select() system call. After getting CPU, pro-cess measured elapsed time by gettimeofday() system call (7 centiseconds) and updated the latch sleep time by 7 cen-tiseconds. However, this is the total time and includes latch-sleep time in wait-queue, wait-time in the ready (runnable) queue, preemption latency time, and context
switch time. In fact, the time spent in latch-sleep was 1 centisecond. Other rounded 6 centiseconds were caused by other components of the system, not by Oracle latch.
If there are bottlenecks in CPUs, the number of pro-cesses in ready (runnable) queue increases. This mani-fests as if problems are in Oracle wait-events.
Inactive Service Measurement Errors. If a run-ning process is stopped by OS kernel, its called process is in inactive service. A running process can be stopped by OS for preempting, swapping, paging, etc.
Sleeping during inactive services are not controlled by Oracle. Oracle processes do not know this state. Time spent in inactive services is called an inactive service measurement error. This error is not included in Oracle waits. In other words, it is missed.
Recurring Waits. If a wait-event occurs for the same resource in multiple sessions at the same time,it is called arecurring wait. Adding up the time spent in each wait-event to total wait-time may give distorted results.5
For example, let a log switch completion take 2 seconds. If five processes wait for log file switch completion wait-event at the same time through these 2 seconds,the total time spent in the log file switch completion wait-event will be 5 × 2 = 10 seconds. But, in fact, it takes 2 seconds in system.
The log file switch completion wait-event is a recur-ring wait-event because it occurs one time in system level, but recurrs multiple times in session level.
Exhibit 14 shows the recurring wait measurement errors. While the number of sessions increases, cumulative measurements may be distorted. Average waits per session
Exhibit 13. Test Case: strace Command Output on SuSELinux 7.2/Oracle 8.1.7
16:56:07.107143 gettimeofday({1003708567, 107165}, NULL) = 016:56:07.107199 gettimeofday({1003708567, 107221}, NULL) = 016:56:07.107251 gettimeofday({1003708567, 107271}, NULL) = 016:56:07.107525 gettimeofday({1003708567, 107585}, NULL) = 016:56:07.107698 select(0, [], [], [], {0, 10001}) = 0 (Timeout)16:56:07.172634 gettimeofday({1003708567, 172688}, NULL) = 016:56:07.172787 gettimeofday({1003708567, 172815}, NULL) = 016:56:07.172866 write(6, “WAIT #1: nam=\'latch free\' ela= 7 p1=1343645620 p2=66 p3=0”, 57) = 5716:56:07.172955 write(6, “\n”, 1) = 1
Oracle Internals Copyright 2002 CRC Press LLCJanuary 2003 All Rights Reserved

Microstate Response-Time Performance Profiling (MRPP)
may not give correct measurements because wait-times among sessions may not be distributed uniformly. That is, the reponse time performance modeling is not a proper model in system level. Also, a system should be a serial system for response time calculation; that is, the wait-time should not include service time and service time should not include wait-time. Both service time and wait-time must be separate.
Microstate AccountingMicrostate accounting, on the other hand, takes a high-resolution timestamp on every state change, every system call, every page fault, and every scheduler change.4
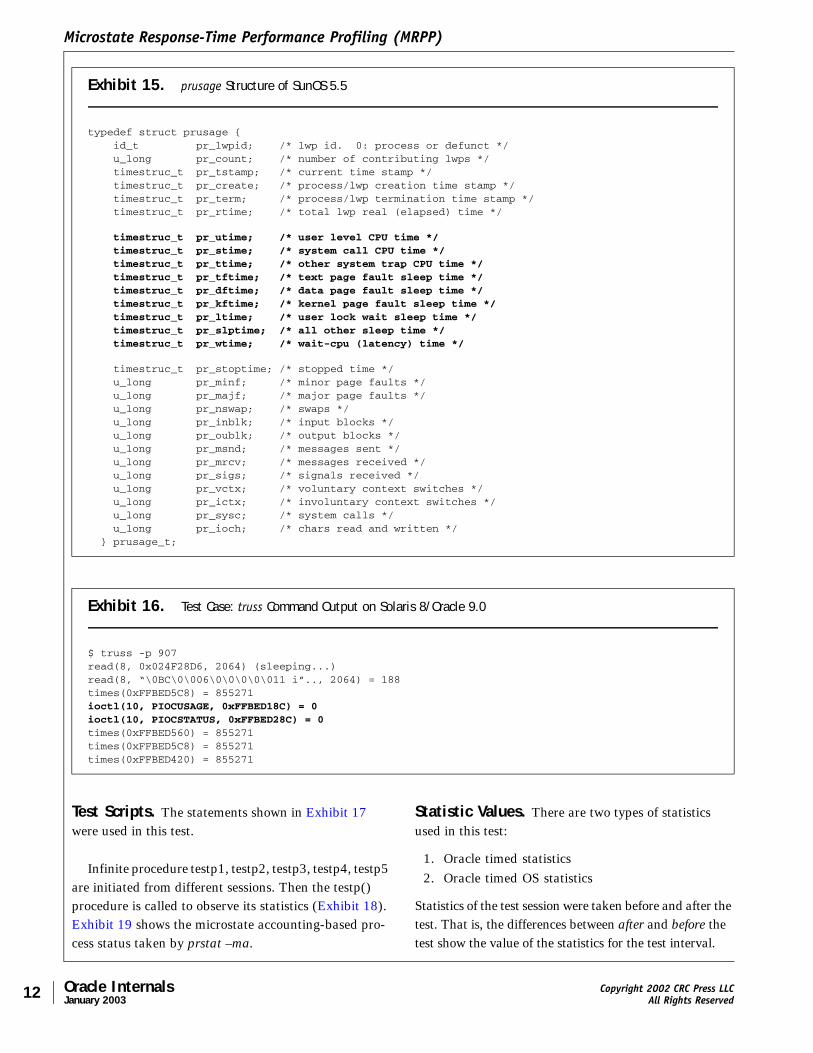
The prusage structure of SunOS 5.5 (Exhibit 15) shows the resource usage structure used in microstate accounting. As seen in this structure, more detailed and accurate time information is measured than that pro-vided by getrusage(), times(), and gettimeofday() system calls. By this mechanism it is possible to see the time spent in several system components.
Oracle and Microstate AccountingIf the OS does not support microstate accounting, Oracle cannot support it. Exhibit 16 shows some system calls generated by the Oracle process when TIMED_OS_ STATISTICS is set. The ioctl() calls are used with the
parameter of PIOCUSAGE. If TIMED_OS_STATISTICS is set 0, ioctl() disappears.
Applying PIOCUSAGE to a process that does not have microstate accounting enabled will enable microstate accounting and return an estimate of time spent in the various states up to this point. Further invocations of PIOCUSAGE will yield accurate microstate time account-ing from this point.4
This means that Oracle uses microstate accounting for the following timed OS statistics for this test case:
� OS User level CPU time� OS System call CPU time� OS Other system trap CPU time� OS Text page fault sleep time� OS Data page fault sleep time� OS Kernel page fault sleep time� OS User lock wait sleep time� OS All other sleep time� OS Wait-cpu (latency) time
Correcting Oracle Measurement ErrorsTest EnvironmentOS and Database. There are two types of statistics used in this test:
1. Statistics obtained from Oracle timed statistics2. Statistics obtained from Oracle timed OS statistics:
a. Database: Oracle 9.0 EEb. OS: Solaris 8 with two CPUsc. Process architecture: dedicated server
Exhibit 14. Recurring Waits Measurement Errors
Log file switch completion
Session 1
Session n - 1
Session n
t seconds
Real wait: t seconds
Recurring wait: [0, n * t] seconds
time
Copyright 2002 CRC Press LLC Oracle InternalsAll Rights Reserved January 2003 11
12
Microstate Response-Time Performance Profiling (MRPP)
Test Scripts. The statements shown in Exhibit 17 were used in this test.
Infinite procedure testp1, testp2, testp3, testp4, testp5 are initiated from different sessions. Then the testp() procedure is called to observe its statistics (Exhibit 18). Exhibit 19 shows the microstate accounting-based pro-cess status taken by prstat –ma.
Statistic Values. There are two types of statistics used in this test:
1. Oracle timed statistics2. Oracle timed OS statistics
Statistics of the test session were taken before and after the test. That is, the differences between after and before the test show the value of the statistics for the test interval.
Exhibit 15. prusage Structure of SunOS 5.5
typedef struct prusage { id_t pr_lwpid; /* lwp id. 0: process or defunct */ u_long pr_count; /* number of contributing lwps */ timestruc_t pr_tstamp; /* current time stamp */ timestruc_t pr_create; /* process/lwp creation time stamp */ timestruc_t pr_term; /* process/lwp termination time stamp */ timestruc_t pr_rtime; /* total lwp real (elapsed) time */
timestruc_t pr_utime; /* user level CPU time */ timestruc_t pr_stime; /* system call CPU time */ timestruc_t pr_ttime; /* other system trap CPU time */ timestruc_t pr_tftime; /* text page fault sleep time */ timestruc_t pr_dftime; /* data page fault sleep time */ timestruc_t pr_kftime; /* kernel page fault sleep time */ timestruc_t pr_ltime; /* user lock wait sleep time */ timestruc_t pr_slptime; /* all other sleep time */ timestruc_t pr_wtime; /* wait-cpu (latency) time */
timestruc_t pr_stoptime; /* stopped time */ u_long pr_minf; /* minor page faults */ u_long pr_majf; /* major page faults */ u_long pr_nswap; /* swaps */ u_long pr_inblk; /* input blocks */ u_long pr_oublk; /* output blocks */ u_long pr_msnd; /* messages sent */ u_long pr_mrcv; /* messages received */ u_long pr_sigs; /* signals received */ u_long pr_vctx; /* voluntary context switches */ u_long pr_ictx; /* involuntary context switches */ u_long pr_sysc; /* system calls */ u_long pr_ioch; /* chars read and written */ } prusage_t;
Exhibit 16. Test Case: truss Command Output on Solaris 8/Oracle 9.0
$ truss -p 907read(8, 0x024F28D6, 2064) (sleeping...)read(8, “\0BC\0\006\0\0\0\0\011 i”.., 2064) = 188times(0xFFBED5C8) = 855271ioctl(10, PIOCUSAGE, 0xFFBED18C) = 0ioctl(10, PIOCSTATUS, 0xFFBED28C) = 0times(0xFFBED560) = 855271times(0xFFBED5C8) = 855271times(0xFFBED420) = 855271
Oracle Internals Copyright 2002 CRC Press LLCJanuary 2003 All Rights Reserved

Microstate Response-Time Performance Profiling (MRPP)
Exhibit 17. Test Script
### A table named test created.
connect dunal/dunal;create table test(f1 number);### There are initially 8192 rows which have the value of –1.
### The following 5 procedures were created. So that, they never caused a lock### and they did infinite loop to make CPU busy when they were called.
create or replace procedure testp1 isbegin loop insert into test values(1); delete test where f1=1; commit; end loop;end;/
create or replace procedure testp2 isbegin loop insert into test values(2); delete test where f1=2; commit; end loop;end;/
create or replace procedure testp3 isbegin loop insert into test values(3); delete test where f1=3; commit; end loop;end;/
create or replace procedure testp4 isbegin loop insert into test values(4); delete test where f1=4; commit; end loop;end;/
create or replace procedure testp5 isbegin loop insert into test values(5); delete test where f1=5; commit; end loop;end;/
### The following procedure was created to observe its statistics.### It loops 5000 times and then exits.
Copyright 2002 CRC Press LLC Oracle InternalsAll Rights Reserved January 2003 13

14
Microstate Response-Time Performance Profiling (MRPP)
Exhibit 17. Test Script (continued)
connect www/wwwcreate or replace procedure testp isbegin for i in 1 .. 5000 loop insert into dunal.test values(0); delete dunal.test where f1=0; commit; end loop;end;/
Exhibit 18. Running the Test Procedures
Session# Commands Explanation
1 connect dunal/dunal
exec testp1; Runs infinite procedure testp1
2 connect dunal/dunal
exec testp2; Runs infinite procedure testp2
3 connect dunal/dunal
exec testp3; Runs infinite procedure testp3
4 connect dunal/dunal
exec testp4; Runs infinite procedure testp4
5 connect dunal/dunal
exec testp5; Runs infinite procedure testp5
6 connect www/www
exec testp; Runs procedure testp in order to observe its statistics
Exhibit 19. Microstate Accounting-Based Process Status Taken by prstat –ma
PID USERNAME USR SYS TRP TFL DFL LCK SLP LAT VCX ICX SCL SIG PROCESS/NLWP1011 oracle 17 0.0 0.0 0.0 0.0 0.0 5.9 78 9 63 374 0 oracle/11093 oracle 16 0.0 0.0 0.0 0.0 0.0 8.9 75 8 70 393 0 oracle/11070 oracle 16 0.0 0.0 0.0 0.0 0.0 5.9 78 8 75 397 0 oracle/11091 oracle 16 0.0 0.0 0.0 0.0 0.0 5.7 78 7 69 426 0 oracle/11030 oracle 16 0.0 0.0 0.0 0.0 0.0 8.6 76 8 69 396 0 oracle/11050 oracle 14 0.0 0.0 0.0 0.0 0.0 12 73 7 59 287 0 oracle/1 839 oracle 0.1 0.3 0.0 0.0 0.0 0.0 100 0.0 20 0 203 0 prstat/11099 oracle 0.1 0.0 0.0 0.0 0.0 0.0 100 0.0 5 2 90 5 se.sparcv9.5/1 975 oracle 0.0 0.1 0.0 0.0 0.0 80 18 1.3 452 67 699 8 oracle/11 977 oracle 0.0 0.0 0.0 0.0 0.0 82 18 0.1 18 8 1K 0 oracle/11 952 oracle 0.0 0.0 0.0 0.0 0.0 0.0 100 0.0 5 0 10 0 script/11096 oracle 0.0 0.0 0.0 0.0 0.0 0.0 100 0.1 5 0 11 0 script/1 346 root 0.0 0.0 - - - - 100 - 2 0 75 1 mibiisa/12 971 oracle 0.0 0.0 0.0 0.0 0.0 0.0 100 0.0 6 0 22 0 oracle/1 643 oracle 0.0 0.0 0.0 0.0 0.0 0.0 100 0.0 4 1 26 1 httpd/4 NPROC USERNAME SIZE RSS MEMORY TIME CPU 40 oracle 2937M 2125M 97% 0:53.16 97% 37 root 104M 67M 3.0% 0:00.01 0.1% 1 daemon 2488K 1712K 0.1% 0:00.00 0.0%
Total: 78 processes, 261 lwps, load averages: 5.16, 4.91, 4.64
Oracle Internals Copyright 2002 CRC Press LLCJanuary 2003 All Rights Reserved

Microstate Response-Time Performance Profiling (MRPP)
Some of the statistics used later are marked with a number in parentheses. The statistics in Exhibit 20 are obtained when TIMED_STATISTICS=TRUE.
The statistics in Exhibit 21 are obtained when TIMED_OS_STATISTICS=1. These statistics are obtained by Oracle using microstate accounting kernel calls. These statistics will be accepted as accurate statis-tics and will be compared with Oracle timed statistics to compute measurement errors.
Correcting Service Measurement ErrorsFormulas for Correcting Service Measurement Errors. Exhibit 22 shows service time components. Ora-cle service time also includes active wait measurement errors.
The formula for the total service time in OS level is:
total_service_time_in_OS = real_Oracle_service_time_ in_OS
+ active_wait_measurement_errors
Exhibit 20. TIMED_STATISTICS=TRUE
Statistic Before After Elapsed
CPU used by this session 0.03 201.36 201.33
total_service_time_in_Oracle (1a) 201.33
SQL*Net message to client 0.00 0.00 0.00
SQL*Net message from client 0.20 176.67 176.47
latch free (1d) — 1.26 1.26
buffer busy waits — 260.54 260.54
log file sync — 0.00 0.00
db file sequential read — 0.20 0.20
db file scattered read — 0.31 0.31
total_wait_time_in_Oracle (1b) 438.78
total elapsed time 640.11
Exhibit 21. TIMED_OS_STATISTICS=1
Statistics Before After Elapsed
OS User level CPU time 0.05 19865 198.60
OS System call CPU time 0.06 0.65 0.59
OS Other system trap CPU time 0.00 0.14 0.14
total_service_time_in_OS (2a) 199.33
OS Text page fault sleep time 0.00 0.00 0.00
OS Data page fault sleep time 0.00 0.00 0.00
OS Kernel page fault sleep time 0.00 0.00 0.00
OS User lock wait sleep time (2c) 0.00 0.00 0.00
OS All other sleep time (2e) 0.01 289.27 289.26
OS Wait-cpu (latency) time (2d) 0.00 955.65 955.65
total_wait_time_in_OS (2b) 1,244.91
total elapsed time 1,444.24
Copyright 2002 CRC Press LLC Oracle InternalsAll Rights Reserved January 2003 15

16
Microstate Response-Time Performance Profiling (MRPP)
The formula for service measurement errors is:
service_measurement_errors = | total_service_time_in_Oracle (1a)
– real_Oracle_service_time_in_OS |
total_service_time_in_OS is the total time of all services in Oracle timed OS statistics. It can also be found by the following formula:
total_service_time_in_OS = OS User level CPU time
+ OS System call CPU time+ OS Other system trap CPU time
= total_service_time_in_OS (2a)
active_wait_measurement_errors is the service time spent in active waits, and real_Oracle_ service_time_in_OS indicates the real service time of Oracle process after isolating active wait measurement errors.
Applying Formulas to Services. Active wait-time depends on the timeout values of wait-events (see Exhibit 23). Timeout occurred for the latch free (1d) wait-event only. It is just 17 timeouts. Also, there is no timeout value for other wait-events. This means that there are no active wait CPU usages for other wait-events.
Normally, it is not possible to measure latch spinning time. But, in the test, there is no high amount of latch free wait-events in the system level, so it is expected that there will be no high amount of latch spinning available in this test. If it is expected to be high, it would not be possible to isolate the active wait-time of latch free from service time.
Because latch spinning is expected to be low, latch timeout is very small and timeout values of other events are zero: active_wait_measurement_errors is accepted as 0 for this test.
To find real_Oracle_service_time_in_OS:
total_service_time_in_OS = real_Oracle_service_time_in_OS
+ active_wait_measurement_errors
Exhibit 22. Service Time Components
Exhibit 23. Timeout Values of Wait Events
Statistic Before After Timeout
SQL*Net message to client 0 0 0
SQL*Net message from client 0 0 0
Latch free (1d) — 17 17
buffer busy waits — 0 0
log file sync — 0 0
db file sequential read — 0 0
db file scattered read — 0 0
Total 17
time
total_service_time_in_OS
real_Oracle_service_time_in_OS active_wait_measurement_errors
Oracle Internals Copyright 2002 CRC Press LLCJanuary 2003 All Rights Reserved

Microstate Response-Time Performance Profiling (MRPP)
total_service_time_in_OS (2a) = real_Oracle_service_time_in_OS
+ active_wait_measurement_errors
real_Oracle_service_time_in_OS
= 199.33 – 0
= 199.33 seconds
To find service_measurement_errors, the following for-mula returns the impact of service measurement errors:
service_measurement_errors
= | total_service_time_in_Oracle (1a) – real_Oracle_service_time_in_OS |
= | 201.33 – 199.33 |
= 2 seconds
Exhibit 24 shows the graph which includes service time measured by Oracle timed statistic and service time com-puted by formula. The service measurement error is min-imal. This confirms the rule that “CPU measurement error is minimal at high usage levels”3 because the test is is done at high CPU usages. If active_wait_ measurement_errors was not ignored, this rule would not be applicable because it would not be possible to isolate active_ wait_measurement_errors from total_service_time_in_OS.
Correcting Wait Measurement ErrorsExhibit 25 shows wait-time components: inactive_wait_measurement_errors is assigned to Oracle waits and inactive_service_ measurement_errors is missed by Oracle.
The formula for the total wait-time in OS level is:
total_wait_time_in_OS = real_Oracle_wait_time_in_OS
+ inactive_wait_measurement_errors+ inactive_service_measurement_errors
The total_wait_time_in_OS is the total time of all waits in Oracle timed OS statistics. It can also be found from the following formula:
total_wait_time_in_OS = OS Text page fault sleep time
+ OS Data page fault sleep time+ OS Kernel page fault sleep time+ OS User lock wait sleep time+ OS All other sleep time+ OS Wait-cpu (latency) time
= total_wait_time_in_OS (2b)
real_Oracle_wait_time_in_OS indicates the real wait-time of Oracle process after isolating wait measure-ment errors.
Exhibit 24. Service Time Measured by Oracle Timed Statistic and Service Time Computed by Formula
0
50
100
150
200
250
Real OracleService Time
in OS
Total Service Timein Oracle
(1a)
Copyright 2002 CRC Press LLC Oracle InternalsAll Rights Reserved January 2003 17

18
Microstate Response-Time Performance Profiling (MRPP)
real_Oracle_wait_time_in_OS
= OS User lock wait sleep time (2c)
+ OS All other sleep time (2e)
inactive_wait_measurement_errors is the non-Oracle wait-time assigned to Oracle. That is, it shows the distorted wait-time included in Oracle waits.
The difference between the total wait-time measured in Oracle timed statistics and the real wait-time mea-sured in Oracle timed OS statistics gives the minumum distorted wait-time assigned to Oracle. It is called “minu-mum” because there may be other non-Oracle-related sleeps in OS All other sleep time.
Min. inactive_wait_measurement_errors
= total_wait_time_in_Oracle –
real_Oracle_wait_time_in_OS
inactive_service_measurement_errors is the wait-time that cannot be measured by Oracle. That is, it shows the wait-time missed by Oracle.
The difference between the total wait-time measured in Oracle timed OS statistics and the total wait-time measured in Oracle timed statistics gives the maximum wait-time missed by Oracle. It is called “maximum” because there may be other non-Oracle-related sleeps in OS All other sleep time.
Max. inactive_service_measurement_errors
= total_wait_time_in_OS –
total_wait_time_in_Oracle
Applying Formulas to Waits. To find real_Oracle_wait_time_in_OS:
real_Oracle_wait_time_in_OS
= OS User lock wait sleep time (2c) + OS All othersleep time (2e)
= 0.00 + 289.26= 289.26 seconds
To find Min. inactive_wait_measurement_errors:
Min. inactive_wait_measurement_errors= total_wait_time_in_Oracle (1b) –
real_Oracle_wait_time_in_OS= 438.78 – 289.26= 149.52 seconds assigned to Oracle waits
Exhibit 26 depicts the graph, which includes the statis-tics in this formula. The difference between them gives the wait distortions assigned to Oracle.
To find Max. inactive_service_measurement_errors:
Max. inactive_service_measurement_errors= total_wait_time_in_OS(2b) –
total_wait_time_in_Oracle (1b)= 1,244.91 – 438.78= 806.13 seconds missed by Oracle
Exhibit 27 shows the graph, which includes the statistics in this formula. The difference between them gives the wait misses that cannot be measured by Oracle.
Exhibit 25. Wait Time Components
time
real_Oracle_wait_time_in_OS
total_wait_time_in_Oracle
total_wait_time_in_OS
inactive_wait_measurement_errors
inactive_service_measurement_errors
Oracle Internals Copyright 2002 CRC Press LLCJanuary 2003 All Rights Reserved

Microstate Response-Time Performance Profiling (MRPP)
Breaking Down Wait Measurement Errors to Timed OS Statistics. Because elapsed time for all OS waits, except OS Wait-cpu (latency) time, are zero, the wait distortions assigned to Oracle come from OS Wait-cpu (latency) time (see Exhibit 28).
Wait Distortion Ratios. Normally, it is not possible to find wait distortions for individual Oracle wait-events,
but it is possible to find overall wait distortion for Oracle ratios. If a wait-event predominantly sleeps in real_ Oracle_wait_time_in_OS, there is a low probabil-ity of wait distortion error because it is already accounted for in Oracle. That is why there are two formulas to find the wait distortion ratio:
1. Distortion ratio with ignorable Oracle waits
2. Distortion ratio with all Oracle waits
Exhibit 26. The Difference: Wait Distortions Assigned to Oracle
Exhibit 27. The Difference: Wait Misses that Cannot Be Measured by Oracle
0
100
200
300
400
500
Real OracleWait Timein OS (2e)
Total Wait Timein Oracle
(1b)
0
300
600
900
1200
1500
Total Wait Timein Oracle (1b)
Total Wait Timein OS (2b)
Copyright 2002 CRC Press LLC Oracle InternalsAll Rights Reserved January 2003 19

20
Microstate Response-Time Performance Profiling (MRPP)
Exhibit 29 shows the number of calls of Oracle wait events.
In this test, the SQL*Net message from client wait-event is the idle form of the SQL*Net message from client wait-event because it is waited in the SQL*Net message from cli-ent wait-event before starting the test script. So, sleep time in this wait-event is predominantly included in the OS All other sleep time statistic. That is, it has predominantly no wait distortions, so it is ignored (see Exhibit 30).
Min. ratio_for_inactive_wait_measurement_errors= 100 * (Min. inactive_wait_measurement_errors
/ total_non_idle_wait_time_in_Oracle (3a))= 100 * (149.52 / 262.31)= 57%
If the SQL*Net message from client wait-event is a non-idle form of the SQL*Net message from client wait-event, it will not be possible to ignore them easily. For example, high amounts of waits enter ready (runnable)
queue frequently and cause wait distortions. So, some of its wait-time will be included in the OS Wait-cpu (latency) time. In that case, the following formula should be used:
Min. ratio_for_inactive_wait_measurement_errors
= 100 * (Min. inactive_wait_measurement_errors
/ total_wait_time_in_Oracle (1b))
Exhibit 28. Breaking Down Wait Measurement Errors to Timed OS Statistics
Statistics Elapsedinactive_wait_ measurement_errors
inactive_service_ measurement_errors
OS Text page fault sleep time 0.00 0.00 0.00
OS Data page fault sleep time 0.00 0.00 0.00
OS Kernel page fault sleep time 0.00 0.00 0.00
OS Wait-cpu (latency) time (2d) 955.65 149.52 806.13Total
Exhibit 29. Number of Calls of Oracle Wait Events
Statistic Before After Call
SQL*Net message to client 38 39 1
SQL*Net message from client (idle) 37 38 1
latch free — 18 18
buffer busy waits — 2622 2622
log file sync — 2 2
db file sequential read — 1187 1187
db file scattered read — 1064 1064
Total 4895
Exhibit 30. non_idle_wait_time_in_Oracle (3a)
Statistic Elapsed
SQL*Net message to client 0.00
latch free 1.26
buffer busy waits 260.54
log file sync 0.00
db file sequential read 0.20
db file scattered read 0.31
total_non_idle_wait_time_in_Oracle (3a) 262.31
Oracle Internals Copyright 2002 CRC Press LLCJanuary 2003 All Rights Reserved

Microstate Response-Time Performance Profiling (MRPP)
Overall Impact of Measurement ErrorsExhibit 31 shows the overall measurement errors. There are significant amounts of time missed by Oracle. Also, there are significant amounts of distorted wait-time assigned to Oracle wait-events. There is no significant amount of measurement in service time because it is min-imal at high usage level3 and there is no high amount of active_wait_measurement_errors.
Microstate Response-Time Performance Profiling (MRPP)Decision TreeUsing the correct modeling is the most important part of problem solving. If there is a problem, there is a cause of the problem. Deductive decision tree takes users to solu-tion by constructing cause-consequence relationships tree.
Exhibit 32 shows a combined Deductive-Inductive tree. Suppose that Circle A is a symptom of the problem. It is located at the root of the tree. Circles C1, C2, and C3 are the leaves. One of them is the cause of the problem, say C1. How can the cause of the problem (C1) be reached?
There are two walking ways in this tree: deductive (downward) and inductive (upward). In the deductive method, root is broken into sub-components. Components
are broken down repeatedly until the component that is the cause of problem is found. If a component does not have an effect on the problem, the breaking process is stopped on that component, but continues on other com-ponents. If the cause of the problem is found, the break-ing process is stopped. The component on which the breaking process is finally stopped is the cause of prob-lem. The path from root to solution component is called solution path or critical path.
In this method, the possibility of reaching the cause of the problem is 100 percent because if there is a problem, there is a cause; and finding the possibility of the cause of the problem is 100 percent by going backward from the symptom (root) to causes (components). For Exhibit 32, path (A,B2,C1) is the solution path (or the critical path).
In the inductive method, root is reached by combining components. That is, the symptom (root) is reached by assuming that the possible causes (components) are the starting point. In this method, finding the cause of prob-lem is not 100 percent because possible starting compo-nents may not be the real cause of the problem, or possible starting components may not be known yet. This method is similar to the Test-and-See method, and it wastes time. As a result, a Deductive Solution tree should be used in problem solving by walking from root to leaves.
Exhibit 31. Overall Measurement Errors
0
200
400
600
800
1000
ServiceMeasurement
Errors
Inactive WaitMeasurement
Errors
Inactive ServiceMeasurement
Errors
Copyright 2002 CRC Press LLC Oracle InternalsAll Rights Reserved January 2003 21

22
Microstate Response-Time Performance Profiling (MRPP)
If problem-solving modeling wants to be accurate modeling, it must be compatible with deductive model-ing.
Applying MRPP to OracleExhibit 33 shows the components of the Deductive Response-Time Decision tree having all the components
of response time. Exhibit 33 used microstate accounting in Solaris; other systems that provide microstate accounting may use different fields for their events, but the concept is the same.
Each leaf on the tree is located at a particular depth, or level. Walking on the tree should start from the root of tree, which is the response time, and it should be broken
Exhibit 32. Deductive-Inductive Decision Tree
Exhibit 33. Deductive Response-Time Decision Tree
A
B1 B2 B3
C1 C2 C3Deductive Inductive
B2 is a component of A, root of C1.
response
service wait
activeservice
activewait
inactivewait
inactiveservice
Usermode
Systemcalls
Systemtraps
Text pagefault sleep
Data pagefault sleep
Kernel pagefault sleep
User lockwait sleep
Wait-cpu(latency)
All othersleep
recursivestatement
userstatement
latchspinningparse execute fetch latch
spinningwaitloop parse execute fetch wait
loop
Oracle Internals Copyright 2002 CRC Press LLCJanuary 2003 All Rights Reserved

Microstate Response-Time Performance Profiling (MRPP)
down to its sub-components (e.g., service time and wait time). High impact components (e.g., service time) should be broken down into sub-components (e.g., parse, fetch, execute); low impact component (e.g., wait time) should be ignored. This walking on tree process should be continued until the problem is found. Because all components are more accurately available in the tree, it is easy to find the cause of the problem.
MRPP offers some parameters and formulas for sev-eral layers. Although some of these parameters may be merged into single parameters by the provider, this arti-cle shows all possible parameters.
LevelsHigh response time is a symptom of a performance prob-lem. Thus, it is the root of deductive tree. Each leaf at the same depth has the same level. The root of the tree is level 0. Its components and sub-components are levels 1, 2, 3, 4, 5, and OSD.
Level 0
response_time = service_time + wait_time
� response_time: time spent on completing a unit of work, including waits.
� service_time: time spent on CPU while ser-vicing in system perspective.
� wait_time: time spent while waiting in system perspective.
Level 1
service_time = active_service_time + active_wait_time
wait_time = inactive_wait_time + inactive_service_time
All statistics starting with “active” imply that they are running on CPU. All statistics starting with “inactive” imply they are waiting.
� active_service_time: time spent on CPU while servicing.
� active_wait_time: time spent on CPU while waiting in user perspective.
� inactive_wait_time: time spent while sleeping on Oracle wait-event.
� inactive_service_time: time spent while sleeping on non-Oracle wait-event.
Level 2
active_service_time
= active_service_time for PARSE
+ active_service_time for EXECUTE
+ active_service_time for FETCH
active_wait_time
= active_wait_time for LATCH-SPINNING
+ active_wait_time for WAIT-LOOP
inactive_wait_time
= inactive_wait_time for recursive_statement
+ inactive_wait_time for user_statement
inactive_service_time
= inactive_service_time for PARSE
+ inactive_service_time for EXECUTE
+ inactive_service_time for FETCH
+ inactive_service_time for LATCH-SPINNING
+ inactive_service_time for WAIT-LOOP
Recursive statements are generated by Oracle to perform data dictionary operations (e.g., extent allocations) on behalf of the user process.
� active_service_time for PARSE, EXE-CUTE, FETCH: time spent on CPU for parsing, executing, and fetching, respectively.
� active_wait_time for LATCH-SPINNING, WAIT-LOOP: time spent on CPU while spinning latches or doing wait-loops. Although they are the waits in user perspective, they occupy CPU in OS perspective.
� inactive_wait_time for recursive statement, user statement: time spent while sleeping on Ora-cle wait-events for recursive and user statements, respectively. It shows the real wait time. It does not include active wait time.
� inactive_service_time for PARSE, EXE-CUTE, FETCH, LATCH-SPINNING, WAIT-LOOP: time spent while sleeping on non-Oracle wait-events for PARSE, EXECUTE, FETCH, LATCH-SPINNING, and WAIT-LOOP, respec-tively.
Copyright 2002 CRC Press LLC Oracle InternalsAll Rights Reserved January 2003 23

24
Microstate Response-Time Performance Profiling (MRPP)
Level 3
active_service_time for PARSE = active_service_time for recursive PARSE
+ active_service_time for user PARSE
active_service_time for EXECUTE
= active_service_time for recursive EXECUTE+ active_service_time for user EXECUTE
active_service_time for FETCH
= active_service_time for recursive FETCH
+ active_service_time for user FETCH
active_wait_time for LATCH-SPINNING = active_wait_time for recursive LATCH-SPINNING
+ active_wait_time for user LATCH-SPINNING
active_wait_time for WAIT-LOOP
= active_wait_time for recursive WAIT-LOOP+ active_wait_time for user WAIT-LOOP
inactive_service_time for PARSE
= inactive_service_time for recursive PARSE
+ inactive_service_time for user PARSE
inactive_service_time for EXECUTE = inactive_service_time for recursive EXECUTE
+ inactive_service_time for user EXECUTE
inactive_service_time for FETCH
= inactive_service_time for recursive FETCH+ inactive_service_time for user FETCH
inactive_service_time for LATCH-SPINNING
= inactive_service_time for recursive LATCH-SPINNING
+ inactive_service_time for user LATCH-SPINNING
inactive_service_time for WAIT-LOOP
= inactive_service_time for recursive WAIT-LOOP
+ inactive_service_time for user WAIT-LOOP
Definitions are the same as parameter names.
Level 4
active_service_time for recursive PARSE
= user level CPU time for active_service_time for recursive PARSE
+ system call CPU time for active_service_time for recursive PARSE
+ other system trap CPU time for active_service_time for recursive PARSE
active_service_time for user PARSE
= user level CPU time for active_service_time for user PARSE
+ system call CPU time for active_service_time for user PARSE
+ other system trap CPU time for active_service_time for user PARSE
active_service_time for recursive EXECUTE
= user level CPU time for active_service_time for recursive EXECUTE
+ system call CPU time for active_service_time for recursive EXECUTE
+ other system trap CPU time for active_service_time for recursive EXECUTE
active_service_time for user EXECUTE
= user level CPU time for active_service_time for user EXECUTE
+ system call CPU time for active_service_time for user EXECUTE
+ other system trap CPU time for active_service_time for user EXECUTE
active_service_time for recursive FETCH
= user level CPU time for active_service_time for recursive FETCH
+ system call CPU time for active_service_time for recursive FETCH
+ other system trap CPU time for active_service_time for recursive FETCH
active_service_time for user FETCH
= user level CPU time for active_service_time for user FETCH
Oracle Internals Copyright 2002 CRC Press LLCJanuary 2003 All Rights Reserved

Microstate Response-Time Performance Profiling (MRPP)
+ system call CPU time for active_service_time for user FETCH
+ other system trap CPU time for active_service_time for user FETCH
active_wait_time for recursive LATCH-SPINNING = user level CPU time for active_wait_time for
recursive LATCH-SPINNING+ system call CPU time for active_wait_time for
recursive LATCH-SPINNING+ other system trap CPU time for
active_wait_time for recursive LATCH-SPIN-NING
active_wait_time for user LATCH-SPINNING = user level CPU time for active_wait_time for user LATCH-SPINNING
+ system call CPU time for active_wait_time for user LATCH-SPINNING
+ other system trap CPU time for active_wait_time for user LATCH-SPINNING
active_wait_time for recursive WAIT-LOOP = user level CPU time for active_wait_time for recur-sive WAIT-LOOP
+ system call CPU time for active_wait_time for recursive WAIT-LOOP
+ other system trap CPU time for active_wait_time for recursive WAIT-LOOP
active_wait_time for user WAIT-LOOP = user level CPU time for active_wait_time for user WAIT-LOOP
+ system call CPU time for active_wait_time for user WAIT-LOOP
+ other system trap CPU time for active_wait_time for user WAIT-LOOP
inactive_wait_time for recursive_statement = text page fault sleep time for inactive_wait_time for recursive_statement
+ data page fault sleep time for inactive_wait_time for recursive_statement
+ kernel page fault sleep time for inactive_wait_time for recursive_statement
+ user lock wait sleep time for inactive_wait_time for recursive_statement
+ wait-cpu (latency) time for inactive_wait_time for recursive_statement
+ all other sleep time for inactive_wait_time for recursive_statement
inactive_wait_time for user_statement = text page fault sleep time for inactive_wait_time for user_statement
+ data page fault sleep time for inactive_wait_time for user_statement
+ kernel page fault sleep time for inactive_wait_time for user_statement
+ user lock wait sleep time for inactive_wait_time for user_statement
+ wait-cpu (latency) time for inactive_wait_time for user_statement
+ all other sleep time for inactive_wait_time for user_statement
inactive_service_time for recursive PARSE = text page fault sleep time for inactive_service_time for recursive PARSE
+ data page fault sleep time for inactive_service_time for recursive PARSE
+ kernel page fault sleep time for inactive_service_time for recursive PARSE
+ user lock wait sleep time for inactive_service_time for recursive PARSE
+ wait-cpu (latency) time for inactive_service_time for recursive PARSE
+ all other sleep time for inactive_service_time for recursive PARSE
inactive_service_time for user PARSE = text page fault sleep time for inactive_service_time for user PARSE
+ data page fault sleep time for inactive_service_time for user PARSE
+ kernel page fault sleep time for inactive_service_time for user PARSE
+ user lock wait sleep time for inactive_service_time for user PARSE
+ wait-cpu (latency) time for inactive_service_time for user PARSE
+ all other sleep time for inactive_service_time for user PARSE
Copyright 2002 CRC Press LLC Oracle InternalsAll Rights Reserved January 2003 25

26
Microstate Response-Time Performance Profiling (MRPP)
inactive_service_time for recursive EXECUTE = text page fault sleep time for inactive_service_time for recursive EXECUTE
+ data page fault sleep time for inactive_service_time for recursive EXECUTE
+ kernel page fault sleep time for inactive_service_time for recursive EXECUTE
+ user lock wait sleep time for inactive_service_time for recursive EXECUTE
+ wait-cpu (latency) time for inactive_service_time for recursive EXECUTE
+ all other sleep time for inactive_service_time for recursive EXECUTE
inactive_service_time for user EXECUTE = text page fault sleep time for inactive_service_time for user EXECUTE
+ data page fault sleep time for inactive_service_time for user EXECUTE
+ kernel page fault sleep time for inactive_service_time for user EXECUTE
+ user lock wait sleep time for inactive_service_time for user EXECUTE
+ wait-cpu (latency) time for inactive_service_time for user EXECUTE
+ all other sleep time for inactive_service_time for user EXECUTE
inactive_service_time for recursive FETCH = text page fault sleep time for inactive_service_time for recursive FETCH
+ data page fault sleep time for inactive_service_time for recursive FETCH
+ kernel page fault sleep time for inactive_service_time for recursive FETCH
+ user lock wait sleep time for inactive_service_time for recursive FETCH
+ wait-cpu (latency) time for inactive_service_time for recursive FETCH
+ all other sleep time for inactive_service_time for recursive FETCH
inactive_service_time for user FETCH = text page fault sleep time for inactive_service_time for user FETCH
+ data page fault sleep time for inactive_service_time for user FETCH
+ kernel page fault sleep time for inactive_service_time for user FETCH
+ user lock wait sleep time for inactive_service_time for user FETCH
+ wait-cpu (latency) time for inactive_service_time for user FETCH
+ all other sleep time for inactive_service_time for user FETCH
inactive_service_time for recursive LATCH-SPINNING = text page fault sleep time for inactive_service_time for recursive LATCH-SPINNING
+ data page fault sleep time for inactive_service_time for recursive LATCH-SPINNING
+ kernel page fault sleep time for inactive_service_time for recursive LATCH-SPINNING
+ user lock wait sleep time for inactive_service_time for recursive LATCH-SPINNING
+ wait-cpu (latency) time for inactive_service_time for recursive LATCH-SPINNING
+ all other sleep time for inactive_service_time for recursive LATCH-SPINNING
inactive_service_time for user LATCH-SPINNING = text page fault sleep time for inactive_service_time for user LATCH-SPINNING
+ data page fault sleep time for inactive_service_time for user LATCH- SPINNING
+ kernel page fault sleep time for inactive_service_time for user LATCH- SPINNING
+ user lock wait sleep time for inactive_service_time for user LATCH- SPINNING
+ wait-cpu (latency) time for inactive_service_time for user LATCH- SPINNING
+ all other sleep time for inactive_service_time for user LATCH-SPINNING
Oracle Internals Copyright 2002 CRC Press LLCJanuary 2003 All Rights Reserved
Microstate Response-Time Performance Profiling (MRPP)
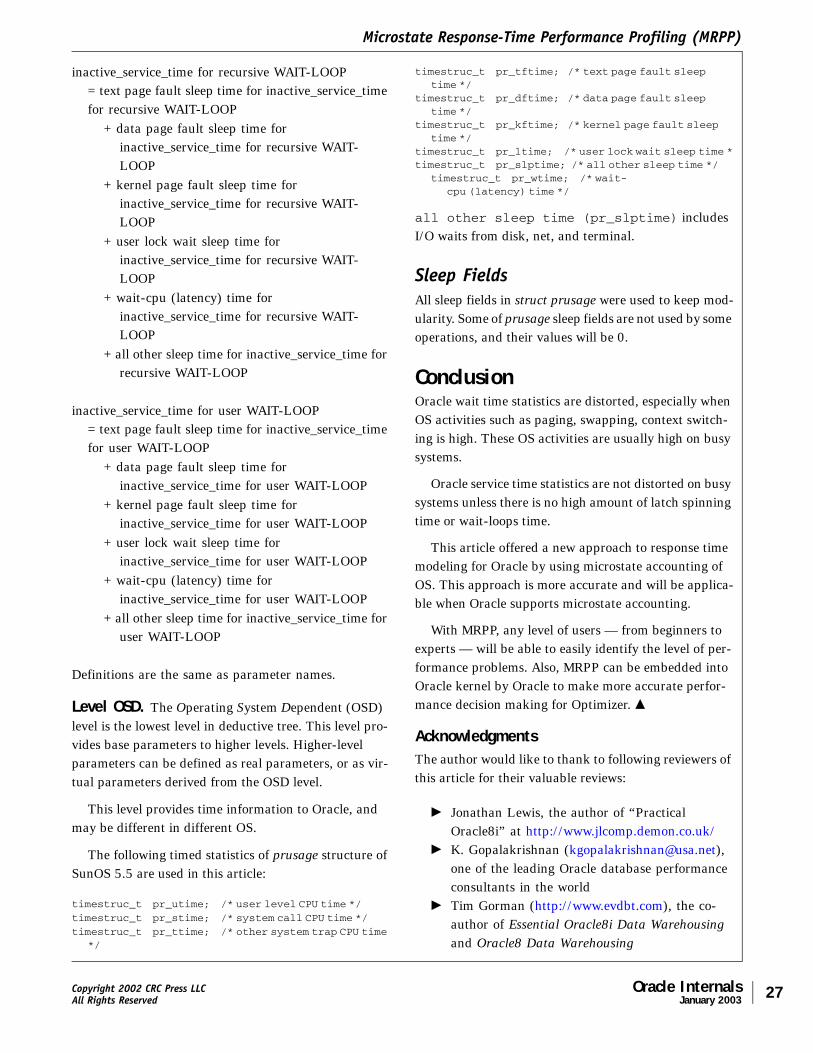
inactive_service_time for recursive WAIT-LOOP = text page fault sleep time for inactive_service_time for recursive WAIT-LOOP
+ data page fault sleep time for inactive_service_time for recursive WAIT-LOOP
+ kernel page fault sleep time for inactive_service_time for recursive WAIT-LOOP
+ user lock wait sleep time for inactive_service_time for recursive WAIT-LOOP
+ wait-cpu (latency) time for inactive_service_time for recursive WAIT-LOOP
+ all other sleep time for inactive_service_time for recursive WAIT-LOOP
inactive_service_time for user WAIT-LOOP = text page fault sleep time for inactive_service_time for user WAIT-LOOP
+ data page fault sleep time for inactive_service_time for user WAIT-LOOP
+ kernel page fault sleep time for inactive_service_time for user WAIT-LOOP
+ user lock wait sleep time for inactive_service_time for user WAIT-LOOP
+ wait-cpu (latency) time for inactive_service_time for user WAIT-LOOP
+ all other sleep time for inactive_service_time for user WAIT-LOOP
Definitions are the same as parameter names.
Level OSD. The Operating System Dependent (OSD) level is the lowest level in deductive tree. This level pro-vides base parameters to higher levels. Higher-level parameters can be defined as real parameters, or as vir-tual parameters derived from the OSD level.
This level provides time information to Oracle, and may be different in different OS.
The following timed statistics of prusage structure of SunOS 5.5 are used in this article:
timestruc_t pr_utime; /* user level CPU time */timestruc_t pr_stime; /* system call CPU time */timestruc_t pr_ttime; /* other system trap CPU time
*/
timestruc_t pr_tftime; /* text page fault sleep time */
timestruc_t pr_dftime; /* data page fault sleep time */
timestruc_t pr_kftime; /* kernel page fault sleep time */
timestruc_t pr_ltime; /* user lock wait sleep time *timestruc_t pr_slptime; /* all other sleep time */
timestruc_t pr_wtime; /* wait-cpu (latency) time */
all other sleep time (pr_slptime) includes I/O waits from disk, net, and terminal.
Sleep FieldsAll sleep fields in struct prusage were used to keep mod-ularity. Some of prusage sleep fields are not used by some operations, and their values will be 0.
ConclusionOracle wait time statistics are distorted, especially when OS activities such as paging, swapping, context switch-ing is high. These OS activities are usually high on busy systems.
Oracle service time statistics are not distorted on busy systems unless there is no high amount of latch spinning time or wait-loops time.
This article offered a new approach to response time modeling for Oracle by using microstate accounting of OS. This approach is more accurate and will be applica-ble when Oracle supports microstate accounting.
With MRPP, any level of users — from beginners to experts — will be able to easily identify the level of per-formance problems. Also, MRPP can be embedded into Oracle kernel by Oracle to make more accurate perfor-mance decision making for Optimizer. �
AcknowledgmentsThe author would like to thank to following reviewers of this article for their valuable reviews:
� Jonathan Lewis, the author of “Practical Oracle8i” at http://www.jlcomp.demon.co.uk/
� K. Gopalakrishnan ([email protected]), one of the leading Oracle database performance consultants in the world
� Tim Gorman (http://www.evdbt.com), the co-author of Essential Oracle8i Data Warehousing and Oracle8 Data Warehousing
Copyright 2002 CRC Press LLC Oracle InternalsAll Rights Reserved January 2003 27

Microstate Response-Time Performance Profiling (MRPP)
28
� Kirtikumar Deshpande, one of the authors of Ora-cle Performance Tuning 101
� Craig Shallahamer (http://www.orapub.com), an Oracle performance philosopher who has a special place in the history of Oracle performance man-agement
� Mehmet Ugÿ ur Kuzu (mehmetugurkuzu@yahoo. com), a valuable technical support analyst
The author would also like to thank Erdinç Basl1k, Mehmet Ugÿ ur Kuzu, Esin Y1lmaz, Sebahattin Demir, Tolga I
.ngenç, Fatih Er, Ahmet Güvel, and Yahya Agÿ a for
their administrative support.
References
1. Response Time Analysis for Oracle Based Systems, by Craig Shallahamer, http://www.orapub.com/.
2. Yet Another Performance Profiling (YAPP), by Anjo Kolk, Shari Yamaguchi, and Jim Viscusi, http://www.oraperf.com/.
3. How Busy Is the CPU, Really?, by Adrian Cockrofts, http://www.itworld.com/Net/3603/ UIR980601perf/.
4. Prying into Processes and Workloads, by Adrian Cockrofts, http://www.itworld.com/Net/3138/ UIR980401perf/.
5. A warning from Jonathan Lewis.6. Intel Architecture Software Developer’s Manual,
Volume 3: System Programming, order number 243192.
7. Asynchronous I/O and large file support in Solaris, http://sunsite.uakom.sk/sunworldonline/swol-07-1998/swol-07-insidesolaris.html.
Danisment Gazi Unal is an Oracle database consultant based in Adana, Turkey. He develops and hosts Web-based Oracle database utilities at http://www.ubTools.com. Ques-tions concerning this article can be asked at http://www. ubTools.com.
iStatsPackAnalyzer is a web based tool which analyzesSTATSPACK files of Oracle; finds bottlenecks and offers information
Oracle Internals Copyright 2002 CRC Press LLCJanuary 2003 All Rights Reserved
Name ________________________________________________
Title _________________________________________________
Company _____________________________________________
Street Address ________________________________________
City, State, ZIP ________________________________________
Country/Postal Code ___________________________________
Phone _______________________________________________
E-mail address ________________________________________
Customers in CA, DC, FL, GA, IL, MA, MO, NJ, NM, NY, and TX, please add applicable sales tax. Canadian customers, please add GST.
❑ 1 year (12 issues), $145
❑ 2 years (24 issues), $260 Best Deal — Save $30
❑ Bill my purchase order # ___________________ attached
❑ Check for $ _______ enclosed, payable to CRC Press LLC
❑ Charge my: ❑ Visa ❑ Mastercard ❑ Amex
Card No. ___________________________ Exp. Date ________
Signature (required) ___________________________________
Phone your order to: 1-800-272-7737Fax: 1-800-374-3401
Mail: CRC Press LLC, 2000 NW Corporate Blvd.Boca Raton, FL 33431
E-mail: [email protected]
Start (or extend) my subscription to Oracle Internals. Your subscription includes access to Oracle OnLine, a searchable archive.
on how to tune them. It can also correct Oracle measurementerrorsif Microstate Accounting statistics are available.
Copyright No part of this document may be reproduced in any form by any means without authorization of ubTools.