microstructure and durability of praseodymium-doped
TRANSCRIPT

HAL Id: tel-02894862https://tel.archives-ouvertes.fr/tel-02894862
Submitted on 9 Jul 2020
HAL is a multi-disciplinary open accessarchive for the deposit and dissemination of sci-entific research documents, whether they are pub-lished or not. The documents may come fromteaching and research institutions in France orabroad, or from public or private research centers.
L’archive ouverte pluridisciplinaire HAL, estdestinée au dépôt et à la diffusion de documentsscientifiques de niveau recherche, publiés ou non,émanant des établissements d’enseignement et derecherche français ou étrangers, des laboratoirespublics ou privés.
Microstructure and durability of praseodymium-dopedlanthanum nickelate for solid oxide cells
Nur Istiqomah Khamidy
To cite this version:Nur Istiqomah Khamidy. Microstructure and durability of praseodymium-doped lanthanum nickelatefor solid oxide cells. Mechanics of materials [physics.class-ph]. Université Grenoble Alpes [2020-..],2020. English. �NNT : 2020GRALI020�. �tel-02894862�

THÈSEPour obtenir le grade de
DOCTEUR DE L’UNIVERSITÉ GRENOBLE ALPESSpécialité : 2MGE : Matériaux, Mécanique, Génie civil, ElectrochimieArrêté ministériel : 25 mai 2016
Présentée par
Nur Istiqomah KHAMIDY
Thèse dirigée par Elisabeth DJURADO, Professeur et codirigée par Jérôme LAURENCIN, Ingénieur de recherche, CEAet David JAUFFRES, Grenoble INP
préparée au sein du Laboratoire Laboratoire d'Electrochimie et de Physico-Chimie des Matériaux et des Interfaces.dans l'École Doctorale I-MEP2 - Ingénierie - Matériaux, Mécanique, Environnement, Energétique, Procédés, Production
Microstructure et durabilité de nickélate de lanthane dopé au praséodyme pour cellules à oxydes solides
Microstructure and durability of praseodymium-doped lanthanum nickelate for solid oxide cells
Thèse soutenue publiquement le 13 mai 2020,devant le jury composé de :
Madame ELISABETH DJURADOPROFESSEUR DES UNIVERSITES, GRENOBLE INP, Directeur de thèseMonsieur CHRISTOPHE MARTINDIRECTEUR DE RECHERCHE, CNRS DELEGATION ALPES, PrésidentMadame PAOLA COSTAMAGNAPROFESSEUR ASSOCIE, UNIVERSITE DE GENES - ITALIE, RapporteurMonsieur NORBERT H MENZLERDOCTEUR-INGENIEUR, CENTRE DE RECHERCHE JÜLICH - ALLEMAGNE, RapporteurMonsieur JEROME CHEVALIERPROFESSEUR DES UNIVERSITES, INSA LYON, Examinateur


i
ACKNOWLEDGMENTS
First and foremost, all praises and thanks be to God.
I would like to convey my enormous gratitude for my thesis director Prof. Elisabeth Djurado.
Thank you for believing in me since the beginning when you offer me this project. I am forever
indebted for your guidance and support throughout my PhD life. I learned a great deal from
you, especially regarding your love for research and teaching, your astounding attention to
details, and your kindness. This thesis would not be possible without your persistence, and I
can proudly say that you are one of the people I look up to.
I would like to express my deep gratitude to my thesis co-director Dr. Jérôme Laurencin who
show me how a good researcher should be. Thank you for your continued encouragement and
for helping me to believe in myself when I could not do it myself. You are one of the most
brilliant people I know, and I am glad to have the opportunity to work with you.
I would also like to pass on my sincere gratitude to my thesis co-supervisor Dr. David Jauffrès.
I am thankful for your expert guidance especially regarding the image processing, and also for
your support during my thesis.
My sincere thanks to all the jury members Dr. Christophe L. Martin, Dr. Paola Costamagna,
Dr. Norbert H. Menzler, and Prof. Jérôme Chevalier for your willingness to be the jury for my
thesis and to read my thesis manuscript.
I would also like to thank Prof. Elisabeth Siebert and Prof. Laurent Dessemond for the valuable
discussion on electrochemistry and impedance spectroscopy.
I am extremely thankful to all researchers and technicians mentioned hereafter for their
tremendous help for the sample preparations and characterizations: Thierry Encinas and
Stéphane Coindeau for XRD in CMTC, Grenoble INP, France; Frédéric Charlot, Joëlle Calabro,
and Rachel Martin for SEM and its sample preparation in CMTC, Grenoble INP, France; Dr.
Marlu César Steil, Etienne Omnès-Sabardak, and Franck Fournet-Fayard for the manufacturing
of the GDC electrolyte pellets and for the screen printing equipment in M2E, Grenoble INP,
France; Bertrand Morel, Karine Couturier, Marie Petitjean, Olivier Stamenoff, and Pascal for
the experiments on the test bench in CEA-Liten, Grenoble, France; Dario Ferreira Sanchez for
synchrotron X-ray μ-XRD and μ-XRF in Swiss Light Source (SLS), Paul Scherrer Institut (PSI),

ii
Switzerland; Laure Lavernot and Vincent Martin for the experiments in LEPMI, Grenoble INP,
France; and Pierre-Henri Jouneau and Nanoscience foundation for FIB-SEM analysis in CEA,
Grenoble, France.
This work will not be possible without the funding by the project Mimosa from “Institut Carnot
Energies du Futur”. In addition, the work in Swiss Light Source (SLS), Paul Scherrer Institut
(PSI), Switzerland, is based on the proposal ID of 20180976.
Thank you also for all my friends, for being a second family for me: Kathina Aninditya who
show me how a good friend should be; the members of un-faedah group who are now scattered
everywhere, let’s meet again over a barbeque!; my office-mates in LEPMI (Veronica Müller,
Lydia Yefsah, Özden Çelikbilek, Rakesh Sharma, Hoang Phuong Khanh Ngo, Thi Khanh Ly
Nguyen, Vladyslav Tezyk) and my office-mates in CEA-Liten (Federico Monaco, Hamza
Moussaoui, Elisa Effori, Amira Abaza) with whom I share smiles, laughter, problems, and even
tears; Xiaohong Chen for the sporadic long chats over meals we have from time to time, I am
going to miss it for sure; and the amazing crew of PPI Grenoble that I cannot mention here one
by one.
Last but not least, thank you to my family for the endless support. For my parents, Bapak Djati
Soepangkat and Ibu Chumaidah Baroroh, who allow me to leave their side to follow my dreams,
thank you for your endless prayers. For my brother Nur Iman Khamidy who is also working
hard for his dreams and to build his life with my sister-in-law Masturoh; I will always cheer
you on. For my sister Nur Maritsa Khamidy, thank you for all the nonsense talks we have that
always cheer me up from miles away without fail. I dedicate this thesis for my late grandmother
who left before I could show her off my degree; thank you for always believed in me and
reminded me to be humble.

iii
RÉSUMÉ (FRANÇAIS)
Dans le cadre du déploiement des énergies renouvelables par nature intermittentes, le couplage
des technologies de piles à combustibles et d'électrolyseurs offre une solution innovante pour
absorber les pics de production ou de consommation électrique. Dans ce cadre, la technologie
basée sur des "cellules à oxydes solides" (SOCs) apparaît comme une solution attractive
permettant de remplir les deux fonctions avec le même objet. Ces convertisseurs
électrochimiques spécifiques sont constitués d'un électrolyte céramique oxyde fonctionnant à
haute température (800 – 1000 °C) permettant d’atteindre des rendements très importants.
Néanmoins, la durabilité des SOCs reste à ce jour insuffisante. Dans ce cadre, un des verrous
technologiques important est la déstabilisation chimique et mécanique de l'électrode à oxygène
ainsi que sa réactivité chimique avec l’électrolyte en fonctionnement. De plus, la température
de fonctionnement élevée des SOFC entraîne des contraintes sévères sur l'assemblage des
matériaux et sur les processus de fabrication.
Les objectifs de cette thèse sont de mieux comprendre les mécanismes réactionels et le rôle de
la microstructure des électrodes à oxygène dans les cellules à oxydes solides fonctionnant à
température intermédiaire (650 - 750 °C) et d'étudier le vieillissement à travers une approche
couplant caractérisations électrochimiques, physico-chimiques et de modélisation. Dans ce
travail, l’électrode à oxygène architecturée LaPrNiO4+δ, nommée LPNO, a été déposée sur
l'électrolyte Ce0.9Gd0.1O2-δ en vue de tirer parti des propriétés complémentaires des phases
extrêmes, à savoir La2NiO4+δ de plus grande stabilité chimique et Pr2NiO4+δ, de plus grande
activité électrochimique. Par ailleurs, les performances des SOCs dépendent non seulement des
propriétés intrinsèques des matériaux mais aussi de l'association des matériaux fonctionnels et
des propriétés de leurs interfaces. Par conséquent, de nouvelles architectures d’électrodes, à
base d’une couche fonctionnelle active (AFL) fabriquée par atomisation électrostatique (ESD)
et surmontée d'une couche de collecteur de courant optimisée (CCL) déposée par sérigraphie
(SP), ont été optimisées pour diminuer la température de fonctionnement afin d'améliorer les
performances et la durée de vie des cellules. Une couche fonctionnelle active nanostructurée
avec une microstructure unique de type corail présentant une grande porosité et une bonne
adhérence sur l'électrolyte s'est avérée d'une grande importance dans les réactions des
électrodes à oxygène. Les performances et la durabilité des électrodes dans les SOC
symétriques et dans une cellule d'électrolyse complète ont été étudiées en détail en

iv
vieillissement thermique et en mode galvanostatique. Ces données ont été discutées en relation
avec l'évolution structurale et microstructurale de l'électrode à oxygène LPNO grâce à des
caractérisations post-mortem utilisant la microscopie électronique à balayage, la reconstruction
3D par faisceau d'ions focalisés MEB, la diffraction des rayons X en laboratoire et la -
diffraction et µ-fluorescence par rayonnement X synchrotron.
v
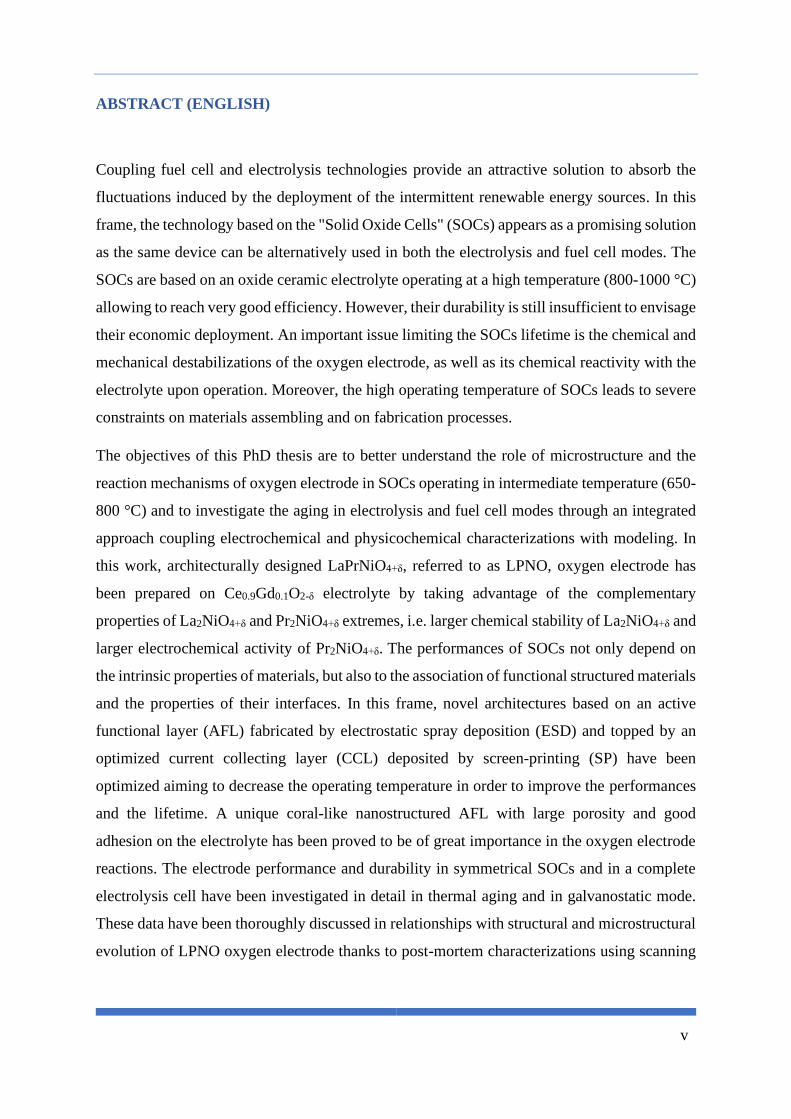
ABSTRACT (ENGLISH)
Coupling fuel cell and electrolysis technologies provide an attractive solution to absorb the
fluctuations induced by the deployment of the intermittent renewable energy sources. In this
frame, the technology based on the "Solid Oxide Cells" (SOCs) appears as a promising solution
as the same device can be alternatively used in both the electrolysis and fuel cell modes. The
SOCs are based on an oxide ceramic electrolyte operating at a high temperature (800-1000 °C)
allowing to reach very good efficiency. However, their durability is still insufficient to envisage
their economic deployment. An important issue limiting the SOCs lifetime is the chemical and
mechanical destabilizations of the oxygen electrode, as well as its chemical reactivity with the
electrolyte upon operation. Moreover, the high operating temperature of SOCs leads to severe
constraints on materials assembling and on fabrication processes.
The objectives of this PhD thesis are to better understand the role of microstructure and the
reaction mechanisms of oxygen electrode in SOCs operating in intermediate temperature (650-
800 °C) and to investigate the aging in electrolysis and fuel cell modes through an integrated
approach coupling electrochemical and physicochemical characterizations with modeling. In
this work, architecturally designed LaPrNiO4+δ, referred to as LPNO, oxygen electrode has
been prepared on Ce0.9Gd0.1O2-δ electrolyte by taking advantage of the complementary
properties of La2NiO4+δ and Pr2NiO4+δ extremes, i.e. larger chemical stability of La2NiO4+δ and
larger electrochemical activity of Pr2NiO4+δ. The performances of SOCs not only depend on
the intrinsic properties of materials, but also to the association of functional structured materials
and the properties of their interfaces. In this frame, novel architectures based on an active
functional layer (AFL) fabricated by electrostatic spray deposition (ESD) and topped by an
optimized current collecting layer (CCL) deposited by screen-printing (SP) have been
optimized aiming to decrease the operating temperature in order to improve the performances
and the lifetime. A unique coral-like nanostructured AFL with large porosity and good
adhesion on the electrolyte has been proved to be of great importance in the oxygen electrode
reactions. The electrode performance and durability in symmetrical SOCs and in a complete
electrolysis cell have been investigated in detail in thermal aging and in galvanostatic mode.
These data have been thoroughly discussed in relationships with structural and microstructural
evolution of LPNO oxygen electrode thanks to post-mortem characterizations using scanning

vi
electron microscopy, 3D reconstruction by focused ion beam-SEM, laboratory X-ray
diffraction, and synchrotron X-ray µ-diffraction and µ-fluorescence.

vii
CONTENTS
ACKNOWLEDGMENTS ..................................................................................................................... i
RÉSUMÉ (FRANÇAIS) ...................................................................................................................... iii
ABSTRACT (ENGLISH) ..................................................................................................................... v
CONTENTS......................................................................................................................................... vii
LIST OF FIGURES .............................................................................................................................. x
LIST OF TABLES .............................................................................................................................. xv
NOMENCLATURE ........................................................................................................................... xvi
INTRODUCTION ................................................................................................................................. 1
Objectives........................................................................................................................................... 6
Structure of the thesis ....................................................................................................................... 6
CHAPTER 1: LITERATURE STUDY ............................................................................................... 9
1.1 Fundamentals of solid oxide cell (SOC) .................................................................................. 10
1.1.1 Electrolyte ............................................................................................................................ 11
1.1.2 Air/oxygen electrode ............................................................................................................ 12
1.13 Fuel/hydrogen electrode ........................................................................................................ 14
1.1.4 Sealing materials and interconnects ..................................................................................... 14
1.2 Oxygen reduction/evolution reaction ...................................................................................... 15
1.2.1 Triple-phase boundary (TPB) .............................................................................................. 15
1.2.2 Factors affecting oxygen reduction/evolution reaction (ORR and OER) ............................ 16
1.3 Ruddlesden-Popper phase: rare-earth nickelates .................................................................. 22
1.4 Degradation of several MIEC oxygen electrode materials for SOC .................................... 25
1.4.1 Degradation mechanism of LSCF oxygen electrode ........................................................... 27
1.4.2 Degradation mechanism of rare-earth nickelates ................................................................. 28
CHAPTER 2: FABRICATION AND CHARACTERIZATION TECHNIQUES ....................... 30
2.1 Electrolytes for symmetrical and complete cells .................................................................... 31
2.2 Fabrication techniques ............................................................................................................. 31
2.2.1 Sol-gel auto-combustion to prepare LPNO powder for screen printing .............................. 31
2.2.2 Screen printing (SP) ............................................................................................................. 32
2.2.3 Electrostatic spray deposition (ESD) ................................................................................... 34
2.2.4 Design of the LPNO oxygen electrode ................................................................................ 38
2.3 Microstructural characterization techniques ......................................................................... 39
2.3.1 Scanning electron microscopy (SEM) ................................................................................. 39
2.3.2 Focused ion beam-scanning electron microscopy (FIB-SEM) tomography ........................ 40
2.4 Structural characterization techniques ................................................................................... 45
2.4.1 Laboratory X-ray diffraction (XRD): room temperature and in-situ XRD .......................... 45
viii
2.4.2 Synchrotron-based X-ray: Lamellae preparation by plasma-FIB, micro-X-ray diffraction
(µ-XRD), and micro-X-ray fluorescence (µ-XRF) ....................................................................... 45
2.5 Electrochemical characterization technique: Electrochemical impedance spectroscopy
(EIS) ................................................................................................................................................. 47
2.6 Long-term durability tests........................................................................................................ 52
2.6.1 Long-term test on the symmetrical cell ................................................................................ 52
2.6.2 Long-term test on the complete cell ..................................................................................... 53
CHAPTER 3: IMPROVING THE ELECTRODE PERFORMANCE OF RARE-EARTH
NICKELATES BY IMPROVING THE MICROSTRUCTURE AND ARCHITECTURAL
DESIGN ............................................................................................................................................... 55
3.1 Introduction ............................................................................................................................... 56
3.2 Preliminary experiments .......................................................................................................... 57
3.2.1 Optimized deposition parameters by SP and ESD ............................................................... 57
3.2.1.1 SP layer: binder for the ink ............................................................................................... 57
3.2.1.2 ESD layer: solution stabilization, deposition time, and hierarchical microstructure ........ 58
3.2.2 Electrochemical performance of coral-type La2-xPrxNiO4+δ (x = 0, 1, 2).............................. 63
3.2.3 Reproducibility .................................................................................................................... 64
3.3 Structural characterization of LPNO as a powder, SP layer, and ESD layers ................... 65
3.4 Equivalent electrical circuit model for EIS data fitting ........................................................ 69
3.5 Influence of the electrode/electrolyte interface quality on the performance of the LPNO
electrode ........................................................................................................................................... 71
3.6 Influence of the secondary higher-order phase on the electrochemical performance of the
ESD layer ......................................................................................................................................... 77
3.7 Influence of the CCL microstructure on the performance of the electrode ........................ 82
3.8 Influence of the various architectural designs on the performance of the electrode .......... 87
3.9 Summary and conclusions ........................................................................................................ 90
CHAPTER 4: DURABILITY STUDY ON THE SYMMETRICAL AND COMPLETE CELLS
.............................................................................................................................................................. 94
4.1 Introduction ............................................................................................................................... 95
4.2 Durability study on the symmetrical cell ................................................................................ 96
4.2.1 Pre-test measurements.......................................................................................................... 96
4.2.2 Long-term measurement in electrolysis and fuel cell modes (idc = ±300 mA cm-2) ............ 98
4.3 Preliminary durability study on the complete cell ............................................................... 102
4.3.1 Preliminary durability test on CCell 1: GDC barrier layer by screen printing ................... 103
4.3.2 Preliminary test on CCell 2: GDC barrier layer by RF magnetron sputtering ................... 106
4.4 Summary and conclusions ...................................................................................................... 108
CHAPTER 5: POST-MORTEM STRUCTURAL AND MICROSTRUCTURAL
CHARACTERIZATIONS ............................................................................................................... 110
5.1 Introduction ............................................................................................................................. 111

ix
5.2 Post-mortem microstructural characterization: SEM and 3D reconstruction by FIB-SEM
........................................................................................................................................................ 114
5.2.1 Characterization of the samples operated in the electrolysis mode ................................... 114
5.2.2 Characterization of the sample operated in fuel cell mode ................................................ 116
5.3 Post-mortem structural characterization: synchrotron-based µ-XRD and µ-XRF .......... 116
5.3.1 Pristine cell ......................................................................................................................... 117
5.3.1.1 Laboratory XRD characterizations for ESD and SP layers............................................. 118
5.3.1.2 Synchrotron-based µ-XRD and µ-XRF characterizations for ESD-SP double-layer
electrode ...................................................................................................................................... 118
5.3.2 Thermally-aged cell ........................................................................................................... 122
5.3.3 Long-term test in electrolysis mode (anodic polarization): symmetrical and complete cells
.................................................................................................................................................... 124
5.3.3.1 Anodic side of the symmetrical cell (sample 3 or SCell-anodic) .................................... 124
5.3.3.2 Anodically-aged oxygen electrode of the complete cell (sample 4 or CCell 1) .............. 126
5.3.4 Long-term test in fuel cell mode (cathodic polarization): symmetrical cell ...................... 127
5.4 Summary and conclusions ...................................................................................................... 129
GLOBAL CONCLUSIONS AND PERSPECTIVES .................................................................... 131
Conclusions ..................................................................................................................................... 132
Perspectives..................................................................................................................................... 136
REFERENCES .................................................................................................................................. 138
APPENDIX A: Scanning electron microscopy ............................................................................... 149
APPENDIX B: Laboratory X-ray diffraction (XRD): room temperature and in-situ XRD ..... 152
APPENDIX C: Electrochemical characterization technique: Electrochemical impedance
spectroscopy (EIS) ............................................................................................................................ 156

x
LIST OF FIGURES
Fig. i Efficiency potential of various power generation technologies (Stambouli, 2011) [10]. CCPP
refers to a combined cycle power plant. ................................................................................................. 5
Fig. 1. 1 The illustrations of solid oxide cells (a) operating as a fuel cell (SOFC) and (b) operating as
electrolysis cell (SOEC). ....................................................................................................................... 10
Fig. 1. 2 The illustration of possible reaction steps for oxygen reduction reaction (ORR) in a mixed
ionic and electronic conductor (MIEC) oxygen electrode (remade with modification from Takeda, et al.
[24]). ..................................................................................................................................................... 16
Fig. 1. 3 The illustration of electrical potential at each interface across the cell (Laurencin [25])....... 17
Fig. 1. 4 (a) Polyhedral view of a Ruddlesden-Popper structure of general formula An+1BnO3n+1
consisting of nABO3 perovskite layers sandwiched between two AO rock-salt layers. Oxygen in
equatorial (Oeq), apical (Oap), and interstitial (Oi) sites have been highlighted (Tarancón, et al. [32]). (b)
The illustrations showing the ABO3 layers for n = 1, 2, and 3 (Amow, et al. [34]). ............................ 23
Fig. 1. 5 The cell parameters as a function of Pr content in La2-xPrxNiO4+δ (0 ≤ x ≤ 2) (Nishimoto, et al.
[38]). ..................................................................................................................................................... 25
Fig. 1. 6 Degradation rate under SOFC and SOEC operations in (a) V% kh-1 and (b) mΩ cm2 kh-1, as
well as (c) the estimated lifetime, of various stacks versus the start date of the test taken from published
articles. (d) The degradation rate of stacks versus operating temperature for various oxygen electrode
materials. All graphs are taken from Skafte, et al. [46]. ....................................................................... 27
Fig. 1. 7 The evolution of polarization resistance during operation in (a) SOFC mode and (b) SOEC
mode for La2-xPrxNiO4+δ (x = 0, 0.5, 2). The test is carried out in air at 700 °C and current density (idc)
of ±300 mA cm-2 (Vibhu [36]). ............................................................................................................. 29
Fig. 2. 1 (a) GDC electrolyte, (b) Ni-YSZ supported half-cell, and (c) the sketch of the cross-section of
the half-cell. .......................................................................................................................................... 31
Fig. 2. 2 Flowchart of the sol-gel auto-combustion procedure for the preparation of LPNO powder. . 32
Fig. 2. 3 Illustration of screen printing. ................................................................................................ 33
Fig. 2. 4 (a) Schematic diagram of electrostatic spray deposition (ESD) and (b) sketch of the stages of
spray formation as a function of the applied voltage. ........................................................................... 35
Fig. 2. 5 Schematic diagrams of different architectural designs of LPNO electrode: single-layer (SL)
LPNO deposited by (a) SP and (b) ESD, (c) double-layer (DL) of LPNO AFL deposited by ESD topped
by LPNO CCL deposited by SP, and (d) triple-layer electrode (TL) in which the AFL is a GDC
interlayer deposited by SP topped by LPNO deposited by ESD and the CCL is LPNO deposited by SP.
.............................................................................................................................................................. 38
Fig. 2. 6 (a) The schematic illustration of FIB set-up (Gierak, 2014) [65] and (b) FIB-SEM tomography
configuration. ........................................................................................................................................ 41
Fig. 2. 7 The schematic representation of step-by-step FIB-SEM tomography: (a) protective Pt
deposition on the region of interest (ROI) – (b) FIB milling to create a trench close to the ROI – (c) the
view of the ROI – (d) an example of a slice of image acquired by SEM using the in-lens detector with
the black parts indicating the resin-filled pores. ................................................................................... 42
Fig. 2. 8 (a) The raw, unprocessed SEM image – (b) the image after Bleach Correction to reduce the
shadowing effect – (c) the segmented image which shows the solid phase in white and the porosity in
black. ..................................................................................................................................................... 43
Fig. 2. 9 The schematic representation of the lamella preparation by p-FIB: (a) protective Pt deposition
on ROI – (b) FIB milling around the ROI – (c) isolated lamella – (d) sample extraction from the cell –

xi
(e) sample mounted on the Al pin. (f) The schematic diagram of µ-XRD and µ-XRF characterization at
μXAS beamline, SLS, PSI, Switzerland. .............................................................................................. 46
Fig. 2. 10 The graphical representation of impedance 𝑍 (Barsoukov & Macdonald (Eds.), 2005) [76].
.............................................................................................................................................................. 49
Fig. 2. 11 (a) Nyquist and (b) Bode representation of EIS data. The numbers on the Nyquist plot
indicates the logarithmic of the frequency. ........................................................................................... 49
Fig. 2. 12 (a) 2-electrode and (b) 3-electrode configurations for EIS measurement. CE is a counter
electrode, WE is a working electrode, and RE is a reference electrode. ............................................... 52
Fig. 2. 13 The illustration of the test bench configuration for the durability test on the complete cell.53
Fig. 3. 1 The Arrhenius plots of single-layer deposited by SP using either PVP or PVB as the binder
for the ink. ............................................................................................................................................. 58
Fig. 3. 2 The LPNO precursor solution (a) right after the preparation and (b) 1.5 h later without HNO3
addition which showed that the solution became opaque due to the formation of precipitates, (c) the
precipitates blocked the opening of the tube which prevented the solution of precursors to continue to
flow to the needle and thus stopped the spray production. The SEM images of (d) the surface and (e)-
(f) the cross-section of the ESD layer prepared from solution without HNO3. The SEM images of (g)
the surface and (h)-(i) the cross-section of the ESD layer prepared from solution with the addition of
HNO3. Both layers were deposited by ESD for 3 h of deposition time. ............................................... 60
Fig. 3. 3 The cross-section SEM images of ESD layer deposited for (a) 3 h 45’, (b) 4 h 30’, and (c) 6
h; (d) the thickness of the ESD layer versus time. ................................................................................ 61
Fig. 3. 4 The Arrhenius plots of double-layer symmetrical cells with different ESD deposition time: 3
h 45’, 4 h 30’, and 6 h. .......................................................................................................................... 62
Fig. 3. 5 The SEM images of the LPNO columnar electrode: (a) the surface view, (b) the cross-
section, and (c) a larger magnification at the electrode/electrolyte interface which show the uniform
deposition at the electrode/electrolyte interface. ................................................................................... 63
Fig. 3. 6 The Arrhenius plots of LNO, LPNO, and PNO double-layer symmetrical cells. .................. 64
Fig. 3. 7 The Arrhenius plots of three identical double-layer symmetrical cells for reproducibility test.
.............................................................................................................................................................. 65
Fig. 3. 8 XRD of (a) LPNO powder prepared by auto-combustion and calcined at 1050 °C/2 h +
1100 °C/0.5 h in air and (b) screen-printed layers of LPNO on GDC thermally treated in air at (i) 450 oC/2 h + 800 °C/2 h, (ii) 450 oC/2 h + 900 °C/2 h, (iii) 450 oC/2 h + 1050 °C/2 h + 1100 oC/0.5 h, and
(iv) 450 oC/2 h + 1200 °C/2 h; (c) In-situ high temperature XRD from 25 to 1200 °C of the as-
deposited SL LPNO electrode by ESD. ................................................................................................ 66
Fig. 3. 9 The diffractogram of the ESD layer after sintering in the air at 960 °C for 6 h. .................... 67
Fig. 3. 10 SEM images of cross-sections of (a), (b) SL SP sintered at 1100 oC (sample 2) and (c), (d)
SL ESD sintered at 960 oC (sample 3) on two different magnifications. The electrode/electrolyte
interfaces are indicated by the dashed white lines. ............................................................................... 68
Fig. 3. 11 The schematic diagram of the equivalent circuit model which is used to fit the experimental
EIS data. ................................................................................................................................................ 69
Fig. 3. 12 (a)-(c) Nyquist plots and (d)-(f) Bode plots of samples 1, 2, and 3 at 500, 600, and 700 °C,
respectively. The Nyquist plots are plotted by subtracting the contribution of the series resistance and
the numbers on the Nyquist plots indicate the logarithmic of the frequencies. .................................... 74
Fig. 3. 13 The Arrhenius plots of (a) series resistance (Rs) and (b) polarization resistance (Rpol). The
deconvolution of (c) resistance (R) and (d) capacitance (C) associated with P1 (half-filled markers),
P2 (filled markers), and P3 (empty markers) processes, as well as chemical capacitance (Cchem, empty
with plus sign markers). All plots are for sample 1 (black square), 2 (blue circle), and 3 (triangle red).
.............................................................................................................................................................. 75

xii
Fig. 3. 14 XRD patterns of the ESD layer (i) as-sintered at 960 °C for 6 h in air and after second heat-
treatment in air at (ii) 450 °C/2 h + 800 °C/2 h, (iii) 450 °C/2 h + 900 °C/2 h, and (iv) 450 °C/2 h +
1050 °C/2 h + 1100 °C/0.5 h. ................................................................................................................ 78
Fig. 3. 15 (a)-(c) Nyquist plots and (d)-(f) Bode plots of samples 4, 5, and 6 at 500, 600, and 700 °C,
respectively. The Nyquist plots are plotted by subtracting the contribution of the series resistance and
the numbers on the Nyquist plots indicate the logarithmic of the frequencies. .................................... 80
Fig. 3. 16 The Arrhenius plots of (a) series resistance (Rs) and (b) polarization resistance (Rpol). The
deconvolution of (c) resistance (R) and (d) capacitance (C) associated with P2 (filled markers) and P3
(empty markers) processes, as well as chemical capacitance (Cchem, empty with plus sign markers). All
plots are for sample 4 (black square), 5 (blue circle), and 6 (triangle red). .......................................... 81
Fig. 3. 17 The cross-section images of (a), (b) ESD layer after second heat-treatment at 450 °C/2 h +
900 °C/2 h and (c), (d) ESD layer after second heat-treatment at 450 °C/2 h + 1050 °C/2 h + 1100
°C/0.5 h at two different magnifications. The dashed white line indicates the electrode/electrolyte
interface. ............................................................................................................................................... 82
Fig. 3. 18 SEM images of (a), (b) LPNO powder before ball-milling; (c), (d) LPNO powder after ball-
milling; the cross-section of the double-layer electrodes (e) with non-ball-milled LPNO powder and
(f) with ball-milled LPNO powder as the CCL; and (g), (h) the cross-section of the triple-layer
electrode at two different magnifications. The dashed white line indicates the interfaces. .................. 83
Fig. 3. 19 The elements distribution observed at three different regions across the screen-printed
GDC: at the LPNO ESD/GDC SP interface (black), at 3 μm from this interface (blue), and at 5 μm
from this interface (red). ....................................................................................................................... 84
Fig. 3. 20 (a)-(c) Nyquist plots and (d)-(f) Bode plots of samples 4, 7, 8, and 9 at 500, 600, and
700 °C, respectively. The Nyquist plots are plotted by subtracting the contribution of the series
resistance and the numbers on the Nyquist plots indicate the logarithmic of the frequencies. ............. 86
Fig. 3. 21 The Arrhenius plots of (a) series resistance (Rs) and (b) polarization resistance (Rpol). The
deconvolution of (c) resistance (R) and (d) capacitance (C) associated with P1 (half-filled markers),
P2 (filled markers), and P3 (empty markers) processes, as well as chemical capacitance (Cchem, empty
with plus sign markers). All plots are for sample 4 (black square), 7 (blue circle), 8 (triangle red), and
9 (inverted-triangle olive). .................................................................................................................... 87
Fig. 3. 22 (a)-(c) Nyquist plots and (d)-(f) Bode plots of samples 3, 7, and 9 at 500, 600, and 700 °C,
respectively. The Nyquist plots are plotted by subtracting the contribution of the series resistance and
the numbers on the Nyquist plots indicate the logarithmic of the frequency. ....................................... 89
Fig. 3. 23 The Arrhenius plots of (a) series resistance (Rs) and (b) polarization resistance (Rpol).
Several Rpol values of LPNO with similar configuration are also given for comparison [22], [35]. The
deconvolution of (c) resistance (R) and (d) capacitance (C) associated with P1 (half-filled markers),
P2 (filled markers), and P3 (empty markers) processes, as well as chemical capacitance (Cchem, empty
with plus sign markers). All plots are for sample 3 (magenta diamond), 7 (blue circle), and 9
(inverted-triangle olive). ....................................................................................................................... 90
Fig. 4. 1 (a),(c) Nyquist plots and (b),(d) Bode plots of SCell at 550-700 °C taken at OCP for the bottom
and top electrodes, respectively. The Nyquist plots are plotted by subtracting the contribution of the
series resistance and the numbers on the Nyquist plots indicate the logarithmic of the frequency. The
inset graphs indicating the magnification of the plots taken at 650 and 700 °C for clarity. ................. 97
Fig. 4. 2 The Arrhenius plots of (a) series resistance (Rs) and (b) polarization resistance (Rpol) for the
bottom (black square) and top (blue circle) electrodes of SCell. .......................................................... 98
Fig. 4. 3 Voltage between the working and the reference electrodes as a function of time for SCell
operating in fuel cell mode. .................................................................................................................. 99
Fig. 4. 4 (a),(c) Nyquist plots and (b),(d) Bode plots of SCell at 700 °C which are taken before and after
a long-term test for cathodic and anodic sides, respectively. The Nyquist plots are plotted by subtracting

xiii
the contribution of the series resistance and the numbers on the Nyquist plots indicate the logarithmic
of the frequency. ................................................................................................................................. 101
Fig. 4. 5 (a) The series resistance (Rs) and (b) the polarization resistance (Rpol) before and after a long-
term test for the cathodic (black square) and anodic (blue circle) sides of SCell. .............................. 101
Fig. 4. 6 The iV curve of CCell 1 at 700 °C taken at various times during the test for (a) fuel cell
operation with Dtot,SOFC 9 and (b) electrolysis operation with Dtot,SOEC 9. ........................................... 103
Fig. 4. 7 The Nyquist and Bode plots of CCell 1 at 700 °C taken at OCV before the long-term test (t =
0 h) for Dtot,SOEC 9 and Dtot,SOEC 20. The numbers indicate the logarithm of the measuring frequency.
............................................................................................................................................................ 104
Fig. 4. 8 Cell voltage as a function of time for CCell 1 operating in the electrolysis mode. The spikes
show the timestamps when the applied current is stopped for either system check or measuring the iV
curve and impedance of the cell. ......................................................................................................... 105
Fig. 4. 9 The Nyquist and Bode plots of CCell 1 at 700 °C taken at OCV before, during, and after the
long-term test for Dtot,SOEC 9. The numbers indicate the logarithm of the measuring frequency. ....... 106
Fig. 4. 10 (a) The series resistance (Rs) and (b) the polarization resistance (Rpol) measured at various
times during the long-term test of CCell 1. ......................................................................................... 106
Fig. 4. 11 The iV curve of CCell 1 and CCell 2 at 700 °C taken before the long-term test for (a) fuel
cell operation with Dtot,SOFC 9 and (b) electrolysis operation with Dtot,SOEC 9. ..................................... 108
Fig. 4. 12 The Nyquist and Bode plots of CCell 1 and CCell 2 at 700 °C taken at OCV before, and
during the long-term test for Dtot,SOEC 9. The numbers indicate the logarithm of the measuring frequency.
............................................................................................................................................................ 108
Fig. 5. 1 The cross-section SEM images of (a) pristine cell (sample 1), (b) anodically-aged symmetrical
cell (sample 3 or SCell-anodic), (c) anodically-aged complete cell (sample 4 or CCell 1), and (d)
cathodically-aged symmetrical cell (sample 5 or SCell-cathodic). The dashed white line indicates the
LPNO electrode/electrolyte interface. The surface of sample 4 is slightly damaged during the removal
of the cells from the test bench after electrolysis operation by sandblasting. ..................................... 114
Fig. 5. 2 The 3D reconstruction visualization of (a) pristine cell (sample 1) and (b) anodically-aged
symmetrical cell (sample 3 or SCell-anodic). ..................................................................................... 115
Fig. 5. 3 SEM micrographs of the lamella of (a) pristine cell (sample 1), (b) thermally-aged cell (sample
2), (c) anodically-aged symmetrical cell (sample 3 or SCell-anodic), and (d) anodically-aged complete
cell (sample 4 or CCell 1). .................................................................................................................. 117
Fig. 5. 4 (a) The average XRD patterns on several Y-positions and (b)-(c) refinement of the peaks at
two different Y-positions, i. e. 18 and 4 μm above the electrode/GDC, respectively, for the pristine cell
(sample 1)............................................................................................................................................ 120
Fig. 5. 5 2D maps of the XRD which shows the distribution of the phases, namely GDC, LPNO,
(LP)3N2, Pr6O11, and (LP)4N3, in (a) pristine cell (sample 1), (b) thermally-aged cell (sample 2), (c)
anodically-aged symmetrical cell (sample 3 or SCell-anodic), and (d) anodically-aged complete cell
(sample 4 or CCell 1). The brighter color indicates the higher local intensity of the corresponding
compound. ........................................................................................................................................... 121
Fig. 5. 6 2D maps of the XRF which shows the distribution of the elements, namely Ce, Gd, La, Ni, Pr,
and Pt, in (a) pristine cell (sample 1), (b) thermally-aged cell (sample 2), (c) anodically-aged
symmetrical cell (sample 3 or SCell-anodic), and (d) anodically-aged complete cell (sample 4 or CCell
1). The brighter color indicates the higher local intensity of the corresponding element. .................. 122
Fig. 5. 7 (a) The average XRD patterns on several Y-positions and (b)-(c) refinement of the peaks at
two different Y-positions, i. e. 4.5 and 1.5 μm above the electrode/GDC interface, respectively, for the
thermally-aged cell (sample 2). ........................................................................................................... 123
Fig. 5. 8 The quantitative comparison of (LP)3N2, Pr6O11, and (LP)4N3 to LPNO in the LPNO
electrode as the function of distance from electrode/GDC interface for (a) pristine cell (sample 1), (b)

xiv
thermally-aged cell (sample 2), (c) anodically-aged symmetrical cell (sample 3 or SCell-anodic), and
(d) anodically-aged complete cell (sample 4 or CCell 1). .................................................................. 124
Fig. 5. 9 (a) The average XRD patterns on several Y-positions and (b)-(c) refinement of the peaks at
two different Y-positions, i. e. 14 and 4 μm above the electrode/GDC interface, respectively, for the
anodically-aged symmetrical cell (sample 3 or SCell-anodic)............................................................ 125
Fig. 5. 10 (a) The average XRD patterns on several Y-positions and (b)-(c) refinement of the peaks at
two different Y-positions, i. e. 10 and 4 μm above the electrode/GDC interface, respectively, for the
anodically-aged complete cell (sample 4 or CCell 1). ........................................................................ 127
Fig. 5. 11 The lab XRD of (a) pristine cell (sample 1) and (b) cathodically-aged symmetrical cell
(sample 5 or SCell-cathodic). The symbol ‘C’ indicated the carbon phase which is originating from the
carbon tape used for sample preparation by p-FIB. ............................................................................ 129

xv
LIST OF TABLES
Table i Typical reactions on the cathode and anode of fuel cells with either cationic or anionic conductor
electrolyte operating as both fuel cell and electrolyzer cell. ................................................................... 4
Table 1. 1 The ionic conductivity (σ) and thermal expansion coefficient (TEC) of several electrolyte
materials. ............................................................................................................................................... 12
Table 1. 2 The electronic conductivity (σe-), ionic conductivity (σio), thermal expansion coefficient
(TEC), oxygen diffusion coefficient (D*), and surface exchange coefficient (k*) of several oxygen
electrode materials. ............................................................................................................................... 13
Table 1. 3 The oxygen over-stoichiometry (δ), polarization resistance (Rpol) at 600 °C, and thermal
decomposition of La2-xPrxNiO4+δ (0 ≤ x ≤ 2) after heat treatment at 700 °C for 30 days taken from two
literature. ............................................................................................................................................... 24
Table 1. 4 The final phases after operation in SOFC and SOEC modes for La2-xPrxNiO4+δ (x = 0, 0.5,
2). The test is carried out in air at 700 °C for 1800 h and current density (idc) of ±300 mA cm-2 (Vibhu
[36]). ..................................................................................................................................................... 29
Table 2. 1 Deposition parameters by ESD to obtain a coral-like microstructure. ................................ 37
Table 2. 2 The diameter (in mm) of the deposition size for symmetrical and complete cells. ............. 39
Table 2. 3 The NiO reduction steps at 800 °C from 5 to 15 minutes. .................................................. 54
Table 3. 1 List of samples discussed in this chapter with the sintering program. As described in §2.2.4,
SL = single-layer, DL = double-layer, and TL = triple-layer................................................................ 56
Table 3. 2 Architectural design, thickness, and particle size for all the samples mentioned in this chapter.
.............................................................................................................................................................. 92
Table 3. 3 The summary of the electrochemical data at 500, 600, and 700 °C for all samples mentioned
in this chapter. ....................................................................................................................................... 93
Table 4. 1 The list of samples and the detailed long-term test parameters for each. ............................ 96
Table 4. 2 The details on the gas composition and flow rates of each gas for measurements of complete
cell in both fuel cell and electrolysis modes. The steam conversion rates (SC) are given for a current
density of 0.2 A cm-2. .......................................................................................................................... 102
Table 5. 1 The list of samples and the summary of the characterization results. ............................... 113
Table 5. 2 The values of several microstructural properties of the pristine cell and anodic side of the
symmetrical cell calculated based on the 3D reconstruction by FIB-SEM......................................... 116
xvi
NOMENCLATURE
Abbreviations
(LP)3N2 (La,Pr)3Ni2O7-δ, a Ruddlesden-Popper phase (An+1BnX3n+1) with n = 2
(LP)4N3 (La,Pr)4Ni3O10-δ, a Ruddlesden-Popper phase (An+1BnX3n+1) with n = 3
AC Alternating current
ALS Adler-Lane-Steele model
AFC Alkaline fuel cell
AFL Active functional layer
BM Ball milling
BSE Back-scattered electrons
CCL Current collector layer
CHP Combined heat and power
CL Cathodoluminescence
CPE Constant phase element
DC Direct current
DCFC Direct carbon fuel cell
DL Double-layer electrode, which consists of a layer of LPNO deposited by ESD
and then topped by a layer of LPNO deposited by SP (see: LPNO, ESD, SP, SL,
TL)
DMFC Direct methanol fuel cell
EDX Energy-dispersive X-ray spectroscopy
EHT Electron high tension
EIS Electrochemical impedance spectroscopy
ESD Electrostatic spray deposition

ii
FIB Focused-ion beam
FLW Finite-length Warburg
G Gerischer
GDC Ce1-yGdyO2-y/2. In this manuscript, the term GDC is exclusively used for the
material chosen as the electrolyte for the symmetrical cell with y = 0.1 (Ce-
0.9Gd0.1O2-δ) unless indicated otherwise
IT-SOC Intermediate temperature solid oxide cells
LPG Liquefied petroleum gas
LPNO LaPrNiO4+δ, a Ruddlesden-Popper phase (An+1BnX3n+1) with n = 1, the main
material studied in this thesis
LSCF La1-xSrxCo1-yFeyO3-δ, one of the vastly used materials for oxygen electrode
MCFC Molten carbonate fuel cell
OCP Open circuit potential
OCV Open circuit voltage
OER Oxygen evolution reaction
ORR Oxygen reduction reaction
PAFC Phosphoric acid fuel cell
PCFC Protonic ceramic fuel cell
PEMFC Proton-exchange membrane fuel cell
PVB Polyvinyl butyral, (C8H14O2)n
PVP Polyvinylpyrrolidone, (C6H9NO)n
RE Renewable energy
ROI Region of interest
RP Ruddlesden-Popper phase
SC Steam conversion rates

iii
SE Secondary electrons
SEM Scanning electron microscope
SL Single-layer electrode, which consists of a layer of LPNO deposited by ESD or
SP (see: LPNO, ESD, SP, DL, TL)
SOC Solid oxide cell
SOEC Solid oxide electrolysis cell
SOFC Solid oxide fuel cell
SP Screen printing
TL Triple-layer electrode, which consists of a layer of GDC deposited by SP,
topped by a layer of LPNO deposited by ESD, and then coated by a layer of
LPNO deposited by SP (see: GDC, LPNO, ESD, SP, DL, SL)
TPB Triple-phase boundary
XRD X-ray diffraction
XRF X-ray fluorescence
YSZ Yttria-stabilized zirconia
Symbols
Symbol Meaning Usual dimensions (values)
Roman symbols
A Area of the electrode cm2
a Specific surface area cm-1
a, b, c lattice parameter Å
C Capacitance F cm-2
D Diffusion coefficient m2 s-1
d Needle-substrate distance (ESD) mm
E or U Voltage or potential V

ii
E0 Standard potential V
F Faraday constant 96485 C mol-1
f Frequency Hz
fthermo Thermodynamic factor none
I Current A
i Current density A cm-2
j Complex number
k Surface exchange coefficient m s-1
L Inductance H
n (i) The number of consecutive perovskite layers
in an RP compound
(ii) the unknown partial charge state of adsorbed
oxygen
none
none
Q (i) Solution flow rate
(ii) Factor of proportionality (CPE element)
mL h-1
S s-α
R
(i) Resistance
(ii) the Boltzmann constant
Ω or Ω cm2 (area-specific)
8.314 J mol-1 K-1
T Temperature °C or K (K = 273 + °C)
t (i) time
(ii) ESD deposition time
s
h
Vm Molar volume cm3 mol-1
Z Impedance Ω or Ω cm2 (area-specific)
Greek symbols
α The exponential for circuit elements none
α, β, γ Unit cell angular parameters degrees (°)
γ Solution surface tension N m-1
δ Oxygen over-/under-stoichiometry none
ε0 Vacuum permittivity 8.85 x 10⁻¹² F m-1
η Overpotential V
θ (i) Diffraction angle
(ii) Phase angle
degrees (°)
degrees (°)
λ Wavelength nm

iii
ρ (i) Solution density
(ii) Resistivity
g cm-3
Ω m
σ Conductivity S m-1
τ Time constant s
ω Angular frequency rad s-1
Subscripts
act activation
ads adsorbed
ACC Anode current collector
AFL Anode functional layer
CCC Cathode current collector
CFL Cathode functional layer
conc concentration
chem
dc
Chemical
Direct current
e- electrical
f fractal (for Gerischer circuit)
io ionic
pol polarization
rev reversible
s series

1
INTRODUCTION

Introduction
2
The global warming inducing the climate change is becoming a very important issue to be
addressed since it is not only environmentally urgent, but it also affects social and economic
development, human welfare, and health [1]. Several studies have been carried out to model
the possible future scenarios on global warming with various mitigation efforts. In this context,
it is accepted by the community that the global temperature rise should not exceed more than
2 °C above the pre-industrial levels to avoid dangerous risks of climate change [2]. The Paris
Agreement, signed in 2016 within the United Nations Framework Convention on Climate
Change (UNFCCC), has a long-term goal to limit the temperature increase to 1.5 °C. To
achieve this goal, various mitigation efforts, especially from policy-makers, are necessary.
To find the best mitigation pathways, it is important to understand the causes of global warming.
The rise on the global surface temperature is more likely to be dominantly caused by human
influence (anthropogenic) as reported by the Fifth Assessment Report of the Intergovernmental
Panel on Climate Change (IPCC) [1]. The anthropogenic emission of greenhouses gases (GHG)
has a significant contribution to the increase of the atmospheric GHG concentrations which
causes the global temperature to increase. GHGs, such as carbon dioxide, methane, and nitrous
oxide, are produced from deforestation, agriculture, soil erosion, and, most important of all,
the combustion of fossil fuels. The emission of carbon dioxide from the combustion of fossil
fuel itself evidently contributed to 78% of the total GHG emission increase from 1970 and
2010 and the same percentage was observed between 2000 to 2010 [1]. Several strategies to
reduce the emission from fossil fuel use have been proposed such as energy conservation and
efficiency, fossil fuel switching, renewable energy (RE), nuclear, and carbon capture and
storage (CCS) [1].
Replacing the use of direct combustion of fossil fuels to low-carbon, clean energy systems such
as RE (e.g. biomass, geothermal, solar heat, hydropower, wind power), nuclear, and hydrogen
and fuel cells technology is on the top priority to reduce GHG emission, especially for the
electricity sector. Besides the aforementioned environmental reasons, the transition to low-
carbon energy systems is also motivated by the limited amount of non-renewable fossil fuel
resource which is predicted to become scarce in the near future.
One of the challenges in the utilization of RE technologies is their intermittency, especially for
solar and wind energy. Thus, to ensure the reliability of clean energy systems, the current
research interest in the energy sector is to develop energy systems by utilizing RE technologies
and integrating energy vectors such as hydrogen in the system [3]. Hydrogen is considered to

Introduction
3
be a promising energy carrier due to its abundance. As one of the most widespread elements
on earth, hydrogen can be obtained from various sources, either renewable or non-renewable.
Hydrogen can also be produced in numerous ways through electrical, thermal, biochemical,
and photonic means [4]. Until recently, more than 90% of hydrogen is produced from the
thermal dissociation of hydrocarbons such as steam reforming of natural gas, oil reforming,
and coal gasification, while the small fraction is produced from water electrolysis and other
sources [5], [6].
Hydrogen is vastly used in many industrial processes. In energy-related applications, it is
commonly used as fuel for the fuel cell system. A fuel cell is an electrochemical energy
conversion device that converts the chemical energy from the fuels into electricity and thermal
energy [7]–[10]. It consists of two highly catalytic electrodes which are separated by an
electrolyte. Unlike a battery, fuel cell requires an external supply of fuels and oxidants on either
side of the electrodes where a set of electrochemical reactions occurs to produce direct current
without the expense of the electrodes [9].
One of the key advantages of fuel cells, as compared to the conventional power generation
systems, is its high efficiency which can reach 40-50% of electrical efficiency, 65-70% for
combined cycle solid oxide fuel cell (SOFC) / gas turbine, and even up to more than 90% for
the combined heat and power (CHP system) [7], [11], [12]. The fuel that is used to power fuel
cells is normally hydrogen. However, other fuels such as solid carbon and hydrocarbon fuels
(natural gas, liquefied petroleum gas (LPG), biogas) can also be utilized. Even when carbon-
containing fuels are used, the emission of the fuel cell is still lower as compared to the
conventional energy system due to its high efficiency [10]. A fuel cell is also quiet in operation,
highly reliable, and requires low operating and maintenance costs. Fuel cell setup can operate
in a reversible mode as electrolyzer cells for hydrogen production, although normally the setups
are designed for one purpose only.
Notwithstanding all the mentioned advantages, several issues inhibit the wide applications of
hydrogen and fuel cell technology. The main issues are the relatively short lifetime of fuel cell
systems and the high capital cost. The high cost is especially related to the materials used for
the construction of the device, the current limited number of hydrogen and fuel cell facilities,
and the transport and storage of hydrogen.

Introduction
4
A fuel cell consists of an electrolyte that separates two electrodes; one works as the cathode
and the other one as the anode. The electrolyte can be either cationic (e.g. H+) or anionic (e.g.
O2-, OH-, CO32-) conductor. On the fuel cells with cationic conductor electrolytes, the hydrogen
from the fuel is oxidized into hydrogen ions and produced electrons on the anode. The hydrogen
ions then pass through the electrolyte while the electrons pass through the external circuit. The
hydrogen ions and electrons combine with oxygen from the oxidants on the cathode to produce
water and heat. The flow of electrons induces the production of electric current. Meanwhile,
on the fuel cells with anionic conductor electrolytes, the oxidants (e.g. oxygen) are reduced on
the cathode. Then, the resulting anions pass through the electrolyte, which then combined with
hydrogen from the fuel on the anode, produces water, heat, and electrons.
In electrolyzer cells, the opposite reactions occur on each electrode and the global reaction is
the electrolysis of water to produce hydrogen and oxygen. Note that the cathode of fuel cell
operates as the anode in the electrolyzer cell and vice versa. Thus, to avoid confusion, the
electrode exposed to the oxygen is normally referred to as the oxygen or air electrode while the
one exposed to the hydrogen as the hydrogen electrode. The typical reactions occurring on each
electrode for both fuel cell and electrolyzer cell for the two different electrolytes are
summarized in Table i.
Table i Typical reactions on the cathode and anode of fuel cells with either cationic or anionic
conductor electrolyte operating as both fuel cell and electrolyzer cell.
Cationic conductor electrolyte Anionic conductor electrolyte
Fuel cell mode Electrolysis mode Fuel cell mode Electrolysis mode
Oxygen electrode ½ O2 + 2 H+ + 2 e- → H2O
(cathode)
H2O → ½ O2 + 2 H+ + 2 e-
(anode)
½ O2 + 2 e- → O2-
(cathode)
O2- → ½ O2 + 2 e-
(anode)
Hydrogen electrode H2 → 2 H+ + 2 e-
(anode)
2 H+ + 2 e-→ H2
(cathode)
H2 + O2- → H2O + 2 e-
(anode)
H2O + 2 e- → H2 + O2-
(cathode)
Overall reaction ½ O2 + H2 → H2O H2O → ½ O2 + H2 ½ O2 + H2 → H2O H2O → ½ O2 + H2
Fuel cells can be classified according to the type of electrolyte used in the system determining
the operating temperature and the types of fuel [7], [10], [11]. Alkaline fuel cell (AFC), proton-
exchange membrane fuel cell (PEMFC), and direct methanol fuel cell (DMFC) are among fuel
cells operate at a temperature lower than 100 °C. These fuel cells have found a place on portable
and mobile applications such as cars. Phosphoric acid fuel cell (PAFC) operates at a
temperature between 160-210 °C and is typically used for stationary applications. Intermediate
temperature fuel cells such as molten carbonate fuel cell (MCFC) and protonic ceramic fuel

Introduction
5
cell (PCFC) operate at 600-750 °C. Lastly, the high-temperature fuel cells operate at a
temperature as high as 1000 °C such as direct carbon fuel cell (DCFC) and solid oxide fuel cell
(SOFC). The higher operating temperature fuel cells have higher efficiency due to faster kinetic
even without the use of expensive catalysts. Moreover, the high operating temperature provides
internal reforming capability which means that a wide range of fuels can be used without
utilizing an external reformer. The high-temperature fuel cells are most suited for stationary
power generation applications. Among fuel cells, SOFC has the highest efficiency which can
reach up to 90% with the CHP system. The comparison of the electrical efficiency of several
types of fuel cells and conventional power generation systems is presented in Fig. i.
Fig. i Efficiency potential of various power generation technologies (Stambouli, 2011) [10].
CCPP refers to a combined cycle power plant.
The share of clean energy as energy sources increases as the year goes by. The growing market
is driven by the rising demand for clean energy from the policy-makers to achieve the carbon
emission reduction target. The swift technological developments which able to optimize the
performance and lowering the cost of the new energy system also plays an important role. In
the field of hydrogen and fuel cell technology, various research and development efforts are
also being conducted to increase the availability of these systems, especially to address the
issues regarding the durability and to bring down the cost. Several examples on the current
research interest are efficiently and cleanly produce hydrogen from renewable sources by using
renewable energy, developing systems with the internal reforming capability to tackle the
problems on hydrogen transport and storage, and lowering the operating temperature of the
systems while maintaining the performance and efficiency to increase the lifetime and avoid

Introduction
6
the use of expensive materials. The main objective of this thesis is focused on the study of a
material suitable for oxygen electrode of solid oxide fuel/electrolyzer cell (SOFC/SOEC)
operating at a lower temperature with certain durability.
Objectives
Solid oxide cells (SOCs), which cover both SOFC and SOEC, operate at a high temperature
around 800-1000 °C. While there are several advantages, there are also several issues due to
this high operating temperature which will be detailed in Chapter 1.1. Therefore, it is of current
interest to decrease the operating temperature to around 650-750 °C. Such a system is called
an intermediate temperature SOC (IT-SOC). The main challenge on the development of IT-
SOC is the large overpotential of the oxygen electrode influenced by slower oxygen
reduction/evolution reaction (ORR/OER) as operating temperature goes down. To overcome
this challenge, it is hence important to work with materials which have good intrinsic properties
at lower temperature and also to vary the microstructures of the electrode as both factors are
important to determine the kinetics of ORR/OER (see Chapter 1.2). In this work, LaPrNiO4+δ
(LPNO) is chosen as the material for the oxygen electrode due to its intrinsic properties and
chemical stability in the range of the operating temperature (see Chapter1.3). The durability
of the materials under polarization, temperature, and time is also important to be understood
since one of the issues on the development of fuel cell, in general, is their relatively short
lifetime. Thus, based on these facts, the objectives of this thesis are as follow:
• To improve the LPNO oxygen performance by improving the microstructure and varying
the architectural designs of the electrode.
• To do a comprehensive study on the durability of LPNO as an oxygen electrode material
under polarization, temperature, and time in symmetrical fuel and electrolysis cells.
• To do preliminary durability investigation in real electrolysis cells.
Structure of the thesis
Besides the front pages and the introduction of the thesis, this manuscript is divided into 5
chapters. The details of each chapter are as follow:
• Chapter 1: Literature Study – This chapter is dedicated to providing the basic knowledge on
the core topics of the thesis which covers the sub-chapters on solid oxide cells (SOCs),
oxygen reduction/evolution reaction (ORR/OER), Ruddlesden-Popper phase materials with
Introduction
7
more focus on the rare-earth nickelates, and the degradation mechanisms on two types of
MIEC (mixed ionic and electronic conductor) oxygen electrode materials: the under-
stoichiometric and over-stoichiometric ones.
• Chapter 2: Fabrication and Characterization Techniques – In this chapter, the detailed
explanation of the fabrication and characterizations of the electrodes is provided. The
chapter starts with an explanation of the electrolyte materials that were used in the study,
followed by a presentation of the basic principles and detailed parameters of screen printing
(SP) and electrostatic spray deposition (ESD) as the fabrication techniques. The
microstructural characterization techniques by scanning electron microscopy (SEM) and
focused ion beam-scanning electron microscopy (FIB-SEM) tomography follow next.
Afterwards, the description of several structural characterizations such as laboratory X-ray
diffraction (XRD) in both room temperature and high temperature, and synchrotron-based
X-ray diffraction and fluorescence (including the preparation procedures of the lamellae by
plasma-focused ion beam (p-FIB)) are given. The last parts of this chapter include the
electrochemical characterization by electrochemical impedance spectroscopy (EIS) as well
as the details on the long-term durability tests.
• Chapter 3: Improving the Electrode Performance by Improving the Microstructure and
Electrode Designs – This chapter explains in detail the experimental results on the
improvement of the LPNO electrode performance in various ways. After the introduction of
the chapter, several preliminary results on the sample preparation by SP and ESD are
described. It is then followed by the results of structural characterization on LPNO powder
as well as ESD and SP layers. Afterwards, a brief explanation of the equivalent circuit model
for the EIS data fitting is provided. The following sub-chapters consist of the four main
results on the correlation between the electrode performance to the electrode/electrolyte
interface, the presence of secondary higher-order nickelate phase in the ESD layer, the
current collector layer (CCL) microstructure, and the architectural designs. The summary
and conclusions of this chapter are then given at the end. Large parts of this chapter have
been published in the Journal of Electroanalytical Chemistry
(https://doi.org/10.1016/j.jelechem.2019.113373).
• Chapter 4: Durability Study on the Symmetrical and Complete Cells – In this chapter, the
results of a long-term durability test in fuel cell and electrolysis modes in a symmetrical
configuration are presented. A preliminary study of the durability of the LPNO electrode in
two complete cells using different GDC barrier layers operating in electrolysis mode is

Introduction
8
described afterwards. Parts of this chapter have been published in the Journal of Power
Sources (https://doi.org/10.1016/j.jpowsour.2020.227724).
• Chapter 5: Post-mortem Structural and Microstructural Characterizations – This last chapter
is dedicated to the post-mortem analysis of the samples after durability tests. The chapter is
divided into two sub-chapters: (i) microstructural characterizations by SEM and FIB-SEM
and (ii) structural characterizations by XRD, µ-XRD, and µ-XRF. A comparison between
the aged samples and the pristine electrode is also performed here. Large parts of this chapter
have been published in the Journal of Power Sources
(https://doi.org/10.1016/j.jpowsour.2020.227724).
In the last part of the manuscript, global conclusions and perspectives based on this work are
given. Some classical techniques are described in appendices.

9
CHAPTER 1: LITERATURE
STUDY
This chapter is dedicated to providing the basic knowledge on the core topics of the thesis
which covers the sub-chapters on solid oxide cells (SOCs), oxygen reduction/evolution
reaction (ORR/OER), Ruddlesden-Popper phase materials with more focus on the rare-earth
nickelates, and the degradation mechanisms on two types of MIEC (mixed ionic and electronic
conductor) oxygen electrode materials: the under-stoichiometric and over-stoichiometric ones.
Chapter 1: Literature Study
10
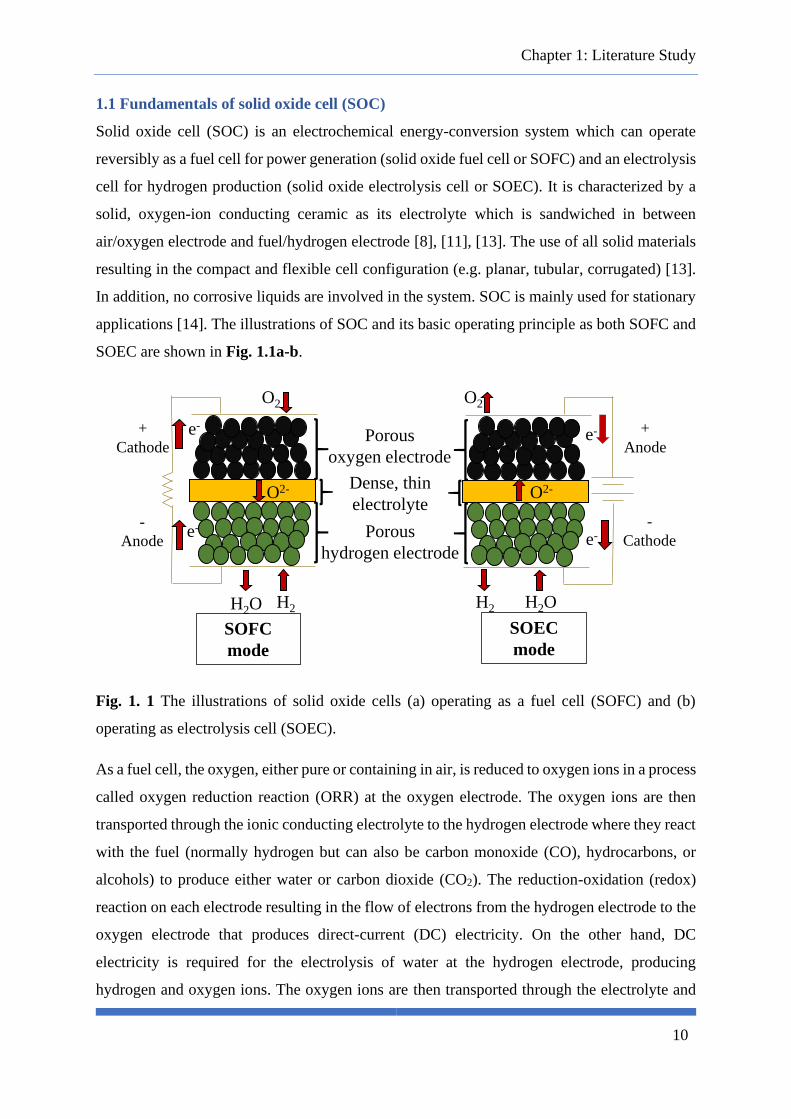
1.1 Fundamentals of solid oxide cell (SOC)
Solid oxide cell (SOC) is an electrochemical energy-conversion system which can operate
reversibly as a fuel cell for power generation (solid oxide fuel cell or SOFC) and an electrolysis
cell for hydrogen production (solid oxide electrolysis cell or SOEC). It is characterized by a
solid, oxygen-ion conducting ceramic as its electrolyte which is sandwiched in between
air/oxygen electrode and fuel/hydrogen electrode [8], [11], [13]. The use of all solid materials
resulting in the compact and flexible cell configuration (e.g. planar, tubular, corrugated) [13].
In addition, no corrosive liquids are involved in the system. SOC is mainly used for stationary
applications [14]. The illustrations of SOC and its basic operating principle as both SOFC and
SOEC are shown in Fig. 1.1a-b.
Fig. 1. 1 The illustrations of solid oxide cells (a) operating as a fuel cell (SOFC) and (b)
operating as electrolysis cell (SOEC).
As a fuel cell, the oxygen, either pure or containing in air, is reduced to oxygen ions in a process
called oxygen reduction reaction (ORR) at the oxygen electrode. The oxygen ions are then
transported through the ionic conducting electrolyte to the hydrogen electrode where they react
with the fuel (normally hydrogen but can also be carbon monoxide (CO), hydrocarbons, or
alcohols) to produce either water or carbon dioxide (CO2). The reduction-oxidation (redox)
reaction on each electrode resulting in the flow of electrons from the hydrogen electrode to the
oxygen electrode that produces direct-current (DC) electricity. On the other hand, DC
electricity is required for the electrolysis of water at the hydrogen electrode, producing
hydrogen and oxygen ions. The oxygen ions are then transported through the electrolyte and
-
Anode
Porous
oxygen electrode
Dense, thin
electrolyte
Porous
hydrogen electrode
+
Anode
-
Cathode
+
Cathode
SOEC
mode
e-
O2
H2 H2O
e-
O2-
SOFC
mode
e-
O2
H2H2O
e-
O2-

Chapter 1: Literature Study
11
oxidized into oxygen gas at the oxygen electrode through a process called oxygen evolution
reaction (OER). The overall reaction in SOFC and SOEC can be found in the two last columns
in Table i in the Introduction part of this manuscript.
SOC normally operates at high temperatures between 800 to 1000 °C [11], [14]. Compared to
the other types of fuel/electrolysis cells, SOC has the highest efficiency, especially in a
combined heat and power (CHP) system, thanks to the high operating temperature. Moreover,
an expensive catalyst (e.g. platinum) to assist the reaction is not necessary. An SOFC also has
the capability for internal reforming, leading to flexibility on the choice of fuel [13], [14].
However, the high operating temperature means that the materials should not only exhibit
excellent electrical and electrochemical properties, but also good chemical, thermal, and
mechanical stability to ensure a longer lifetime of the system in operation. At the same time,
from the techno-economic point of view, the cost of materials should also be low and they
should be able to be fabricated with ease at low fabrication cost [11]. SOC also has an issue
regarding the slow start-up and shutdown cycles which limits its portability. Thus, it is of
current interest to reduce the operating temperature down to 650-750 °C (intermediate
temperature SOC, IT-SOC) and even lower to below 650 °C (low-temperature SOC, LT-SOC)
[15]. Indeed, lowering the operating temperature brings down the cost of materials and
prolongs the lifetime of the system. However, it also reduces the kinetics of the reactions taking
place in the system because of the higher polarization losses from the electrolyte and electrodes
at lower temperature, as will be explained in more detail in §1.2. Hence, new materials
developments have been extensively studied as an effort to address this issue.
The detailed explanations on each component in an SOC are given hereafter.
1.1.1 Electrolyte
As previously mentioned, the electrolyte of an SOC should be able to conduct only oxygen
ions, hence, high ionic conductivity and low electronic conductivity are required for this
purpose. The oxygen ions are transported through the electrolyte via an oxygen vacancy
hopping mechanism which is a thermally-activated process [8]. Moreover, it should also be
fully dense with no open porosity to avoid any cross-diffusion of the fuel and oxidant
compounds. Since the electrolyte is in contact with both oxygen and hydrogen electrodes, it
should be chemically inert, have a similar thermal expansion coefficient (TEC), and have good
mechanical properties with respect to the electrode materials. The electrolyte should also be
chemically and structurally stable under both oxidizing and reducing environments. Reliable

Chapter 1: Literature Study
12
mechanical properties (i.e. high tensile strength and toughness) are also necessary to be able to
withstand thermal and mechanical stresses during cell fabrication and operation [8], [11].
Several common materials for SOC are the fluorite structure oxides (e.g. stabilized zirconia
ZrO2, doped ceria CeO2, doped Bi2O3) and perovskites (e.g. doped LaGaO3) [8], [11]. The
dopant enhances the ionic conductivity and phase stability of the electrolyte materials. The
material that has been widely used in practice is 3-10 mol% yttria-stabilized zirconia (Y2O3-
ZrO2, YSZ) due to its excellent stability. Among this family of material, 8 mol% YSZ (8YSZ)
with cubic structure has the highest ionic conductivity. However, compared to other ceramics,
the ionic conductivity of 8YSZ is far from the best and it is not good enough for operation at
intermediate and lower temperature as indicated in Table 1.1. Moreover, there is also an issue
of reactivity when lanthanum-based material is used for the electrode, such as the commonly
used La1-xSrxCo1-yFeyO3-δ (LSCF), forming an insulating phase La2Zr2O7. For these reasons,
another electrolyte material is preferred especially for the development of IT-SOC and LT-
SOC. One such material is the gadolinium-doped ceria (Ce1-yGdyO2-y/2, GDC). The GDC with
the addition of 10 mol% gadolinium as a dopant has been found to be a good candidate for
electrolyte due to its sufficiently high ionic conductivity, around 4-5 times higher than YSZ
[16], [17]. Moreover, GDC is also chemically stable in operation and compatible with various
electrode materials. The main drawback of GDC is the reduction of Ce4+ to Ce3+ in a highly
reducing environment especially at a temperature above 600 °C, which leads to the lattice
expansion, mechanical instability, and internal short-circuit due to high electronic conductivity.
Table 1. 1 The ionic conductivity (σ) and thermal expansion coefficient (TEC) of several
electrolyte materials.
Electrolyte material σ, S cm-1 (T, °C) TEC, 1 x 10⁻⁶ K-1
8 mol% Y2O3-ZrO2 (8YSZ) 0.052 (800), 0.178 (1000) [11] 10.5 [18]
Ce0.9Gd0.1O2-δ (GDC) 0.0095 (500), 0.0253 (600), 0.0544 (700) [16] 12.4 [8]
(La0.9Sr0.1)Ga0.8Mg0.2O3-δ 0.121 (800), 0.316 (1000) [11] 10.4 [8]
(La0.9Sr0.1)Ga0.83Mg0.17O3-δ 0.17 (800) [11] -
25 mol% Er2O3-Bi2O3 0.37 (700) [11] -
1.1.2 Air/oxygen electrode
The air/oxygen electrode is where the ORR/OER takes place. As will be explained in more
detail in §1.2, the reactions involve three different species which are gas, electrons, and ions at

Chapter 1: Literature Study
13
reaction sites called triple-phase boundary (TPB). Thus, the material for the oxygen electrode
should be porous to allow gas transport. The ORR/OER is considered to be responsible for the
majority of cell voltage losses, thus the choice of material for oxygen electrode with high
electrocatalytic activity is important to enhance the cell performance and efficiency. The
electrode should also have high electronic conductivity to ensure the electron flows to/from the
reaction sites from/to the external electrical circuit. High oxygen ion conductivity is not
compulsory, but its presence can significantly extend the reaction sites and, as a consequence,
increased the kinetics of reactions and electrode performance. The oxygen electrode should
also have similar TEC with the electrolyte to ensure compatibility. Good chemical stability
during fabrication and operation is also important. The properties, i.e. electronic and ionic
conductivities, thermal expansion coefficient, oxygen diffusion coefficient, and surface
exchange coefficient, of several oxygen electrode materials are listed in Table 1.2.
Table 1. 2 The electronic conductivity (σe-), ionic conductivity (σio), thermal expansion
coefficient (TEC), oxygen diffusion coefficient (D*), and surface exchange coefficient (k*) of
several oxygen electrode materials.
O2 electrode material σe-, S cm-1
(T, °C)
σio, S cm-1
(T, °C)
TEC,
1 x 10⁻⁶ K-1
D*, cm2 s-1
(T, °C)
k*, cm s-1
(T, °C)
La0.65Sr0.35MnO3
(LSM)
102 (800)
[17]
1.7 x 10⁻⁸
(800) [17] 12.3 [17]
4 x 10-14
(900) [17]
5 x 10⁻⁸
(900) [17]
La0.6Sr0.4Co0.2Fe0.8O3-δ
(LSCF)
302 (800)
[17]
8 x 10⁻³
(800) [17] 17.5 [17]
2.5 x 10⁻⁸
(800) [17]
5.6 x 10⁻⁶
(800) [17]
La2NiO4+δ (LNO) 70 (700)
[19]
1.8 x 10⁻²
(700) [20] 13.8 [21]
3 x 10⁻⁸
(700) [22]
0.5 x 10⁻⁶
(700) [22]
Pr2NiO4+δ (PNO) 100 (700)
[22] - -
5 x 10⁻⁸
(700) [22]
2 x 10⁻⁶
(800) [22]
La3Ni2O7-δ (L3N2) 90 (700)
[19] - 13.2 [21] - -
La4Ni3O10-δ (L4N3) 170 (700)
[19] - 13.2 [21] - -
A pure electronic conductor that is used the most as oxygen electrode material is strontium-
doped lanthanum manganite, La1-xSrxMnO3 (LSM). It has a perovskite-type structure, high
electronic conductivity, and negligible ionic conductivity. Thus, the TPB where the reactions

Chapter 1: Literature Study
14
take place is restricted only at the electrode/electrolyte interface where the gas, electrons, and
ions can be present at the same time. To extend the reaction site beyond the
electrode/electrolyte interface, a composite of pure electronic conductor, i.e. LSM, and pure
ionic conductor, i.e. YSZ, can be used as the oxygen electrode material. Another option is by
using mixed ionic and electronic conductor (MIEC) such as La1-xSrxCo1-yFeyO3-δ (LSCF) or
rare-earth nickelates Ln2NiO4+δ (Ln = La, Pr, Nd). The mixed conducting properties of MIEC
arise from the presence of either oxygen vacancy (oxygen under-stoichiometry such as for
LSCF) or interstitial (oxygen over-stoichiometry such as for rare-earth nickelates) resulting in
high oxygen ion conductivity in addition to the high electronic conductivity.
1.13 Fuel/hydrogen electrode
Similar to the air/oxygen electrode, three species are also involved in the reactions to produce
either water or hydrogen at the fuel/hydrogen electrode. Thus, similar requirements also apply
for hydrogen electrode, i.e. it should be porous, highly catalytic for water or hydrogen
production reactions, has high electronic conductivity and preferably also has high ionic
conductivity, has similar TEC with the electrolyte, and is chemically stable. If hydrocarbon is
used as the fuel in SOFC, the material should also possess high catalytic activity for
hydrocarbon cracking, sulfur tolerance, and resistance to coking [11].
The most common material used for the hydrogen electrode is Ni-YSZ cermet. Normally, it is
fabricated by mixing NiO with YSZ and reduction treatment is required before cell operation.
Ni metal exhibits high catalytic activity and high electronic conductivity (2 x 10⁴ S cm-1) [11].
The addition of YSZ, which is a pure ionic conductor, not only extends the reaction sites but
also prevents Ni coarsening during operation.
1.1.4 Sealing materials and interconnects
The seal is necessary to prevent the mixing between gases in the oxygen and hydrogen
electrodes. It is normally applied on the electrolyte, thus similar TEC between the sealant and
electrolyte is important. Moreover, it should also be chemically inert with respect to the other
cell materials and chemically stable under operating conditions. The sealing material is
normally made of glasses or glass-ceramic composites.

Chapter 1: Literature Study
15
Interconnects are mainly used to provide an electrical connection between the stack of cells. It
should have high electronic and thermal conductivities, high creep resistance, good mechanical
properties, similar TEC with the other components, and structural and chemical stability under
operating conditions. In a high-temperature SOC, ceramic materials are normally used for
interconnections. However, the electronic and thermal conductivities of ceramic materials are
low and they are also expensive. Hence, this is also one reason to lower the operating
temperature to allow the use of cheaper metallic interconnects.
1.2 Oxygen reduction/evolution reaction
1.2.1 Triple-phase boundary (TPB)
The processes that occur at the oxygen electrode of SOC involve three different species:
electrons, oxygen ions, and oxygen gas. In the simplest configuration, a porous electronic-
conducting oxygen electrode is in contact with an ionic-conducting electrolyte and both phases
are exposed to the oxygen-containing gas phase. The electrode is connected to an electrical
circuit at some distance away from the electrode-electrolyte interface. For the oxygen electrode
of SOC, the electrical circuit plays a role to conduct electrons to (for SOFC) or from (for SOEC)
this interface. The electrolyte provides the sink for the oxygen ions from the oxygen reduction
reaction (ORR for SOFC operation) or the source of oxygen ions for oxygen evolution reaction
(OER for SOEC operation). Thus, the ORR/OER should take place in the vicinity of the
electrode-electrolyte-gas phases interface. Since three phases are involved, these active regions
where the reactions take place are called the triple-phase boundary (TPB).
To increase the contact area between electronic and ionic conducting phases, hence, extend the
TPBs, a composite consisting of pure electronic (i.e. LSM) and pure ionic (i.e. YSZ)
conducting phases is used as the electrode instead of a pure electronic conductor. Another
approach is to use a single-phase mixed ionic- and electronic-conducting (MIEC) materials (i.e.
rare-earth nickelates) which can significantly extend the active regions since the ORR/OER
can take place on large parts of the electrode.
The mechanisms of ORR/OER itself are quite complex and involving several possible reaction
steps which are illustrated in Fig. 1.2 for a MIEC electrode [23]. The illustration is given for
ORR, thus, equivalent reactions in reverse direction should apply for OER. The explanation
for each step is given hereafter:
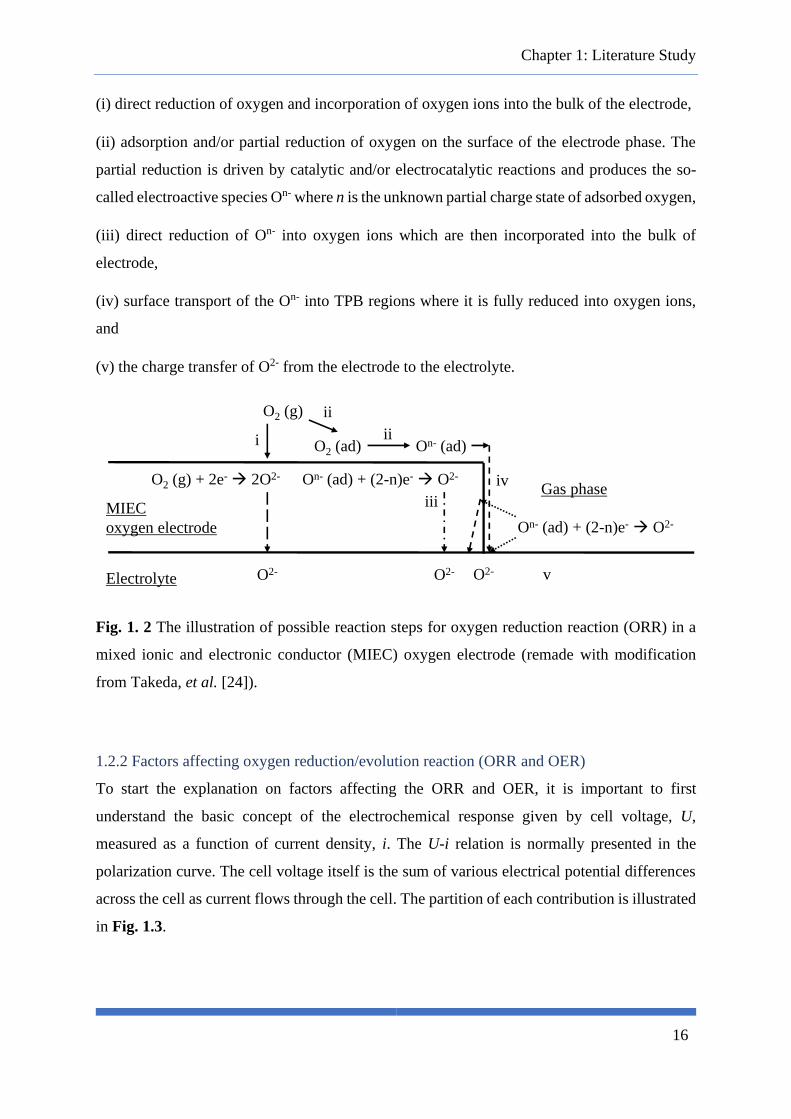
Chapter 1: Literature Study
16
(i) direct reduction of oxygen and incorporation of oxygen ions into the bulk of the electrode,
(ii) adsorption and/or partial reduction of oxygen on the surface of the electrode phase. The
partial reduction is driven by catalytic and/or electrocatalytic reactions and produces the so-
called electroactive species On- where n is the unknown partial charge state of adsorbed oxygen,
(iii) direct reduction of On- into oxygen ions which are then incorporated into the bulk of
electrode,
(iv) surface transport of the On- into TPB regions where it is fully reduced into oxygen ions,
and
(v) the charge transfer of O2- from the electrode to the electrolyte.
Fig. 1. 2 The illustration of possible reaction steps for oxygen reduction reaction (ORR) in a
mixed ionic and electronic conductor (MIEC) oxygen electrode (remade with modification
from Takeda, et al. [24]).
1.2.2 Factors affecting oxygen reduction/evolution reaction (ORR and OER)
To start the explanation on factors affecting the ORR and OER, it is important to first
understand the basic concept of the electrochemical response given by cell voltage, U,
measured as a function of current density, i. The U-i relation is normally presented in the
polarization curve. The cell voltage itself is the sum of various electrical potential differences
across the cell as current flows through the cell. The partition of each contribution is illustrated
in Fig. 1.3.
MIEC
oxygen electrode
Electrolyte
Gas phase
O2 (g)
O2 (ad)
O2-
On- (ad)
O2 (g) + 2e-→ 2O2- On- (ad) + (2-n)e-
→ O2-
O2- O2-
i
ii
ii
iii
iv
v
On- (ad) + (2-n)e-→ O2-

Chapter 1: Literature Study
17
Fig. 1. 3 The illustration of electrical potential at each interface across the cell (Laurencin [25]).
Notwithstanding that this illustration represents the SOEC system, the same contributions can
be applied also for the SOFC system. The differences lie on the convention of the current
density signs (here, the convention is taken as i < 0 for SOEC and i > 0 for SOFC) and the role
of each electrode (the oxygen/air electrode is always the positive electrode and operates as the
anode in SOEC and as the cathode in SOFC, vice versa for the hydrogen/fuel electrode). In this
illustration, the cell consists of (i) an ionic conducting electrolyte, (ii) electrodes (anode and
cathode) which consist of active functional layers, which is a composite of ionic and electronic
conductors, where the reactions take place and electronic-conducting current collector layer,
and (iii) metallic interconnects on the side of both electrodes. The cell voltage, U(i), can be
written as following [25]:
𝑈(𝑖) = (𝜑𝑒−1 − 𝜑𝑒−
𝐴𝐶𝐶) + (𝜑𝑒−𝐴𝐶𝐶 − 𝜑𝑒−
𝐴𝐹𝐿) + (𝜑𝑒−𝐴𝐹𝐿 − 𝜑𝑖𝑜
𝐴𝑛𝑜𝑑𝑒)
+ (𝜑𝑖𝑜𝐴𝑛𝑜𝑑𝑒 − 𝜑𝑖𝑜
𝐶𝑎𝑡ℎ𝑜𝑑𝑒) + (𝜑𝑖𝑜𝐶𝑎𝑡ℎ𝑜𝑑𝑒 − 𝜑𝑒−
𝐶𝐹𝐿)
+ (𝜑𝑒−𝐶𝐹𝐿 − 𝜑𝑒−
𝐶𝐶𝐶) + (𝜑𝑒−𝐶𝐶𝐶 − 𝜑𝑒−
2 ) = 𝜑𝑒−1 − 𝜑𝑒−
2 (Eq. 1.1)

Chapter 1: Literature Study
18
Thus, it can be seen that the measured cell voltage is the electrical potential difference between
the cell terminals. By considering all contributions above, the cell voltage can be decomposed
as followed for both SOEC (+ sign) and SOFC (- sign) operations:
𝑈 = 𝑈𝑟𝑒𝑣(𝑥) ± |𝜂𝑜ℎ𝑚𝑖𝑐(𝑥)| ± |𝜂𝑎𝑐𝑡𝐶𝑒𝑙𝑙(𝑥)| ± |𝜂𝑐𝑜𝑛𝑐
𝐶𝑒𝑙𝑙 (𝑥)| (Eq. 1.2)
In this equation, the cell voltage is considered to be constant along the cell length (x-direction
indicated in the illustration above) which means that at a certain cell voltage, the current density
is distributed along the cell length (and referred to as i(x) which is the local current density as
a function of the cell length) so that Eq. 1.2 is verified at each position x. The explanation for
each contribution is as follow [25]–[28]:
• The reversible voltage, Urev, is the thermodynamic contribution that corresponds to the
behavior of an ideal electrode. This term follows the Nernst equation and consists of the
contribution at open circuit potential (OCP, i = 0), 𝐸𝑂𝐶𝑃𝐶𝑒𝑙𝑙, and under the current (i ≠ 0),
Δ𝑉𝑟𝑒𝑣𝐶𝑒𝑙𝑙, for both anode and cathode (Eq. 1.3).
𝑈𝑟𝑒𝑣 = 𝐸𝑟𝑒𝑣𝑂2𝑒𝑙𝑒𝑐𝑡𝑟𝑜𝑑𝑒 − 𝐸𝑟𝑒𝑣
𝐻2𝑒𝑙𝑒𝑐𝑡𝑟𝑜𝑑𝑒
= (𝐸𝑂𝐶𝑃𝑂2𝑒𝑙𝑒𝑐𝑡𝑟𝑜𝑑𝑒 + Δ𝑉𝑟𝑒𝑣
𝑂2𝑒𝑙𝑒𝑐𝑡𝑟𝑜𝑑𝑒) − (𝐸𝑂𝐶𝑃𝐻2𝑒𝑙𝑒𝑐𝑡𝑟𝑜𝑑𝑒 + Δ𝑉𝑟𝑒𝑣
𝐻2𝑒𝑙𝑒𝑐𝑡𝑟𝑜𝑑𝑒)
= 𝐸𝑂𝐶𝑃𝐶𝑒𝑙𝑙 + Δ𝑉𝑟𝑒𝑣
𝐶𝑒𝑙𝑙 (Eq. 1.3)
As indicated by Eq. 1.4-1.7, the reversible potential depends on the partial pressure, 𝑝, of
the gases involved in the reaction on each side of the electrode. In these equations, 𝑅 is the
gas constant (8.314 J K-1 mol-1), 𝑇 is the temperature (K), and 𝐹 is the Faraday constant
(96485 C mol-1).
𝐸𝑂𝐶𝑃𝑂2_𝑒𝑙𝑒𝑐𝑡𝑟𝑜𝑑𝑒 = 𝐸0
𝑂2_𝑒𝑙𝑒𝑐𝑡𝑟𝑜𝑑𝑒 +𝑅𝑇
4𝐹ln(𝑝𝑂2_𝑖=0) (Eq. 1.4)
𝐸𝑂𝐶𝑃𝐻2_𝑒𝑙𝑒𝑐𝑡𝑟𝑜𝑑𝑒 = 𝐸0
𝐻2_𝑒𝑙𝑒𝑐𝑡𝑟𝑜𝑑𝑒 +𝑅𝑇
2𝐹ln (
𝑝𝐻2𝑂_𝑖=0
𝑝𝐻2_𝑖=0) (Eq. 1.5)
Δ𝑉𝑟𝑒𝑣𝑂2_𝑒𝑙𝑒𝑐𝑡𝑟𝑜𝑑𝑒 =
𝑅𝑇
4𝐹ln (
𝑝𝑂2_𝑖≠0
𝑝𝑂2_𝑖=0) (Eq. 1.6)
Δ𝑉𝑟𝑒𝑣𝐻2_𝑒𝑙𝑒𝑐𝑡𝑟𝑜𝑑𝑒 =
𝑅𝑇
2𝐹ln (
𝑝𝐻2𝑂_𝑖≠0 × 𝑝𝐻2_𝑖=0
𝑝𝐻2_𝑖≠0 × 𝑝𝐻2𝑂_𝑖=0) (Eq. 1.7)

Chapter 1: Literature Study
19
The contribution under current arises from the polarization due to changes in the gas
composition. In SOEC operation, O2 is produced on the oxygen electrode (anode) and thus
increases the O2 partial pressure and, in consequence, Δ𝑉𝑟𝑒𝑣𝑂2_𝑒𝑙𝑒𝑐𝑡𝑟𝑜𝑑𝑒 > 0. Meanwhile,
steam is consumed and H2 is produced on the hydrogen electrode (cathode) leading to
Δ𝑉𝑟𝑒𝑣𝐻2_𝑒𝑙𝑒𝑐𝑡𝑟𝑜𝑑𝑒 < 0. The changes in both electrodes resulting in an increase in the overall
cell voltage. The opposite explanations are true for SOFC operation which leads to the
decrease of the cell voltage.
This term is the theoretical voltage for the cell to operate. However, in real operation, the
voltage deviates from this theoretical value due to the polarization arises from the
operating condition and the nature of the materials involved. Moreover, since it only
considers the thermodynamics, it cannot predict the rate or kinetics. The polarization,
which is also called overpotentials (η), consists of several terms which will be explained
in the next bullet points.
• The ohmic overpotentials, ηohmic, originating from the polarization due to the ionic
resistances of the electrolyte (𝑅𝑒𝑙𝑒𝑐𝑡𝑟𝑜𝑙𝑦𝑡𝑒), electronic resistance of the current collector
layer (𝑅𝐴𝐶𝐶𝑒𝑓𝑓
and 𝑅𝐶𝐶𝐶𝑒𝑓𝑓
), and contact resistance of the interconnect/electrode (𝑅𝑐𝐴𝑛𝑜𝑑𝑒 and
𝑅𝑐𝐶𝑎𝑡ℎ𝑜𝑑𝑒 ) under the flow of current. This polarization is ohmic which means that it
describes the opposition of each material to the flow of electric current. It follows Ohm’s
law and it is described by Eq. 1.8. The electrolyte and current collector layer resistances
are proportional to the ratio between its thickness (𝑙) and its ionic or electrical conductivity
(𝜎𝑖𝑜 or 𝜎𝑒−𝑒𝑓𝑓_𝐶𝐶
) (Eq. 1.9 and 1.10).
𝜂𝑜ℎ𝑚𝑖𝑐 = (𝑅𝑒𝑙𝑒𝑐𝑡𝑟𝑜𝑙𝑦𝑡𝑒 + 𝑅𝐴𝐶𝐶𝑒𝑓𝑓
+ 𝑅𝐶𝐶𝐶𝑒𝑓𝑓
+ 𝑅𝑐𝐴𝑛𝑜𝑑𝑒 + 𝑅𝑐
𝐶𝑎𝑡ℎ𝑜𝑑𝑒) × |𝑖(𝑥)| (Eq. 1.8)
𝑅𝑒𝑙𝑒𝑐𝑡𝑟𝑜𝑙𝑦𝑡𝑒 =𝑙𝑒𝑙𝑒𝑐𝑡𝑟𝑜𝑙𝑦𝑡𝑒
𝜎𝑖𝑜 (Eq. 1.9)
𝑅𝐶𝐶𝑒𝑓𝑓
=𝑙𝐶𝐶
𝜎𝑒−𝑒𝑓𝑓_𝐶𝐶
(Eq. 1.10)
The term ‘effective’ electrical conductivity of the current collector layer refers to the
combination of the intrinsic properties of the material and the microstructure of the layer.

Chapter 1: Literature Study
20
Since the current collector layer normally exhibits high electrical conductivity, its
contribution to the loss can be considered to be negligible. The electrolyte resistance can
be minimized by choosing materials exhibiting high ionic conductivity and/or by reducing
its thickness. The interconnect/electrode contact resistance is relevant mainly for the stack
of cells and arises due to various causes such as the properties of the material, the contact
load, and the contact geometry. As indicated by Eq. 1.2, the ohmic polarization causes the
voltage gain in SOEC and voltage drop in SOFC.
• The activation overpotential, ηact, is predominantly related to the kinetics of the reactions
at the electrodes. As mentioned in §1.2.1, several steps are involved in the reaction in the
oxygen electrode only while another set of reaction steps take place in the hydrogen
electrode. Each step in both electrodes may have its contribution to the activation
polarization.
The rate of the reaction is proportional to the current density. The polarization at a certain
value of current density or vice versa is used to quantify the rate. The relation between the
polarization and the current density for a simple charge transfer can be expressed in the
widely known polarization equation called the Butler-Volmer equation. Activation
polarization depends on the nature of the reaction and it is more pronounced at lower
current density. By considering this factor, Eq. 1.11 shows the Butler-Volmer equation
derived for activation polarization.
𝑖(𝑥) = 𝑖0 [𝑒𝑥𝑝 ((1 − 𝛼𝐴𝑛𝑜𝑑𝑒)2𝐹(𝜂𝑎𝑐𝑡
𝐶𝑒𝑙𝑙(𝑥))
𝑅𝑇)
− 𝑒𝑥𝑝 (−𝛼𝐶𝑎𝑡ℎ𝑜𝑑𝑒2𝐹(𝜂𝑎𝑐𝑡
𝐶𝑒𝑙𝑙(𝑥))
𝑅𝑇)]
(Eq. 1.11)
In this equation, 𝛼 is the symmetrical factor which is usually taken as 0.5 and 𝑖0 is the
current exchange density which depends on the temperature, atmosphere, and the
electrochemical activity of the materials.
In a simple redox reaction, the kinetics of the reaction is limited by the charge transfer.
However, in a complex system like SOC, this is not the case because non-charge-transfer
processes, such as solid-state diffusion and chemical reaction, are also involved which

Chapter 1: Literature Study
21
might limit the reaction kinetics. Hence, the Butler-Volmer equation cannot fully explain
the kinetics for this system.
The activation overpotential of the oxygen electrode is considered to be more important
because OER and ORR are considered to be more difficult than the reactions on the
hydrogen electrode. One way to reduce the contribution of activation overpotential is by
using MIEC for the electrode material. As explained in §1.2.1, the reactions in MIEC are
extended to the whole electrode instead of restricted on the vicinity of TPB lines, thus
lowering the activation overpotential as a result. For the IT-SOC system, lower operating
temperature means that the activation polarization increases due to the higher activation
energy for the reaction to occur. Thus, for this system, the choice of materials with high
electrochemical activity even at intermediate temperature is important.
• The concentration overpotential, ηconc, arises from the gas transport between the bulk gas
phase and the surface of the electrode as well as inside the porous electrode. The gradient
of partial pressure exists between the reaction sites (i.e. electrode surface) and the bulk gas
phase which arises from the supply or depletion of gas due to reactions and diffusion. This
effect is more significant at a higher current density where the reaction rate is faster. From
the derivation of the Butler-Volmer equation, the gradient of partial pressure induces
electrode polarization.
As the current density increases, the reaction rate becomes faster up to a certain value of
current density, called limiting current density 𝑖𝑙𝑖𝑚, at which the reaction diverges due to
the lack of available gas for reaction (for reduction reactions). The limiting current depends
on the surface area and thickness of the electrode, as well as diffusion coefficient and the
bulk concentration of the gas (in SOEC: steam on hydrogen electrode, in SOFC: O2 on
oxygen electrode and H2 on hydrogen electrode).
From the explanations above, the cell voltage shows the deviation from the ideal behavior of
the electrode due to the ohmic losses, and activation and concentration overpotentials. This
deviation is directly related to the efficiency of the cell and is proportional to the current
density. In SOFC, the polarization results in the decrease of the cell voltage which means that
the work/energy that can be recovered from the processes is less than the theoretical
calculation. Meanwhile, the increase of the cell voltage due to the polarization in SOEC means
that more energy than the thermodynamic prediction is required for the reactions to take place.

Chapter 1: Literature Study
22
A model developed by Adler-Lane-Steele (ALS model) explains the electrode kinetics
specifically for porous MIEC oxygen electrode and takes into account the polarization due to
ohmic losses, charge transfer processes, and non-charge-transfer processes [29]. From this
model, the mechanism of the ORR and OER seems to be governed by O2 exchange at
electrode/gas interface and transport of O2- across the electrode through solid-state diffusion.
The electrode kinetics related to the non-charge-transfer processes, which is expressed as its
impedance 𝑅𝑐ℎ𝑒𝑚, is proportional to the intrinsic transport properties of the electrode material
and the microstructural properties of the electrode through the equation below:
𝑅𝑐ℎ𝑒𝑚 =𝑅𝑇
2𝐹2 √𝜏
(1 − 휀)𝑎𝑘𝑜𝐷𝑜𝑐𝑜2
(Eq. 1.11)
Thus, the kinetics of the reaction on the oxygen electrode depends mainly on two factors: (i)
the intrinsic properties of the electrode materials such as the oxygen concentration in the lattice
( 𝑐𝑜 ) and the transport properties (oxygen surface exchange ( 𝑘𝑜 ) and oxygen diffusion
coefficient (𝐷𝑜)); (ii) the microstructure of the electrodes (porosity (휀), specific surface area
(𝑎), tortuosity factor (𝜏)).
1.3 Ruddlesden-Popper phase: rare-earth nickelates
Ruddlesden-Popper (RP) phase, which was named after Ruddlesden and Popper who
previously reported the series of titanates Srn+1TinO3n+1 [30], is a homologous series of
compounds which are structurally similar to the titanates. These compounds are based on
K2NiF4 structure and have a general formula of An+1BnX3n+1, where A is an alkaline-earth or
rare-earth metal cation (e.g. Ca, Sr, Ba, La-Lu), B is a transition metal cation (e.g. Ti, Ni, Mn,
Fe), X is an anion (e.g. O), and n = 1, 2, 3, ∞ [31]. The compound consists of alternating n
numbers of perovskite layers (ABO3)n with a rock-salt AO intergrowth along the
crystallographic c direction as shown in Fig. 1.4a-b [21], [31], [32]. The relatively open
structural framework of the RP structure provides the over-stoichiometry (δ) of oxide ions at
the interstitial sites on the rock-salt layers, resulting in high ionic conductivity. The oxygen
over-stoichiometry also resulting in B cation oxidation and generating electron-hole charge
carriers which contribute to the electronic conductivity [33]. Both ionic and electronic
conducting properties indicating that RP phase is a MIEC.

Chapter 1: Literature Study
23
Fig. 1. 4 (a) Polyhedral view of a Ruddlesden-Popper structure of general formula An+1BnO3n+1
consisting of nABO3 perovskite layers sandwiched between two AO rock-salt layers. Oxygen
in equatorial (Oeq), apical (Oap), and interstitial (Oi) sites have been highlighted (Tarancón, et
al. [32]). (b) The illustrations showing the ABO3 layers for n = 1, 2, and 3 (Amow, et al. [34]).
Among the family of RP phases, the first-order (n = 1) rare-earth nickelates Ln2NiO4+δ (Ln =
La, Pr, Nd) has been gained interest as a material suitable for the oxygen electrode of IT-SOC.
There have been several studies on the solid solution of lanthanum-praseodymium nickelate,
La2-xPrxNiO4+δ (0 ≤ x ≤ 2), which shows a promising electronic and ionic conductivity as well
as oxygen transport properties (oxygen diffusion coefficient and surface exchange coefficient)
even at an intermediate temperature as indicated in Table 1.2 in §1.1.2. Moreover, the TECs
of these compounds are close to those of YSZ and GDC electrolytes. The conductivities and
the transport properties of the La-Pr nickelates improve as the Pr content in the compound
increases. The improvement in the transport properties for Pr-rich compound can be attributed
to the smaller size of Pr ions as compared to La ions which resulting in higher over-
stoichiometry of oxide ions (δ) as seen in Table 1.3. However, higher Pr contents in the
compound lead to a less chemically stable compound [35]–[37]. The decomposition of La2-
xPrxNiO4+δ (0 ≤ x ≤ 2) after heat treatment at 700 °C for 30 days as reported in the literature is
given in Table 1.3. In this table, the electrochemical performance of the electrode, which is
expressed as the polarization resistance (Rpol), taken from one of the references is also given
and shows a decrease of the value as Pr content increases. The thermal decomposition of La-
Pr nickelates might be different depending on the fabrication technique and the microstructure
(a) (b)

Chapter 1: Literature Study
24
of the powder or film. However, it is well accepted that higher Pr contents resulting in a more
unstable compound.
Table 1. 3 The oxygen over-stoichiometry (δ), polarization resistance (Rpol) at 600 °C, and
thermal decomposition of La2-xPrxNiO4+δ (0 ≤ x ≤ 2) after heat treatment at 700 °C for 30 days
taken from two literature.
Compound Configuration δ Rpol at 600 °C
(Ω cm2) Final phases Ref.
La2NiO4+δ
(LNO)
ESD layer on
GDC electrolyte 0.16 3.33 Stable [35]
Powder 0.16 Stable [36]
La1.5Pr0.5NiO4+δ
ESD layer on
GDC electrolyte 0.18 2.37 Stable [35]
Powder 0.17 Stable [36]
LaPrNiO4+δ
(LPNO)
ESD layer on
GDC electrolyte 0.22 1.63 Stable [35]
Powder 0.19 LaPrNiO4+δ + (La,Pr)NiO3-δ +
(La,Pr)4Ni3O10-δ + Pr6O11 [36]
Pr2NiO4+δ
(PNO)
ESD layer on
GDC electrolyte 0.24 0.83
Pr2NiO4+δ + PrNiO3-δ + NiO +
Pr6O11 [35]
Powder 0.25 PrNiO3-δ + Pr4Ni3O10-δ +
Pr6O11 [36]
The crystal structures of La-Pr nickelates have been identified as orthorhombic. However, a
phase transition from Fmmm to Bmab space group depending on the Pr content have been
reported by Nishimoto, et al., Vibhu, et al., and Jacobson [22], [38], [39]. The cell parameters
as a function of Pr content is shown in Fig. 1.5 which shows that the compound with x ≥ 1
belongs to Bmab space group.

Chapter 1: Literature Study
25
Fig. 1. 5 The cell parameters as a function of Pr content in La2-xPrxNiO4+δ (0 ≤ x ≤ 2) (Nishimoto,
et al. [38]).
Montenegro-Hernández, et al. conducted a study on the reactivity of LNO and PNO with YSZ
and GDC electrolyte by mixing nickelate and electrolyte powders and then heating the mixture
to 900 °C for 72 h [37]. The study suggested a minor reactivity between LNO and PNO with
both YSZ and GDC electrolyte. However, they also showed that the reactivity depends on the
microstructure of the powder as indicated by a stronger reactivity for smaller particle size.
Besides the first-order phase, the higher-order RP phases such as Ln3Ni2O7-δ (n = 2) and
Ln4Ni3O10-δ (n = 3) also show excellent electrochemical properties. The electrical conductivity
increases with the increase of n, as seen in Table 1.2 in §1.1.2 [19], [21], [34]. Moreover, the
TECs are found to be similar to the first-order phase. The good electrochemical properties are
also reflected in the electrode performance which is found to be comparable or even better than
the first-order phase [40]–[43]. In terms of thermal stability, the higher-order phases are more
stable as shown by no detected decomposition after heat treatment at 900 °C for 2 weeks in air,
unlike for the first-order phase [34]. It is expected due to the increase of Ni3+ which is more
stable at lower temperatures.
1.4 Degradation of several MIEC oxygen electrode materials for SOC
Degradation or destabilization of the oxygen electrode is influenced by the material, its
fabrication technique and microstructure, and the operating conditions [37], [44]. The cell
operating conditions include the temperature, the electrode polarization, the current densities,
and gas composition. Thus, it is expected that the degradation of the same material might be
different in either fuel cell or electrolysis operations. It has been, for example, shown that the
LSCF decomposition is higher under electrolysis current compared to fuel cell condition [45].
Fmmm Bmab

Chapter 1: Literature Study
26
As a general matter, it has been suggested that the major factor on the degradation of oxygen
electrode could be the oxygen partial pressure (𝑝𝑂2) or the oxygen chemical potential (𝜇𝑂2
) in
the material across the electrode, especially at electrode/electrolyte interface [44], [45]. The
𝑝𝑂2 or 𝜇𝑂2
indeed plays a key role on the catalytic activity and phase stability of the materials.
It affects the electronic and ionic conductivities of the material. Besides, the phase
decomposition results in passivation film and/or insulating secondary phases that can hinder or
even block the electrochemical reactions [44].
In a complete cell operating as an SOEC, the degradation of the oxygen electrode becomes
especially important in a high current density (> 0.25 A cm-2). In addition to the decomposition,
the cell degradation also originates from many other phenomena such as the Ni coarsening of
the hydrogen electrode microstructure upon operation or the chromium poisoning of the
oxygen electrode by the interconnect materials.
The degradation rate of a cell is indicated by the difference in either the cell voltage or the
polarization resistance before and after the long-term test and expressed in mV kh-1 or V% kh-1
or mΩ cm2 kh-1 or Ω% kh-1. With the developments in the SOC technology over the years, it is
expected that the degradation rate of a stack in operation to be 0.11 V% kh-1 by 2019 [46]. The
evolutions of the degradation rate and lifetime of SOC stacks over the years are given in
Fig.1.6a-d. For example, Jülich research center (Germany) have reported durability
experiments on a two-layer short stack in fuel cell mode with degradation rates of 0.5 V% kh-1
and 2.5 Ω% kh-1 for the operation of more than 100,000 hours at 700 °C and 0.5 A cm-2 [47].
The degradation mechanism of one of the most used MIEC for oxygen electrode, LSCF, will
be given in the following sub-chapter. A brief explanation of the degradation of rare-earth
nickelates will be subsequently given in §1.4.2.

Chapter 1: Literature Study
27
Fig. 1. 6 Degradation rate under SOFC and SOEC operations in (a) V% kh-1 and (b) mΩ cm2
kh-1, as well as (c) the estimated lifetime, of various stacks versus the start date of the test taken
from published articles. (d) The degradation rate of stacks versus operating temperature for
various oxygen electrode materials. All graphs are taken from Skafte, et al. [46].
1.4.1 Degradation mechanism of LSCF oxygen electrode
As one of the most vastly used oxygen material, extensive studies on the degradation of LSCF
are available in the literature. It has been well understood that the strong segregation of Sr in
LSCF to both electrode surface and electrode/electrolyte interface upon operation is the main
cause of LSCF degradation. Moreover, LSCF reacts with YSZ electrolyte forming insulating
phases such as SrZrO3 and La2Zr2O7. Thus, in practice, a thin GDC barrier layer is usually
(a) (b)
(c) (d)
Chapter 1: Literature Study
28
inserted in between LSCF and YSZ electrolyte. However, strong Sr diffusion is still found even
with the barrier layer as indicated by the formation of SrZrO3 at the GDC/YSZ interface,
especially in SOEC operating conditions. Indeed, it has been demonstrated that Sr and Co
diffusions to GDC/YSZ interface are observed after an operation in electrolysis mode while
such diffusion is not observed after fuel cell operation, resulting in the higher degradation rate
of LSCF in SOEC operating condition. Since LSCF is characterized by its oxygen under-
stoichiometry, it is suggested that the high oxygen chemical activity in SOEC operation is
resulting in the decrease of the oxygen vacancy content in LSCF and driving the Sr segregation
from the structure [45].
1.4.2 Degradation mechanism of rare-earth nickelates
Rare-earth nickelates are one of the newly-developed materials for oxygen electrode, thus,
unlike LSCF, the study on its degradation is still very limited. However, it has been shown that
in contrast to LSCF, the degradation rate of these compounds is slower in electrolysis operation
than in fuel cells [36], [48]. Indeed, rare-earth nickelates exhibit oxygen over-stoichiometry
instead of the under-stoichiometry of LSCF, thus different behaviors are expected. For instance,
Kim, et al. reported that the LSCF electrode deposited on GDC/YSZNi-YSZ degrades much
faster than the one of LNO under the same SOEC conditions [48]. The post-mortem analyses
on the aged LNO have revealed that there is no reactivity with the electrolyte. Only a
decomposition of LNO into a deficient-perovskite LaNiO2.5 is detected, suggesting the reason
why the degradation rate is slow.
Meanwhile, Vibhu, et al. studied the effect of La/Pr ratio on the degradation of La2-xPrxNiO4+δ
(x = 0, 0.5, 2) symmetrical cells deposited on GDC/YSZ electrolyte in both SOFC and SOEC
operating conditions [36]. It has been shown that the degradation rate is slower in electrolysis
operation for all compositions while strong degradation is observed after fuel cell operation
(Fig. 1.7). After the test in fuel cell mode, the polarization resistances increase 9, 4, and 35
times the initial values for x = 0, 0.5, and 2, respectively. The post-mortem structural
characterization shows that similar decomposition is observed after both operations in SOEC
and SOFC for x = 0 and 0.5, while different phases are observed for x = 2 (Table 1.4). It is
suggested that the fast degradation in fuel cell operation is stemmed from the stronger La or Pr
diffusion to the electrode/GDC interface under cathodic polarization and resulting in the
formation of La-doped or Pr-doped ceria at the interface.

Chapter 1: Literature Study
29
Fig. 1. 7 The evolution of polarization resistance during operation in (a) SOFC mode and (b)
SOEC mode for La2-xPrxNiO4+δ (x = 0, 0.5, 2). The test is carried out in air at 700 °C and current
density (idc) of ±300 mA cm-2 (Vibhu [36]).
Table 1. 4 The final phases after operation in SOFC and SOEC modes for La2-xPrxNiO4+δ (x
= 0, 0.5, 2). The test is carried out in air at 700 °C for 1800 h and current density (idc) of ±300
mA cm-2 (Vibhu [36]).
x SOFC SOEC
0 (La2NiO4+δ) La2NiO4+δ + La4Ni3O10-δ + La2O3 La2NiO4+δ + La4Ni3O10-δ + La2O3
0.5 (La1.5Pr0.5NiO4+δ) La1.5Pr0.5NiO4+δ + (La,Pr)4Ni3O10-δ +
La2O3 + PrOx
La1.5Pr0.5NiO4+δ + (La,Pr)4Ni3O10-δ +
La2O3 + PrOx
2 (Pr2NiO4+δ) Pr2NiO4+δ + Pr4Ni3O10-δ + Pr6O11 +
NiO Pr2NiO4+δ + PrNiO3-δ + Pr6O11
(a) (b)

30
CHAPTER 2: FABRICATION AND
CHARACTERIZATION
TECHNIQUES
In this chapter, the detailed explanation of the fabrication and characterizations of the
electrodes is provided. The chapter starts with an explanation of the electrolyte materials that
were used in the study, followed by a presentation of the basic principles and detailed
parameters of screen printing (SP) and electrostatic spray deposition (ESD) as the fabrication
techniques. The microstructural characterization techniques by scanning electron microscopy
(SEM) and focused ion beam-scanning electron microscopy (FIB-SEM) tomography follow
next. Afterwards, the description of several structural characterizations such as laboratory X-
ray diffraction (XRD) in both room temperature and high temperature, and synchrotron-based
X-ray diffraction and fluorescence (including the preparation procedures of the lamellae by
plasma-focused ion beam (p-FIB)) are given. The last parts of this chapter include the
electrochemical characterization by electrochemical impedance spectroscopy (EIS) as well as
the details on the long-term durability tests.

Chapter 2: Fabrication and Characterization Techniques
31
2.1 Electrolytes for symmetrical and complete cells
Both symmetrical and complete cells are studied in this work. The symmetrical cells were
prepared by depositing LPNO as the oxygen electrode on both sides of the gadolinium-doped
ceria (Ce0.9Gd0.1O2-δ; GDC) pellet as the electrolyte. The dense GDC pellets, 1.1 mm thick and
19.6 mm in diameter, were prepared by pressing commercial powder (Praxair) followed by
sintering at 1400 °C for 4 h in the air (Fig. 2.1a).
Meanwhile, the complete cells were prepared by depositing the LPNO electrode on top of
commercial Ni-YSZ-supported half-cell (Fig. 2.1b). The half-cell, which is 50 mm in diameter
and 250 µm-thick, consisted of a thin (~8 μm) 8 mol% yttria-stabilized zirconia (8YSZ)
electrolyte deposited on top of thick cermet Ni-YSZ as the hydrogen electrode. A thin GDC
barrier layer was deposited on top of the YSZ electrolyte to prevent a reaction between LPNO
electrode and YSZ electrolyte. The sketch of the cross-section of a half-cell is given in Fig.
2.1c. Two different complete cells were studied in this work, which will be explained in details
in Chapter 4. The difference lies in the deposition technique of the GDC barrier layer; for CCell
1, it was deposited by screen printing and has a thickness of 4 μm, while for CCell 2, the 400-
nm thick barrier layer was deposited by RF magnetron sputtering [49].
Fig. 2. 1 (a) GDC electrolyte, (b) Ni-YSZ supported half-cell, and (c) the sketch of the cross-
section of the half-cell.
2.2 Fabrication techniques
2.2.1 Sol-gel auto-combustion to prepare LPNO powder for screen printing
LPNO powder was prepared in the lab by the sol-gel auto-combustion technique. This
technique is one of the most widely used methods to prepare oxide powders or nanoparticles
because it is able to produce a high-purity homogeneous crystalline powder with a small
particle size distribution [50]. The principle of this technique is based on propellant chemistry
Hydrogen electrode (Ni-YSZ)
Electrolyte (8YSZ)
Barrier layer (GDC)
Oxygen electrode (LPNO)
(a) (b) (c)
19.6
mm
50
mm

Chapter 2: Fabrication and Characterization Techniques
32
and involves a combination of chemical sol-gel and subsequent combustion processes [51].
The aqueous mixture of metal salts and organic complexing agent/fuel (e.g. glycine, urea, citric
acid) is stirred to ensure that the organic compound is well chelated with the metal ions. The
gel is then formed from this aqueous mixture through the sol-gel process followed by the
ignition of the gel to induce self-propagating combustion between the metal salts and the
organic fuel. The combustion resulting in the voluminous product with a large surface area
which is then ground to obtain powders.
Fig. 2. 2 Flowchart of the sol-gel auto-combustion procedure for the preparation of LPNO
powder.
The procedure of sol-gel auto-combustion to prepare LPNO powder is schematically shown in
Fig. 2.2. Firstly, the precursor powders La(NO3)3.6H2O (Acros Organic, 98.00 %),
Pr(NO3)3.6H2O (Sigma-Aldrich 99.90 %), and Ni(NO3)2.6H2O (Fischer Scientific, 99.00 %) in
stoichiometric ratio, as well as 30 mol. % excess of citric acid C6H8O7 (Acros Organic, 99.5 %)
as the organic chelating agent, were dissolved in absolute ethanol (C2H5OH or EtOH, VWR
Chemical, 99.95%) in 0.02 M (total cation concentration). This aqueous solution was then
heated at around 120 °C while maintaining the stirring to evaporate the solvent to form a gel.
The gel would be self-ignited to combust with the citric acid which leads to the formation of
voluminous green product. The obtained product was then manually ground and calcined in air
subsequently at 1050 °C for 2 h and at 1100 °C for 0.5 h. The post-calcined powder was then
manually ground. In some experiments, the LPNO powder was then ball-milled in dry
condition using a planetary ball mill for 2 h.
2.2.2 Screen printing (SP)
Screen printing (SP) is a versatile printing technique that has been vastly used in various areas
from garment printing to circuit board printing. It is also one of the most widely used techniques
for the deposition of electrodes for SOC due to its simplicity and flexibility. It is fast, easy to
adjust the microstructure of the deposited film, and can be used for a wide range of materials.
La-, Pr-, and
Ni-nitrates
Citric acid
EtOH
Stirred and heated
at 120°CGrinding
Calcination at
1050oC/2h + 1100oC/0.5h
in air Grinding

Chapter 2: Fabrication and Characterization Techniques
33
The deposition by SP is carried out by transferring the ink containing the material that is
intended to be deposited onto the substrate through a screen, as illustrated in Fig. 2.3. The
screen is a mesh (inox 18/0 mesh 90°, JFP Microtechnic, mesh size 20 μm) that is made
impermeable for the ink except on the area where the deposition is intended. The ink is
transferred onto the substrate by passing a squeegee to spread the ink across this permeable
area. The dimension and shape of the deposited film depend on the size and shape of the
permeable area itself, thus SP can be adapted for the deposition of a film of any size and shape
just by using a screen with a suitable permeable area. The density and thickness of the deposited
film depend on the size of the mesh aperture, the viscosity of the ink, and the speed and force
of the passing squeegee.
Fig. 2. 3 Illustration of screen printing.
In this work, SP was used to deposit both GDC and LPNO. The SP inks were prepared by
mixing powder (GDC or LPNO) and organic solvent (KD2921, Zschimmer, and Schwarz) with
the mass ratio of 1:1 for LPNO ink and 2:3 for GDC ink, with an addition of 1 wt. % polyvinyl
butyral (C8H14O2)n, Aldrich) as a binder. The GDC powder for the ink was a commercial
powder (Solvay) while the LPNO powder was prepared in the laboratory by the sol-gel auto-
combustion method as described in §2.2.1. The ink mixture was stirred and then passed through
the three-roll mill to further blend and homogenize the ink. The ink was then screen-printed on
the substrate. The GDC SP layer was deposited by passing the squeegee onto the substrate once
to obtain a film with 6 µm in thickness. The deposited film is then thermally treated in the air
at 450 °C for 2 h to remove the organic solvent and followed by further sintering at 1200 °C
for 2 h to obtain good adhesion between the film and the substrate. On the other hand, the
squeegee was passed twice to prepare the LPNO SP layer with a drying step at 100 °C for 10
minutes in between each SP deposition to obtain 30 µm-thick of film. The subsequent thermal
removal of the organic solvent was carried out in air at 450 °C for 2 h followed by sintering at
temperature ≥800 °C depending on the type of the samples and the experiments which will be
detailed in each chapter regarding the experimental results.
Ln2NiO4+δ

Chapter 2: Fabrication and Characterization Techniques
34
2.2.3 Electrostatic spray deposition (ESD)
Electrostatic spray deposition (ESD), schematically shown in Fig. 2.4a, is a film deposition
technique, based on the electro-hydrodynamic laws, that is able to coat films from tenth of
nanometers to tenth of micrometers [52]–[54]. The electrically conductive precursor solution
is injected through a needle/nozzle on which electrical voltage is applied. When the small
volume of precursor droplet on the tip of the needle is exposed to a small electric field, it is
slightly deformed in shape due to the force from the solution surface tension alone. The electric
field force becomes more important as the electric potential increases and when both forces
reach a similar magnitude, a cone-like shape is formed on the tip of the needle. When the
applied potential reaches a certain critical value (several kV), the jet of liquid is emitted from
the vertex of the cone. The critical voltage depends on the physical-chemistry of the precursor
solution. The jet then breaks up into spray containing small and uniform electrostatically
charged droplets which will be attracted to the grounded and heated substrate by a Coulombic
force, and then spread and dry on the substrate leaving the solute in the precursor solution to
form a film [52]. When the flow rate of solution feeding the droplets on the tip of needle equals
the flow rate of the emitted jet, a steady-state condition is achieved and the conical meniscus
is usually referred to as the Taylor cone [55]. To obtain a stable cone-jet, the applied voltage
should be slightly higher than the critical value. The voltage should not be too high either
because it leads to the formation of multiple jets from the inside of the needle [56]. The jet
breakup into spray is also more disordered because of large lateral instability [52]. The stages
of the spray formation as a function of the applied voltage is illustrated in Fig.2.4b. To avoid
dripping of solution in the beginning and at the end of the deposition, there are only two
possible directions of the spray which are either upwards of horizontally.

Chapter 2: Fabrication and Characterization Techniques
35
Fig. 2. 4 (a) Schematic diagram of electrostatic spray deposition (ESD) and (b) sketch of the
stages of spray formation as a function of the applied voltage.
The microstructure of the deposited film is greatly dependent on the arriving droplet size on
the surface of the substrate. This arriving droplet size can be estimated by Gañán-Calvo
equation (Eq. 2.1) [57].
𝑑𝑠𝑖𝑧𝑒 ∝ (𝜌휀0𝑄3
𝛾𝜎)
16⁄
(Eq. 2.1)
In this equation, ρ is the solution density (g cm-3), ε0 is the vacuum permittivity (8.85 x 10⁻¹² F
m-1), Q is the solution flow rate (mL h-1), γ is the solution surface tension (N m-1), and σ is the
solution electrical conductivity (S m-1). This equation shows that the microstructure is
especially influenced by the physical-chemistry properties of the precursor solution, i.e. the
surface tension (γ), the electrical conductivity (σ), and the density of the solution (ρ). The
boiling point of the solvent in the precursor solution is also significant because it determines
the evaporation rate of the solvent. Besides these factors, the technical deposition parameters
such as the flow rate of the precursor solution (Q), the distance between the needle and the
substrate (d), and the temperature of the substrate (T) are also important to determine the
microstructure of the deposited film. Flow rate determines the arriving droplet size as indicated
in Eq. 1, while both needle-substrate distance and substrate temperature determine the
evolution of the droplets during transport [58]. The substrate temperature is also especially
important in the spreading and drying of the droplets as they arrive on the surface of the
substrate. Larger needle-substrate distance resulting in longer transport time of the droplets and
consequently, the solvent in the droplets has more time to evaporate and resulting in drier and
smaller arriving droplets. A larger substrate temperature induces also a higher evaporation rate
of the solvent and consequently leads to the formation of smaller droplets.
+
Substrate
Needle
V
Heating
element
Precursor
solution
Q
d
(a) (b)
++
++
+
++
+
Needle
Taylor cone
Jet
Spray
0 kV Critical Deposition
++
Applied Voltage

Chapter 2: Fabrication and Characterization Techniques
36
The variations of the film morphology controlled by the parameters mentioned above can be
explained by the different spreading and drying processes affected especially by the size of the
arriving droplets on the substrate. Several studies have been done to observe the morphology
of the film by varying the solvent in the precursor solution and the deposition parameters [53],
[58]–[62]. Larger droplet size indicates that the droplets are wetter and contain a larger amount
of solvent. As they impact the substrate, the droplets will spread on the surface. If the boiling
point of the solvent is sufficiently high, the evaporation of the remaining solvent is slow and a
thin dense film is formed. However, intermediate to low solvent boiling point leads to
simultaneous spreading and drying on the surface of the substrate leading to cracked or
reticulated coatings, resembling columnar or reticular structure. Meanwhile, smaller droplet
size is drier and, consequently, presenting little spreading when impacting the heated substrate.
Instead, a mechanism called “preferential landing” becomes more important [52]. This
mechanism arises from the presence of induced charge on the surface of the grounded substrate
with an opposite sign from the arriving droplets in the strong electrostatic field. The induced
charge concentrates more on the parts of the substrate with larger local curvature resulting in a
larger electric field in these regions. Thus, the charged droplets are more attracted to these areas
leading to the formation of particle agglomerations. The morphology of the film resembles a
coral or tree-like microstructure.
ESD is a great alternative for the deposition of films due to its simple set-up and inexpensive
and non-toxic precursor. The low-temperature deposition, which is usually not more than
450 °C, is also beneficial to obtain small particle size in the nanometric scale. In the
applications for electrodes of fuel cells and batteries, the easy adjustment to vary the
microstructure is especially interesting because different morphologies are evidently able to
affect the electrochemical performance [53], [63]. Moreover, the adhesion of the ESD films is
usually very good even after sintering at low temperatures.

Chapter 2: Fabrication and Characterization Techniques
37
Table 2. 1 Deposition parameters by ESD to obtain a coral-like microstructure.
Physical-chemistry properties of the solution
Solvent EtOH: H2O 1:2 + 8 drops of HNO3 as a stabilizer
Conductivity (S m-1) ≈12 mS cm-1 at 25 °C
Technical deposition parameters
Distance between needle and substrate (d) 50 mm
Solution flow rate (Q) 1.5 mL h-1
Temperature of the substrate (T) 350 °C
Applied voltage (V) 12-14 kV
Deposition time (t) 216 min for symmetrical cell for a durability test
270 min for the other samples
Scan speed 2 mm/s
Step size 2 mm
In this work, the microstructure of the ESD layer is focused only on the coral-like
microstructure based on previous studies on La2-xPrxNiO4+δ by Sharma [35], [61], [63]. The
precursor solution for ESD was prepared in the same way as the precursor solution for the
preparation of LPNO powder by sol-gel auto-combustion (§2.2.1), but the solvent was a
mixture of EtOH and H2O (1:2). The addition of water slightly increased the boiling point of
the solution as compared to pure ethanol so that in the beginning step of the deposition, the
droplets slightly spread on the surface of the substrate before preferential landing mechanism
became more important. In this way, a coral-like microstructure with a very thin layer that
uniformly covered the surface of the substrate was obtained. To stabilize the solution and
prevent the formation of precipitates in the solution, 8 drops of nitric acid (HNO3, Chem-Lab,
65% vol.) were also added for every 30 mL of solution. The deposition was then carried out at
a temperature of 350 °C, a nozzle-to-substrate distance of 50 mm, a solution flow rate of 1.5
mL/h, and a long deposition time of 4.5 hours (except for symmetrical cell for durability test
which was deposited for only 216 minutes since smaller electrodes are required due to the
measurement setup). During the ESD deposition, the voltage was fixed to approximately 12-
14 kV. Since the size of the spray was limited to a certain value, the sample holder was moved
on horizontal directions (X and Y directions) to ensure that the spray covered every part of the
substrate irrespective of the size of the substrate. In this work, the speed of the movement of
the sample holder (scan speed) was 2 mm/s. A step size, which indicates the step taken to

Chapter 2: Fabrication and Characterization Techniques
38
change the direction of the movement after each deposition in a direction, of 2 mm was chosen.
All the ESD deposition parameters are listed in Table 2.1. The sintering after ESD deposition
was carried out at 960 °C for 6 hours in the air to promote crystallization and phase formation.
2.2.4 Design of the LPNO oxygen electrode
By combining SP and ESD, four electrode designs were prepared and studied. Fig. 2.5 shows
the sketches of the four investigated architectures of the LPNO oxygen electrode which are
described hereafter:
(i) and (ii) the single-layer electrode (SL) in which LPNO was deposited on the electrolyte by
either SP (Fig. 2.5a) or ESD (Fig. 2.5b);
(iii) the double-layer electrode (DL) of LPNO which consisted of the active functional layer
(AFL) deposited by ESD coated by the current collecting layer (CCL) deposited by SP (Fig.
2.5c);
(iv) the triple-layer electrode (TL) in which the AFL was composed of a porous SP interlayer
of GDC sandwiched between the dense electrolyte and the ESD layer of LPNO. The AFL was
topped by the CCL of LPNO deposited by SP (Fig. 2.5d).
The thickness in which the reactions extend within the electrode from the electrolyte interface
is estimated to be only several microns [29]. From this point of view, the LPNO ESD layer on
the DL electrode and both GDC SP and LPNO ESD layers on the TL electrode were referred
to as the active functional layer while the LPNO SP layer acted as the current collecting layer.
The deposition size varies depending on the purpose of the prepared electrode. The details on
the deposition size in diameter is given in Table 2.2.
Fig. 2. 5 Schematic diagrams of different architectural designs of LPNO electrode: single-layer
(SL) LPNO deposited by (a) SP and (b) ESD, (c) double-layer (DL) of LPNO AFL deposited
by ESD topped by LPNO CCL deposited by SP, and (d) triple-layer electrode (TL) in which
GDC electrolyte
SP LPNO
GDC electrolyte
SP LPNO
ESD LPNO
SP GDC
CCL
AFL
GDC electrolyte
ESD LPNO
GDC electrolyte
SP LPNO
ESD LPNO
CCL
AFL
(a) (d)(c)(b)

Chapter 2: Fabrication and Characterization Techniques
39
the AFL is a GDC interlayer deposited by SP topped by LPNO deposited by ESD and the CCL
is LPNO deposited by SP.
Table 2. 2 The diameter (in mm) of the deposition size for symmetrical and complete cells.
Symmetrical cell
Complete cell
All, except for the durability test For durability test
GDC SP 14 N/A N/A
LPNO ESD 15.6 10 20
LPNO SP 14 10 20
2.3 Microstructural characterization techniques
2.3.1 Scanning electron microscopy (SEM)
In this work, SEM is used to observe the morphology of the films by using ZEISS Ultra 55
instrument equipped with a FEG Schottky gun and equipped by a Bruker EDX system for
composition analysis. The EDX detector is an SDD detector with a 30 mm2 of collecting
surface. This kind of detector works at around -20°C, thus, it is not necessary to use liquid
nitrogen to cool the SDD detector. The observation was carried out both on the surface and the
cross-section of the prepared electrode. To observe the cross-section, the sample was cut by a
diamond pen. The samples were prepared for the characterization by placing them on small
aluminum blocks. Electrically conducting carbon tape was used to fix the samples in place.
The silver paste was then applied to connect the samples with the aluminum blocks and left to
completely dry at least for several hours to prevent outgassing inside the sample chamber of
SEM. Since the electrolyte was not electrically conducting, 1 nm-thin Au/Pd was deposited by
vacuum metallization on the surface/cross-section of the samples to obtain a conducting surface.
The images were mainly acquired by secondary electron imaging using an in-lens detector
which is located inside the electronic column above the objective lens. The electron
accelerating voltage (electron high tension or EHT) was 20 kV for the imaging of the surface
and 3 kV for the imaging of the cross-section. The measurements from the SEM images such

Chapter 2: Fabrication and Characterization Techniques
40
as average particle size and thickness were estimated by using ImageJ software. The basic
principle of SEM can be found in Appendix A.
2.3.2 Focused ion beam-scanning electron microscopy (FIB-SEM) tomography
The focused ion beam (FIB) is a technique vastly used especially in material science for site-
specific analysis, deposition, and ablation. Its set-up is similar to SEM as shown in Fig. 2.6a,
but a focused beam of ions is used instead of electrons. In the conventional FIB, liquid metal
ion source (LMIS) is used as the source of the ions. The most common LMIS is Ga source as
it has a low melting point and it can be focused on a very fine probe size (<10 nm in diameter)
[64]. The ion beam is produced by placing a reservoir of Ga in contact with a tungsten needle.
Liquid Ga reaches down to the tip of the needle and upon application of high electric potential,
a sharp cone is formed. Ions are then emitted from this cone due to field ionization and
accelerated down to the FIB column. The ion beam is then focused by a series of electrostatic
lenses before it reaches the sample chamber.
Contrary to the electron beam in SEM, the ion beam is destructive for the sample. As the ion
beam reaches the sample, the atoms in the sample surface are sputtered into either secondary
ions, neutral atoms, and secondary electrons. Thus, imaging by FIB is possible especially at
lower beam currents through the secondary ions. The sputtering is, however, also resulting in
the implantation of Ga+ into the samples.
The milling capability of FIB is widely used to prepare thin lamella or pillar for transmission
electron microscope (TEM) or synchrotron-based characterizations. FIB can also be coupled
with SEM and used for FIB-SEM tomography with the configuration shown in Fig.2.6b. For
this application, the SEM and FIB columns are separated by an angle of around 50°. The sample
stage is tilted so that the surface of the sample which is going to be milled is perpendicular to
the primary ion beam. The sample is then milled line-by-line by the ion beam followed by
image acquisition by SEM on the newly exposed surface. In this way, image slices correspond
to each SEM image are obtained. The slices of images are then stacked together and processed
to obtain a 3D reconstruction of the sample.

Chapter 2: Fabrication and Characterization Techniques
41
Fig. 2. 6 (a) The schematic illustration of FIB set-up (Gierak, 2014) [65] and (b) FIB-SEM
tomography configuration.
Usually, the sample for FIB-SEM tomography is prepared by infiltrating the sample with resin
under vacuum. The purpose is to fill the porosity and to avoid the contrast due to the depth of
field within the pores which makes the segmentation between the solid phase and the pores
impossible. Moreover, it is also to avoid a common artifact in FIB-SEM tomography called ion
mill curtaining. One of the causes of this artifact is different milling rates of the phases in the
sample such as between the solid phase and pores. The curtaining resulting in an irregular
milled surface appears as lines on the acquired images and is undesirable for quantitative
analysis. The dry sample-containing resin is then mechanically polished to obtain the flat and
parallel top and bottom surfaces as well as to decrease the thickness down to 7 mm or less. A
thin coating of carbon on the surface of the sample is necessary to reduce the charging of the
insulating materials.
(a)
FIB
SEM
54°
Sample
(b)

Chapter 2: Fabrication and Characterization Techniques
42
Fig. 2. 7 The schematic representation of step-by-step FIB-SEM tomography: (a) protective Pt
deposition on the region of interest (ROI) – (b) FIB milling to create a trench close to the ROI
– (c) the view of the ROI – (d) an example of a slice of image acquired by SEM using the in-
lens detector with the black parts indicating the resin-filled pores.
The FIB-SEM tomography on the prepared samples was carried out using either Crossbeam
550 (ZEISS) and Crossbeam NVision 40 (ZEISS, with a specific FIB column from SEYCO
SII) machines. Gallium source was used to produce Ga+ ions for the milling. The process began
with the deposition of platinum on the region of interest (ROI) to protect the top of the surface
from unintended sputtering (Fig. 2.7a). The rapid milling by the ion beam was then started
from an area outside the ROI to create a 25 µm-depth trench (Fig. 2.7b) and open the field of
view for the SEM (Fig. 2.7c). Afterwards, ion milling proceeded with a small current of 1.5
nA and a step size of 15 nm. The step size indicates the distance between each slice of the
image taken by SEM. An example of the SEM images was shown in Fig. 2.7d. The images are
acquired by SEM with an EHT of 1.5 kV and a pixel size of 15 nm x 15 nm. Both secondary
Pt deposition
GDC LPNO Resin
(a)
(d)
GDC LPNO
Trench
Pt deposition(c)
(b)
Trench

Chapter 2: Fabrication and Characterization Techniques
43
electron and back-scattered electron imaging can be obtained. However, in this work, the
processed images were taken by secondary electron using the in-lens detector.
Fig. 2. 8 (a) The raw, unprocessed SEM image – (b) the image after Bleach Correction to
reduce the shadowing effect – (c) the segmented image which shows the solid phase in white
and the porosity in black.
A few hundreds of image slices were necessary to obtain a sufficient size of a 3D volume. The
3D reconstructions and image processing were carried out by using Atlas3D (Fibics) and Fiji
(ImageJ) software in collaboration with the SIMAP laboratory. The first step was to put
together the slices of the images to create a 3D stack of images. Since there might be a slight
drift between each slice of the image, the alignment of the images was necessary. In Fiji
(ImageJ), the alignment was carried out by using a plugin called StackReg in which each slice
of image is used as the template to align the next slice. After the stack was perfectly aligned,
the next step was to do various image corrections such as to reduce the shadowing effect and
removing the artifacts if present (e.g. air bubble or curtaining due to imperfect resin
impregnation and other noises during image acquisition). The shadowing effect is an inevitable
effect that arises from the shadow cast by the walls of the trench resulting in the uneven gray
level distribution in which the bottom part of the image was several shades darker than the top
part, as seen in Fig. 2.7d and Fig.2.8a. The correction of this effect on every image in the stack
can be done by the Bleach Correction plugin in Fiji. The corrected stack, which was shown in
Fig. 2.8b, was then segmented. Image segmentation is a process of dividing a digital image
into multiple sets of pixels or segments. Each set of pixels is assigned to a label and each pixel
in the same label shares the same characteristics. In this work, the labels were given to identify
the solid phase and porosity. One way to do image segmentation is by thresholding method in
which a threshold grayscale value is chosen and every pixel less than that value is assigned to
a label while the pixels greater than that value are referred to another label. The thresholding

Chapter 2: Fabrication and Characterization Techniques
44
method resulting in the transformation of the grayscale image to the binary image as seen in
Fig. 2.8c.
The microstructural properties of the sample were then computed from the segmented stack.
The computation was carried out by using in-house codes written in MATLAB which has been
detailed in literature [66]–[68]. The computed properties were as follow:
(i) The phase volume fraction (휀𝑖) is obtained by calculating the percentage of voxels assigned
to phase i (i = solid phase or pores) over the total voxels of the 3D volume.
(ii) The phase connectivity (𝛿𝑖) is calculated from the percentage of connecting phase from one
side of the volume to the other.
(iii) The mean phase diameter (µm) is taken from the particle size distribution (PSD or
granulometry). The PSD is obtained by using a morphological opening method. A spherical
structuring element B is used with increasing size after each sequence. It starts with the opening
of the image with small B resulting in the disappearance of small particles. As the size of B
increases, the larger particles start to disappear. The obtained PSD is then fitted by Weibull
distribution. The mean phase diameter is obtained from the fitted parameter.
(iv) Specific surface area (SSA, 𝑆𝑝𝑖 , µm-1) is defined as the total surface area of a material per
unit of bulk volume. It calculates the total surface area which is the contact area between both
phases (solid and pores) by using covariance function. The calculated total surface area is then
normalized to the total volume of the 3D volume.
(v) Microstructure-factor (𝑀𝑖) shows the microstructural influence on the effective transport
property [69]. It is defined as the ratio between the effective conductivity 𝜎𝑖𝑒𝑓𝑓
and the intrinsic
conductivity for the dense, bulk material 𝜎𝑖𝑏𝑢𝑙𝑘 . This factor is also related to various
microstructural properties which are important for the diffusional properties such as the phase
volume fraction 휀𝑖 , percolation P, constrictivity (bottleneck effect) 𝛽𝑖 , and geometrical
tortuosity 𝜏𝑖𝑔𝑒𝑜
. In this work, 𝑀𝑖 is used to compute the “apparent” tortuosity factor through
this equation:
𝑀𝑖 = 휀𝑖 𝜏𝑖⁄ (Eq. 2.2)

Chapter 2: Fabrication and Characterization Techniques
45
2.4 Structural characterization techniques
2.4.1 Laboratory X-ray diffraction (XRD): room temperature and in-situ XRD
The structural characterization of the powders and films by laboratory XRD for this work was
carried out with a PANalytical X’pert Pro MPD The X-ray beam is generated by copper source
(Cu-Kα radiation) with the wavelength (λ) of 1.5419 Å in Bragg-Brentano geometry. An in-
situ high-temperature XRD was also performed from 25 to 1200 °C using the same instrument
equipped with a high-temperature chamber (Anton Paar HTK1200N). The dwelling time at
each temperature before the measurement is 30 minutes. The phases were identified based on
the powder diffraction file (PDF) from Internasional Centre for Diffraction Data (ICDD) and
the cell parameters were obtained by Rietveld refinement using Fullprof software [70]. The
basic principle of XRD is given in Appendix B.
2.4.2 Synchrotron-based X-ray: Lamellae preparation by plasma-FIB, micro-X-ray
diffraction (µ-XRD), and micro-X-ray fluorescence (µ-XRF)
For characterization by μ-X-ray diffraction and μ-X-ray fluorescence, thin lamellae were
extracted from the samples by using a plasma-focused ion beam (p-FIB) Vion (FEITM)
machine working with an inductively coupled plasma ions source. It is similar to the
conventional FIB described in §2.3.2 but Xe+ ions are used for milling instead of Ga+. The use
of Xe+ ions allowing higher maximum currents and milling rates about 60 times faster than
classical Ga+ FIB [71]. The lamellae were prepared by firstly positioning the samples in the
vacuum chamber of the plasma-FIB machine on a five-axial motorized stage. After the
identification of the eucentric height, the region of interest (ROI) was covered with a Platinum
(Pt) deposition (~3-4 µm) to protect the samples surfaces (Fig. 2.9a) using a low current of 15
nA [72]. Subsequently, the two sides of the ROI were milled to obtain the lamella (Fig. 2.9b).
This step was the longest of all procedure and was done at two currents, 180 nA and 59 nA, far
and close to the ROI, respectively. Once the lamella milling was completed (Fig. 2.9c), a small
Pt deposition was used to fix it on a specific micromanipulator and the sample was detached
from the cell using a low ion current of 59 nA (Fig. 2.9d). Finally, the last Pt deposition was
used to glue the lamella detached from the cell to an aluminum pin compatible with the sample
holder of the beamline (Fig. 2.9e). The extracted sample dimensions were approximately 100
x 80 x 20 µm3 (for width, height and depth, respectively) and all the procedures took around
10-11 hours per sample.

Chapter 2: Fabrication and Characterization Techniques
46
Fig. 2. 9 The schematic representation of the lamella preparation by p-FIB: (a) protective Pt
deposition on ROI – (b) FIB milling around the ROI – (c) isolated lamella – (d) sample
extraction from the cell – (e) sample mounted on the Al pin. (f) The schematic diagram of µ-
XRD and µ-XRF characterization at μXAS beamline, SLS, PSI, Switzerland.
The lamellae prepared from all the samples were characterized by μ-X-ray diffraction (μ-XRD)
and μ-X-ray fluorescence (μ -XRF) at μXAS beamline on the Swiss Light Source (SLS), Paul
Scherrer Institut (PSI), Switzerland. The measurement setup is schematically shown in Fig.
2.9f. A synchrotron-based X-ray beam with a high energy of 17.2 keV is passed through the
Kirkpatrick-Baez (KB) mirror which is able to focus the beam to a spot size smaller than 1 μm2
(1 μm horizontally by 0.5 μm vertically). The lamella of the sample was then positioned at the
focal plane and two-dimensional (2D) raster scans on X (horizontal) and Y (vertical) directions
were performed all over the lamella using the step size of 500 nm. Since the energy was high,
the X-ray was able to transmit through the thin lamella. An area detector positioned behind the
lamella and perpendicular to the incident beam was used to record the 2D projection of the
diffracted beam. Apart from it, a fluorescence detector was positioned at 90° from the incident
beam. Thus, both the local diffraction pattern and fluorescence spectrum can be recorded
simultaneously. The fluorescence refers to the re-emission of the X-ray beam with different
energy due to the absorption of the incident beam by the atoms in the sample which is the basic
principle of XRF. The incident beam ejects the electrons in the atom and as a result, the
electrons at higher energy levels fill-up the electron holes, and energy is released. The amount
(a) (b) (c)
(d) (e)
FIB
milling
Pt deposition
Micromanipulator
YSZ
Ni-YSZ
GDCLPNO
Al pin
KB mirrors
focusing system
XRF
detector
xy
Sample
(f)

Chapter 2: Fabrication and Characterization Techniques
47
of the released energy depends on the orbitals of the atom involved, thus this technique can be
used for the identification of the chemical elements in the sample. By obtaining the data for
both XRD and XRF, the distribution of both compounds/phases and chemical elements can be
obtained.
The high energy X-ray beam is obtained from the synchrotron source. A synchrotron is a cyclic
particle accelerator. The particle, such as an electron, is accelerated by the magnetic field in a
large (288 m in circumference for SLS) circular path called the storage ring. The particle moves
at very high speed close to the speed of light. The direction of the accelerated particle is
changed periodically towards the beamlines located in several locations around the storage ring.
Since the energy of the accelerated particle is high, the change in the direction results in the
release of energy at X-ray wavelength. The emitted X-ray is then used for various experiments
in the beamlines.
The following step after the characterization was to do data reduction for both diffraction
patterns and fluorescence spectra. The diffraction ring of each measured point was azimuthally
integrated by utilizing pyFAI, a Python library, to obtain the traditional 1D diffractograms [73].
A series of data conversion was then performed with scripts developed using Python. The 1D
diffractograms were then integrated along the horizontal direction parallel to the electrolyte
(X-direction in Fig. 2.9f) for each vertical position in the electrode thickness (Y-direction in
Fig. 2.9f). Therefore, a set of 1D diffractograms is obtained so that the distribution of the phases
across the thickness of the samples can be examined. The Rietveld refinement and fitting of
the diffractograms were carried out by XRDUA software [74], [75]. For the quantitative
analysis of the phases, batch line fitting was carried out also with the same software. The
identification of the elements from the fluorescence spectra was performed by PyMCA, another
Python library [74]. The 2D maps were generated by using Fiji software.
2.5 Electrochemical characterization technique: Electrochemical impedance
spectroscopy (EIS)
Electrochemical impedance spectroscopy (EIS) is a powerful technique that is used to
characterize and evaluate the behavior of electrochemical systems/cells. This technique is able
to measure the response of the cell under controlled variables such as temperature and oxygen

Chapter 2: Fabrication and Characterization Techniques
48
partial pressure. It has been widely used in various applications, e.g. fuel cell and battery
systems, corrosion, coating, etc.
Measurements by EIS are carried out by applying a small perturbation to the system in the form
of sine waves of either voltage (𝑣(𝑡) = 𝑉𝑚 sin(𝜔𝑡)) or current (𝑖(𝑡) = 𝐼𝑚 sin(𝜔𝑡)), and then
measuring the response in the current evolution (𝑖(𝑡) = 𝐼𝑚 sin(𝜔𝑡 + 𝜃)) or voltage (𝑣(𝑡) =
𝑉𝑚 sin(𝜔𝑡 + 𝜃)). In a linear system, the response will be sinusoidal and has the same frequency
(𝑓 = 𝜔/2𝜋 ) as the input waves but different phase (𝜃 ) and amplitude (𝑉𝑚 or 𝐼𝑚 ). The
amplitude of the perturbation should be sufficiently small to ensure the linearity of the system.
With the use of Fourier transformation, the voltage and current can be expressed as complex
quantity 𝑉(𝑗𝜔) and 𝐼(𝑗𝜔) where 𝑗 is an imaginary number (𝑗 = √−1). Thus, the ratio between
voltage and current at a specific frequency is similar to Ohm’s law for the DC circuit as
indicated by Eq. 2.3 [27], [76], [77].
𝑍(𝑗𝜔) =𝑉(𝑗𝜔)
𝐼(𝑗𝜔) (Eq. 2.3)
The term 𝑍(𝑗𝜔), or normally written as 𝑍(𝜔), is the impedance function and its frequency-
specific value is the impedance of the system. As in resistance for DC circuit, impedance is
defined as the opposite of the materials to electrical current flow. However, there is no phase
shift between voltage and current for a pure resistance, which is not the case for real electrodes.
Thus, impedance is the more general term to be used. The impedance function is expressed as
complex number 𝑍(𝜔) = 𝑍′ + 𝑗𝑍" where 𝑍′ is the real part (𝑅𝑒(𝑍)) and 𝑍" is the imaginary
part (𝐼𝑚(𝑍)). By definition, 𝑗 equals to 𝑒𝑥𝑝(𝑗𝜋/2), hence the impedance can be graphically
represented in a planar vector consisting of the real part along the 𝑥-axis and the imaginary part
along the 𝑦-axis (90° rotation in reference to 𝑥-axis), as shown in Fig. 2.10. The planar vector
has a magnitude of |𝑍| and a phase angle relative to 𝑥-axis of 𝜃, which is the phase difference
between the voltage and current. By applying simple trigonometric relations ( 𝑅𝑒(𝑍) =
|𝑍| cos 𝜃 and 𝐼𝑚(𝑍) = |𝑍| sin 𝜃 ) and Euler relation ( exp(𝑗𝜃) = cos 𝜃 + 𝑗 sin 𝜃 ), the
impedance can be expressed in polar form as indicated by Eq. 2.4.
𝑍(𝜔) = |𝑍|(cos 𝜃 + 𝑗 sin 𝜃) = |𝑍|exp (𝑗𝜃) (Eq. 2.4)
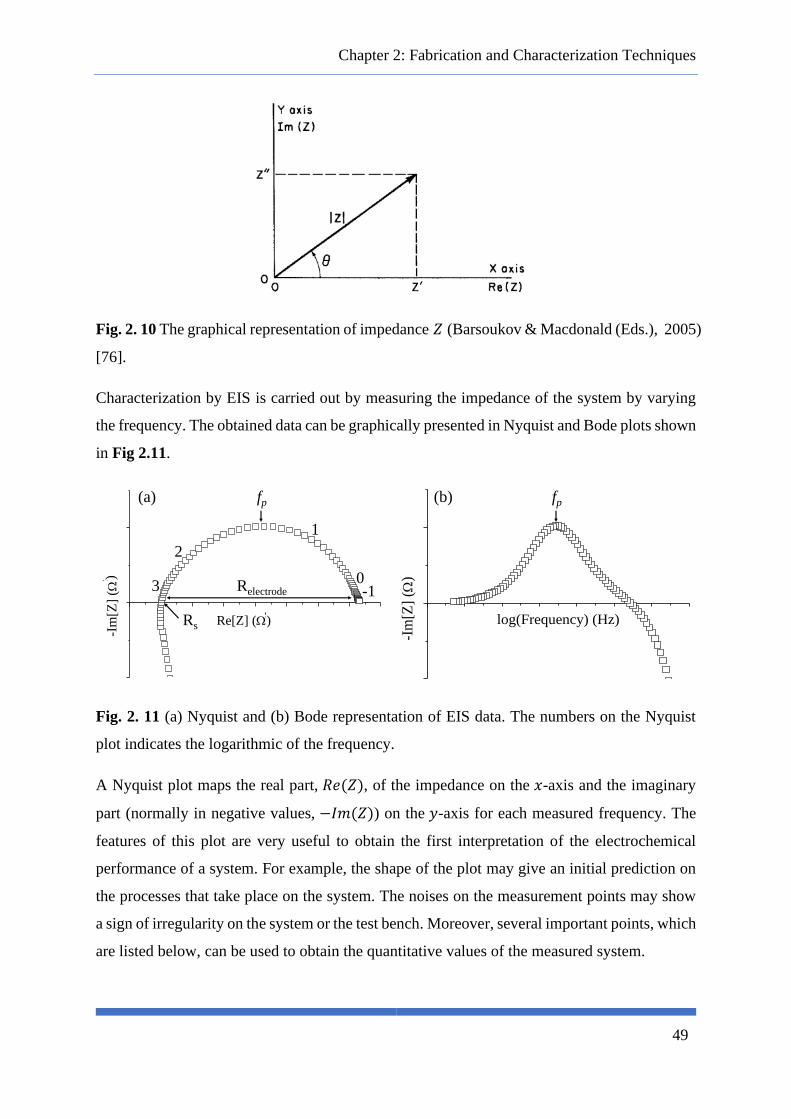
Chapter 2: Fabrication and Characterization Techniques
49
Fig. 2. 10 The graphical representation of impedance 𝑍 (Barsoukov & Macdonald (Eds.), 2005)
[76].
Characterization by EIS is carried out by measuring the impedance of the system by varying
the frequency. The obtained data can be graphically presented in Nyquist and Bode plots shown
in Fig 2.11.
Fig. 2. 11 (a) Nyquist and (b) Bode representation of EIS data. The numbers on the Nyquist
plot indicates the logarithmic of the frequency.
A Nyquist plot maps the real part, 𝑅𝑒(𝑍), of the impedance on the 𝑥-axis and the imaginary
part (normally in negative values, −𝐼𝑚(𝑍)) on the 𝑦-axis for each measured frequency. The
features of this plot are very useful to obtain the first interpretation of the electrochemical
performance of a system. For example, the shape of the plot may give an initial prediction on
the processes that take place on the system. The noises on the measurement points may show
a sign of irregularity on the system or the test bench. Moreover, several important points, which
are listed below, can be used to obtain the quantitative values of the measured system.
-Im
[Z]
( c
m2)
Re[Z] ( cm2)
-Im
[Z]
( c
m2)
log(Frequency) (Hz)
(b)(a)
-10
1
2
3
Rs
Relectrode
fp fp
-Im
[Z]
( c
m2)
Re[Z] ( cm2)
-Im
[Z]
( c
m2)
Re[Z] ( cm2)
-Im
[Z]
( c
m2)
log(Frequency) (Hz)

Chapter 2: Fabrication and Characterization Techniques
50
(i) The intercept of the plot on the 𝑥-axis at high frequency is called the series resistance (𝑅𝑠).
It is related to the ohmic resistance originating mainly from the electrolyte.
(ii) The difference between the intercept on the 𝑥-axis at low (𝜔 → 0) and high frequency (𝑅𝑠)
shows the total resistance of the electrode. This resistance is the sum of the resistances for
each process that takes place on the system. A more detailed explanation will be given
later in this section. The polarization resistance (𝑅𝑝𝑜𝑙) of the electrode is calculated from
this resistance.
(iii) The frequency on the peak, 𝑓𝑝, can be used to calculate the time constant, 𝜏, through the
equation 𝜔𝑝𝜏 = 𝑐𝑜𝑛𝑠𝑡𝑎𝑛𝑡. The value of the constant depends on the electrical element,
which will be explained later in this section. In a simple RC circuit, the value of the time
constant equals the resistance multiplied by the capacitance (𝜏 = 𝑅𝐶), thus this relation
can be used to calculate the capacitance of a process.
On the other hand, a Bode plot maps the frequency on the 𝑥-axis and either phase angle 𝜃 or
−𝐼𝑚(𝑍) as the 𝑦-axis. This plot is especially useful for easier visualization of the frequency
distribution versus the response of the system. Each peak present on the plot can be correlated
to a specific process that takes place in the system.
The frequency-dependent impedance of the system is related directly to the kinetics of various
reaction steps that take place on that system. Since an electrochemical system is analogous to
an electrical circuit, the interpretation of EIS data can be done by building a mathematical
model based on an equivalent electrical circuit consisting of the electrical element(s). Each
electrical element is equivalent to a specific physical process on the electrode. The electrical
circuit is then used to fit the experimental data. However, this data interpretation can be
complicated and uncertain by the fact that several different combinations of electrical elements
may yield the same impedance. Thus, it is important to have a rough idea of the possible
processes on the electrode and choose the suitable equivalent electrical element(s). A careful
interpretation of the modeling results is also important to ensure that the obtained properties
from the model are theoretically correct. By establishing a suitable model, the impedance
response of the system can be deconvoluted and assigned to a specific reaction(s), hence the
electrochemical behavior of the system can be explained.
The equivalent electrical circuit can be built from a simple element or a complex element. A
complex element consists of the combination of simple elements and/or other complex
elements in series and/or parallel. The simple elements can be divided into lumped elements,

Chapter 2: Fabrication and Characterization Techniques
51
which are taken from electrical elements, and frequency-dependent elements, which have a
correlation to a specific electrochemical process. The explanations on each element are given
in Appendix C.
There are several configurations to measure a cell by EIS based on the number of the
connections, namely 2-, 3-, and 4-electrode configurations (also called 2-, 3-, and 4-terminal).
In general, the measurement requires a counter electrode (CE) which provides current to the
cell and a working electrode (WE) from which the current through the cell is measured. In 3-
electrode configuration, a reference electrode (RE) is placed within the cell, while two REs are
necessary for 4-electrode configuration. The reference electrode is used for voltage
measurement. The illustrations of 2- and 3-electrode configurations for a symmetrical cell are
given in Fig. 2.12. A symmetrical cell consists of two identical electrodes which are prepared
on both sides of the electrolyte. Gold grids are placed on both electrodes for the current
collection. In 2-electrode configuration, the measured cell response corresponds to the response
of both electrodes, thus, the polarization resistance of the electrode (𝑅𝑝𝑜𝑙) is calculated by
divided the total electrode resistance (Fig. 2.11a) by two as indicated by Eq. 2.5. In this
equation, 𝐴 is the electrode area which is necessary on the calculation to normalize the
resistance. This normalized resistance is called the area-specific resistance. All the resistance
presented in this work refers to the area-specific resistance.
𝑅𝑝𝑜𝑙 = 𝑅𝑒𝑙𝑒𝑐𝑡𝑟𝑜𝑑𝑒 .𝐴
2 (Eq. 2.5)
For the 3-electrode configuration, a silver wire is placed in the middle of the side part of the
electrolyte as the reference electrode (Fig. 2.12b). By placing the RE, the response of the
working electrode can be separated from the counter electrode.

Chapter 2: Fabrication and Characterization Techniques
52
Fig. 2. 12 (a) 2-electrode and (b) 3-electrode configurations for EIS measurement. CE is a
counter electrode, WE is a working electrode, and RE is a reference electrode.
In this work, the electrochemical characterization of the symmetrical cell was carried out by
electrochemical impedance spectroscopy (EIS) technique using autolab potentiostat-
galvanostat (PGSTAT 302N). All measurements were carried out by using 2-electrode
configuration, except for the long-term test which will be detailed in §2.6.1. The measurements
were performed in a potentiostatic mode with a small sinusoidal amplitude of 0.02 V in the
0.01 Hz – 1 MHz frequency range. The tests were conducted in ambient air at the open circuit
potential (OCP) for a temperature ranging from 450 to 700 °C. The measurements were taken
for every 50 °C with dwell time before the measurement at each temperature of 2 h to ensure
the stabilization of the temperature. Gold grids (Heraeus, 1024 meshes cm-2 woven from 0.06
mm in diameter wire) were used as current collectors. The impedance spectra were analyzed
in terms of equivalent circuits with the EC-Lab® software.
2.6 Long-term durability tests
2.6.1 Long-term test on the symmetrical cell
In this work, a symmetrical cell is subjected to be investigated under current and temperature.
The double-layer LPNO, 10 mm in diameter, was deposited on both sides of the GDC pellet.
For the purpose of electrochemical measurement by a 3-electrode configuration, a silver wire
was placed approximately in the middle of the side of the GDC electrolyte pellet as the
reference electrode (see Fig. 2.12b for the configuration). Gold grids (Heraeus, 1024 meshes
cm-2 woven from 0.06 mm in diameter wire) were used as current collectors. This sample was
then subjected to a long-term electrochemical characterization at 700 °C for 960 h in the air
(a)
WE WE
CE CE
RE
Electrolyte
Electrode
Au grid
(b)

Chapter 2: Fabrication and Characterization Techniques
53
using autolab potentiostat-galvanostat (PGSTAT 302N). During the long-term experiment, DC
polarization currents (idc) of +300 mA cm-2 and -300 mA cm-2 (current of ±235 mA) were
applied on the upper and lower electrode, respectively. It means that the upper electrode was
subjected to an anodic polarization and worked in the electrolysis mode, while the lower
electrode was under a cathodic polarization and fuel cell mode. Before and after the long-term
study, EIS measurements were carried out on each side of the electrode both at the open circuit
potential (OCP) and under applied direct current in galvanostatic mode with a sinusoidal
amplitude of 10 mA in the 0.01 Hz - 1MHz frequency range.
2.6.2 Long-term test on the complete cell
The durability test on the complete cell is performed on a test bench, illustrated in Fig. 2.13, in
CEA-Liten Grenoble. The complete cell was prepared by depositing double-layer LPNO on
top of the GDC barrier layer on the YSZ electrolyte. Nickel grid (50 mm in diameter) and gold
grid (34 mm in diameter) were used as the current collector on the hydrogen electrode and
oxygen electrode, respectively.
Fig. 2. 13 The illustration of the test bench configuration for the durability test on the complete
cell.
To ensure gas tightness between both sides of the cell, glass sealing was carried out at only
860 °C for 1.5 h to avoid any grain growth of the oxygen electrode. During gas sealing, air and
nitrogen with the flow rate of 0.5 Nl h-1 were passed through the oxygen and hydrogen electrode,
respectively. A load of 3.38 kg (≈ 0.37 kg cm-2) was applied to ensure good contact between
CE
WE
Electrolyte (8YSZ)
Au grid
GDC barrier layer
O2 Electrode (LPNO)
H2 Electrode (Ni-YSZ)Ni grid
Air
Steam
(H2O)
H2
N2
RE1
RE2
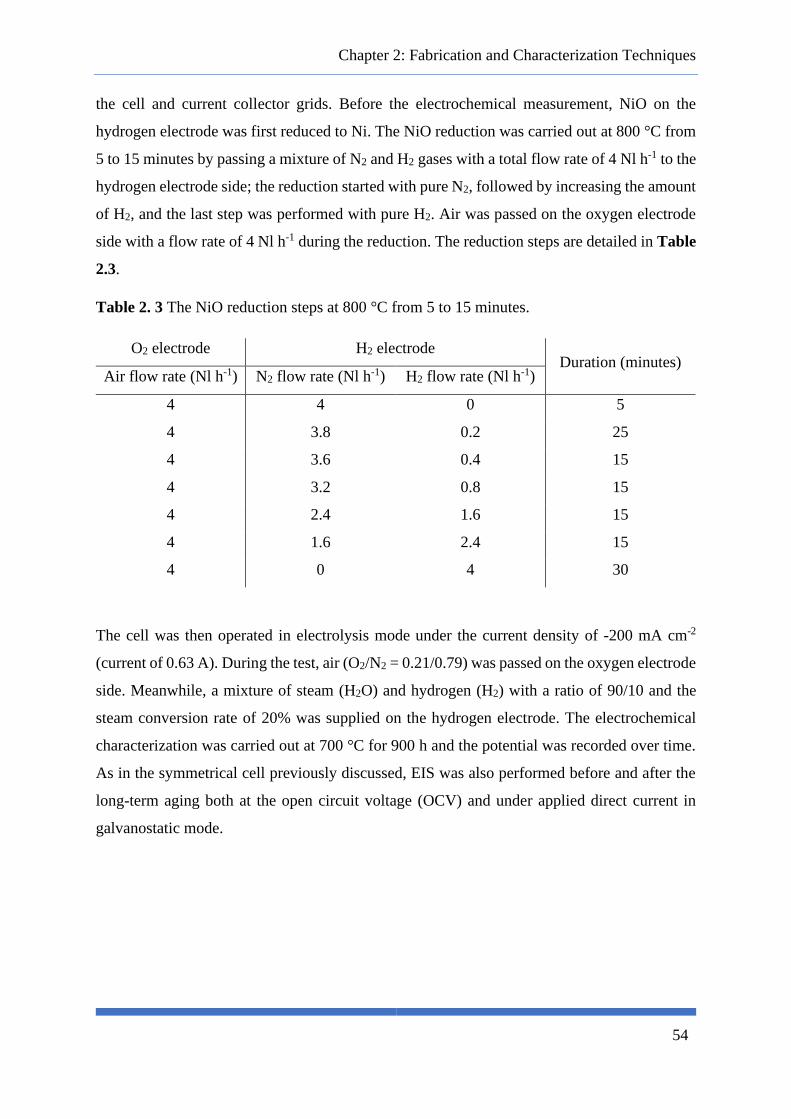
Chapter 2: Fabrication and Characterization Techniques
54
the cell and current collector grids. Before the electrochemical measurement, NiO on the
hydrogen electrode was first reduced to Ni. The NiO reduction was carried out at 800 °C from
5 to 15 minutes by passing a mixture of N2 and H2 gases with a total flow rate of 4 Nl h-1 to the
hydrogen electrode side; the reduction started with pure N2, followed by increasing the amount
of H2, and the last step was performed with pure H2. Air was passed on the oxygen electrode
side with a flow rate of 4 Nl h-1 during the reduction. The reduction steps are detailed in Table
2.3.
Table 2. 3 The NiO reduction steps at 800 °C from 5 to 15 minutes.
O2 electrode H2 electrode Duration (minutes)
Air flow rate (Nl h-1) N2 flow rate (Nl h-1) H2 flow rate (Nl h-1)
4 4 0 5
4 3.8 0.2 25
4 3.6 0.4 15
4 3.2 0.8 15
4 2.4 1.6 15
4 1.6 2.4 15
4 0 4 30
The cell was then operated in electrolysis mode under the current density of -200 mA cm-2
(current of 0.63 A). During the test, air (O2/N2 = 0.21/0.79) was passed on the oxygen electrode
side. Meanwhile, a mixture of steam (H2O) and hydrogen (H2) with a ratio of 90/10 and the
steam conversion rate of 20% was supplied on the hydrogen electrode. The electrochemical
characterization was carried out at 700 °C for 900 h and the potential was recorded over time.
As in the symmetrical cell previously discussed, EIS was also performed before and after the
long-term aging both at the open circuit voltage (OCV) and under applied direct current in
galvanostatic mode.

55
CHAPTER 3: IMPROVING THE
ELECTRODE PERFORMANCE OF
RARE-EARTH NICKELATES BY
IMPROVING THE
MICROSTRUCTURE AND
ARCHITECTURAL DESIGN
This chapter explains in detail the experimental results on the improvement of the LPNO
electrode performance in various ways. After the introduction of the chapter, several
preliminary results on the sample preparation by SP and ESD are described. It is then followed
by the results of structural characterization on LPNO powder as well as ESD and SP layers.
Afterwards, a brief explanation of the equivalent circuit model for the EIS data fitting is
provided. The following sub-chapters consist of the four main results on the correlation
between the electrode performance to the electrode/electrolyte interface, the presence of
secondary higher-order nickelate phase in the ESD layer, the current collector layer (CCL)
microstructure, and the architectural designs. The summary and conclusions of this chapter are
then given at the end. Large parts of this chapter have been published in the Journal of
Electroanalytical Chemistry (https://doi.org/10.1016/j.jelechem.2019.113373).

Chapter 3: Improving the Electrode Performance of Rare-Earth Nickelates by Improving the
Microstructure and Architectural Design
56
3.1 Introduction
As described in §1.2, the microstructure of the oxygen electrode and its interface with the
electrolyte plays a key role in its electrochemical activity. Thus, this chapter describes in detail
the experimental results of the effect of several microstructure-related variations on the
electrode performances. Nine symmetrical cells with various electrode designs and thermal
treatments of LPNO were prepared on gadolinium-doped ceria (Ce0.9Gd0.1O2-δ; GDC)
electrolyte. The samples are listed in Table 3.1. The electrochemical performances of all
samples were then characterized by EIS at the OCP. Structural and microstructural
characterizations by XRD and SEM were also carried out to provide supporting explanations
on the electrochemical responses of the oxygen electrodes.
Table 3. 1 List of samples discussed in this chapter with the heat treatment program. As
described in §2.2.4, SL = single-layer, DL = double-layer, and TL = triple-layer.
Sample # Architectural design Heat treatment in air Note
Sample 1 SL LPNO SP 450 °C / 2h + 800 °C / 2h
Sample 2 SL LPNO SP 450 °C / 2h + 1050 °C / 2h + 1100 °C / 0.5h
Sample 3 SL LPNO ESD 960 °C / 6h
Sample 4 DL LPNO (ESD + SP) 960 °C / 6h (ESD)
450 °C / 2h + 800 °C / 2h (SP)
Sample 5 DL LPNO (ESD + SP) 960 °C / 6h (ESD)
450 °C / 2h + 900 °C / 2h (SP)
Sample 6 DL LPNO (ESD + SP) 960 °C / 6h (ESD)
450 °C / 2h + 1050 °C / 2h + 1100 °C / 0.5h
(SP)
Sample 7 DL (LPNO ESD +
LPNO SP)
960 °C / 6h (ESD)
450 °C / 2h + 800 °C / 2h (SP)
Ball milling
of LPNO
powder
Sample 8 TL (GDC SP + LPNO
ESD + LPNO SP)
450 °C / 2h + 1200 °C / 2h (GDC SP)
960 °C / 6h (ESD)
450 °C / 2h + 800 °C / 2h (SP)
Sample 9 TL (GDC SP + LPNO
ESD + LPNO SP)
450 °C / 2h + 1200 °C / 2h (GDC SP)
960 °C / 6h (ESD)
450 °C / 2h + 800 °C / 2h (SP)
Ball milling
of LPNO
powder

Chapter 3: Improving the Electrode Performance of Rare-Earth Nickelates by Improving the
Microstructure and Architectural Design
57
Preliminary experiments are first reported to determine the optimized deposition parameters
by both SP and ESD. Various compositions belonging to the solid solution La2-xPrxNiO4+δ
(with x = 0, 1, 2) have also been prepared to investigate the effect of the La/Pr ratio on the
electrochemical behavior of La-Pr nickelates. These results have been compared with those of
the literature. Lastly, the reproducibility of the sample fabrication by SP and ESD has also been
tested by comparing the electrochemical responses of three identical symmetrical cells.
3.2 Preliminary experiments
3.2.1 Optimized deposition parameters by SP and ESD
3.2.1.1 SP layer: binder for the ink
A binder is required for the preparation of ink for SP to obtain a well-mixed ink paste. It is also
important for the texture and consistency of the ink. Binder plays a key role to ensure particle
network strength and has been shown to affect the microstructure and electrochemical
performance of the electrode [78]. The addition of binder increases the viscosity of the ink
which, in turn, improves the particle network strength. However, there is a maximum amount
of binder that can be added before the ink becomes too tacky and difficult to be printed.
Normally, 1 wt% of the binder is sufficient to obtain the ideal ink for screen printing.
There are two available options for the binder in our laboratory: polyvinylpyrrolidone (PVP,
(C6H9NO)n) and polyvinyl butyral (PVB, (C8H14O2)n). Both are polymer-based resin. To
determine which binder to use, two symmetrical cells of single-layer SP were prepared by using
either PVP or PVB. The other deposition parameters and the subsequent heat treatments were
identical for both cells following the procedures explained in §2.2.2. The electrochemical
measurement results by EIS of both samples from 450 to 700 °C in the air at OCP are presented
in the Arrhenius plots in Fig. 3.1. The activation energies are 1.23 and 1.20 eV for the samples
prepared by PVP and PVB, respectively. The similar values show that the same processes occur
at both electrodes. However, the Rpol of PVB cell is lower by around 30% at all temperatures
as compared to the PVP cell. Since there were no other characterizations carried out on these
samples, it is difficult to pinpoint the explanation behind the improvement of the PVB cell.
However, it is stated in the literature that the addition of PVB increases the viscosity of the ink
more significantly as compared to PVP of the same molecular weight [79]. Thus, it can be
suggested that PVB improved the connection between particles in the ink which results in a

Chapter 3: Improving the Electrode Performance of Rare-Earth Nickelates by Improving the
Microstructure and Architectural Design
58
better electrode microstructure. Based on this result, PVB is then chosen for the binder for SP
ink.
Fig. 3. 1 The Arrhenius plots of single-layer deposited by SP using either PVP or PVB as the
binder for the ink.
3.2.1.2 ESD layer: solution stabilization, deposition time, and hierarchical microstructure
The precursor solution for ESD which is composed of nitrates and citric acid (as a chelating
agent) powders is proven to be chemically unstable when a mixture of water and ethanol is
used as the solvent. The choice of the solvent is crucial to obtain an ESD layer with a coral-
like microstructure, which is the microstructure-of-interest for this work. The instability is
shown by the formation of precipitates in the solution just 1.5 h after the solution preparation
(Fig. 3.2a and b). Since the deposition time required to obtain sufficient thickness of the
electrode is more than 1.5 h, the precipitates blocked the flow of the solution to feeding the
needle during the deposition as shown by the picture in Fig. 3.2c. In consequence, the formation
of the spray to the surface of the substrate is hindered and it is impossible to complete the
deposition without intervention in the middle of the process (i.e. stop the deposition, clean the
tube, change the needle, and refill the tube with fresh solution). Moreover, some instabilities
of the spray impacting the substrate can occur if precipitates are formed and, consequently, the
morphology of the deposit is no longer homogeneous and the reproducibility of the electrode
cannot be guaranteed.
1.00 1.05 1.10 1.15 1.20 1.25 1.30 1.35 1.400.1
1
10
Rp
ol
( c
m2)
1000/T (K-1)
PVP
PVB
700 650 600 550 500 450
T (oC)

Chapter 3: Improving the Electrode Performance of Rare-Earth Nickelates by Improving the
Microstructure and Architectural Design
59
The origin of the formation of precipitates is probably linked to a closed limit of solubility, but
it is still not well understood. The precipitates are not formed when the same precursor powders
are dissolved in pure ethanol, nor when only La- and Pr-nitrates are dissolved in the mixture of
ethanol and water. Moreover, all powders are supposed to be highly soluble in both water and
ethanol. Constant stirring and heating do not solve the problem as well. However, a test carried
out by adding several droplets of nitric acid (HNO3) is proven to stabilize the precursor solution
and prevent the precipitation. After several trials, it is found that 8 droplets of nitric acid in 30
mL of solution is sufficient for this purpose.
At first glance, the addition of nitric acid seems to not greatly affecting the properties of the
solution since only small amounts of nitric acid are necessary. However, the measurement by
electrical conductivity meter shows that the solution conductivity increases by 4 times when
HNO3 is added (3 mS cm-1 without HNO3 and 12 mS cm-1 with HNO3 at 20 °C). From the
Gañán-Calvo equation (Eq. 2.1, §2.2.3), solution conductivity is one of the factors which
determine the arriving droplet size on the surface of the substrate. Since the droplet size is
inversely related to the solution conductivity, the arriving droplet size is estimated to be smaller
for the electrode prepared from solution with nitric acid. Thus, to see if there are any changes
in the microstructure due to nitric acid addition, two ESD layers were prepared by using the
precursor solution without and with nitric acid. The deposition time for both samples is 3 h,
and the subsequent sintering is carried out in air at 960 °C for 6 h. The surfaces and cross-
sections of both samples were then observed by SEM.
The surface of the sample without HNO3 (Fig. 3.2d) shows larger blocks of a deposition while
for the sample with HNO3 (Fig. 3.2g) the deposition is more separated. Moreover, from the
cross-section images, the coral-like microstructure is more defined for the sample with HNO3
(Fig. 3.2h) as compared to the one without HNO3 (Fig. 3.2e). A decrease in the average particle
size is also observed when HNO3 is added (310 nm without HNO3 vs 190 nm with HNO3).
Thus, it can be concluded that the addition of nitric acid is overall very important for solution
stability as well as to reduce the particle size.

Chapter 3: Improving the Electrode Performance of Rare-Earth Nickelates by Improving the
Microstructure and Architectural Design
60
Fig. 3. 2 The LPNO precursor solution (a) right after the preparation and (b) 1.5 h later without
HNO3 addition which showed that the solution became opaque due to the formation of
precipitates, (c) the precipitates blocked the opening of the tube which prevented the solution
of precursors to continue to flow to the needle and thus stopped the spray production. The SEM
images of (d) the surface and (e)-(f) the cross-section of the ESD layer prepared from solution
without HNO3. The SEM images of (g) the surface and (h)-(i) the cross-section of the ESD
layer prepared from solution with the addition of HNO3. Both layers were deposited by ESD
for 3 h of deposition time.
A set of preliminary tests, varying ESD deposition time, has also been conducted to optimize
the thickness of the active functional layer (AFL). Sufficient thickness of the AFL is required
to not limit the extension of the reaction in the electrode as it has been shown by Çelikbilek in
the case of a La0.6Sr0.4Co0.2Fe0.8O3-δ (LSCF) columnar microstructure prepared by ESD in
which a minimum thickness of 2.5 μm is necessary [60]. For this purpose, three LPNO
electrodes with different ESD deposition times (3 h 45’, 4 h 30’, and 6 h) were prepared. All
samples were then sintered at 960 °C for 6 h in air. The cross-sections of the three samples
were then observed by SEM (Fig. 3.3a-c). As expected, the thickness of the ESD layer was
increased from 21 μm, 31 μm, to 43 μm for sample deposited for 3 h 45’, 4 h 30’, and 6 h,
respectively. The film growth is not linear to the deposition time as shown in Fig. 3.3d. The
coral-like microstructure is observed for all samples. However, the one deposited for 4 h 30’
(a)
(b)
(c)
(d)
(e)
(f)
(g)
(h)
(i)
10 μm10 μm
1 μm1 μm
200 nm 200 nm

Chapter 3: Improving the Electrode Performance of Rare-Earth Nickelates by Improving the
Microstructure and Architectural Design
61
seems to be the most uniform. Some spots with less deposition are observed after deposition
for 3 h 45’ while the rougher surface is observed after deposition for 6 h which can be attributed
to a more concentrated preferential landing over time.
Fig. 3. 3 The cross-section SEM images of ESD layer deposited for (a) 3 h 45’, (b) 4 h 30’, and
(c) 6 h; (d) the thickness of the ESD layer versus time.
To study the effect of ESD AFL thickness on the electrode performance, three symmetrical
cells were measured by EIS in the air at OCP from 450 to 700 °C. The three cells were first
prepared on GDC electrolyte by using ESD with three different deposition times (3 h 45’, 4 h
30’, and 6 h) and sintered at 960 °C for 6 h in air. Afterwards, LPNO was screen-printed on
top of the ESD layer followed by two steps of heat treatments in the air: at 450 °C for 2 h to
remove the organic solvent in the SP ink and then sintering at 800 °C for 2 h. The thickness of
the SP layers for all these cells was around 30 μm. The electrochemical responses are presented
in the Arrhenius plots in Fig. 3.4. The Rpol of all samples are similar and in the same range,
especially for the cells with ESD deposition time of 3 h 45’ and 6 h. The Rpol of the cell with
ESD deposition time of 4 h 30’ is slightly lower at the lower measurement temperature. Thus,
(a) (b)
(c)
10 μm 10 μm
10 μm
21 μm31 μm
43 μm
180 240 300 36015
20
25
30
35
40
45E
SD
lay
er t
hic
kn
ess
(m
)
Deposition time (minutes)
(d)

Chapter 3: Improving the Electrode Performance of Rare-Earth Nickelates by Improving the
Microstructure and Architectural Design
62
the SEM and EIS results show that the AFL thickness is already sufficient when the deposition
time is only 3 h 45’, but the microstructure and the electrochemical behavior are optimized
when the ESD layer is deposited for 4 h 30’.
Fig. 3. 4 The Arrhenius plots of double-layer symmetrical cells with different ESD deposition
time: 3 h 45’, 4 h 30’, and 6 h.
Besides the coral-like microstructure, an attempt to study the electrochemical performance of
the ESD layer with a hierarchical microstructure was carried out. It has been shown previously
from our group, that the columnar microstructure of LSCF prepared by ESD has better
electrochemical performance as compared to the coral microstructure [80]–[82]. The better
performance of the columnar film is attributed to the presence of nano-scaled porosity instead
of macroscopic porosity observed in the coral film, resulting in the larger specific surface area
of the former. Thus, in this work, the columnar LPNO electrode was prepared on the GDC
electrolyte by following the same procedure as the ones developed in Çelikbilek’s PhD thesis
[81]. To obtain the columnar microstructure, the precursor powders (La-, Pr-, and Ni-nitrates,
as well as citric acid) were dissolved in a mixture of ethanol and butyl carbitol,
(C4H9(OCH2CH2)2OH, Acros Organics, 99+%) (1:2 vol. ratio). The needle-substrate distance
was 22 mm, the solution flow rate was 0.5 mL h-1, the substrate temperature was 300 °C, and
the deposition time was 3.5 h. The subsequent sintering in the air was carried out at 960 °C for
6 h. Afterwards, the prepared sample was observed by SEM (Fig. 3.5a-c). From the SEM image,
it can be seen that there is a uniform thin layer of deposition at the electrode/electrolyte
interface. The columns, around 4 μm-width, can also be observed. However, the surface view
shows that there is a lot of space between the columns which means that the columns are not
1.00 1.05 1.10 1.15 1.20 1.25 1.30 1.35 1.40
1
10
3h45m
4h30m
6hRp
ol
( c
m2)
1000/T (K-1)
700 650 600 550 500 450
T (oC)

Chapter 3: Improving the Electrode Performance of Rare-Earth Nickelates by Improving the
Microstructure and Architectural Design
63
uniformly formed. The columns also seem to not be well-attached to the GDC electrolyte
revealing a rather poor adhesion. As a consequence, the further EIS measurement has been
unsuccessfully attempted since the electrode was severely delaminated from the electrolyte.
Thus, an optimization of the deposition parameters and sintering is still required for any future
works on the LPNO of columnar-type.
Fig. 3. 5 The SEM images of the LPNO columnar electrode: (a) the surface view, (b) the cross-
section, and (c) a larger magnification at the electrode/electrolyte interface which show the
uniform deposition at the electrode/electrolyte interface.
3.2.2 Electrochemical performance of coral-type La2-xPrxNiO4+δ (x = 0, 1, 2)
It has been mentioned in §1.2 that the transport properties of La2-xPrxNiO4+δ are better as the
praseodymium content (x) increases, which is evidently shown on the electrochemical response
as well. To confirm that, three La-Pr nickelates double-layer symmetrical cells were prepared
based on a ‘coral-type’ AFL. The chosen compositions were x = 0 (La2NiO4+δ, LNO), x = 1
(LaPrNiO4+δ, LPNO), and x = 2 (Pr2NiO4+δ, PNO). All three electrodes were deposited on the
GDC electrolyte by ESD for 3 h followed by SP deposition. The sintering in the air after ESD
was carried out at 960 °C for 6 h for both for LNO and LPNO, while higher temperatures
(1050 °C for 2 h followed by 1100 °C for 0.5 h) were necessary to obtain pure PNO. After SP,
all three electrodes were thermally treated in the air at 450 °C for 2 h to remove the organic
solvent followed by sintering at 900 °C for 2 h (for LNO and LPNO) or at 1000 °C for 2 h +
1050 °C for 0.5 h (for PNO). The electrochemical performances of the three cells were then
measured by EIS at OCP and the results are shown in Fig. 3.6. From 450 to 700 °C, the lowest
Rpol values are the ones of PNO and the highest are the ones of LNO. This is in agreement with
(a)
10 μm
6 μm
(b) (c)
2 μm 200 nm

Chapter 3: Improving the Electrode Performance of Rare-Earth Nickelates by Improving the
Microstructure and Architectural Design
64
our previous studies, where the electrochemical performance of La2-xPrxNiO4+δ is increased
with the increase of praseodymium content [35].
Fig. 3. 6 The Arrhenius plots of LNO, LPNO, and PNO double-layer symmetrical cells.
3.2.3 Reproducibility
To ensure the reproducibility of the electrodes fabricated by both SP and ESD, three identical
double-layer symmetrical cells (DL1, DL2, and DL3) were prepared. These electrodes were
deposited by ESD on both sides of the GDC electrolyte for 4.5 h followed by a sintering step
in the air at 960 °C for 6 h. After the subsequent SP deposition, the three electrodes were again
heated in air at 450 °C for 2 h to remove the organic solvent and then sintered at 900 °C for 2
h. The prepared symmetrical cells were then characterized by EIS at OCP. The Rpol of each cell
was extracted from the Nyquist diagrams and plotted in Arrhenius plots which are presented in
Fig. 3.7. It can be seen that the three cells show similar Rpol at all temperatures with a deviation
of less than 15%, which can be considered within the error range of the measurement. Thus, it
can be claimed that the reproducibility of the sample preparation by ESD and SP is confirmed.
1.00 1.05 1.10 1.15 1.20 1.25 1.30 1.35 1.40
0.1
1
10
LNO
LPNO
PNORp
ol
( c
m2)
1000/T (K-1)
700 650 600 550 500 450
T (oC)

Chapter 3: Improving the Electrode Performance of Rare-Earth Nickelates by Improving the
Microstructure and Architectural Design
65
Fig. 3. 7 The Arrhenius plots of three identical double-layer symmetrical cells for
reproducibility test.
3.3 Structural characterization of LPNO as a powder, SP layer, and ESD layers
Crystallization of pure LaPrNiO4+δ (LPNO) powder prepared by auto-combustion (§2.2.1) for
SP layer was obtained after calcination at 1050 °C for 2 h and at 1100 °C for 0.5 h in air, as
shown by XRD (Fig. 3.8a). The LPNO phase was indexed to an orthorhombic unit cell with
the Bmab space group (N° 64). The cell lattice parameters deduced from the Rietveld
refinement (a = 5.432(2) Ǻ, b = 5.475(8) Ǻ, and c = 12.586(9) Ǻ) are also in a good agreement
with literature data [22], [35].
The LPNO powder was then screen-printed on several GDC electrolytes. The SP layers were
firstly heated in air at 450 °C for 2 h to remove the organic solvent used for the ink and then
sintered at different temperatures from 800 °C to 1200 °C to check the thermal stability of the
SP layer (Fig. 3.8b). Up to 900 °C, there is no presence of secondary phases detected in the
XRD patterns. After sintering at 1100 °C, however, a minor contribution of a higher-order
nickelate phase (La,Pr)3Ni2O7-δ, referred to as (LP)3N2, can be detected. It appears that
sintering at 1200 °C leads to a decrease of the (LP)3N2 content to some traces only.
1.00 1.05 1.10 1.15 1.20 1.25 1.30 1.35 1.400.01
0.1
1
10
DL1
DL2
DL3Rpo
l (
cm
2)
1000/T (K-1)
700 650 600 550 500 450
T (oC)

Chapter 3: Improving the Electrode Performance of Rare-Earth Nickelates by Improving the
Microstructure and Architectural Design
66
Fig. 3. 8 XRD of (a) LPNO powder prepared by auto-combustion and calcined at 1050 °C/2 h
+ 1100 °C/0.5 h in air and (b) screen-printed layers of LPNO on GDC thermally treated in air
at (i) 450 oC/2 h + 800 °C/2 h, (ii) 450 oC/2 h + 900 °C/2 h, (iii) 450 oC/2 h + 1050 °C/2 h +
1100 oC/0.5 h, and (iv) 450 oC/2 h + 1200 °C/2 h; (c) In-situ high temperature XRD from 25
to 1200 °C of the as-deposited SL LPNO electrode by ESD.
The structural properties of as-deposited LPNO ESD electrode on GDC electrolyte were
investigated using in-situ high-temperature XRD at a variable temperature from 25 °C to
1200 °C. The purpose of the in-situ measurement is to follow the phase evolution of ESD
LPNO layer versus temperature and to identify an optimum in the sintering temperature
allowing the LPNO crystallization and partial densification without its decomposition. The
XRD pattern at each measurement temperature is shown in Fig. 3.8c. Initially, at 25 °C, only
GDC peaks are detected from the amorphous fresh film. The evolution of the XRD patterns
reveals that the crystallization of the film starts at 600 °C with the appearance of broad peaks
which are quite difficult to index since there are a lot of possible phases in this 2θ range. From
700 to 900 °C, the broad peaks become sharper and can be assigned more than likely to
lanthanum-praseodymium oxide, (La,Pr)2O3. The oxide starts to transform into an LPNO
20 25 30 35 40 45 50
Inte
nsi
ty (
a.u
.)
2-Theta (o)
20 25 30 35 40 45 50
Observed
Calculated
Difference (Obs. - Calc.)
Bragg Position
Inte
nsi
ty (
a.u
.)
2-Theta (°)
(a)
(b)
(c)
LPNO powder
LPNO SP
LPNO ESD
oo
o
o
o
o
**
*
* * *
**
**
**
*
*
=
=x
x
x
o GDC
* LPNO
= (La,Pr)3Ni2O7-δ
x (La,Pr)2O3
(i) 800 °C
(ii) 900 °C
(iii) 1100 °C
(iv) 1200 °C
1200 °C
1100 °C
1000 °C
975 °C
950 °C
925 °C
900 °C
800 °C
700 °C
600 °C
25 °C
o GDC
* LPNO
= (La,Pr)3Ni2O7-δ
==

Chapter 3: Improving the Electrode Performance of Rare-Earth Nickelates by Improving the
Microstructure and Architectural Design
67
structure at 925 °C, but at the same time, there is also the formation of a higher-order nickelate
which is identified as (LP)3N2. At 950 °C, the signature of both LPNO and the higher-order
phase significantly increases, while the initial phase of lanthanum-praseodymium oxide tends
to vanish. Above 950 and up to 1200 °C, the two phases of LPNO and higher-order coexist and
are quite stable, while the initial (La,Pr)2O3 phase has completely disappeared.
Fig. 3. 9 The diffractogram of the ESD layer after sintering in the air at 960 °C for 6 h.
The results of in-situ high-temperature XRD give a rough estimation of the phase evolution
because the diffractogram is taken just 30 minutes after the furnace temperature reaches the
setting point. Based on this result, the sintering condition of the ESD layer is determined to be
at 960 °C for 6 h. At this sintering condition, the lanthanum-praseodymium oxide is no longer
present and the temperature is sufficiently low to preserve the small particle size of the ESD
layer. A scratch test of LPNO on GDC electrolyte also reveals a good electrode/electrolyte
adhesion after sintering at only 960 °C. However, in line with the in-situ high-temperature
XRD, a small amount of higher-order nickelate (LP)3N2 is also present as a secondary phase
as shown in the XRD pattern in Fig. 3.9. This phase, which is also a Ruddlesden-Popper phase
with n = 2, has been reported to be an electrochemically active material [19], [40], [41]. The
effect of the presence of this secondary phase on the electrochemical performance of the LPNO
electrode will be explained in more detail in §3.6. The durability study of the electrode in order
20 25 30 35 40 45 50
Inte
nsi
ty (
a.u
.)
2 Cu-K (°)
*
*
*
*
*
*
=
=
*
o
o
o
o GDC
* LPNO
= (La,Pr)3Ni2O7-δ

Chapter 3: Improving the Electrode Performance of Rare-Earth Nickelates by Improving the
Microstructure and Architectural Design
68
to see whether the presence of the secondary phase affects the degradation is reported in
Chapters 4 and 5.
Fig. 3. 10 SEM images of cross-sections of (a), (b) SL SP sintered at 1100 oC (sample 2) and
(c), (d) SL ESD sintered at 960 oC (sample 3) on two different magnifications. The
electrode/electrolyte interfaces are indicated by the dashed white lines.
The difficulty to obtain single-phase LPNO deposited by ESD might be explained by its fine
microstructure resulting in a more reactive material compared to the coarse SP microstructure.
From the SEM images (Fig. 3.10a-d), the average particle size of the ESD layer is estimated
to be 130 nm while the SP layer is 500 nm. Indeed, a study by Montenegro-Hernández et al.
has shown that both lanthanum and praseodymium nickelates are very chemically active if the
particle size is submicronic [37]. Also, the microstructure of the ESD layer is more ‘open’ with
larger porosity than the SP one which may also explain the chemical reactivity. A more detailed
explanation of the microstructure, especially the electrode/electrolyte interface, of both SP and
ESD layers will be given in §3.5.
(d)(c)
(b)(a)
10 µm
10 µm
200 nm
200 nm
38 µm
27 µm

Chapter 3: Improving the Electrode Performance of Rare-Earth Nickelates by Improving the
Microstructure and Architectural Design
69
3.4 Equivalent electrical circuit model for EIS data fitting
As previously mentioned in §2.5, the EIS data fitting with an equivalent electrical circuit is
necessary for the accurate determination of the series and electrode polarization resistances
[83]. Besides, the EIS fitting can be also used to interpret the electrode reaction mechanism
associated with the electrochemical performances. Indeed, under the assumption that each
element of the electrical circuit can be associated with a physical process with a given time
constant, the analyses of the fitting results can be helpful to identify the co-limiting steps of the
reaction pathway [84]. In this work, an equivalent circuit, which is schematically shown in Fig.
3.11, was used to fit the EIS data of all the samples.
Fig. 3. 11 The schematic diagram of the equivalent circuit model which is used to fit the
experimental EIS data.
The circuit consists of several elements in series and is composed of:
(1) an inductor (L) to take into account the contribution from the wire and interconnection,
(2) a resistor (Rs) corresponding to the pure ohmic contribution of the electrolyte (also called
the series resistance) which is shown as the intercept with the 𝑥-axis at high frequency in
Nyquist plot (Fig. 2.13 in §2.5),
(3) a resistor in parallel to a constant phase element (R1//CPE) to account for the high
frequencies process (more than 102 Hz) ascribed to the ionic transfer at the electrode/electrolyte
interface (this process is assigned as P1). This process is also indicated by a low capacitance
values (10-5-10-4 F/cm2) [23]. The values of the resistance will be referred to as R1 while the
capacitance, which is calculated by using Eq. C.16 in Appendix C, will be called C1,
(4) a fractal Gerischer element (Gf) in parallel with a capacitor (C2) for the process arising at
medium frequencies (1-100 Hz, assigned as P2) and associated with a large capacitance value
(10-3-10 F/cm2) [23], [29]. This capacitance is called the ‘chemical capacitance’ or ‘pseudo-
Gf FLWL Rs R1
CPE1 C2
P1 P2
P3
Equivalent electrical circuit

Chapter 3: Improving the Electrode Performance of Rare-Earth Nickelates by Improving the
Microstructure and Architectural Design
70
capacitance’. Chemical capacitance is related to the change on the oxygen stoichiometry of
MIEC within the active regions where the ORR/OER takes place. Since the active regions of
MIEC are usually extended to a few micrometers from the electrolyte, the chemical capacitance
is larger than the interfacial capacitance (i.e. C1) which is confined only at the interface. The
fractal Gerischer element, which takes into account for a deviation from the ideal Gerischer,
represents the solid-state diffusion in the bulk convoluted with the charge transfer reaction
taking place at the surface of the LPNO particles [29]. It was shown in a previous study that
the capacitor element allows improving the global quality of fitting for this medium frequency
contribution [85]. However, the underlying physical process associated with this capacitor is
still unclear. It could be due to the presence of oxygen ions attached on the surface of LPNO
involving a surface double-layer characterized by its capacitance. In this view, the rate of
oxygen incorporation/excorporation from LPNO would not be purely chemical but described
by a Bulter-Volmer electrochemical reaction as proposed by Fleig for mixed conducting
electrodes [86].
The obtained resistance extracted from the fitting for this process P2 will be called as R2. There
are two capacitance values obtained: (i) the chemical capacitance (Cchem) which is calculated
from the time constant of fractal Gerischer element (𝜏𝐺𝑓) divided by R2, both of the values are
obtained from the fitting (𝐶𝑐ℎ𝑒𝑚 = 𝜏𝐺𝑓/𝑅2) and (ii) the capacitance obtained from the capacitor
element which is called C2,
(5) a finite-length Warburg element (FLW) to account for the gas transfer that appears at low
frequencies (less than 1 Hz, assigned as P3) [87], [88]. As this gas diffusional process is not
thermally activated, this contribution starts to be detectable especially at a temperature higher
than 600 oC. Indeed, the rate of oxygen incorporation/excorporation step strongly improves
with increasing the temperature leading to the reduction of the contribution of P2 and resulting
in the appearance of P3. The resistance related to this process is called R3 while the capacitance,
calculated by Eq. C.8 in Appendix C, is called C3.
The presented series resistances (Rs) are normalized by multiplying the fitted values with the
surface area of the electrode (i.e. 𝑅𝑠 = 𝑅𝑠_𝑓𝑖𝑡𝑡𝑒𝑑 × 𝐴). The polarization resistance (Rpol) is
obtained by either calculating the difference on the intercept with 𝑥-axis at low and high
frequency on the Nyquist plot or by the summation of R1, R2, and R3. The presented values

Chapter 3: Improving the Electrode Performance of Rare-Earth Nickelates by Improving the
Microstructure and Architectural Design
71
of Rpol are normalized according to Eq. 2.5 in §2.5 (i.e. 𝑅𝑝𝑜𝑙 = 𝑅𝑒𝑙𝑒𝑐𝑡𝑟𝑜𝑑𝑒_𝑓𝑖𝑡𝑡𝑒𝑑 × 𝐴2⁄ ). All
the capacitance values are also expressed by the electrode surface area.
3.5 Influence of the electrode/electrolyte interface quality on the performance of the
LPNO electrode
Three different single-layers (SL) have been deposited by either SP or ESD on GDC electrolyte
(i.e. samples 1-3 in Table 3.1) with the purpose to observe the effect of electrode/electrolyte
interface quality on the electrochemical performance of the electrode. As detailed in Table 3.1,
two SL electrodes have been deposited by SP and then thermally treated at two different
temperatures in the air: 450 °C for 2 h + 800 °C for 2 h (sample 1) and 450 °C for 2 h + 1050 °C
for 2 h + 1100 °C for 0.5 h (sample 2). In both samples, the powder used for SP is manually
ground. Another single-layer electrode is prepared by ESD and sintered at 960 °C for 6 h in the
air (sample 3).
The electrodes microstructure has been characterized by SEM. For sample 1, the observations
have revealed that the layer is poorly bonded to the substrate, thus it is difficult to obtain a clear
SEM image. This issue is probably due to the final sintering temperature of 800 °C which is
lower than the required temperature to achieve good adhesion between LPNO and GDC
electrolyte for the SP layer. A sintering temperature of at least 1100 °C is required to obtain
good contact and avoid any delamination between the electrode and the electrolyte as shown
for sample 2 in Fig. 3.10a-b. The thickness and average particle size of sample 2 are around
38 µm and 500 nm, respectively. It is worth noting the presence of large agglomerates which
are certainly the consequence of a manual and heterogeneous grinding of the SP powder.
Meanwhile, the thickness and average particle size of sample 3 are 27 µm and 130 nm,
respectively (Fig. 3.10c-d). As expected from the previous work in our group using the same
ESD conditions, the ‘coral-like’ microstructure is clearly observed [35]. This unique
microstructure is obtained due to the deposition parameters described in §2.2.3, resulting in
small and drier arriving droplets on the substrate and promote the preferential landing of these
droplets [89]. Close observation on the electrode/electrolyte interface shows that the LPNO is
continuously deposited along the interface. It is also clear that the ESD layer is more porous
than the SP layer, especially close to the surface. That means that the ESD layer has a more
‘open’ surface.

Chapter 3: Improving the Electrode Performance of Rare-Earth Nickelates by Improving the
Microstructure and Architectural Design
72
To study the impact of the electrode/electrolyte interface quality on the electrode response,
electrochemical characterizations by EIS have been performed on the symmetrical cells for the
three samples at a temperature range of 450 to 700 °C. The Nyquist and Bode representations
of the measurement results for these cells at 500, 600, and 700 °C are plotted in Fig. 3.12a-f
after subtracting the series resistances for the sake of clarity and easier comparison. It is clear
that the shape and size of the Nyquist plots for sample 1 are different as compared to the other
two samples at all temperatures. The frequency distribution shown in the Bode plots is shifted
toward higher values as temperature increases which can be attributed to the faster oxygen
exchange at the surface [90], [91]. The Bode plots also show that the peaks related to P2 are
strongly dominant for all samples at all temperatures. Meanwhile, the contribution of P1 is
significant at all temperatures for sample 1, and it is slightly present up to 600 °C for sample
2. However, the contribution of P1 is not detected for sample 3 at all temperatures. The P3
becomes important at 700 °C for all samples, except for sample 3 which shows that P3
contribution starts to appear at 600 °C. Based on this observation, each sample is fitted with a
suitable circuit according to Fig. 3.11 in the previous section.
The values of series resistance (Rs), which were subtracted from the Nyquist plots in Fig. 3.12a-
c, are plotted versus temperature in Fig. 3.13a. Meanwhile, the polarization resistances (Rpol)
are shown in the Arrhenius plots in Fig. 3.13b. As expected, both the Rs and Rpol values
decrease when the temperature is increased for all samples. The values of both resistances are
the highest for sample 1 as compared to the other samples. As has been already mentioned in
the previous section, Rs is directly related to the ohmic resistance from the electrolyte which is
proportional to the ratio between its thickness and conductivity (Eq. 1.9 in §1.2.2). Moreover,
it also depends on the contact between the electrode/electrolyte. Since all samples were
prepared on the same electrolyte with similar thickness, one may suggest that the series
resistance is higher for sample 1 because of poor contact between the electrode and the grid for
this sample and/or some interfacial cracks at the electrode/electrolyte interface due to the poor
electrode adhesion. This argument is further supported by the Rpol values. A significant
improvement in the electrode performance is clearly observed for sample 2 as compared to
sample 1 despite the fact that both electrodes are deposited by SP. From the fitting with the
equivalent circuit, the polarization resistance can be deconvoluted to the resistance related to
the corresponding processes. The deconvolution of the resistance is shown in Fig. 3.13c. As
previously mentioned from the Bode plots, the contribution of P1 is apparent for both samples

Chapter 3: Improving the Electrode Performance of Rare-Earth Nickelates by Improving the
Microstructure and Architectural Design
73
1 and 2. However, it is clear that R1 of the sample 1 is very large and it contributes to almost
50% of the polarization resistance as compared to only 4% for sample 2. As mentioned in §3.4,
this process is attributed to the ionic transfer across the electrode/electrolyte interface and is
thus enlarged for the delaminated layer of sample 1. Therefore, the high Rpol of sample 1 can
be attributed to the poor adhesion of the electrode on the GDC electrolyte limiting the ionic
transfer.

Chapter 3: Improving the Electrode Performance of Rare-Earth Nickelates by Improving the
Microstructure and Architectural Design
74
Fig. 3. 12 (a)-(c) Nyquist plots and (d)-(f) Bode plots of samples 1, 2, and 3 at 500, 600, and
700 °C, respectively. The Nyquist plots are plotted by subtracting the contribution of the series
resistance and the numbers on the Nyquist plots indicate the logarithmic of the frequencies.
0 2 4 6 8 10 12 14 160
2
4
6
8
10
12 Sample 1
Sample 2
Sample 3
Fit
-Im
[Z]
( c
m2)
Re[Z]-Rs ( cm2)
(a)
12
-1
034
500 oC
0.0 0.5 1.0 1.5 2.0 2.50.0
0.5
1.0
1.5
2.0
-Im
[Z]
( c
m2)
Re[Z]-Rs ( cm2)
(b)
12
-10
34
600 oC
0 2 4 6 8 10 12 14 160
2
4
6
8
10
12 Sample 1
Sample 2
Sample 3
Fit
-Im
[Z]
( c
m2)
Re[Z]-Rs ( cm2)
0 2 4 6 8 10 12 14 160
2
4
6
8
10
12 Sample 1
Sample 2
Sample 3
Fit
-Im
[Z]
( c
m2)
Re[Z]-Rs ( cm2)
0.0 0.1 0.2 0.3 0.4 0.5 0.60.0
0.1
0.2
0.3
0.4
-Im
[Z]
( c
m2)
Re[Z]-Rs ( cm2)
(c)
700 oC
1
2
-10
3
4
0 2 4 6 8 10 12 14 160
2
4
6
8
10
12 Sample 1
Sample 2
Sample 3
Fit
-Im
[Z]
( c
m2)
Re[Z]-Rs ( cm2)
0 2 4 6 8 10 12 14 160
2
4
6
8
10
12 Sample 1
Sample 2
Sample 3
Fit
-Im
[Z]
( c
m2)
Re[Z]-Rs ( cm2)
-2 -1 0 1 2 3 4 50
2
4 Sample 1
Sample 2
Sample 3
-Im
[Z]
( c
m2)
log(Frequency) (Hz)
(d)
P1
P2
500 oC
-2 -1 0 1 2 3 4 50
2
4 Sample 1
Sample 2
Sample 3
-Im
[Z]
( c
m2)
Log(Frequency) (Hz)
-2 -1 0 1 2 3 4 50.00
0.25
0.50
0.75
-Im
[Z]
( c
m2)
log(Frequency) (Hz)
(e)
600 oCP2
P1P3
-2 -1 0 1 2 3 4 50
2
4 Sample 1
Sample 2
Sample 3-I
m[Z
] (
cm
2)
Log(Frequency) (Hz)-2 -1 0 1 2 3 4 5
0
2
4 Sample 1
Sample 2
Sample 3
-Im
[Z]
( c
m2)
log(Frequency) (Hz)
-2 -1 0 1 2 3 4 50.00
0.05
0.10
0.15
-Im
[Z]
( c
m2)
log(Frequency) (Hz)
(f)
700 oC
P2 P1
P3
-2 -1 0 1 2 3 4 50
2
4 Sample 1
Sample 2
Sample 3
-Im
[Z]
( c
m2)
Log(Frequency) (Hz)
-2 -1 0 1 2 3 4 50
2
4 Sample 1
Sample 2
Sample 3
-Im
[Z]
( c
m2)
log(Frequency) (Hz)

Chapter 3: Improving the Electrode Performance of Rare-Earth Nickelates by Improving the
Microstructure and Architectural Design
75
Fig. 3. 13 The Arrhenius plots of (a) series resistance (Rs) and (b) polarization resistance (Rpol).
The deconvolution of (c) resistance (R) and (d) capacitance (C) associated with P1 (half-filled
markers), P2 (filled markers), and P3 (empty markers) processes, as well as chemical
capacitance (Cchem, empty with plus sign markers). All plots are for sample 1 (black square), 2
(blue circle), and 3 (triangle red).
A crossing of Arrhenius plots of Rpol between sample 2 and sample 3 (Fig. 3.13b) can be
observed at 550 °C. Indeed, at a temperature lower than 550 °C, the ESD layer (sample 3)
performs slightly better than the one of the SP layer (sample 2). Above 550 °C, a reverse
behavior is detected. It is primordial to consider key parameters such as the microstructure
(particle size, porosity, etc.), the purity, and the interfaces (the electrode/electrolyte one and
the electrode surface) to compare electrochemical properties of both samples. The reasons why
the ESD film is performing better at low temperature are certainly triple. First, ESD films are
characterized by particles at the nanometer-length scale (Fig. 3.10c in §3.3) which are much
1.00 1.05 1.10 1.15 1.20 1.25 1.30 1.35 1.40
1E-5
1E-4
1E-3
0.01
0.1
1
10C
apac
itan
ce (
F c
m-2
)
1000/T (K-1)
Sample 1
Sample 2
Sample 3
Sample 1
Sample 2
Sample 3
Sample 1
Sample 2
Sample 3
Sample 1
Sample 2
Sample 3
700 650 600 550 500 450
T (oC)
1.00 1.05 1.10 1.15 1.20 1.25 1.30 1.35 1.400.01
0.1
1
10
Sample 1
Sample 2
Sample 3
Sample 1
Sample 2
Sample 3
Sample 1
Sample 2
Sample 3
Sample 1
Sample 2
Sample 3
R (
c
m2)
1000/T (K-1)
700 650 600 550 500 450
T (oC)
1.00 1.05 1.10 1.15 1.20 1.25 1.30 1.35 1.40
5
10
15
20
25
Rs
( c
m2)
1000/T (K-1)
Sample 1
Sample 2
Sample 3
700 650 600 550 500 450
T (oC)
1.00 1.05 1.10 1.15 1.20 1.25 1.30 1.35 1.40
0.1
1
10
Sample 1
Sample 2
Sample 3
Rp
ol
( c
m2)
1000/T (K-1)
700 650 600 550 500 450
T (oC)(a) (b)
R1
R2
R3
(c) (d)
C1
C2
Cchem
C3

Chapter 3: Improving the Electrode Performance of Rare-Earth Nickelates by Improving the
Microstructure and Architectural Design
76
more electrochemically active than in the case of sample 2. Second, both samples also present
a good electrode/electrolyte interface as no delamination is observed on either sample.
However, unlike for sample 2, the process at higher frequency (P1) is unnoticeable for sample
3 at all temperatures which implies that the electrode/electrolyte interface is even better for the
electrode deposited by ESD in consequence of the continuous contact formed at the interface
as seen by SEM observation in Fig. 3.10. Thus, it appears that better adherence is reached for
LPNO ESD layer and GDC electrolyte even after sintering at only 960 ºC than after sintering
at 1100 ºC for the SP layer. Thirdly, another point to consider is the secondary phase of
(LP)3N2, which is present in a larger content in sample 3 than in sample 2 (Fig. 3.8b (iii) and
Fig. 3.9 in §3.3). This secondary phase is also electrochemically active and can help to improve
the performance, especially at a higher temperature, as explained in more detail in §3.6. If one
refers to a temperature above 550 ºC, sample 2 is performing better than sample 3. In this case,
at a higher temperature, a much better contact is reached between the electrode and the gold
grid of the measurement setup and especially for sample 2. Indeed, sample 2 is characterized
by a flatter surface than the one of sample 3 which presents a rough electrode surface due to
the coral-like microstructure of the layer deposited by ESD. Thus, at a lower temperature, the
smaller particle size, higher amount of the secondary phase, and the better electrode/electrolyte
interface of the ESD layer with comparison to the SP one play key a role in the performance
of the electrode. Meanwhile, at a higher temperature, it seems that the better electrode surface
of the SP layer becomes more important.
To confirm that each process is correctly assigned, the deconvolution of the capacitance is
given in Fig. 3.13d. As has been explained in §3.4, the values of C1, Cchem, and C3 are indeed
in agreement with the values of capacitance for interfacial, chemical, and gas diffusion
capacitance, respectively. The values of C2, which comes from the capacitor in parallel to the
fractal Gerischer element, is lower than the values of Cchem. However, in the case of sample 2
and 3, its values are larger than the interfacial capacitance. Meanwhile, the values are in the
range of the interfacial capacitance for sample 1, especially at a lower temperature. It has been
explained in §3.4 that while this additional capacitor helps to improve the fitting, the physical
meaning of it is still not clear. It can be suspected that for sample 1 it is related to the charge
transfer since the electrode kinetic is largely limited by this process, while for sample 2 and 3
it is related to something else.

Chapter 3: Improving the Electrode Performance of Rare-Earth Nickelates by Improving the
Microstructure and Architectural Design
77
3.6 Influence of the secondary higher-order phase on the electrochemical performance
of the ESD layer
In §3.3, it has been shown that a secondary phase, which is identified as (La,Pr)3Ni2O7-δ or
abbreviated as (LP)3N2, co-exists in a small amount with LPNO phase in the ESD layer after
sintering at 960 °C for 6 h in air. In order to investigate the effect of this secondary phase, three
double-layer (DL) electrodes with different heat-treatment temperatures have been prepared
(samples 4-6, Table 3.1). The manufacturing of the DL electrodes starts with the deposition of
an AFL of LPNO by ESD which is then followed by the coating of a CCL LPNO by SP. A
heat-treatment step is required after each deposition step. The sintering after ESD has been
carried out at 960 °C for 6 h in air and is referred to as the first heat-treatment, while the one
after SP is referred to as the second heat-treatment. It is of great importance to characterize the
nature of phases present in the ESD layer after the second heat-treatment. For that, the ESD
layers have been annealed at three different temperatures after the first heat-treatment and then
characterized by XRD. Fig. 3.14 shows the XRD patterns of the ESD layer after first heat-
treatment (i) and after second heat-treatment in air at 450 °C for 2 h + 800 °C for 2 h (ii), 450 °C
for 2 h + 900 °C for 2 h (iii), and 450 °C for 2 h + 1050 °C for 2 h + 1100 °C for 0.5 h (iv).
By comparing to the XRD patterns after only first heat-treatment (i) and second heat-treatment
at 800 °C (ii) confirms that there is no change in the composition of the phase. However, second
heat-treatment at a temperature higher than 800 °C (iii and iv) leads to a larger amount of the
secondary phase (LP)3N2. However, after 900 °C, the content of the secondary phase is
reaching a maximum. From the literature, the higher-order nickelates of Ruddlesden-Popper
with n = 2 and 3 have been reported to be also active materials with higher electrical
conductivity compared to the lower order nickelates [19], [40], [41]. A study shows that the
composite based on a mixture of La2NiO4+δ and La4Ni3O10-δ (another Ruddlesden-Popper phase
with n = 3) presents a lower polarization resistance than the one of each individual single-phase,
especially at a temperature higher than 600 °C [92]. In another work, composite of La2NiO4+δ–
La3Ni2O7-δ–Ce0.55La0.45O2-δ (an ionic conductor) also shows a good performance with Rpol of
1.11 Ω cm2 at 600 °C [90]. Thus, the presence of a high-order nickelate as a secondary phase
may improve the electrode performance. Therefore, the impact of the different amounts of the
higher-order nickelates (LP)3N2 in the ESD layer for the DL electrodes on the electrochemical
performance has been investigated by EIS. For this purpose, three double-layer symmetrical
cells have been prepared which are called sample 4 (second final heat-treatment at 800 oC),

Chapter 3: Improving the Electrode Performance of Rare-Earth Nickelates by Improving the
Microstructure and Architectural Design
78
sample 5 (second final heat-treatment at 900 oC), and sample 6 (second final heat-treatment at
1100 oC).
Fig. 3. 14 XRD patterns of the ESD layer (i) as-sintered at 960 °C for 6 h in air and after second
heat-treatment in air at (ii) 450 °C/2 h + 800 °C/2 h, (iii) 450 °C/2 h + 900 °C/2 h, and (iv)
450 °C/2 h + 1050 °C/2 h + 1100 °C/0.5 h.
From the Nyquist plots of the three samples taken at measurement temperatures of 500, 600,
and 700 °C in Fig. 3.15a-c, the shape of the plots are quite similar for all samples even though
the size varies. The Bode representations in Fig 3.15d-f further show that the frequency
distributions are alike for all samples at all temperatures. The peaks correspond to P2 are
strongly present at all temperatures while P3 contribution starts to be more important at 600 °C.
There is no contribution of P1 detected for all samples at all temperatures as seen in sample 3
in the previous section which indicates a good electrode/electrolyte interface in such a way the
ionic transfer at the electrode/electrolyte interface is not limiting. As in sample 3, the first layers
of the electrode for samples 4-6 were deposited by ESD. Fig. 3.16a shows that the Rs values
of the three samples are comparable and still within the error range (the deviation is less than
10%) which further indicates the similar electrode/electrolyte quality (without partial
delaminations).
However, the three electrodes show different electrochemical behavior depending on the
temperature as shown by the Rpol values in Fig. 3.16b. Firstly, sample 5 presents lower Rpol
20 25 30 35 40 45 50
Inte
nsi
ty (
a.u.)
2-Theta (o)
As-sintered
FinalSintering 800 °C
FinalSintering 900 °C
FinalSintering 1100 °C
o o
o
*
*
*
*
*
* *=
=
o GDC
* LPNO
= (La,Pr)3Ni2O7-δ
(i) as-sintered
(ii) 800 oC
(iii) 900 oC
(iv) 1100 oC
LPNO ESD

Chapter 3: Improving the Electrode Performance of Rare-Earth Nickelates by Improving the
Microstructure and Architectural Design
79
compared to sample 4 for all the temperature range and the difference is enhanced when the
temperature is increased. From the cross-section image obtained by SEM shown in Fig. 3.17a-
b, the ESD layer of sample 5 is only 20 μm-thick and shows an average particle size of 150
nm, which means that the layer is more densified and has slightly bigger particle size than the
ESD layer after the first sintering (Fig. 3.10c-d in §3.3). There are no SEM images for the ESD
layer of sample 4, but it can be expected that there is less densification and grain growth
compared to the ESD layer of sample 5 due to the lower second heat-treatment temperature.
Thus, despite its unfavorable microstructural coarsening, it can be concluded that the
improvement of the performance of sample 5 is mainly due to the presence of a higher amount
of the (LP)3N2 secondary phase. Secondly, sample 6 exhibits a different thermal behavior as
sample 5 even though both of them have a similar amount of the secondary phase in the ESD
layer. Sample 6 has the highest Rpol between the three samples at low temperature, then the Rpol
becomes smaller than sample 4 at a temperature higher than 600 oC, while its value is similar
to sample 5 at 700 oC. From the cross-section images by SEM in Fig. 3.17c-d, the ESD layer
of sample 6 has a thickness of 10 μm and an average particle size of 200 nm, indicating quite
a severe densification and grain growth. Thus, the electrode is less performing at low
temperature due to the low specific surface area which reduces the number of sites where the
reaction of oxygen incorporation can take place. However, as the temperature increases, the
presence of the higher-order secondary phase in this electrode helps to significantly improve
the electrode performance. It can be safely inferred from these results that the impact of the
higher-order phase on the electrode performance is sufficiently thermally activated to
overcome the effect of the microstructure densification. The different behavior of the three
samples is also evident from the activation energy values which are 0.95, 1.08, 1.21 eV for
samples 4, 5, and 6, respectively.
The deconvolution of the polarization resistance in Fig. 3.16c shows that the electrode
resistance is majorly contributed by R2 with the same trendline as the polarization resistance.
The P3 starts to minorly contribute at 600 °C. The contribution of R3 to the total polarization
resistance is less than 6% at 600 °C and less than 30% at 700 °C for all samples. By analyzing
the capacitance values related to each process shown in Fig. 3.16d, the values of Cchem are
within the theoretical value for chemical capacitance and the large values of C3 are related to
the capacitance for gas diffusion. Meanwhile, the C2 values are smaller than those of Cchem,
but they are larger than the capacitance related to interfacial capacitance.

Chapter 3: Improving the Electrode Performance of Rare-Earth Nickelates by Improving the
Microstructure and Architectural Design
80
Fig. 3. 15 (a)-(c) Nyquist plots and (d)-(f) Bode plots of samples 4, 5, and 6 at 500, 600, and
700 °C, respectively. The Nyquist plots are plotted by subtracting the contribution of the series
resistance and the numbers on the Nyquist plots indicate the logarithmic of the frequencies.
-2 -1 0 1 2 3 40
1
2
3
4 Sample 4
Sample 5
Sample 6
-Im
[Z]
( c
m2)
log(Frequency) (Hz)
P2
500 oC
(d)
-2 -1 0 1 2 3 40.0
0.1
0.2
0.3
0.4
0.5 Sample 4
Sample 5
Sample 6-I
m[Z
] (
cm
2)
log(Frequency) (Hz)
(e)
600 oC
P2
P3
-2 -1 0 1 2 3 40.00
0.05
0.10
0.15 Sample 4
Sample 5
Sample 6
-Im
[Z]
( c
m2)
log(Frequency) (Hz)
(f)
700 oC
P2
P3
0.0 0.1 0.2 0.30.00
0.05
0.10
0.15
0.20
0.25 Sample 4
Sample 5
Sample 6
Fit
-Im
[Z]
( c
m2)
Re[Z]-Rs ( cm2)
-1
(c)
700 oC
01
2
3
0.0 0.2 0.4 0.6 0.8 1.00.0
0.1
0.2
0.3
0.4
0.5
0.6
0.7 Sample 4
Sample 5
Sample 6
Fit
-Im
[Z]
( c
m2)
Re[Z]-Rs ( cm2)
(b)
600 oC
-10
1
2
3
0 1 2 3 4 5 6 7 8 90
1
2
3
4
5
6 Sample 4
Sample 5
Sample 6
Fit
-Im
[Z]
( c
m2)
Re[Z]-Rs ( cm2)
(a)
500 oC
-1
01
2

Chapter 3: Improving the Electrode Performance of Rare-Earth Nickelates by Improving the
Microstructure and Architectural Design
81
Fig. 3. 16 The Arrhenius plots of (a) series resistance (Rs) and (b) polarization resistance (Rpol).
The deconvolution of (c) resistance (R) and (d) capacitance (C) associated with P2 (filled
markers) and P3 (empty markers) processes, as well as chemical capacitance (Cchem, empty
with plus sign markers). All plots are for sample 4 (black square), 5 (blue circle), and 6 (triangle
red).
1.00 1.05 1.10 1.15 1.20 1.25 1.30 1.35 1.400.01
0.1
1
10
Sample 4
Sample 5
Sample 6
Sample 4
Sample 5
Sample 6
Sample 4
Sample 5
Sample 6
R (
c
m2)
1000/T (K-1)
Sample 4
Sample 5
Sample 6
700 650 600 550 500 450
T (oC)
1.00 1.05 1.10 1.15 1.20 1.25 1.30 1.35 1.40
5
10
15
20
25
Rs
( c
m2)
1000/T (K-1)
Sample 4
Sample 5
Sample 6
700 650 600 550 500 450
T (oC)
1.00 1.05 1.10 1.15 1.20 1.25 1.30 1.35 1.40
0.1
1
10
Sample 4
Sample 5
Sample 6
Rpol
( c
m2)
1000/T (K-1)
700 650 600 550 500 450
T (oC)(a) (b)
R2
R3
(c) (d)
1.00 1.05 1.10 1.15 1.20 1.25 1.30 1.35 1.401E-3
0.01
0.1
1
10
100
Cap
acit
ance
(F
cm
-2)
1000/T (K-1)
Sample 4
Sample 5
Sample 6
Sample 4
Sample 5
Sample 6
Sample 4
Sample 5
Sample 6
Sample 4
Sample 5
Sample 6
700 650 600 550 500 450
T (oC)
C2
Cchem
C3

Chapter 3: Improving the Electrode Performance of Rare-Earth Nickelates by Improving the
Microstructure and Architectural Design
82
Fig. 3. 17 The cross-section images of (a), (b) ESD layer after second heat-treatment at 450
°C/2 h + 900 °C/2 h and (c), (d) ESD layer after second heat-treatment at 450 °C/2 h + 1050
°C/2 h + 1100 °C/0.5 h at two different magnifications. The dashed white line indicates the
electrode/electrolyte interface.
3.7 Influence of the CCL microstructure on the performance of the electrode
In both double (DL) and triple (TL) layer electrode configurations, a CCL of LPNO was
deposited by SP. As discussed in §3.3, the cross-section of the single SP layer (Fig. 3.10a-b)
shows that the LPNO particles form big agglomerates which are detrimental especially for the
DL and TL electrodes. Indeed, these agglomerates may compress the AFL deposited by ESD
beneath and, consequently, deteriorate its fine microstructure. Therefore, a part of the LPNO
powder for SP was previously ball-milled in a planetary ball mill for 2 h to reduce the particle
size and then used in the preparation of the ink for screen-printing of the CCL. The
microstructure, as well as the electrochemical performance, were then compared to the
(d)(c)
(b)(a)
10 µm
10 µm
200 nm
200 nm
20 µm
10 µm

Chapter 3: Improving the Electrode Performance of Rare-Earth Nickelates by Improving the
Microstructure and Architectural Design
83
electrode prepared by using powder without ball-milling for the CCL. The SEM images of the
LPNO powder before and after ball-milling are shown in Fig. 3.18a-b and 3.18c-d, respectively.
Qualitatively, it is clear to see that the particles of the ball-milled powder are significantly well-
separated rather than clumped together in agglomerates as in the non-ball-milled powder. The
average agglomerate size of the non-ball-milled powder is 13.75 μm with an average particle
size of 300 nm. After ball-milling, the average particle size is decreased to 160 nm. The effect
of the smaller and well-separated particles of the LPNO powder is also clearly evident in the
final microstructure of the DL electrode. In Fig. 3.18e, non-ball-milled powder is used as the
CCL. The big agglomerates are clearly compressing the ‘coral-like’ microstructure of the ESD
layer beneath which makes it difficult to distinguish both layers. On the other hand, the much
smaller particle size of the ball-milled powder preserves the microstructure of the ESD layer
as shown in Fig. 3.18f.
Fig. 3. 18 SEM images of (a), (b) LPNO powder before ball-milling; (c), (d) LPNO powder
after ball-milling; the cross-section of the double-layer electrodes (e) with non-ball-milled
LPNO powder and (f) with ball-milled LPNO powder as the CCL; and (g), (h) the cross-section
of the triple-layer electrode at two different magnifications. The dashed white line indicates the
interfaces.
To understand the influence of the CCL microstructure on the electrochemical performance of
the electrode, the EIS study for the DL electrode was carried out by comparing sample 4 to
sample 7 (Table 3.1). Both electrodes were prepared following the same manufacturing
protocol except that the ball-milled powder was used for the CCL deposit of sample 7. The
same EIS study was also performed for the TL electrode. The cross-section of the AFL of a TL
electrode, which comprises of GDC deposited by SP and LPNO deposited by ESD, is presented
10 µm 10 µm200 nm 200 nm
2 µm
LPNO
ESD
LPNO
SP
2 µm
LPNO
ESD
GDC SP 1 µm
LPNO
ESD
GDC SP
2 µm
LPNO
ESD
LPNO
SP
(a) (b)
(e) (f)
(c) (d)
(g) (h)

Chapter 3: Improving the Electrode Performance of Rare-Earth Nickelates by Improving the
Microstructure and Architectural Design
84
in Fig. 3.18g-h. The thickness of the GDC SP layer is 6 μm with an average particle size of
150 nm. Since this SP layer is porous and the particle size is slightly larger than the LPNO
ESD layer, it was expected that the particle of LPNO would penetrate the SP layer to form a
composite of LPNO and GDC. This proposition is confirmed by the EDX analysis carried out
across the thickness of the GDC SP layer shown in Fig. 3.19, in which the LPNO particles
penetrate the GDC SP layer as deep as 3 μm from the LPNO ESD/GDC SP interface. As in the
study of DL electrodes previously mentioned, two TL symmetrical cells were prepared. Sample
8 was prepared with the non-ball-milled powder and sample 9 with the ball-milled powder.
Fig. 3. 19 The elements distribution observed at three different regions across the screen-
printed GDC: at the LPNO ESD/GDC SP interface (black), at 3 μm from this interface (blue),
and at 5 μm from this interface (red).
The EIS results further validate that the ball-milled powder does not only improve the quality
of the microstructure but also the electrochemical performance of the electrode. The Nyquist
plots presented in Fig. 3.20a-c show that the shape of the plots is similar but the size decreases
from sample 4 to sample 7 as well as from sample 8 to sample 9. The Bode plots in Fig. 3.20d-
f show that the frequency distribution is slightly shifted to a higher frequency when the ball-
milled powder is used. However, the apparent processes are similar between the two DL
electrodes and the two TL electrodes. For DL electrodes, the contribution of P3 starts to appear
at 600 °C and there is no contribution of P1 at all temperatures, which is in agreement with the
4.0 4.5 5.0 5.5 6.00
1000
2000
3000
Co
un
ts (
cps
(eV
)-1)
Energy (keV)
LPNO ESD/GDC SP interface
GDC SP (+3 m)
GDC SP (+5 m)Ce
Ce
Ce
La Pr

Chapter 3: Improving the Electrode Performance of Rare-Earth Nickelates by Improving the
Microstructure and Architectural Design
85
results of the electrodes with the same DL configuration mentioned in the previous section.
The TL electrodes, however, show that the contribution of P1 is apparent up to 600 °C. Since
P1 is related to the charge transfer, it can be suspected that in the case of TL configuration, the
GDC SP plays a role to limit the kinetics of this process. It will be explained further in the next
section.
The Arrhenius plots of Rs versus temperature in Fig. 3.21a show that the values for the four
samples are within the error range. The slightly higher series resistances for the TL cells than
those of DL can be attributed to the additional thickness from the GDC SP layer. Based on the
plots of Rpol in Fig. 3.21b, the polarization resistance of sample 7 is smaller than sample 4
whatever the operating temperature. Likewise, the Rpol of sample 9 is also smaller than sample
8 at all temperatures. These results show an improvement in the electrochemical performance
of both DL and TL electrodes by optimizing the microstructure of the CCL.
The deconvolution of the resistance in Fig. 3.21c shows that R2 is the major contributor to the
total electrode resistance for all samples. The trendline of R2 is also similar to the trendline of
Rpol. The significant decrease in the contribution of P2, along with the previously mentioned
frequency shift shown by the Bode plots, when the ball-milled powder is used indicating the
improvement on the oxygen incorporation with a faster oxygen exchange on the surface. These
improvements must be attributed to the combination of smaller particle size of the CCL layer
and the preserved microstructure of the AFL layer prepared by ESD. Both factors ensure the
large specific surface area as well as the porosity to promote a more efficient reaction to take
place. As in the explanations in §3.5 and §3.6, the capacitance values for C1, Cchem, and C3,
shown in Fig. 3.21d, are in the range of capacitance related to interfacial, chemical, and gas
diffusion capacitance, respectively. Besides, the C2 values are smaller than Cchem, but it is
higher than the usual interfacial capacitance.

Chapter 3: Improving the Electrode Performance of Rare-Earth Nickelates by Improving the
Microstructure and Architectural Design
86
Fig. 3. 20 (a)-(c) Nyquist plots and (d)-(f) Bode plots of samples 4, 7, 8, and 9 at 500, 600, and
700 °C, respectively. The Nyquist plots are plotted by subtracting the contribution of the series
resistance and the numbers on the Nyquist plots indicate the logarithmic of the frequencies.
-2 -1 0 1 2 3 40.00
0.05
0.10
0.15 Sample 4
Sample 7
Sample 8
Sample 9
-Im
[Z]
( c
m2)
log(Frequency) (Hz)
(f)
700 oC P2
P3
-2 -1 0 1 2 3 40.0
0.1
0.2
0.3
0.4
0.5 Sample 4
Sample 7
Sample 8
Sample 9
-Im
[Z]
( c
m2)
log(Frequency) (Hz)
(e)
600 oCP2
P3
-2 -1 0 1 2 3 40.0
0.5
1.0
1.5
2.0
2.5
log(Frequency) (Hz)
Sample 4
Sample 7
Sample 8
Sample 9
-Im
[Z]
( c
m2)
P2
(d)
500 oC
P1
0.0 0.2 0.4 0.6 0.8 1.00.0
0.2
0.4
0.6
0.8 Sample 4
Sample 7
Sample 8
Sample 9
Fit
-Im
[Z]
( c
m2)
Re[Z]-Rs ( cm2)
(b)
600 oC
-10
1
2
3
0 1 2 3 4 5 60
1
2
3
4 Sample 4
Sample 7
Sample 8
Sample 9
Fit
-Im
[Z]
( c
m2)
Re[Z]-Rs ( cm2)
(a)
500 oC
-1
01
2
0.0 0.1 0.2 0.3 0.40.00
0.05
0.10
0.15
0.20
0.25
0.30 Sample 4
Sample 7
Sample 8
Sample 9
Fit
-Im
[Z]
( c
m2)
Re[Z]-Rs ( cm2)
(c)
700 oC
-1
1
2
30
P1
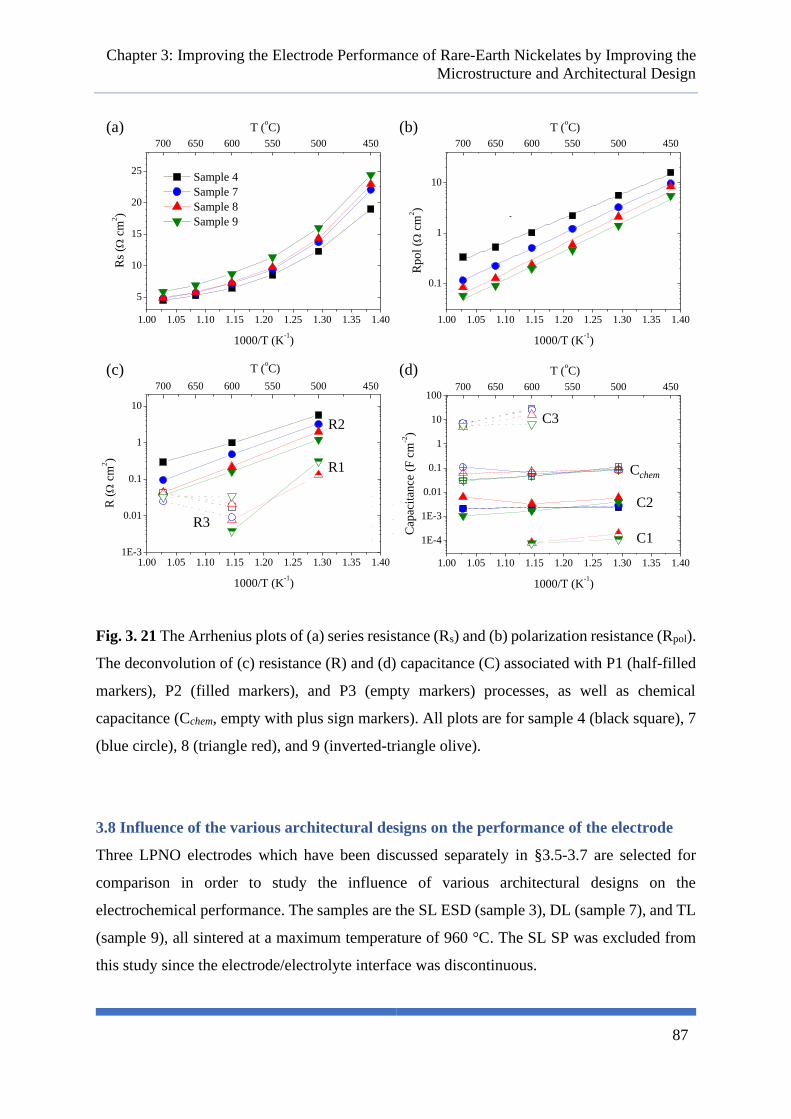
Chapter 3: Improving the Electrode Performance of Rare-Earth Nickelates by Improving the
Microstructure and Architectural Design
87
Fig. 3. 21 The Arrhenius plots of (a) series resistance (Rs) and (b) polarization resistance (Rpol).
The deconvolution of (c) resistance (R) and (d) capacitance (C) associated with P1 (half-filled
markers), P2 (filled markers), and P3 (empty markers) processes, as well as chemical
capacitance (Cchem, empty with plus sign markers). All plots are for sample 4 (black square), 7
(blue circle), 8 (triangle red), and 9 (inverted-triangle olive).
3.8 Influence of the various architectural designs on the performance of the electrode
Three LPNO electrodes which have been discussed separately in §3.5-3.7 are selected for
comparison in order to study the influence of various architectural designs on the
electrochemical performance. The samples are the SL ESD (sample 3), DL (sample 7), and TL
(sample 9), all sintered at a maximum temperature of 960 °C. The SL SP was excluded from
this study since the electrode/electrolyte interface was discontinuous.
1.00 1.05 1.10 1.15 1.20 1.25 1.30 1.35 1.40
1E-4
1E-3
0.01
0.1
1
10
100
Cap
acit
ance
(F
cm
-2)
1000/T (K-1)
Sample 4
Sample 7
Sample 8
Sample 9
Sample 4
Sample 7
Sample 8
Sample 9
Sample 4
Sample 7
Sample 8
Sample 9
Sample 4
Sample 7
Sample 8
Sample 9
700 650 600 550 500 450
T (oC)
1.00 1.05 1.10 1.15 1.20 1.25 1.30 1.35 1.401E-3
0.01
0.1
1
10
Sample 4
Sample 7
Sample 8
Sample 9
Sample 4
Sample 7
Sample 8
Sample 9
Sample 4
Sample 7
Sample 8
Sample 9
R (
c
m2)
1000/T (K-1)
Sample 4
Sample 7
Sample 8
Sample 9
700 650 600 550 500 450
T (oC)
1.00 1.05 1.10 1.15 1.20 1.25 1.30 1.35 1.40
5
10
15
20
25
Rs
( c
m2)
1000/T (K-1)
Sample 4
Sample 7
Sample 8
Sample 9
700 650 600 550 500 450
T (oC)
1.00 1.05 1.10 1.15 1.20 1.25 1.30 1.35 1.40
0.1
1
10
Sample 4
Sample 7
Sample 8
Sample 9
Rp
ol
( c
m2)
1000/T (K-1)
700 650 600 550 500 450
T (oC)(a) (b)
R2
R3
(c) (d)
C2
Cchem
C3
R1
C1

Chapter 3: Improving the Electrode Performance of Rare-Earth Nickelates by Improving the
Microstructure and Architectural Design
88
The Nyquist and Bode plots for the three electrodes are provided in Fig. 3.22. The frequency
distribution of the three samples is similar and the P3 becomes important at temperature
≥600 °C. The contribution of P1 associated with the GDC/LPNO interface, which was not
noticeable on both SL ESD and DL electrodes, becomes detectable for TL electrode at the
intermediate and low operating temperatures (T ≤ 600 °C). Even if the explanation is still
unclear, the detection of P1 for the TL electrodes could come from a co-limitation arising at
low temperatures for the oxygen bulk solid-state diffusion and the ionic transfer in the thickness
of the composite (knowing that, in the same time, the process P2 is improved for this electrode
architecture due the extension of the reaction zone as discussed in the next paragraph).
Moreover, a contribution of triple-phase boundary lines according to a surface path could not
be excluded for this kind of LPNO/GDC composite electrode. Nevertheless, further
investigations are still needed to better understand the precise reaction pathway for this kind of
electrodes.
The series resistance presented in Fig. 3.23a shows that all values are within the error range.
Slightly higher values are observed for TL electrode which is most likely caused by the
additional thickness from the GDC SP layer as mentioned in the previous section. The
Arrhenius plots of Rpol for the three electrodes is presented in Fig. 3.23b. The Rpol of sample 7
is lower than sample 3 whereas the best performances are achieved with sample 9. Compared
to the single-layer (sample 3), the improvement of the performance for the DL electrode
(sample 7) could be attributed to a better electrode surface. Indeed, although the ESD layer has
a good electrode/electrolyte interface, its surface is very rough (as mentioned in §3.3). Thus,
by depositing an SP coating on top of the ESD layer, the electrode surface is flatter promoting
better contact and current collection with the gold grid of the measurement setup.
The performance is then further improved on the TL electrode (sample 9). As mentioned in the
previous section, this configuration results in the formation of an LPNO-GDC composite
interlayer. The composite is expected to improve the mechanical contact between the LPNO
and the GDC. Moreover, the oxygen solid-state diffusion must be favored thanks to the GDC
backbone leading to the extension of the reaction in the electrode thickness and hence
increasing the performances. This mechanism has been already proven in a previous study
dedicated to TL electrode configuration with La2NiO4+δ and Pr2NiO4+δ nickelates [12]. Thus,
it can be reasonably proposed here that the same phenomenon could explain the better
performances of the TL electrode with LPNO. As shown in the Bode plots, as well as on the

Chapter 3: Improving the Electrode Performance of Rare-Earth Nickelates by Improving the
Microstructure and Architectural Design
89
deconvolution of the polarization resistance in Fig. 3.23c, this proposition is in good agreement
with the smaller contribution of P2 for the TL electrodes as compared to the DL configurations.
It is worth to note that the TL electrode is very well-performing in such a way that the
contribution of P2 is very small and comparable to the contribution of P3.
The Rpol values obtained from this work are in agreement with the ones in literature as shown
in Fig. 3.23b. Even though it is not the best performing LPNO electrode, the performance of
the prepared electrode is still very good. The difference in the performance of SL and DL
electrodes between the ones prepared in this work and the works of Sharma can be attributed
to the difference in the deposition and sintering parameters (i.e. deposition time, solution
composition, sintering temperature, powder preparation for SP) [35].
Fig. 3. 22 (a)-(c) Nyquist plots and (d)-(f) Bode plots of samples 3, 7, and 9 at 500, 600, and
700 °C, respectively. The Nyquist plots are plotted by subtracting the contribution of the series
resistance and the numbers on the Nyquist plots indicate the logarithmic of the frequency.
0 1 2 3 4 50.0
0.5
1.0
1.5
2.0
2.5
0.0 0.2 0.4 0.6 0.80.0
0.1
0.2
0.3
0.4
0.00 0.05 0.10 0.15 0.200.00
0.02
0.04
0.06
0.08
Sample 2
Sample 3
Sample 7
Sample 9
-Im
[Z]
( c
m2)
Re[Z]-Rs ( cm2)
Sample 2
Sample 3
Sample 7
Sample 9
-Im
[Z]
( c
m2)
Re[Z]-Rs ( cm2)
Sample 2
Sample 3
Sample 7
Sample 9
-Im
[Z]
( c
m2)
Re[Z]-Rs ( cm2)
10-2
10-1
100
101
102
103
104
105
0.0
0.5
1.0
1.5
2.0
2.5
10-2
10-1
100
101
102
103
104
105
0.0
0.1
0.2
0.3
0.4
10-2
10-1
100
101
102
103
104
105
0.00
0.02
0.04
0.06
0.08
Sample 2
Sample 3
Sample 7
Sample 9
-Im
[Z]
( c
m2)
Frequency (Hz)
Sample 2
Sample 3
Sample 7
Sample 9
-Im
[Z]
( c
m2)
Frequency (Hz)
Sample 2
Sample 3
Sample 7
Sample 9
-Im
[Z]
( c
m2)
Frequency (Hz)
P2(a)
500 oC
3
(d)
500 oC
(b)
600 oC
(c)
700 oC
(e)
600 oC
(f)
700 oC
P2
P3
P2
P3
P1
P1
-1
-1
-1
1
1
1
0
0
0
2
2
23

Chapter 3: Improving the Electrode Performance of Rare-Earth Nickelates by Improving the
Microstructure and Architectural Design
90
Fig. 3. 23 The Arrhenius plots of (a) series resistance (Rs) and (b) polarization resistance (Rpol).
Several Rpol values of LPNO with similar configuration are also given for comparison [22],
[35]. The deconvolution of (c) resistance (R) and (d) capacitance (C) associated with P1 (half-
filled markers), P2 (filled markers), and P3 (empty markers) processes, as well as chemical
capacitance (Cchem, empty with plus sign markers). All plots are for sample 3 (magenta
diamond), 7 (blue circle), and 9 (inverted-triangle olive).
3.9 Summary and conclusions
This chapter reports first some preliminary data on the optimization of the LPNO electrode
fabrication by using SP and ESD. It can be concluded that to obtain a homogeneous SP ink,
polyvinyl butyral (PVB) is preferred as the binder rather than polyvinylpyrrolidone (PVP). In
the case of the ESD process, the addition of 8 drops of HNO3 in every 30 mL of precursor
solution is required for solution stabilization when the mixture of ethanol and water is used as
1.00 1.05 1.10 1.15 1.20 1.25 1.30 1.35 1.40
1E-4
1E-3
0.01
0.1
1
10
100
Cap
acit
ance
(F
cm
-2)
1000/T (K-1)
Sample 3
Sample 7
Sample 9
Sample 3
Sample 7
Sample 9
Sample 3
Sample 7
Sample 9
Sample 3
Sample 7
Sample 9
700 650 600 550 500 450
T (oC)
1.00 1.05 1.10 1.15 1.20 1.25 1.30 1.35 1.40
0.1
1
10
Sample 3
Sample 7
Sample 9
Rpol
( c
m2)
1000/T (K-1)
700 650 600 550 500 450
T (oC)
1.00 1.05 1.10 1.15 1.20 1.25 1.30 1.35 1.401E-3
0.01
0.1
1
10 Sample 3
Sample 7
Sample 9
Sample 3
Sample 7
Sample 9
Sample 3
Sample 7
Sample 9
R (
c
m2)
1000/T (K-1)
Sample 3
Sample 7
Sample 9
700 650 600 550 500 450
T (oC)
(a) (b)
R2
R3
(c) (d)
C2
Cchem
C3
1.00 1.05 1.10 1.15 1.20 1.25 1.30 1.35 1.40
5
10
15
20
25
Rs
( c
m2)
1000/T (K-1)
Sample 3
Sample 7
Sample 9
700 650 600 550 500 450
T (oC)
R1
C1
1.00 1.05 1.10 1.15 1.20 1.25 1.30 1.35 1.40
0.1
1
10
SL ESD [11]
DL [11]
SL SP [9]
Sample 2
Sample 3
Sample 7
Sample 9
Rp
ol
( c
m2)
1000/T (K-1)
700 650 600 550 500 450
T (oC)
Sharma (SL ESD)
Sharma (DL ESD + SP)
Vibhu (SL SP)

Chapter 3: Improving the Electrode Performance of Rare-Earth Nickelates by Improving the
Microstructure and Architectural Design
91
the solvent. ESD deposition time of 4 h 30’ allows obtaining a porous functional layer with
coral-type morphology, 27 m-thick with good percolation for the application. An LPNO
hierarchical morphology has been prepared for the first time by ESD, even if the adhesion at
the electrode/electrolyte interface must be improved in the future for this particular
microstructure. The electrochemical performance of the double-layered La2-xPrxNiO4+δ
electrode was found to increase for a larger praseodymium content, as expected from the
literature. Last but not the least, the electrode fabrication by SP and ESD is proven to be
reproducible.
In the second part of this chapter, the influence of microstructure and architectural design on
the electrochemical performance of LPNO has also been studied on nine different samples
(detailed in Table 3.1). Firstly, it has been shown that the good adhesion between the electrode
and the electrolyte plays a key role in the global performances. This property can be achieved
by optimizing the sintering condition for the SP electrode or by using alternative manufacturing
processes, such as ESD, which are well-suited to make a continuous electrode/electrolyte
interface. For the LPNO electrode, it has been found that a sintering temperature as high as
1100 oC is required to obtain good adhesion for the SL SP layer while a sintering temperature
at only 960 °C is sufficient for SL ESD. Secondly, it has been highlighted that the quality of
the CCL is also crucial since it can affect the final microstructure of the active functional
electrode for the multi-layer configurations. A ball-milling step on the LPNO powder for SP
prepared by auto-combustion is proven to improve the final microstructure as well as the
performance of the electrode. Thirdly, the performance of the electrode can be also further
improved by improving the electrode/electrolyte interface and electrode surface as indicated
by the decrease of Rpol from 0.72, 0.50, and down to 0.20 Ω cm2 at 600 ºC for SL ESD, DL,
and TL electrodes, respectively. Lastly, the presence of secondary higher-order phase nickelate,
(LP)3N2, evidently helps to improve the performance especially at a higher temperature. The
characteristics of the nine samples are listed in the following Table 3.2. A summary of the
electrochemical data at 500, 600, and 700 °C for all samples mentioned in this chapter is
recorded in Table 3.3.

Chapter 3: Improving the Electrode Performance of Rare-Earth Nickelates by Improving the
Microstructure and Architectural Design
92
Table 3. 2 Architectural design, thickness, and particle size for all the samples mentioned in
this chapter.
Sample # Architectural design Thickness (μm) Particle size (nm)
Sample 1 SL LPNO SP N/A N/A
Sample 2 SL LPNO SP 38 500
Sample 3 SL LPNO ESD 27 130
Sample 4 DL LPNO (ESD + SP) 50 (total ESD+SP) N/A
Sample 5 DL LPNO (ESD + SP) 20 (ESD layer only) 150 (ESD layer)
Sample 6 DL LPNO (ESD + SP) 10 (ESD layer only) 200 (ESD layer)
Sample 7 DL (LPNO ESD + LPNO SP) 38 (total ESD+SP) N/A
Sample 8 TL (GDC SP + LPNO ESD +
LPNO SP)
6 (GDC SP), 25 (GDC SP+LPNO
ESD)
150 (GDC SP)
Sample 9 TL (GDC SP + LPNO ESD +
LPNO SP)
6 (GDC SP), 25 (GDC SP+LPNO
ESD)
150 (GDC SP)

Chapter 3: Improving the Electrode Performance of Rare-Earth Nickelates by Improving the
Microstructure and Architectural Design
93
Table 3. 3 The summary of the electrochemical data at 500, 600, and 700 °C for all samples
mentioned in this chapter.
Sample 1 Sample 2 Sample 3
Ea (eV) 1.06 1.17 1.06
Temperature 500 °C 600 °C 700 °C 500 °C 600 °C 700 °C 500 °C 600 °C 700 °C
Rs (Ω cm2) 16.4 8.62 6.01 12.7 6.39 4.40 13.7 7.02 4.66
P1 R1 (Ω cm2) 4.62 1.35 0.29 0.08 0.02
C1 (x 10-3 F cm-2) 0.21 0.16 0.05 0.11 0.13
P2
R2 (Ω cm2) 10.40 1.31 0.27 5.05 0.62 0.11 4.50 0.69 0.16
Cchem (x 10-3 F cm-2) 23.7 17.6 13.5 159 96.8 82.5 30.3 12.11 10.4
C2 (x 10-3 F cm-2) 0.01 0.02 0.46 1.84 1.84 2.76 1.67 0.98 0.83
P3 R3 (Ω cm2) 0.06 0.03 0.04 0.04
C3 (F cm-2) 3.62 7.01 3.87 4.95
Rpol (Ω cm2) 15.02 2.66 0.62 5.13 0.64 0.14 4.50 0.73 0.20
Sample 4 Sample 5 Sample 6
Ea (eV) 0.95 1.08 1.21
Temperature 500 °C 600 °C 700 °C 500 °C 600 °C 700 °C 500 °C 600 °C 700 °C
Rs (Ω cm2) 12.3 6.46 4.50 12.1 6.33 4.40 13.8 7.14 4.89
P1 R1 (Ω cm2)
C1 (x 10-3 F cm-2)
P2
R2 (Ω cm2) 5.62 0.99 0.29 4.55 0.65 0.12 8.11 0.92 0.17
Cchem (x 10-3 F cm-2) 116 45.7 31.4 61.3 22.2 49.0 41.2 21.9 19.7
C2 (x 10-3 F cm-2) 2.32 2.26 2.15 2.41 1.59 3.14 2.46 1.73 1.92
P3 R3 (Ω cm2) 0.02 0.04 0.04 0.05 0.03 0.04
C3 (F cm-2) 29.1 6.70 6.63 6.19 9.93 4.80
Rpol (Ω cm2) 5.62 1.01 0.33 4.55 0.69 0.17 8.11 0.95 0.21
Sample 7 Sample 8 Sample 9
Ea (eV) 1.08 1.14 1.12
Temperature 500 °C 600 °C 700 °C 500 °C 600 °C 700 °C 500 °C 600 °C 700 °C
Rs (Ω cm2) 13.8 7.30 4.79 14.2 7.27 4.88 15.8 8.67 5.86
P1 R1 (Ω cm2) 0.13 0.008 0.31 0.004
C1 (x 10-3 F cm-2) 0.19 0.08 0.11 0.08
P2
R2 (Ω cm2) 3.19 0.48 0.09 1.98 0.22 0.04 1.22 0.16 0.04
Cchem (x 10-3 F cm-2) 80.6 60.3 106 86.3 72.0 61.0 87.5 48.2 30.0
C2 (x 10-3 F cm-2) 2.71 2.28 2.06 5.96 3.28 6.33 3.85 1.72 1.05
P3 R3 (Ω cm2) 0.01 0.03 0.02 0.04 0.03 0.03
C3 (F cm-2) 25.5 7.16 16.5 4.96 6.71 5.81
Rpol (Ω cm2) 3.19 0.49 0.12 2.11 0.248 0.08 1.53 0.194 0.07

94
CHAPTER 4: DURABILITY
STUDY ON THE SYMMETRICAL
AND COMPLETE CELLS
In this chapter, the results of a long-term durability test in fuel cell and electrolysis modes in a
symmetrical configuration are presented. A preliminary study of the durability of the LPNO
electrode in two complete cells using different GDC barrier layers operating in electrolysis
mode is described afterwards. Parts of this chapter have been published in the Journal of Power
Sources (https://doi.org/10.1016/j.jpowsour.2020.227724).

Chapter 4: Durability Study on the Symmetrical and Complete Cells
95
4.1 Introduction
In Chapter 3, the microstructure and design of the LPNO electrode have been optimized. One
of the important results is the presence of a higher-order nickelate (La,Pr)3Ni2O7-δ, (LP)3N2,
only detected in the AFL deposited by ESD and not in the CCL deposited by SP. It is suggested
that the formation of the secondary phase on the ESD layer can be attributed to its finer particle
size and more open microstructure as compared to the SP layer, yielding to a more reactive
microstructure. The results in §3.6, supported also with data in the literature, show that
(LP)3N2 is an electrochemically active material and is beneficial for the electrochemical
activity of the oxygen electrode. However, the stability of this compound and its impact on the
electrode response during long-term operation (both in electrolysis and fuel cell modes) need
to be addressed. At the same time, one can wonder if the stability of LPNO is related to the
microstructure of the electrode which is different according to the method of preparation. As a
general matter, the amount of literature dedicated to the durability of the LPNO electrode under
operation is still limited as explained in §1.4. Based on all aforementioned reasons, a long-term
test was carried out on a symmetrical cell in both electrolysis and fuel cell modes with a
procedure described in §2.6.1.
Aside from tests on a symmetrical cell, preliminary long-term experiments were also carried
out on two different complete cells in the electrolysis mode. To the best of our knowledge, the
durability test of LPNO as an oxygen electrode in a complete cell configuration is very limited,
especially in its application in the electrolysis mode. Therefore, the study detailed in this
chapter is relevant especially to better understand the durability behavior of the LPNO
electrode in the symmetrical cell and the closer-to-real-application complete cell.
The double-layer LPNO electrode, which consists of the AFL deposited by ESD topped by a
CCL deposited by SP, was selected for this study. The sample preparation procedures by both
deposition techniques have been detailed in §2.2.3 and §2.2.2, respectively. The heat treatment
temperatures were 960 °C for 6 h after ESD and 450 °C for 2 h followed by 800 °C for 2 h
after SP; all carried out in the air. The samples are called SCell, CCell 1, and CCell 2 for the
symmetrical cell, complete cell with screen-printed GDC barrier layer, and complete cell with
sputtered GDC barrier layer, respectively. The summary of the sample information, as well as
the test parameters, are given in Table 4.1. This chapter is focused on the electrochemical
characterization results of the tested cells, while the post-mortem analyses are given in Chapter
5.

Chapter 4: Durability Study on the Symmetrical and Complete Cells
96
Table 4. 1 The list of samples and the detailed long-term test parameters for each.
Long-term test in symmetrical cell Long-term test in complete cell
Sample name SCell CCell 1 CCell 2
Configuration DL on GDC electrolyte DL on half-cell GDC/YSZ/Ni-YSZ
GDC barrier layer N/A Deposited by SP,
4 μm-thick
Deposited by RF
magnetron sputtering,
400 nm-thick
Test parameters
Temperature 700 °C
Environment Air 90/10 H2O/H2 (20% steam conversion rate)
Time 960 h 900 h -
Applied current Cathodic current density of 300 mA
cm-2 on the working electrode
(bottom electrode) → anodic
current on the counter electrode
(top electrode)
Current density of 200 mA cm-2
(anodic current for the air electrode)
4.2 Durability study on the symmetrical cell
4.2.1 Pre-test measurements
Before the long-term test, EIS measurements were conducted on the symmetrical cell, SCell.
The measurements were taken under OCP (idc = 0 mA cm-2) at a temperature between 550 and
700 °C. Thanks to the 3-electrode configuration, the top and bottom electrodes can be measured
independently. The Nyquist and Bode plots are presented in Fig. 4.1a-b for the bottom
electrode and Fig. 4.1c-d for the top electrode. The series and polarization resistances, which
are normalized by multiplying the measured values with the surface area of the electrode, are
shown in Arrhenius plots in Fig. 4.2a-b. As expected, a similar frequency distribution is
observed at all temperatures indicating that similar processes take place on both electrodes.
However, it can be noticed from the Arrhenius plots that the response of the electrodes is not
perfectly symmetric despite the identical material and microstructure. The small difference in
the Rpol values, especially at a higher temperature, can be attributed to artifacts leading to small
distortion on the measurement. They are in general related to the positioning of the Ag-wire
reference electrode, which should be perfectly placed in the middle of the electrolyte side, and
the alignment of the two LPNO electrodes on the electrolyte [93]. Nevertheless, the difference
in the Rpol values is not so significant (less than 12% at all temperatures). On the other hand, a
quite significant difference is apparent in the series resistance, in which the values are larger
by about 50% for the top electrode as compared to the bottom electrode. Since the
electrochemical responses of both electrodes are almost identical, the difference in Rs should
not be due to a problem in the reference electrode positioning. Therefore, the higher Rs values

Chapter 4: Durability Study on the Symmetrical and Complete Cells
97
could indicate a worse contact between the top electrode and the gold grid due to insufficient
load, yielding to higher contact resistance.
Fig. 4. 1 (a),(c) Nyquist plots and (b),(d) Bode plots of SCell at 550-700 °C taken at OCP for
the bottom and top electrodes, respectively. The Nyquist plots are plotted by subtracting the
contribution of the series resistance and the numbers on the Nyquist plots indicate the
logarithmic of the frequency. The inset graphs indicating the magnification of the plots taken
at 650 and 700 °C for clarity.
10-2
10-1
100
101
102
103
0
1
2
3 550 °C
600 °C
650 °C
700 °C
-Im
[Z]
( c
m2)
Frequency (Hz)
550 C_OCV_Bottom_Galv10mA
600 C_OCV_Bottom_Galv10mA
650 C_OCV_Bottom_Galv10mA
700 C_OCV_Bottom_Galv10mA
10-2
10-1
100
101
102
103
104
0.0
0.1
0.2
0.3
-Im
[Z]
( c
m2)
Frequency (Hz)
0 1 2 3 4 5 6 70
1
2
3
-Im
[Z]
( c
m2)
Re[Z]-Rs ( cm2)
550 C_OCV_Bottom_Galv10mA
600 C_OCV_Bottom_Galv10mA
650 C_OCV_Bottom_Galv10mA
700 C_OCV_Bottom_Galv10mA
0.0 0.1 0.2 0.3 0.4 0.5 0.6 0.7 0.80.0
0.1
0.2
0.3
-Im
[Z]
( c
m2)
Re[Z]-Rs ( cm2)
(b)(a) Bottom electrode
0
-1
1
20
1
-1
01
1
2
2
3 0
10-2
10-1
100
101
102
103
0
1
2
3 550 °C
600 °C
650 °C
700 °C-I
m[Z
] (
cm
2)
Frequency (Hz)
550 C_OCV_Top_Galv10mA
600 C_OCV_Top_Galv10mA
650 C_OCV_Top_Galv10mA
700 C_OCV_Top_Galv10mA
10-2
10-1
100
101
102
103
104
0.0
0.1
0.2
0.3
-Im
[Z]
( c
m2)
Frequency (Hz)
0 1 2 3 4 5 6 70
1
2
3
-Im
[Z]
( c
m2)
Re[Z]-Rs ( cm2)
550 C_OCV_Top_Galv10mA
600 C_OCV_Top_Galv10mA
650 C_OCV_Top_Galv10mA
700 C_OCV_Top_Galv10mA
0.0 0.1 0.2 0.3 0.4 0.5 0.6 0.7 0.80.0
0.1
0.2
0.3
-Im
[Z]
( c
m2)
Re[Z]-Rs ( cm2)
Top electrode(c) (d)
01
-1
0
1
-1
2
01
22
10
3

Chapter 4: Durability Study on the Symmetrical and Complete Cells
98
Fig. 4. 2 The Arrhenius plots of (a) series resistance (Rs) and (b) polarization resistance (Rpol)
for the bottom (black square) and top (blue circle) electrodes of SCell.
4.2.2 Long-term measurement in electrolysis and fuel cell modes (idc = ±300 mA cm-2)
The long-term test was carried out by applying a cathodic current of -300 mA cm-2 to the
bottom electrode which was chosen as the working electrode. It means that the bottom electrode
operated in fuel cell mode (cathodic side) while the top electrode operated in electrolysis mode
(anodic side). The test was carried out in air at 700 °C for 960 h. During this period, the voltage
measured between the working and reference electrodes was recorded upon the operation and
then plotted as a function of time as shown in Fig. 4.3. Since the working electrode is the
cathodic side, this graph shows the evolution of the electrode response under fuel cell operation.
The initial measured voltage is -1.41 V and includes a part of the ohmic losses in the electrolyte.
The absolute value of the voltage increases a little bit in the first 50 hours and it steadily
decreases afterwards, indicating slightly better performance at the beginning followed by cell
degradation. The measured voltage is the sum of all the contributions between the working and
the reference electrodes, thus, any deviation on from its initial value must directly be related to
changes on the interfaces and/or the bulk electrodes or/and the electrolyte. Indeed, the operating
condition might induce some changes such as the new phase formation, microstructural
evolution, changes on the electrode/electrolyte or electrode/Au-grid interfaces yielding to
either activation (improvement) or passivation (degradation) of the cell [94]. By the end of the
test, the calculated electrode degradation rate in fuel cell mode is 219 mV kh-1 (15.5 V% kh-1).
1.00 1.05 1.10 1.15 1.20 1.25
1
Bottom electrode
Top electrode
Symmetric
Pola
riza
tion R
esis
tance
(
cm
2)
1000/T (K-1)
700 650 600 550
T (°C)
1.00 1.05 1.10 1.15 1.20 1.25
10
20
30
40
Bottom electrode
Top electrode
Symmetric
Ser
ies
Res
ista
nce
(
cm
2)
1000/T (K-1)
700 650 600 550
T (°C)(a) (b)

Chapter 4: Durability Study on the Symmetrical and Complete Cells
99
Fig. 4. 3 Voltage between the working and the reference electrodes as a function of time for
SCell operating in fuel cell mode.
To observe any changes in the two electrodes responses after the long-term test, each side of
the cell is subjected to EIS measurements at OCP. The comparison of Nyquist and Bode plots
taken before and after the long-term test are shown in Fig. 4.4a-b and Fig. 4.4c-d for the
cathodic and anodic sides, respectively. From the Nyquist plots, the series and polarization
resistances are extracted and shown in Fig. 4.5a-b. It is observed that both electrodes have
different behavior over time in either electrolysis or fuel cell modes. The response of the anodic
side (operated in electrolysis mode) is almost similar before and after the test for 960 h.
Conversely, the Rpol value of the cathodic side significantly increases to triple the initial value
before the test. This result is consistent with a previous study on the lanthanum-praseodymium
nickelates in which a significant increase (between 4 times for La1.5Pr0.5NiO4+δ up to 35 times
for Pr2NiO4+δ) of Rpol was observed on the electrode operated in fuel cell mode whereas the
performance was quite stable in electrolysis mode [36]. The different behavior under
electrolysis and fuel cell modes might be caused by different reaction and decomposition
processes of LPNO under either anodic or cathodic polarization [44]. The decomposition
products under cathodic polarization might be more detrimental to the electrochemical
performance of the electrode (e.g. decomposition products that were insulators or could cause
delamination), thus the Rpol value significantly increases after the aging. This argument is also
supported by the deconvolution of the impedance spectra. A shift of frequency distribution
towards lower frequency is observed within the frequency range that is related to P2 for both
sides as seen from the Bode plots (see §3.4 for the equivalent electrical circuit and the
0 200 400 600 800 1000-1.50
-1.45
-1.40
-1.35
-1.30
-1.25
-1.20
-1.15
Volt
age
(V)
Time (h)
700 °C
Cathodic side (fuel cell)
Current: -300 mA cm-2

Chapter 4: Durability Study on the Symmetrical and Complete Cells
100
assignment of the processes involved in the electrode). It can be suspected that the frequency
shift is caused by new phase formation or changes on the electrode microstructure resulting in
changes on the oxygen surface exchange and/or solid-state diffusion in the bulk electrode [95].
However, while the amplitude of P2 does not change after the operation in the electrolysis
mode, a significant increase is observed on the cathodic side. This observation further indicates
that different changes happen in both operation modes. Moreover, a small contribution of P1
appears at high frequency for the electrode operated in fuel cell mode suggesting possible
delamination at electrode/electrolyte interface. Indeed, delamination has been clearly observed
on the cathodic side after the cell is removed from the measurement setup. Some post-mortem
characterizations have been carried out to corroborate these propositions, which will be detailed
in Chapter 5. From the polarization resistance values before and after the long-term test, the
calculated cell degradation rate in fuel cell mode is 607 mΩ cm2 kh-1 (162.49 Ω% kh-1) while
in the electrolysis mode it is only 7.28 mΩ cm2 kh-1 (1.55 Ω% kh-1).
In parallel, a decrease in series resistance is observed for both electrodes. The origin of this
decrease is most likely caused by the improvement in the contact between the electrode and
the gold grid over time (cf. discussion in §4.2.1).

Chapter 4: Durability Study on the Symmetrical and Complete Cells
101
Fig. 4. 4 (a),(c) Nyquist plots and (b),(d) Bode plots of SCell at 700 °C which are taken before
and after a long-term test for cathodic and anodic sides, respectively. The Nyquist plots are
plotted by subtracting the contribution of the series resistance and the numbers on the Nyquist
plots indicate the logarithmic of the frequency.
Fig. 4. 5 (a) The series resistance (Rs) and (b) the polarization resistance (Rpol) before and after
a long-term test for the cathodic (black square) and anodic (blue circle) sides of SCell.
0.0 0.2 0.4 0.6 0.8 1.00.0
0.1
0.2
0.3
0.4
Cathodic polarization
(fuel cell mode)
t = 0 h
t = 960h
-Im
[Z]
( c
m2)
Re[Z]-Rs ( cm2)
700 C_OCV_Bottom_Galv10mA
700 C_OCV_Bottom_Galv10mA
700 °C
OCP
(a)
10-2
10-1
100
101
102
103
104
105
0.0
0.1
0.2
0.3
0.4
700 C_OCV_Bottom_Galv10mA
700 C_OCV_Bottom_Galv10mA
-Im
[Z]
( c
m2)
Frequency (Hz)
Cathodic polarization
(fuel cell mode)
t = 0 h
t = 960 h
(b)
30
1
2
2
10
3
0.0 0.2 0.4 0.6 0.8 1.00.0
0.1
0.2
0.3
0.4
Anodic polarization
(electrolysis mode)
t = 0 h
t = 960 h
-Im
[Z]
( c
m2)
Re[Z]-Rs ( cm2)
700 C_OCV_Top_Galv10mA
700 C_OCV_Top_Galv10mA
10-2
10-1
100
101
102
103
104
105
0.0
0.1
0.2
0.3
0.4
-Im
[Z]
( c
m2)
Frequency (Hz)
Anodic polarization
(electrolysis mode)
t = 0 h
t = 960 h
(c) (d)
013
2
P2
P2
P3
P1
P3
0 9602
4
6
8
10
12
14
Ser
ies
Res
ista
nce
(
cm
2)
t (h)
Cathodic side
Anodic side
Symmetric
0 960
0.4
0.6
0.8
1.0
1.2
1.4 Cathodic side
Anodic side
Symmetric
Po
lari
zati
on
Res
ista
nce
(
cm
2)
t (h)
(a) (b)700 °C

Chapter 4: Durability Study on the Symmetrical and Complete Cells
102
4.3 Preliminary durability study on the complete cell
Based on the previously discussed durability test on a symmetrical cell, one can conclude that
the LPNO electrode is electrochemically stable after an operation in electrolysis mode for 960
h. In this sub-chapter, subsequent tests on two complete cells (CCell 1 and CCell 2) in
electrolysis mode are discussed to investigate and compare the behavior of the LPNO electrode
as it is upscaled from symmetrical cell level to complete cell level. It is important to note that
the results explained here are considered as a preliminary study on the application of the LPNO
electrode for complete cell and therefore, deeper investigations will be still necessary in the
future. The details on the mounting procedures of the cell to the test bench (test configuration,
applied load, glass sealing, NiO reduction) as well as the long-term test procedures in
electrolysis mode have been given in §2.6.2. It is reminded that during the long-term test, the
O2 electrode was fed by air (O2/N2 = 0.21/0.79) while the H2 electrode was supplied by a
mixture of steam (H2O) and hydrogen (H2) with a ratio of 90/10. The total flow rate of gases
on both sides is 8.9 Nl h-1, and in this chapter it will be referred to as Dtot,SOEC 9.
In addition to this applied flow rate, other conditions of gas supply were also used for the
purpose of several pre-test and post-test measurements. A first one was chosen for
measurements in electrolysis mode but with a higher flow rate called Dtot,SOEC 20 (i.e. for a total
flow rate of 20 Nl h-1 by keeping a ratio of H2O/H2 of 90/10 and air at the O2 side). The second
one was defined to characterize the cell in fuel cell mode called Dtot,SOFC 9. In this case, H2 was
supplied to the hydrogen electrode side while O2 was passed through the oxygen electrode side.
The details on the gas composition and flow rate are given in Table 4.2.
Table 4. 2 The details on the gas composition and flow rates of each gas for measurements of
complete cell in both fuel cell and electrolysis modes. The steam conversion rates (SC) are
given for a current density of 0.2 A cm-2.
O2 electrode side H2 electrode side
Air flow rate (Nl h-1) Total flow rate (Nl h-1) Gas composition SC (%)
Dtot,SOFC (Nl h-1) 9 6.78 2.26 100% H2 -
Dtot,SOEC (Nl h-1) 9 6.78 2.12 H2O/H2 = 90/10 20.05
20 13.56 6.55 H2O/H2 = 90/10 6.47

Chapter 4: Durability Study on the Symmetrical and Complete Cells
103
It can be noticed that the sign convention of the applied current for a complete cell is the
opposite of the one used for a symmetrical cell, i.e. negative sign is used for the applied anodic
current on complete cell.
4.3.1 Preliminary durability test on CCell 1: GDC barrier layer by screen printing
As described in Table 4.1, CCell 1 is prepared by using a commercial half-cell in which the
GDC barrier layer with a thickness of 4 μm is deposited by screen printing. The GDC barrier
layer is important to prevent reactivity between the LPNO electrode and the YSZ electrolyte.
Before the long-term test (t = 0 h), pre-test measurements at 700 °C were carried out to obtain
the iV curves in both fuel cell and electrolysis modes, as well as impedance spectra at OCV.
The iV curves measured in fuel cell mode with Dtot,SOFC 9 is shown in Fig. 4.6a while the one
taken in electrolysis mode with Dtot,SOEC 9 is shown in Fig. 4.6b. The OCV can be calculated
from the Nernst equation (Eq. 1.3-1.5 in §1.2.2). Based on the literature, the standard voltage
of the cell, 𝐸0𝑐𝑒𝑙𝑙, is 1.01 V at 700 °C [96]. By considering the partial pressure of the gases
involved, the calculated OCV is around 1.12 V and 0.90 V for fuel cell and electrolysis
conditions, respectively. Thus, from the iV curves, the cell voltage at OCV is close to the
theoretical value indicating that the gas tightness of both electrode compartments is ensured.
The current density in fuel cell mode is 0.22 A cm-2 at 0.6 V, whereas it is -0.24 A cm-2 at 1.3
V in the electrolysis mode. These obtained values show a rather poor performance since the
current density is normally found between 3-4 times larger than these values [44], [97].
Fig. 4. 6 The iV curve of CCell 1 at 700 °C taken at various times during the test for (a) fuel
cell operation with Dtot,SOFC 9 and (b) electrolysis operation with Dtot,SOEC 9.
-0.4 -0.3 -0.2 -0.1 0.0
0.8
0.9
1.0
1.1
1.2
1.3
1.4
1.5
700 °C, Dtot,SOEC
= 9 Nl/h
t = 0 h
t = 168 h
t = 480 h
t = 900 h
SOEC_H2=1.46Nl/h_O2=0.66Nl/h_Air=6.78Nl/h_t=0h
SOEC_H2=1.46Nl/h_O2=0.66Nl/h_Air=6.78Nl/h_t=168h
SOEC_H2=1.46Nl/h_O2=0.66Nl/h_Air=6.78Nl/h_t=480h
SOEC_H2=1.46Nl/h_O2=0.66Nl/h_Air=6.78Nl/h_t=900h
Cel
l volt
age
(V)
Current Density (A cm-2)
0.00 0.05 0.10 0.15 0.20 0.25 0.30 0.35
0.6
0.7
0.8
0.9
1.0
1.1
1.2
SOFC_H2=2.26Nl/h_Air=6.78Nl/h_t=0h
SOFC_H2=2.26Nl/h_Air=6.78Nl/h_t=960h
SOFC_H2=2.26Nl/h_Air=6.78Nl/h_t=0h
SOFC_H2=2.26Nl/h_Air=6.78Nl/h_t=960h
Current Density (A cm-2)
Cel
l volt
age
(V)
-0.02
0.00
0.02
0.04
0.06
0.08
0.10
0.12
0.14
0.16
0.18
0.20
Pow
er den
sity (W
cm-2)
(b)(a)
t = 900 ht = 0 h
700 °C, Dtot,SOFC = 9 Nl/h

Chapter 4: Durability Study on the Symmetrical and Complete Cells
104
The initial EIS measurements on the pristine cell before aging are given in Fig. 4.7a-b. The
deconvolution shows that the impedance spectra for a complete cell consist of several
contributions that overlap with each other, thus the analysis is rather complicated. The
contribution of the hydrogen electrode can be separated into three processes: gas conversion
along the cell length and gas diffusion at low frequency, and charge transfer process at TPB
spreading from medium to high frequency [98]. In addition to the gas conversion and diffusion
(which are limited in this case due to the high air flow rate and the thin electrode), the main
contributions for the oxygen electrode consist of the reactions on the bulk electrode arising at
low to medium frequency and ionic transfer at LPNO electrode/GDC barrier layer interface at
medium to high frequency. The EIS measurements were carried out with two different total
gas flow rates: Dtot,SOEC 9 and Dtot,SOEC 20. The responses are found to be identical at high to
medium frequency, but the contribution of the low-frequency process(es) diminish(es) for the
higher gas flux. As mentioned previously, the low frequency is mainly assigned to process-
related especially to gas conversion and diffusion on the hydrogen electrode side. Since the
same current density is applied to both measurements, it can be concluded that the higher flow
rate at Dtot,SOEC 20 allows decreasing the electrode gas supply overpotentials which are rather
significant at a lower flow rate (Dtot,SOEC 9).
Fig. 4. 7 The Nyquist and Bode plots of CCell 1 at 700 °C taken at OCV before the long-term
test (t = 0 h) for Dtot,SOEC 9 and Dtot,SOEC 20. The numbers indicate the logarithm of the
measuring frequency.
The long-term test was then carried out to the cell at 700 °C for 900 h in electrolysis mode by
applying an anodic current of -0.2 A cm-2. The gas flux during operation is Dtot,SOEC 9. The
evolution of cell voltage over time is shown in Fig. 4.8. The initial cell voltage is 1.25 V. As
seen on the symmetrical cell operated as fuel cell (Fig. 4.3), there is also a significant decrease
in the cell voltage in the first 50 hours of the test indicating an improvement on the cell
0.8 1.0 1.2 1.4 1.6 1.8 2.0 2.2 2.4 2.6 2.8 3.00.0
0.1
0.2
0.3
0.4
700 °C, OCV, t = 0 h
Dtot,SOEC
= 9 Nl/h
Dtot,SOEC
= 20 Nl/h
-Im
[Z]
( c
m2)
Re[Z] ( cm2)
OCV_H2=1.46Nl/h_O2=0.66Nl/h_Air=6.78Nl/h_Galv10mA_t=0h
OCV_H2=4.52Nl/h_O2=2.03Nl/h_Air=13.56Nl/h_Galv10mA_t=0h
10-2
10-1
100
101
102
103
104
0.0
0.1
0.2
0.3
0.4 700 °C, OCV, t = 0 h
Dtot,SOEC
= 9 Nl/h
Dtot,SOEC
= 20 Nl/h
-Im
[Z]
( c
m2)
Frequency (Hz)
OCV_H2=1.46Nl/h_O2=0.66Nl/h_Air=6.78Nl/h_Galv10mA_t=0h
OCV_H2=4.52Nl/h_O2=2.03Nl/h_Air=13.56Nl/h_Galv10mA_t=0h
(a) (b)
-1
-20
12
3
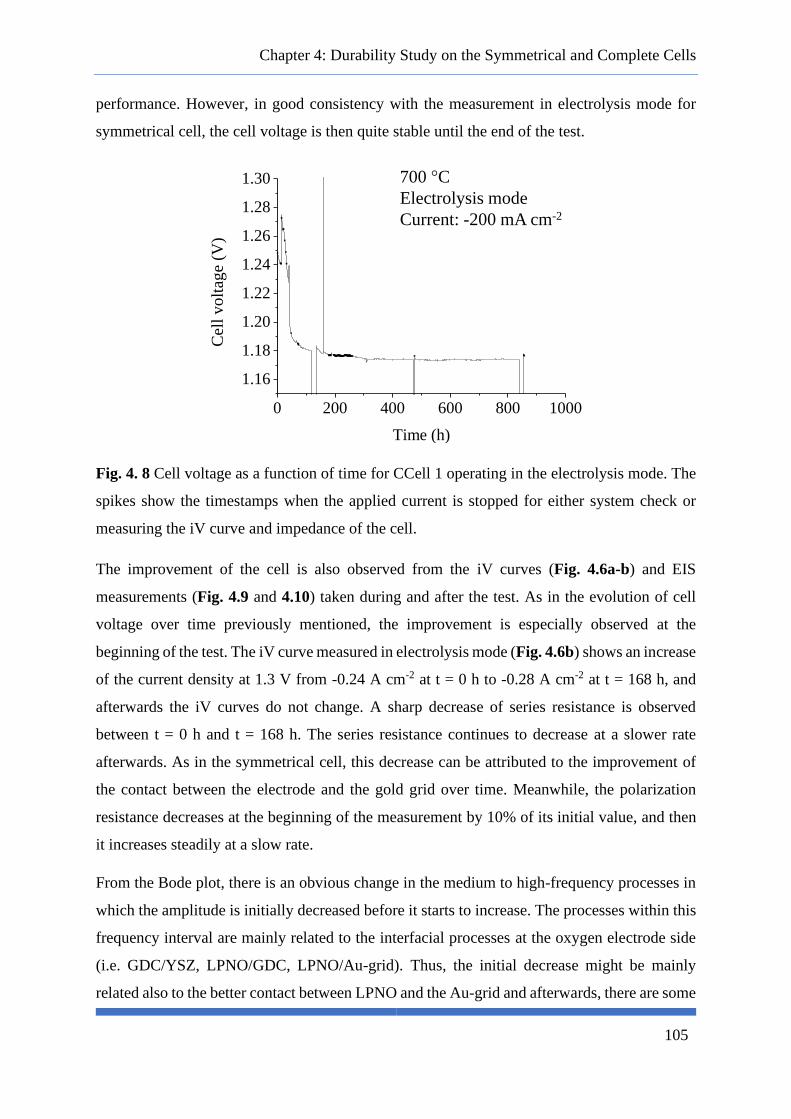
Chapter 4: Durability Study on the Symmetrical and Complete Cells
105
performance. However, in good consistency with the measurement in electrolysis mode for
symmetrical cell, the cell voltage is then quite stable until the end of the test.
Fig. 4. 8 Cell voltage as a function of time for CCell 1 operating in the electrolysis mode. The
spikes show the timestamps when the applied current is stopped for either system check or
measuring the iV curve and impedance of the cell.
The improvement of the cell is also observed from the iV curves (Fig. 4.6a-b) and EIS
measurements (Fig. 4.9 and 4.10) taken during and after the test. As in the evolution of cell
voltage over time previously mentioned, the improvement is especially observed at the
beginning of the test. The iV curve measured in electrolysis mode (Fig. 4.6b) shows an increase
of the current density at 1.3 V from -0.24 A cm-2 at t = 0 h to -0.28 A cm-2 at t = 168 h, and
afterwards the iV curves do not change. A sharp decrease of series resistance is observed
between t = 0 h and t = 168 h. The series resistance continues to decrease at a slower rate
afterwards. As in the symmetrical cell, this decrease can be attributed to the improvement of
the contact between the electrode and the gold grid over time. Meanwhile, the polarization
resistance decreases at the beginning of the measurement by 10% of its initial value, and then
it increases steadily at a slow rate.
From the Bode plot, there is an obvious change in the medium to high-frequency processes in
which the amplitude is initially decreased before it starts to increase. The processes within this
frequency interval are mainly related to the interfacial processes at the oxygen electrode side
(i.e. GDC/YSZ, LPNO/GDC, LPNO/Au-grid). Thus, the initial decrease might be mainly
related also to the better contact between LPNO and the Au-grid and afterwards, there are some
0 200 400 600 800 1000
1.16
1.18
1.20
1.22
1.24
1.26
1.28
1.30
Cel
l v
olt
age
(V)
Time (h)
700 °C
Electrolysis mode
Current: -200 mA cm-2

Chapter 4: Durability Study on the Symmetrical and Complete Cells
106
changes in the other interfaces which induce the slight increase of this contribution.
Nevertheless, the processes on the bulk electrodes seem to not be affected by the operation in
the electrolysis mode. For example, the polarization resistance and all the contributions in the
Nyquist plot (Fig. 4.9) remain almost unchanged from 168 h to 960 h. This observation
indicates that the response of the cell component including the oxygen electrode is not
significantly impacted by the operation in the electrolysis mode. This statement is in perfect
line with the stability of the electrode of the symmetrical cell when operated under anodic
current.
Fig. 4. 9 The Nyquist and Bode plots of CCell 1 at 700 °C taken at OCV before, during, and
after the long-term test for Dtot,SOEC 9. The numbers indicate the logarithm of the measuring
frequency.
Fig. 4. 10 (a) The series resistance (Rs) and (b) the polarization resistance (Rpol) measured at
various times during the long-term test of CCell 1.
4.3.2 Preliminary test on CCell 2: GDC barrier layer by RF magnetron sputtering
The pre-test measurements of CCell 1 detailed in §4.3.1 show rather poor performance. Since
the oxygen electrode performance has been found to be quite interesting in the symmetrical
0.8 1.0 1.2 1.4 1.6 1.8 2.0 2.2 2.4 2.6 2.8 3.00.0
0.1
0.2
0.3
0.4
700 °C, OCV
Dtot,SOEC
= 9 Nl/h
t = 0 h
t = 168 h
t = 480 h
t = 900 h
-Im
[Z]
( c
m2)
Re[Z] ( cm2)
OCV_H2=1.46Nl/h_O2=0.66Nl/h_Air=6.78Nl/h_Galv10mA_t=0h
OCV_H2=1.46Nl/h_O2=0.66Nl/h_Air=6.78Nl/h_Galv10mA_t=168h
OCV_H2=1.46Nl/h_O2=0.66Nl/h_Air=6.78Nl/h_Galv10mA_t=480h
OCV_H2=1.46Nl/h_O2=0.66Nl/h_Air=6.78Nl/h_Galv10mA_t=900h
10-2
10-1
100
101
102
103
104
0.0
0.1
0.2
0.3
0.4 700 °C, OCV, Dtot,SOEC
= 9 Nl/h
t = 0 h
t = 168 h
t = 480 h
t = 960 h
-Im
[Z]
( c
m2)
Frequency (Hz)
OCV_H2=1.46Nl/h_O2=0.66Nl/h_Air=6.78Nl/h_Galv10mA_t=0h
OCV_H2=1.46Nl/h_O2=0.66Nl/h_Air=6.78Nl/h_Galv10mA_t=168h
OCV_H2=1.46Nl/h_O2=0.66Nl/h_Air=6.78Nl/h_Galv10mA_t=480h
OCV_H2=1.46Nl/h_O2=0.66Nl/h_Air=6.78Nl/h_Galv10mA_t=960h
(a) (b)
-1
-20
1
2
3
0 200 400 600 800 10000.8
0.9
1.0
1.1
1.2
1.3
700 °C, OCV
Dtot,SOEC
= 9 Nl/h
Dtot,SOEC
= 20 Nl/h
Ser
ies
resi
stan
ce (
c
m2)
t (h) OCV_H2=1.46Nl/h_O2=0.66Nl/h_Air=6.78Nl/h_Galv10mA
OCV_H2=4.52Nl/h_O2=2.03Nl/h_Air=13.56Nl/h_Galv10mA
0 200 400 600 800 1000
1.0
1.1
1.2
1.3
1.4
1.5
1.6
700 °C, OCP
Dtot,SOEC
= 9 Nl/h
Dtot,SOEC
= 20 Nl/h
Pola
riza
tio
n r
esis
tan
ce (
c
m2)
t (h) OCV_H2=1.46Nl/h_O2=0.66Nl/h_Air=6.78Nl/h_Galv10mA
OCV_H2=4.52Nl/h_O2=2.03Nl/h_Air=13.56Nl/h_Galv10mA
(a) (b)
0 200 400 600 800 10000.8
0.9
1.0
1.1
1.2
1.3
700 °C, OCV
Dtot,SOEC
= 9 Nl/h
Dtot,SOEC
= 20 Nl/h
Ser
ies
resi
stan
ce (
c
m2)
t (h) OCV_H2=1.46Nl/h_O2=0.66Nl/h_Air=6.78Nl/h_Galv10mA
OCV_H2=4.52Nl/h_O2=2.03Nl/h_Air=13.56Nl/h_Galv10mA

Chapter 4: Durability Study on the Symmetrical and Complete Cells
107
cell, it is suspected that the origin of the poor initial performance of CCell 1 comes from the
quality of the GDC barrier layer. Indeed, the GDC layer deposited by screen printing is quite
thick (4 μm-thick) and porous which may induce a large ohmic resistance. More importantly,
the contact between the porous and coarse microstructure of the barrier layer and the fine
microstructure of the ESD LPNO electrode could be very poor. This non-optimal interface
could thus induce a limitation on the ionic transfer at the GDC/LPNO interface (that was not
present for the symmetrical cell as the electrode was layered on a fully dense GDC electrolyte).
Thus, to check this assumption and overcome this difficulty, a second complete cell, CCell 2,
is prepared, in which the barrier layer is deposited by RF magnetron sputtering. The layer is
found to be dense and very thin (400 nm) [49].
The comparison of the initial measurements between CCell 1 and CCell 2 is presented in the
iV curves (Fig. 4.11a-b) and the impedance spectra (Fig. 4.12a-b). The OCV of CCell 2 is
found to be close to the theoretical values indicating gas tightness of the test setup. It is clear
to see also that the current density of CCell 2 in both fuel cell and electrolysis modes is
improved by the factor of two as compared to CCell 1. From the Nyquist plots, the series
resistance of CCell 2 is lower than CCell 1. Since the load applied on both cells are the same,
it can be said that the contact between LPNO and the grid is similar, thus this smaller value
might be attributed to the thinner GDC barrier layer of CCell 2. The impedance response
between the two cells is also quite different, especially at the medium frequency range. Indeed,
the contribution at medium frequency has been drastically reduced for the CCell 2 compared
to CCell1. This observation tends to validate our assumption of poor contact between LPNO
and GDC for CCcell 1. However, further investigations are still needed to fully validate this
hypothesis.

Chapter 4: Durability Study on the Symmetrical and Complete Cells
108
Fig. 4. 11 The iV curve of CCell 1 and CCell 2 at 700 °C taken before the long-term test for
(a) fuel cell operation with Dtot,SOFC 9 and (b) electrolysis operation with Dtot,SOEC 9.
Fig. 4. 12 The Nyquist and Bode plots of CCell 1 and CCell 2 at 700 °C taken at OCV before,
and during the long-term test for Dtot,SOEC 9. The numbers indicate the logarithm of the
measuring frequency.
4.4 Summary and conclusions
In this chapter, the durability behavior of the LPNO double-layer electrode has been
investigated. For this purpose, a long-term test has been carried out in galvanostatic mode at
±300 mA cm-2 using a symmetrical cell with a three-electrode setup configuration. This
experiment was complemented by a preliminary work at the complete cell level with a first
long term test performed in electrolysis mode at -200 mA cm-2.
The test on symmetrical cell, SCell, was carried out at 700 °C for 960 h on both fuel cell and
electrolysis modes. The pre-test measurements confirmed the good symmetry between the two
electrodes and the reference. The post-test measurements after the durability experiment have
shown that the polarization resistance (Rpol) of the electrode did not change after the test in
-0.5 -0.4 -0.3 -0.2 -0.1 0.0
0.8
0.9
1.0
1.1
1.2
1.3
1.4
1.5
700 °C, t = 0 h
Dtot,SOEC
= 9 Nl/h
CCell 1
CCell 2
SOEC_H2=1.46Nl/h_O2=0.66Nl/h_Air=6.78Nl/h_t=0h
SOEC_H2=1.46Nl/h_O2=0.66Nl/h_Air=6.78Nl/h_t=0h
Cel
l volt
age
(V)
Current Density (A cm-2)
0.0 0.1 0.2 0.3 0.4 0.5
0.6
0.7
0.8
0.9
1.0
1.1
1.2
SOFC_H2=2.26Nl/h_Air=6.78Nl/h_t=0h
SOFC_H2=2.26Nl/h_Air=6.78Nl/h_t=0h
SOFC_H2=2.26Nl/h_Air=6.78Nl/h_t=0h
SOFC_H2=2.26Nl/h_Air=6.78Nl/h_t=0h
Current Density (A cm-2)
Cel
l volt
age
(V)
0.00
0.05
0.10
0.15
0.20
0.25
0.30
Pow
er den
sity (W
cm-2)
(a) (b)
CCell 2
CCell 1
700 °C, Dtot,SOFC = 9 Nl/h
0.0 0.5 1.0 1.5 2.0 2.5 3.00.0
0.1
0.2
0.3
0.4
0.5
0.6
0.7
700 °C, OCV, Dtot,SOEC
9 Nl/h
CCell 1, t = 0 h
CCell 2, t = 0 h
CCell 2, t = 236 h
-Im
[Z]
( c
m2)
Re[Z] ( cm2)
OCV_H2=1.46Nl/h_O2=0.66Nl/h_Air=6.78Nl/h_Galv10mA_t=0h
OCV_H2=1.46Nl/h_O2=0.66Nl/h_Air=6.78Nl/h_Galv10mA_t=0h
OCV_H2=1.46Nl/h_O2=0.66Nl/h_Air=6.78Nl/h_Galv10mA_TA60h
OCV_H2=1.46Nl/h_O2=0.66Nl/h_Air=6.78Nl/h_Galv10mA_t=236h
10-2
10-1
100
101
102
103
104
0.00.10.20.30.40.50.60.7
-Im
[Z]
( c
m2)
Frequency (Hz)
OCV_H2=1.46Nl/h_O2=0.66Nl/h_Air=6.78Nl/h_Galv10mA_t=0h
OCV_H2=1.46Nl/h_O2=0.66Nl/h_Air=6.78Nl/h_Galv10mA_t=0h
OCV_H2=1.46Nl/h_O2=0.66Nl/h_Air=6.78Nl/h_Galv10mA_TA60h
OCV_H2=1.46Nl/h_O2=0.66Nl/h_Air=6.78Nl/h_Galv10mA_t=236h
(a) (b)
-10
123
-1
-201
2
3-1
0
1
2
3 -2

Chapter 4: Durability Study on the Symmetrical and Complete Cells
109
electrolysis mode while a significant increase was observed under fuel cell mode. The
degradation rate in fuel cell mode was 219 mV kh-1 (15.5 V% kh-1) or 607 mΩ cm2 kh-1 (162.49
Ω% kh-1) while in electrolysis mode was 7.28 mΩ cm2 kh-1 (1.55 Ω% kh-1).
Following the test on the symmetrical cell, preliminary long-term test on a complete cell was
carried out at 700 °C in electrolysis mode by applying an anodic current of -200 mA cm-2. The
complete cell, CCell 1, was prepared by depositing the O2 electrode on a 4 μm-thick and porous
screen-printed GDC barrier layer. The pre-test measurements have shown a rather poor
performance of the cell. However, CCell 1 was found to be quite electrochemically stable after
operation for 900 h as indicated by an improvement at the beginning of the test followed by a
stable performance which is in agreement with the results on the symmetrical cell operated in
the electrolysis mode.
The initial poor performance measured on CCell 1 was suspected to be caused by the thick and
porous GDC barrier layer. As a preliminary work to investigate this issue, a second complete
cell, CCell 2, was prepared in which the dense, 400 nm-thick GDC barrier layer was deposited
by RF magnetron sputtering. The iV curves taken before the long-term test have shown that
the current densities of CCell 2 on both fuel cell and electrolysis modes doubled the values
obtained for CCell 1 indicating a better cell performance.
A deeper investigation to explain the behaviors of the two selected cells (SCell and CCell 1)
will be given in Chapter 5.

110
CHAPTER 5: POST-MORTEM
STRUCTURAL AND
MICROSTRUCTURAL
CHARACTERIZATIONS
This last chapter is dedicated to the post-mortem analysis of the samples after durability tests.
The chapter is divided into two sub-chapters: (i) microstructural characterizations by SEM and
FIB-SEM and (ii) structural characterizations by XRD, µ-XRD, and µ-XRF. A comparison
between the aged samples and the pristine electrode is also performed here. Large parts of this
chapter have been published in the Journal of Power Sources
(https://doi.org/10.1016/j.jpowsour.2020.227724).

Chapter 5: Post-Mortem Structural and Microstructural Characterizations
111
5.1 Introduction
In Chapter 4, durability experiments have been carried out on symmetrical and complete cells
to investigate the degradation of LPNO as an oxygen electrode for both SOFC and SOEC
operating modes. Several hypotheses have also been proposed to explain the results. To go
further in the analysis, several post-mortem microstructural and structural characterizations,
which are described in this chapter, have been conducted on the pristine and aged LPNO
electrodes.
The microstructure was characterized by SEM (§2.3.1) and FIB-SEM tomography (§2.3.2).
The latter technique allows obtaining the 3D reconstruction of the analyzed electrode from
which various microstructural properties can be obtained from numerical modeling. For
structural characterization, laboratory XRD (§2.4.1) and synchrotron-based μ-XRD and μ-XRF
(§2.4.2) were used. The synchrotron-based X-ray was carried out in a beamline in Swiss Light
Source (SLS), Paul Scherrer Institut (PSI), Switzerland. This technique enables a depth
profiling of elements and phases in the prepared lamella. It is a very useful technique especially
for multi-layer samples such as the double-layer electrode used in this study. Thanks to the fine
resolution, the elements and phases distribution can be observed separately between the ESD
and SP layers, thus enable an analysis of the effect of the microstructure to the destabilization
of the LPNO electrode in operation.
In complementarity with the cells that have been mentioned in Chapter 4 (SCell and CCell 1),
two other cells are also characterized for comparison purposes. The two samples are a pristine
double-layer electrode deposited on GDC electrolyte and a thermally-aged single-layer ESD
which is also deposited on GDC electrolyte. No further treatments or tests are carried out on
the pristine cell after the fabrication, and this cell will be used as a reference for the other results.
The thermally-aged cell was subjected to a heat treatment in air at 700 °C for 1000h.
The list of the samples, their treatments, and the summary of the results are given in Table 5.1.
Six samples are listed: sample 1 is the pristine cell, sample 2 is the thermally-aged cell, sample
3 is the anodic side of the symmetrical cell (SCell-anodic from Chapter 4), sample 4 is the
anodically-aged complete cell with screen-printed GDC barrier layer (CCell 1 from Chapter 4),
and sample 5 is the cathodic side of the symmetrical cell (SCell-cathodic from Chapter 4). All
samples were observed by SEM, but only samples 1 and 3 were characterized by FIB-SEM

Chapter 5: Post-Mortem Structural and Microstructural Characterizations
112
tomography. Only samples 1-4 were characterized in PSI. The structural characterization of
sample 5 was carried out by laboratory XRD.

Chapter 5: Post-Mortem Structural and Microstructural Characterizations
113
Table 5. 1 The list of samples and the summary of the characterization results.
Pristine electrode
(reference)
Thermally-aged
electrode
Long-term test in electrolysis mode Long-term test in fuel
cell mode
Samples Sample 1 Sample 2 Sample 3 (SCell-
anodic)
Sample 4 (CCell 1) Sample 5 (SCell-
cathodic)
Configuration DL on GDC electrolyte SL ESD on GDC
electrolyte
DL on GDC electrolyte DL on half-cell
GDC/YSZ/Ni-YSZ
DL on GDC electrolyte
GDC barrier layer N/A N/A N/A Deposited by SP,
4 μm-thick
N/A
Treatment N/A (as-prepared
sample)
700 °C, 1000 h in air 700 °C, 960 h in air, at
+300 mA cm-2
700 °C, 900 h in 90/10
H2O/H2, at +200 mA cm-2
700 °C, 960 h in air, at
-300 mA cm-2
Microstructures No delamination No delamination No delamination No delamination Delamination of LPNO
electrode from GDC
electrolyte
Lab XRD ESD layer LPNO + (LP)3N2 Not available (N/A) N/A N/A Bulk electrode:
LPNO + (LP)3N2 +
Pr6O11 + (LP)4N3 SP layer LPNO N/A N/A N/A
µ-XRD and
µ-XRF
ESD layer LPNO + (LP)3N2 +
Pr6O11
LPNO + (LP)3N2 +
Pr6O11
LPNO + (LP)3N2 +
Pr6O11 + (LP)4N3
LPNO + (LP)3N2 +
Pr6O11 + (LP)4N3
N/A
SP layer LPNO + Pr6O11 N/A LPNO + (LP)3N2 +
Pr6O11 + (LP)4N3
LPNO + (LP)3N2 +
Pr6O11 + (LP)4N3
N/A

Chapter 5: Post-Mortem Structural and Microstructural Characterizations
114
5.2 Post-mortem microstructural characterization: SEM and 3D reconstruction by FIB-
SEM
5.2.1 Characterization of the samples operated in the electrolysis mode
The SEM images of the pristine electrode (sample 1), as well as the anodically-aged electrodes
in the symmetrical and complete cell configurations (sample 3 or SCell-anodic and sample 4
or CCell 1), can be viewed in Fig. 5.1a-c, respectively. The 3D rendering volumes for the
reconstructions of the pristine cell (sample 1) and anodic side of the symmetrical cell (sample
3) are shown in Fig. 5.2a-b.
Fig. 5. 1 The cross-section SEM images of (a) pristine cell (sample 1), (b) anodically-aged
symmetrical cell (sample 3 or SCell-anodic), (c) anodically-aged complete cell (sample 4 or
CCell 1), and (d) cathodically-aged symmetrical cell (sample 5 or SCell-cathodic). The dashed
white line indicates the LPNO electrode/electrolyte interface. The surface of sample 4 is
slightly damaged during the removal of the cells from the test bench after electrolysis operation
by sandblasting.
2 µm
20 μm
2 µm
(a)
2 µm
2 µm
GDC barrier
layer
8YSZ
electrolyte
Ni-YSZ
electrode
(b)
(c) (d)

Chapter 5: Post-Mortem Structural and Microstructural Characterizations
115
Fig. 5. 2 The 3D reconstruction visualization of (a) pristine cell (sample 1) and (b) anodically-
aged symmetrical cell (sample 3 or SCell-anodic).
From the visual inspection of the SEM images and the 3D reconstructions, no striking
microstructure changes can be detected before and after the long-term testing for samples 1, 3,
and 4. In addition, good adhesion of the LPNO electrode on the GDC electrolyte is preserved
after the anodic aging for both the symmetrical cell (Fig. 5.1b) and complete cell (Fig. 5.1c)
configuration. To go further in the analysis and to validate these preliminary observations, the
microstructural properties of both sample 1 and sample 3, are then computed from the 3D
reconstructions. The data in terms of volume fraction, mean particle diameter of the LPNO
phase, specific surface area, and tortuosity factor of the gas phase are given in Table 5.2. After
the long-term test in the electrolysis mode, the porosity in the electrode is almost identical with
the fresh sample and there is no obvious particle growth. These statements mean that there is
no sign of layer densification. Only a minor decrease in the specific surface area is found. This
evolution can be explained by the first stage of the material sintering that occurs at a very low
rate. Finally, it can be mentioned that the tortuosity factor is not affected by the operation. All
these results indicate that the microstructure is not significantly changed upon operation, which
is consistent with the stability of the electrode performance in the electrolysis mode (see §4.2
and §4.3.1).
(b)
19.0 μm
(a)
32.2 μm

Chapter 5: Post-Mortem Structural and Microstructural Characterizations
116
Table 5. 2 The values of several microstructural properties of the pristine cell and anodic side
of the symmetrical cell calculated based on the 3D reconstruction by FIB-SEM.
Porosity (%) Mean particle diameter
(µm)
Specific surface area
(µm2/ µm3)
Tortuosity factor
(-)
Sample 1 59.02 0.22 1.86 1.69
Sample 3 63.06 0.18 1.70 1.49
5.2.2 Characterization of the sample operated in fuel cell mode
In contrast to the sample operated in the electrolysis mode, severe delamination of the LPNO
electrode appears at the GDC interface after the operation in fuel cell mode (sample 6 or SCell-
cathodic) as shown in Fig. 5.1d. It can be mentioned that this electrode detachment cannot be
due to an artifact coming from the sample preparation for the SEM observations. Indeed, using
the same protocol, no delamination was observed for the electrode operated in the electrolysis
mode. Moreover, the cross-section has been also milled in sample 5 using the plasma-FIB and
the observations have also revealed interfacial cracks along the electrode/electrolyte interface.
The electrode detachment for operation in fuel cell mode could be caused by the formation of
phase(s) close to the electrolyte interface with expansion/contraction that could trigger the
debonding. To justify this hypothesis, further structural characterization of the cathodic side
will be discussed in §5.3.4. Nevertheless, it can be pointed out that the significant increase of
the Rpol for the sample aged in fuel cell mode must be largely attributed to the electrode
delamination.
5.3 Post-mortem structural characterization: synchrotron-based µ-XRD and µ-XRF
As explained in §2.4.2, characterization by synchrotron-based X-ray required a very thin
sample or lamella. The SEM micrographs of the prepared lamella for samples 1-4 are shown
in Fig. 5.3a-d. It is reminded here that the lamella preparations have been performed in
collaboration with Federico Monaco (a PhD student at the laboratory).
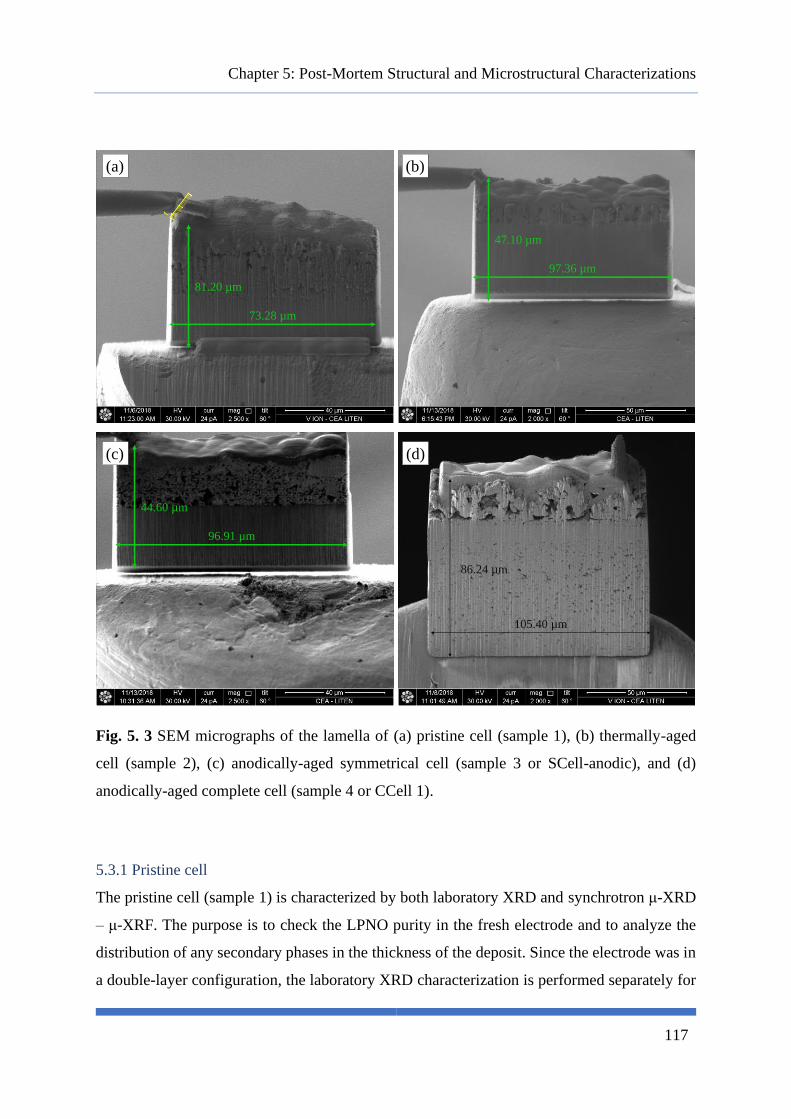
Chapter 5: Post-Mortem Structural and Microstructural Characterizations
117
Fig. 5. 3 SEM micrographs of the lamella of (a) pristine cell (sample 1), (b) thermally-aged
cell (sample 2), (c) anodically-aged symmetrical cell (sample 3 or SCell-anodic), and (d)
anodically-aged complete cell (sample 4 or CCell 1).
5.3.1 Pristine cell
The pristine cell (sample 1) is characterized by both laboratory XRD and synchrotron μ-XRD
– μ-XRF. The purpose is to check the LPNO purity in the fresh electrode and to analyze the
distribution of any secondary phases in the thickness of the deposit. Since the electrode was in
a double-layer configuration, the laboratory XRD characterization is performed separately for
73.28 µm
81.20 µm
97.36 µm
47.10 µm
96.91 µm
44.60 µm
105.40 µm
86.24 µm
(a) (b)
(c) (d)
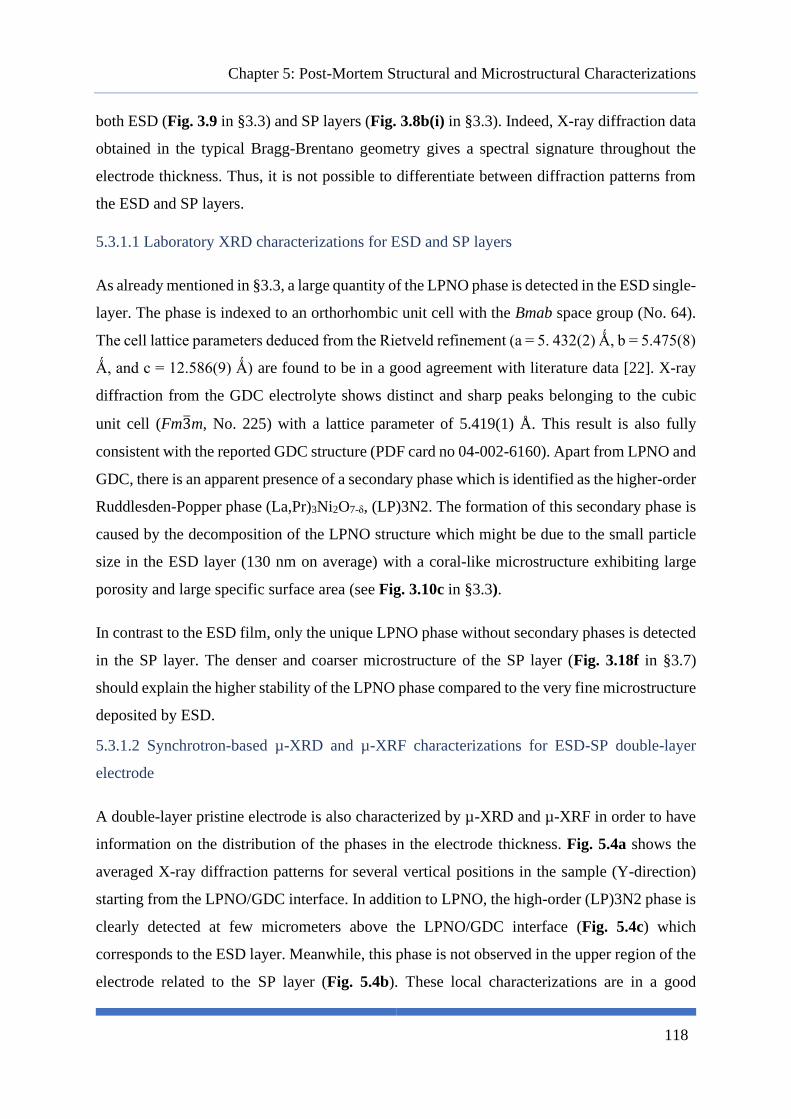
Chapter 5: Post-Mortem Structural and Microstructural Characterizations
118
both ESD (Fig. 3.9 in §3.3) and SP layers (Fig. 3.8b(i) in §3.3). Indeed, X-ray diffraction data
obtained in the typical Bragg-Brentano geometry gives a spectral signature throughout the
electrode thickness. Thus, it is not possible to differentiate between diffraction patterns from
the ESD and SP layers.
5.3.1.1 Laboratory XRD characterizations for ESD and SP layers
As already mentioned in §3.3, a large quantity of the LPNO phase is detected in the ESD single-
layer. The phase is indexed to an orthorhombic unit cell with the Bmab space group (No. 64).
The cell lattice parameters deduced from the Rietveld refinement (a = 5. 432(2) Ǻ, b = 5.475(8)
Ǻ, and c = 12.586(9) Ǻ) are found to be in a good agreement with literature data [22]. X-ray
diffraction from the GDC electrolyte shows distinct and sharp peaks belonging to the cubic
unit cell (Fm3̅m, No. 225) with a lattice parameter of 5.419(1) Å. This result is also fully
consistent with the reported GDC structure (PDF card no 04-002-6160). Apart from LPNO and
GDC, there is an apparent presence of a secondary phase which is identified as the higher-order
Ruddlesden-Popper phase (La,Pr)3Ni2O7-δ, (LP)3N2. The formation of this secondary phase is
caused by the decomposition of the LPNO structure which might be due to the small particle
size in the ESD layer (130 nm on average) with a coral-like microstructure exhibiting large
porosity and large specific surface area (see Fig. 3.10c in §3.3).
In contrast to the ESD film, only the unique LPNO phase without secondary phases is detected
in the SP layer. The denser and coarser microstructure of the SP layer (Fig. 3.18f in §3.7)
should explain the higher stability of the LPNO phase compared to the very fine microstructure
deposited by ESD.
5.3.1.2 Synchrotron-based µ-XRD and µ-XRF characterizations for ESD-SP double-layer
electrode
A double-layer pristine electrode is also characterized by µ-XRD and µ-XRF in order to have
information on the distribution of the phases in the electrode thickness. Fig. 5.4a shows the
averaged X-ray diffraction patterns for several vertical positions in the sample (Y-direction)
starting from the LPNO/GDC interface. In addition to LPNO, the high-order (LP)3N2 phase is
clearly detected at few micrometers above the LPNO/GDC interface (Fig. 5.4c) which
corresponds to the ESD layer. Meanwhile, this phase is not observed in the upper region of the
electrode related to the SP layer (Fig. 5.4b). These local characterizations are in a good

Chapter 5: Post-Mortem Structural and Microstructural Characterizations
119
agreement with the result from the laboratory XRD described previously. However, the
presence of a supplementary phase, which is not detected by the laboratory XRD, is observed
all over the electrode thickness. From the peak refinement (Fig. 5.4b-c), this phase is identified
as Pr6O11. There are two main possibilities to explain the detection of this phase only in the
synchrotron μ-XRD pattern. The presence of this new phase could be due to a decomposition
of the electrode material during the preparation of the lamella. However, this explanation is
rather unlikely since there was no clear evidence that the lamella preparation could induce the
decomposition of LPNO (from previous experiments in our group [71]). Alternatively, it is
worth noting that the peak intensities corresponding to this phase are very small in such a way
that they could be concealed by the peaks of another phase(s) in the laboratory XRD pattern.
Indeed, the main Pr6O11 peak (2θ angle of 12.98° by synchrotron beam or 27.98° by Cu-Kα
beam) is located very close to GDC peak (2θ angle of 13.22° by synchrotron beam or 28.51°
by Cu-Kα beam). Therefore, with the laboratory XRD, the Pr6O11 peak could be completely
convoluted by the strong peak intensity coming from the GDC electrolyte.
It can be noticed that Pr6O11 is also an MIEC compound with a very high electronic and ionic
conductivity through the electron hopping between the mixed metal oxidation state and high
oxygen mobility due to the large concentration of ordered oxygen vacancies [99]–[101]. A
previous study has also shown that this material exhibits a very high electrochemical activity
for oxygen oxidation/reduction [62]. Thus, albeit unexpected, the presence of Pr6O11 in the two
layers of the electrode must promote the electrochemical processes. Therefore, the electrode
performances could be improved or at least not impacted by the formation of this secondary
phase.
The 2D XRD and XRF maps show the distribution of both crystallographic phases and
chemical elements in the whole electrode cross-section (Fig. 5.5a and 5.6a). The visualization
inspection confirms that the formation of high order phase (LP)3N2 is restricted to the ESD
layer whereas the praseodymium oxide Pr6O11 is found on both layers of the electrode. Finally,
the observation all along the electrode/electrolyte interface reveals no sign of reactivity
between LPNO and GDC.

Chapter 5: Post-Mortem Structural and Microstructural Characterizations
120
Fig. 5. 4 (a) The average XRD patterns on several Y-positions and (b)-(c) refinement of the
peaks at two different Y-positions, i. e. 18 and 4 μm above the electrode/GDC, respectively,
for the pristine cell (sample 1).
10 15 20 13 14 15
Inte
nsi
ty (
a.u
.)
2 synchrotron (°)
Experimental data
Fitted data
GDC
LPNO
(LP)3N2
Pr6O
11
20 30 40 50
2, Cu-K (°)
28 30 32
(b)
(c)
10 15 20 13 14 15
Inte
nsi
ty (
a.u.)
2 synchrotron (°)
Experimental data
Fitted data
GDC
LPNO
(LP)3N2
Pr6O
11
20 30 40 50
2, Cu-K (°)
28 30 32
(a)
*
o
= +
oo*
*
* * *+=
o GDC electrolyte
* LPNO
= (La,Pr)3Ni2O7-δ
+ Pr6O11
*
10 15 20 13 14 15
Inte
nsi
ty (
a.u.)
2 synchrotron (°)
Experimental data
Fitted data
GDC
LPNO
LP3N2
Pr6O
11
20 30 40 50
2, Cu-K (°)
28 30 32
10 15 20 13 14 15
Inte
nsi
ty (
a.u.)
2 synchrotron (°)
Experimental data
Fitted data
GDC
LPNO
LP3N2
Pr6O
11
20 30 40 50
2, Cu-K (°)
28 30 32
+15.5
+20.5
-2
+2
+4
+6
+18
Surface
GDC
electrolyte
µm
Interface

Chapter 5: Post-Mortem Structural and Microstructural Characterizations
121
Fig. 5. 5 2D maps of the XRD which shows the distribution of the phases, namely GDC, LPNO,
(LP)3N2, Pr6O11, and (LP)4N3, in (a) pristine cell (sample 1), (b) thermally-aged cell (sample
2), (c) anodically-aged symmetrical cell (sample 3 or SCell-anodic), and (d) anodically-aged
complete cell (sample 4 or CCell 1). The brighter color indicates the higher local intensity of
the corresponding compound.
GDC LPNO (LP)3N2 Pr6O11(a)
10 μm
GDCLPNO (LP)3N2
(b)Pr6O11 10 μm
(d) GDC LPNO (LP)3N2 Pr6O11(LP)4N3
10 μm
(c) GDC LPNO (LP)3N2 Pr6O11 (LP)4N3
10 μm

Chapter 5: Post-Mortem Structural and Microstructural Characterizations
122
Fig. 5. 6 2D maps of the XRF which shows the distribution of the elements, namely Ce, Gd,
La, Ni, Pr, and Pt, in (a) pristine cell (sample 1), (b) thermally-aged cell (sample 2), (c)
anodically-aged symmetrical cell (sample 3 or SCell-anodic), and (d) anodically-aged
complete cell (sample 4 or CCell 1). The brighter color indicates the higher local intensity of
the corresponding element.
5.3.2 Thermally-aged cell
The thermally-aged cell (sample 2) composed of a single ESD layer deposited on the GDC
electrolyte is annealed at 700 °C for 1000 h in air. This experiment is conducted only on the
ESD layer to check whether the small amount of secondary phases in the fresh material could
Ce
Gd
La
Ni
Pr
Pt
(b)Ce Gd
La Ni
Pr Pt
(a)
Ce Gd
La Ni
Pr Pt
(c) Ce Gd
La Ni
Pr Pt
(d)

Chapter 5: Post-Mortem Structural and Microstructural Characterizations
123
evolve and would have any impact on the thermal stability of the electrode. The synchrotron
μ-XRD characterizations (Fig. 5.7) reveal that the thermal aging does not induce the formation
of new phases as compared to the ESD layer of the pristine cell. As in the pristine cell, there is
also no indication of reactivity between the LPNO electrode and GDC electrolyte as evidently
shown in the 2D maps (Fig. 5.5b and 5.6b). However, from the phase quantification from the
μ-XRD fitting shown in Fig. 5.8a-b, it seems that the amount of both (LP)3N2 and, especially,
Pr6O11 slightly increases after the thermal aging. Therefore, although there are no new
decomposition products, the LPNO might slightly decompose into (LP)3N2 and Pr6O11 at
700°C under air.
Fig. 5. 7 (a) The average XRD patterns on several Y-positions and (b)-(c) refinement of the
peaks at two different Y-positions, i. e. 4.5 and 1.5 μm above the electrode/GDC interface,
respectively, for the thermally-aged cell (sample 2).
10 15 20 13 14 15
Inte
nsi
ty (
a.u
.)
2, synchrotron (°)
Experimental data
Fitted data
GDC
LPNO
(LP)3N2
Pr6O
11
20 30 40 50
2, Cu-K (°)28 30 32
(b)
(c)
10 15 20 13 14 15
Inte
nsi
ty (
a.u
.)
2, synchrotron (°)
Experimental data
Fitted data
GDC
LPNO
(LP)3N2
Pr6O
11
20 30 40 50
2, Cu-K (°)28 30 32
(a)
*o
= +o o* * * *
*+=
o GDC electrolyte
* LPNO
= (La,Pr)3Ni2O7-δ
+ Pr6O11*
10 15 20 13 14 15
Inte
nsi
ty (
a.u.)
2 synchrotron (°)
Experimental data
Fitted data
GDC
LPNO
LP3N2
Pr6O
11
20 30 40 50
2, Cu-K (°)
28 30 32
10 15 20 13 14 15
Inte
nsi
ty (
a.u.)
2 synchrotron (°)
Experimental data
Fitted data
GDC
LPNO
LP3N2
Pr6O
11
20 30 40 50
2, Cu-K (°)
28 30 32
+6
+1.5
+3
+4.5
Surface
GDC
electrolyte
µm
Interface

Chapter 5: Post-Mortem Structural and Microstructural Characterizations
124
Fig. 5. 8 The quantitative comparison of (LP)3N2, Pr6O11, and (LP)4N3 to LPNO in the
LPNO electrode as the function of distance from electrode/GDC interface for (a) pristine cell
(sample 1), (b) thermally-aged cell (sample 2), (c) anodically-aged symmetrical cell (sample 3
or SCell-anodic), and (d) anodically-aged complete cell (sample 4 or CCell 1).
5.3.3 Long-term test in electrolysis mode (anodic polarization): symmetrical and complete
cells
5.3.3.1 Anodic side of the symmetrical cell (sample 3 or SCell-anodic)
Thanks to the µ-XRD characterizations, a new phase is detected on the anodic side of the
symmetrical cell (sample 3 or SCell-anodic) after the durability experiment. As shown in Fig.
5.5c and 5.9a-c, this new phase is found to appear on both ESD and SP layers. The peak
refinement (Fig. 5.9b-c) has allowed identifying this compound as another higher-order
Ruddlesden-Popper phase (La,Pr)4Ni3O10-δ, abbreviated as (LP)4N3. Moreover, the phase of
(LP)3N2 was also found in the SP layer which previously was not present in the SP layer of
the pristine cell. Additionally, the phase quantification unambiguously shows that the amount
(a) (b)
(d)(c)
0 5 10 15 20 250.00
0.01
0.02
0.03
0.04
0.05
0.06
0.07
(LP)3N2/LPNO
Pr6O11/LPNO
(LP)4N3/LPNO
Qu
anti
ty r
atio
Distance from electrode/GDC interface (m)
0 5 10 15 20 250.00
0.01
0.02
0.03
0.04
0.05
0.06
0.07
(LP)3N2/LPNO
Pr6O11/LPNO
Qu
anti
ty r
atio
Distance from electrode/GDC interface (m)
0 5 10 15 20 250.00
0.01
0.02
0.03
0.04
0.05
0.06
0.07
(LP)3N2/LPNO
Pr6O11/LPNO
Qu
anti
ty r
atio
Distance from electrode/GDC interface (m)
0 5 10 15 20 250.00
0.02
0.04
0.06
0.08
0.10
0.12
0.14
0.16
0.18
0.20
(LP)3N2/LPNO
Pr6O11/LPNO
(LP)4N3/LPNO
Qu
anti
ty r
atio
Distance from electrode/GDC interface (m)

Chapter 5: Post-Mortem Structural and Microstructural Characterizations
125
of Pr6O11 is significantly higher after aging (Fig. 5.8c). From all these results, it can be
concluded that the operation in electrolysis mode accelerates the decomposition of LPNO
compared to simple thermal aging. Nevertheless, all these phases including (LP)4N3 are known
to be electrochemically active [19], [42]. Besides, according to the 2D maps of crystalline
phases and chemical elements (Fig. 5.5c and 5.6c), no reactivity is detected after operation
between LPNO electrode and GDC electrolyte. For these reasons, the electrode response
should not be affected by the aging, which is consistent with the electrode performance stability
measured in electrolysis mode (see §4.2).
Fig. 5. 9 (a) The average XRD patterns on several Y-positions and (b)-(c) refinement of the
peaks at two different Y-positions, i. e. 14 and 4 μm above the electrode/GDC interface,
respectively, for the anodically-aged symmetrical cell (sample 3 or SCell-anodic).
10 15 20 13 14 15
Inte
nsi
ty (
a.u
.)
2, synchrotron (°)
Experimental
data
Fitted data
GDC
LPNO
(LP)3N2
Pr6O11
(LP)4N3
20 30 40 50
2, Cu-K (°)
28 30 32
(a)
*o = +o o*
*
* * *+
=
o GDC electrolyte
* LPNO
= (La,Pr)3Ni2O7-δ
+ Pr6O11
v (La,Pr)4Ni3O10-δ*v
v
10 15 20 13 14 15
Inte
nsi
ty (
a.u
.)
2, synchrotron (°)
Experimental
data
Fitted data
GDC
LPNO
(LP)3N2
Pr6O11
(LP)4N3
20 30 40 50
2, Cu-K (°)
28 30 32
(b)
(c)
10 15 20 13 14 15
Inte
nsi
ty (
a.u.)
2 synchrotron (°)
Experimental data
Fitted data
GDC
LPNO
LP3N2
Pr6O
11
20 30 40 50
2, Cu-K (°)
28 30 32
10 15 20 13 14 15
Inte
nsi
ty (
a.u.)
2 synchrotron (°)
Experimental data
Fitted data
GDC
LPNO
LP3N2
Pr6O
11
20 30 40 50
2, Cu-K (°)
28 30 32
+10
+16
-2
+2
+4
+6
+14
Surface
GDC
electrolyte
µm
Interface

Chapter 5: Post-Mortem Structural and Microstructural Characterizations
126
5.3.3.2 Anodically-aged oxygen electrode of the complete cell (sample 4 or CCell 1)
The µ-XRD characterization data on the LPNO electrode of the complete cell (sample 4 or
CCell 1) after long-term test in electrolysis mode shows that the final phases are similar to the
anodic side of the symmetrical cell (sample 3). Indeed, (LP)4N3 is also formed in both ESD
and SP layer while the decomposition in (LP)3N2 extends in the SP layer (Fig. 5.5d and 5.10a-
c). These observations reinforce the statement that the operation in electrolysis mode favors
the LPNO destabilization. However, conversely to the symmetrical cell, the quantifications
have shown that the amount of Pr6O11 seems to be not significantly increased after the operation.
This apparent discrepancy between the two samples can be explained by the difference in aging
condition. Indeed, the durability test with the symmetrical cell was performed at higher current
than for the complete cell (anodic current of 300 mA cm-2 vs 200 mA cm-2). From this point of
view, the underlying mechanisms accelerating the material destabilization under electrolysis
mode should be related to the current or the electrode overpotential. In this frame, it could be
suggested that the change of the LPNO oxygen stoichiometry under electrolysis current could
favor the decomposition.
Finally, the 2D maps for the complete cell show that there is no indication of reaction between
LPNO and GDC. However, a composition gradient of Ce and Gd is detected in the GDC barrier
layer (Fig. 5.6d). The area close to the LPNO electrode is richer in Ce while the area close to
the 8YSZ electrolyte is richer in Gd. However, it is still not clear whether the origin of this
gradient of composition was induced by the manufacturing of the half-cell itself (i.e.
interdiffusion during the barrier layer sintering) or related to evolution during the durability
test.

Chapter 5: Post-Mortem Structural and Microstructural Characterizations
127
Fig. 5. 10 (a) The average XRD patterns on several Y-positions and (b)-(c) refinement of the
peaks at two different Y-positions, i. e. 10 and 4 μm above the electrode/GDC interface,
respectively, for the anodically-aged complete cell (sample 4 or CCell 1).
5.3.4 Long-term test in fuel cell mode (cathodic polarization): symmetrical cell
Because of difficulties in the specimen preparation due to the poor electrode attachment onto
the electrolyte after aging in fuel cell mode, only laboratory XRD characterizations are carried
out on sample 5 (cathodic side of the symmetrical cell). Indeed, the electrode aged under
cathodic polarization was delaminated in such a way that the thin lamella was lost during the
last stage of its preparation. Even if the laboratory XRD technique cannot provide information
within the thickness of the electrode, the presence or appearance of secondary phases after the
long-term operation can be compared to the pristine cell. As for the electrode aged in the
electrolysis mode, the secondary phases (LP)3N2, Pr6O11, and (LP)4N3 have also been detected
in sample 6 (Fig. 5.11b). Conversely to the pristine electrode (Fig. 5.11a), it can be noticed
that the possibility to detect the Pr6O11 phase with laboratory equipment for the aged sample
proves that its quantity has been significantly increased. These results suggest that the cathodic
10 15 20 13 14 15
Inte
nsi
ty (
a.u
.)
2, synchrotron (°)
(LP)3N2
Pr6O11
(LP)4N3
Ni
8YSZ
Experimental data
Fitted data
GDC
LPNO
20 30 40 50
2, Cu-K (°)28 30 32
(a)
*o = +o o**
* * *+=
o GDC electrolyte
* LPNO
= (La,Pr)3Ni2O7-δ
+ Pr6O11
v (La,Pr)4Ni3O10-δ
*vv
10 15 20 13 14 15
Inte
nsi
ty (
a.u
.)
2, synchrotron (°)
(LP)3N2
Pr6O11
(LP)4N3
Ni
8YSZ
Experimental data
Fitted data
GDC
LPNO
20 30 40 50
2, Cu-K (°)28 30 32
(b)
(c)
10 15 20 13 14 15
Inte
nsi
ty (
a.u
.)
2 synchrotron (°)
Experimental data
Fitted data
GDC
LPNO
LP3N2
Pr6O
11
20 30 40 50
2, Cu-K (°)
28 30 32
10 15 20 13 14 15
Inte
nsi
ty (
a.u.)
2 synchrotron (°)
Experimental data
Fitted data
GDC
LPNO
LP3N2
Pr6O
11
20 30 40 50
2, Cu-K (°)
28 30 32
+10
+16
+1.5
+4
+7
+13
Surface
GDC
electrolyte
µm
Interface

Chapter 5: Post-Mortem Structural and Microstructural Characterizations
128
current also accelerates the LPNO destabilization. However, at this stage, it still unclear
whether the decomposition is more pronounced when the electrode is operated in fuel cell or
electrolysis mode. Nevertheless, this structural characterization does not reveal a strong
reactivity at the electrode/GDC interface that could explain the delamination. Therefore, it can
be speculated that the amount of the secondary phases formed under fuel cell current is higher
so that they could destabilize the interface. In this view, one could consider the origin of LPNO
degradation coming from the mechanism of the oxygen reduction reaction that occurs at the
cathodic side in fuel cell mode. Indeed, in these reducing conditions under cathodic
polarization, the oxygen over-stoichiometry in LaPrNiO4+δ material is decreased since a flux
of oxide ions are transported from the oxygen electrode to the hydrogen electrode through the
electrolyte. The LPNO is consequently losing some interstitial oxygen ions and this evolution
should not be in favour of its structural stability. On the contrary, when LPNO is working as
an anode material in oxidizing conditions in the electrolysis mode, LPNO is fed by oxygen ions
that could occupy interstitial sites of the structure. Therefore, the increase of the oxygen over-
stoichiometry under anodic current could be less impacting and could limit the LPNO structural
instability compared to operation under cathodic current. In contrast for materials exhibiting
oxygen under-stoichiometry such as the state-of-the-art LSCF, it is interesting to note that the
performance degradation caused by either delamination or cation diffusion and the formation
of secondary phase had been observed during the practical operation in electrolysis mode [45],
[102], [103]. Moreover, in a present review work [44], the authors focus on providing an
understanding of SOEC degradation in which the role of oxygen chemical activity appears as
a major factor governing various degradation phenomena including cation diffusion, secondary
phase formation, and delamination of the electrode. Finally, in the specific case of the LPNO
electrode, the delamination could also be related to the behavior of Pr6O11 in different pO2. As
mentioned in the literature [104], [105], a phase transition of praseodymium oxide (PrOx) from
Pr6O11 (=PrO1.83) to Pr7O12 (=PrO1.71) appears at either ~700 °C in the air or in a slightly low
pO2 environment or at ~800 °C in high pO2. Since the test in SOFC mode is carried out at
700 °C, this structural transition could take place in the vicinity of the interface where low pO2
is induced by the reaction of oxygen reduction.

Chapter 5: Post-Mortem Structural and Microstructural Characterizations
129
Fig. 5. 11 The lab XRD of (a) pristine cell (sample 1) and (b) cathodically-aged symmetrical
cell (sample 5 or SCell-cathodic). The symbol ‘C’ indicated the carbon phase which is
originating from the carbon tape used for sample preparation by p-FIB.
5.4 Summary and conclusions
Several microstructural and structural characterizations have been carried out to investigate the
behavior of the LPNO electrode under polarization. SEM observations and FIB-SEM
reconstructions have shown that the microstructure is not affected by the operation in the
electrolysis mode. However, the sample aged in fuel cell mode exhibits severe delamination at
the electrode/electrolyte interface which is not observed for the electrode operating in the
electrolysis mode. This delamination at the LPNO/GDC interface must explain the higher
degradation rate induced by the fuel cell operation.
In complementarity of the microstructural analysis, structural characterizations by laboratory
XRD and synchrotron µ-XRD and µ-XRF have been performed. For the pristine electrode
analyzed just after the manufacturing process, it has been found that the fine microstructure of
the ESD layer induces a minor decomposition into the (La,Pr)3Ni2O7-δ and Pr6O11 secondary
phases while the coarse microstructure of the SP layer is more stable with only the presence of
20 25 30 35 40 45 50
Inte
nsi
ty (
a.u.)
2, Cu-K (°)
Anodic side symmetrical cell
Pristine cell
Pristine cell
Cathodic side
symmetrical cell
o GDC
* LPNO
= (La,Pr)3Ni2O7-δ
o
o o
*
*
** *
*
=
*
==C
oo
o
*
* *
* *
*
=
*
=
=
C
+ +vv
+ PrOx
v (La,Pr)4Ni3O10-δ
(a)
(b)

Chapter 5: Post-Mortem Structural and Microstructural Characterizations
130
Pr6O11. It can be noticed that the amount of this phase is very limited in the pristine samples in
such a way that it can be only detected in the µ-XRD pattern.
The structural observation for the thermally-aged electrode has not revealed the formation of
any additional secondary phases. However, a slight increase in the amount of (La,Pr)3Ni2O7-δ
and, especially Pr6O11, has been detected indicating that LPNO in the ESD layer is decomposed
at a very slow rate in temperature.
Compared to the thermal aging, it has been found that the LPNO decomposition is much more
pronounced for the electrodes operated in an anodic or cathodic polarization. Indeed, for the
samples aged in the electrolysis mode, the µ-XRD maps have shown that a new secondary
phase (La,Pr)4Ni3O10-δ appears in both the ESD and SP layers. Moreover, the quantity of Pr6O11
is strongly increased especially at high current density, while the formation of (La,Pr)3Ni2O7-δ
extends in the SP layer. These results mean that the operation under electrolysis current
accelerates the decomposition of LPNO compared to simple thermal aging. With the XRD
laboratory characterizations, the same conclusions have been drawn for the electrode operated
in fuel cell modes. However, the difference in the material stability between the two operating
modes is still unclear and further investigations are required. Nevertheless, two main
hypotheses have been proposed to account for the electrode delamination only observed in fuel
cell mode. Firstly, since the oxygen over-stoichiometry decreases under cathodic current,
especially at the electrolyte interface where the depletion in interstitial oxygen should be the
highest, the rate of the LPNO destabilization could be accelerated compared to the anodic
operation. Secondly, the behavior of Pr6O11 under reducing atmosphere at the electrolyte
interface in fuel cell conditions could also participate or explain the delamination.
To conclude, the suitability of LaPrNiO4+δ (LPNO) as a durable oxygen electrode for
electrolysis cell has been proved to be promising. Indeed, the electrode polarization resistances
of the complete cell remain unchanged after the durability test carried out under electrolysis
current thanks to the presence of electrochemically active secondary phases coming from the
decomposition of the LPNO phases. Moreover, the destabilization of the electrode seems to
not be affected by the microstructure as indicated by the same destabilization behavior on both
ESD and SP layers.

131
GLOBAL CONCLUSIONS AND
PERSPECTIVES

Global Conclusions and Perspectives
132
Conclusions
The evaluation of lanthanum-praseodymium nickelate, LaPrNiO4+δ or LPNO, as a suitable
material for the oxygen electrode of Solid Oxide Cells (SOCs) has been carried out and
discussed in this work. The manufacturing parameters have been optimized for electrodes
deposited either by electrostatic spray deposition (ESD) with a coral-like microstructure or by
screen printing (SP). One of the most important results is the presence of secondary phase
higher-order nickelate, (La,Pr)3Ni2O7-δ or (LP)3N2, in the prepared ESD layer which is
suspected to be caused by the fine particle size.
The electrode response has been characterized by electrochemical impedance spectroscopy
(EIS). A single equivalent electrical circuit has been proposed to fit all measurement data. The
circuit takes into account the contribution of the pure ohmic resistance or the series resistance
Rs (with a resistor), the ionic transfer at the electrode/electrolyte interface (with a resistor in
parallel with a constant phase element, R//CPE), the bulk electrode processes (with a fractal
Gerischer in parallel with a pure capacitor, Gf//C), and the gas diffusion (with a finite-length
Warburg element, FLW).
Besides the choice of materials with suitable intrinsic properties, the microstructure and
architecture of the electrode also play an important role in the performance. Hence, the
electrochemical performance of the LPNO electrode has been optimized by improving the
microstructure and electrode design. Several symmetrical cells consisting of the LPNO
electrode deposited on gadolinium-doped ceria, Ce0.9Gd0.1O2-δ or GDC, have been prepared
and characterized, yielding to four main results. Firstly, the quality of the electrode/electrolyte
interface is a key factor that can be optimized with sufficient sintering temperature to enhance
the electrode/electrolyte adhesion. In this frame, it has been shown that an even better electrode
adhesion of the ESD layer can be obtained at a lower sintering temperature (960 °C) as
compared to the SP layer (1100 °C). However, the coral-like microstructure of the ESD layer
leads to a rougher surface than the SP layer, which is not favorable for good current collecting.
Thus, various electrode designs have been manufactured and tested in order to combine the
advantage of the two processes. For this purpose, a double-layer (DL) configuration which
consists of the ESD layer as the active functional layer (AFL) and topped by the SP layer as
the current collector layer (CCL) has been thoroughly investigated. It has been shown that this
architecture allows improving substantially the performance because of a better
electrode/electrolyte interface of the ESD layer and flatter surface of the SP layer; the latter

Global Conclusions and Perspectives
133
favoring the current collecting. Even better performance has been obtained for a triple-layer
(TL) electrode, which consists of a thin GDC layer deposited by SP, followed by an LPNO
layer by ESD, and lastly LPNO layer by SP. The LPNO ESD is found to penetrate the GDC
SP and forming a composite of LPNO-GDC. It is suggested that the formation of this composite
is beneficial to improve the mechanical contact and the oxygen solid-state diffusion. Moreover,
it is also suspected that the increase in the density of triple-phase boundary lines in the
composite could also participate in the electrode performances by activating the so-called
surface path. The third result shows that the quality of the CCL (LPNO deposited by SP) also
plays an important role in the DL and TL electrodes. It is shown that when the LPNO powder
used for SP ink preparation is not ball-milled, large agglomerates present in the CCL resulting
in the damage of the ESD layer beneath. Since the porous ESD layer is favorable for the
reactions, the damage reduces its porosity and, in consequence, the electrode performance is
decreased. Thus, a well-distributed and small particle size of the CCL is required. Lastly, it has
been shown that the sintering temperature after CCL deposition by SP for double and triple-
layer should not exceed 800 °C to prevent the increase of (LP)3N2 amount in the ESD layer.
Notwithstanding this phase is electrochemically active and could even help to improve the
electrochemical performance of the electrode, the initial presence of this phase should not be
detrimental regarding the electrode durability. From all these results, the best electrode
performance is a TL electrode whose area-specific polarization resistance value at 700 °C and
open circuit potential (OCP) is 0.20 Ω cm2.
The durability of SOCs is one of the most important issues for this high-temperature technology.
For this particular electrode, the degradation studies are quite challenging because of the
different microstructure between the ESD and SP layer and the presence of a secondary phase
in the pristine ESD layer. Moreover, the number of studies dedicated to the degradation of
LPNO are in general very limited. To address this difficulty, long-term tests at 700 °C have
been carried out on both DL symmetrical and complete cells to investigate the degradation of
the LPNO electrode in operation. A current of ±300 mA cm-2 was applied on either side of a
symmetrical cell, SCell, allowing one side of the electrode to operate in fuel cell mode
(cathodic current) while the other in electrolysis mode (anodic current). After 960 h, it is found
that the performance of LPNO strongly decreases in fuel cell operation while it remains quite
stable in the electrolysis mode. The calculated cell degradation rate in fuel cell mode was 219
mV kh-1 (15.5 V% kh-1) or 607 mΩ cm2 kh-1 (162.49 Ω% kh-1) while in electrolysis mode was

Global Conclusions and Perspectives
134
7.28 mΩ cm2 kh-1 (1.55 Ω% kh-1), which means that the degradation in electrolysis operation
was around 100 times lower.
Following the test on the symmetrical cell, a preliminary long-term test on a complete cell was
carried out in electrolysis mode by applying an anodic current of -200 mA cm-2. The cell, CCell
1, was prepared by depositing the 4 μm-thick GDC barrier layer by screen printing. The pre-
test measurements have shown a rather poor performance of the cell. However, CCell 1 was
found to be quite electrochemically stable after operation for 900 h as indicated by a slight
improvement at the beginning of the test followed by a stable performance, which is in
agreement with the results on the symmetrical cell operated in the electrolysis mode.
The initial poor performance measured on CCell 1 was suspected to be caused by the quite
thick and porous GDC barrier layer. As an effort to investigate this issue, a second complete
cell, CCell 2, was prepared in which the dense, 400 nm-thick GDC barrier layer was deposited
by RF magnetron sputtering. The iV curves have shown that the current densities of CCell 2
on both fuel cell and electrolysis modes doubled the values obtained for CCell 1 indicating a
better cell performance.
For a deeper understanding of the LPNO durability behavior of the three cells mentioned above,
post-mortem microstructural and structural characterizations have been carried out. The results
have been compared to a pristine DL LPNO electrode on GDC and to a thermally aged single-
layer (SL) ESD electrode on GDC (after heat treatment at 700 °C for 1000 h in the air) to
investigate the effect of polarization on the LPNO degradation. SEM observations on the cross-
sections of cells operated in electrolysis mode (SCell-anodic and CCell 1) show that there is
no delamination of the LPNO electrode. The comparison of the microstructural properties
between the pristine cell and SCell-anodic shows that the microstructure does not change as
indicated by similar porosity, mean particle diameter of the LPNO phase, specific surface area,
and tortuosity factor of the gas phase. These microstructural properties are extracted from the
3D reconstructions of the electrodes by FIB-SEM tomography. Hence, it can be concluded that
operation in electrolysis mode does not change the microstructure of the LPNO electrode,
which is in good agreement with the electrochemical characterizations. On the contrary, severe
delamination of the LPNO electrode is observed from the SEM image of SCell-cathodic
explaining the strong degradation on the electrode performance obtained in this fuel cell
operating mode.

Global Conclusions and Perspectives
135
The structural characterizations by synchrotron-based μ-XRD and μ-XRF have also been
conducted on the pristine cell, thermally-aged cell, SCell-anodic, and CCell 1. This technique
enables the depth profiling on the distribution of elements and phases, thus it is useful for a
multi-layer sample such as the double-layer electrode. In agreement with the laboratory XRD
results, the characterizations on the pristine double-layer electrode have revealed the presence
of LPNO on both ESD and SP layers, while (LP)3N2 was found only in the ESD layer.
However, another phase, praseodymium oxide Pr6O11, was also observed on both layers. This
phase was never detected in laboratory XRD due to its small quantity and its peak position that
is very close to the strong peak of GDC. After thermal aging, the phases present in the ESD
layer are the same as in a pristine cell (LPNO, (LP)3N2, Pr6O11). However, the quantity of the
secondary phases slightly increases indicating a slow destabilization of LPNO solely under
temperature. The characterizations on both SCell-anodic and CCell 1 have shown that a new
higher-order nickelate phase, (La,Pr)4Ni3O10-δ or (LP)4N3, was formed after an operation in
the electrolysis mode, indicating a strong destabilization of LPNO under current. Besides, the
amount of (LP)3N2 and Pr6O11 secondary phases after electrochemical aging are also
significantly increased. Nevertheless, since all these phases are electrochemically active, they
should not affect the electrode performances despite of the LPNO chemical destabilization.
Finally, no reactivity between LPNO and GDC or YSZ was observed. To conclude, all these
results are consistent and explain the electrode stability in performances upon electrolysis
operation.
Since lamella of SCell-cathodic is difficult to prepare due to the delamination, the structural
characterization of this sample has been only carried out by laboratory XRD. Surprisingly, the
same compounds as in the SCell-anodic and CCell 1 were present. However, since
delamination was observed in this SCell-cathodic sample, it can be proposed that the amount
of the secondary phases is larger and more concentrated close to the LPNO/GDC interface.
This behavior could be explained by the nature of LPNO which contains oxygen over-
stoichiometry in its lattice; thus, in reducing atmosphere such as in fuel cell operation, the
number of interstitial oxygens in the electrode is expected to decrease. Consequently, that could
accelerate the structure destabilization (and vice versa in electrolysis operation). The second
possible origin of the phase delamination could be the structural transition from Pr6O11 to
Pr7O12 that could take place in the vicinity of the interface in reducing atmosphere during the
oxygen reduction reaction. To conclude, the suitability of LaPrNiO4+δ (LPNO) as a durable
oxygen electrode for electrolysis cell has been proved to be promising.

Global Conclusions and Perspectives
136
Perspectives
In this PhD thesis, architecturally designed La2-xPrxNiO4+δ (x = 1, LPNO) oxygen electrodes
deposited by ESD and SP on Ce0.9Gd0.1O2-δ (GDC) electrolyte have been selected as innovative
solutions for the next generation of solid oxide electrolysis cells (SOECs). The preparation of
LPNO electrode by ESD with specific deposition parameters resulting in porous,
nanostructured active functional layer (AFL) with a coral-like microstructure and good
adhesion on GDC. Low polarization resistances have been reported thanks to this
microstructure, facilitating the oxygen surface exchange and ions diffusion which are
fundamental in the oxygen electrode design. However, there are various other types of
microstructures that can be prepared by ESD for which promising results have been obtained
for the solid oxide cells application. In this work, an attempt to prepare a columnar hierarchical
microstructure has been carried out following the excellent electrochemical performances of
hierarchically nanostructured LSCF developed by Özden Çelikbilek in her PhD thesis in 2016
in our group. The space between columns would serve as gas channels distributing oxygen to
the active zones. This preliminary experiment was not conclusive due to the adhesion issue of
the columnar LPNO electrode on the electrolyte. Hence, a more careful study of ESD
parameters and the subsequent sintering might be performed to improve the adhesion of the
columnar-type LPNO AFL by ESD on GDC electrolyte.
In this work, long-term tests have been performed on cells with a double-layer LPNO oxygen
electrode. From the optimization of the electrode design, it is found out that the best
electrochemical performance of LPNO is obtained for a triple-layer electrode characterized by
a GDC/LPNO composite interface where screen-printed large grains of the ionic conductor
GDC are in intimate contact with electrostatically-sprayed nanostructured grains of LPNO. For
future works, long-term tests on the triple-layer electrode are suggested to investigate the
influence of the electrode/electrolyte interface design on the durability.
A possible extension of this work could be to consider the durability study versus Pr
substitution in the La2-xPrxNiO4+δ (0 ≤ x ≤ 1) solid solution system benefiting from the best
chemical stability properties of La.
Since the final chemical phases detected in post-mortem characterizations of LPNO aged in
electrolysis and fuel cell modes are found to be (La,Pr)4Ni3O10-δ and Pr6O11, it would be worth
to investigate the durability of SOCs incorporating these MIEC phases as oxygen electrodes.

Global Conclusions and Perspectives
137
As discussed in this work, the long-term test on the complete cell level is still on a preliminary
stage, it is especially important to address the poor performance of the cell as indicated by a
rather low current density which is not expected due to the excellent performance of the LPNO
electrode in symmetrical cell level.
Unlike the widely studied under-stoichiometric LSCF, the behavior of the over-stoichiometric
LPNO electrode in operation is different as indicated by a slow degradation in electrolysis
operation and fast degradation in fuel cell operation as opposed to LSCF. Moreover, the LPNO
electrode is shown to chemically destabilize into the same compounds in both electrolysis and
fuel cell operations. One can propose to study and understand the underlying mechanisms of
the LPNO electrode durability (in terms of delamination and chemical stability) in a complete
fuel cell configuration. It would be of great interest to conduct a comparative study of the
mechanism of phases formation, their distribution in the electrode, and their effect on the cell
performance with this work on the LPNO durability in an electrolysis mode. Finally, a
physically-based electrode model could be developed at the microscopic length scale and
simulations could be conducted as a guide to analyze the role of microstructure, structure and
the relationship between electrode reaction mechanisms and the degradation phenomena. This
facet will thus aim at proposing practical solutions for SOC technology.

References
138
REFERENCES
[1] C. W. Team, R. K. Pachauri, and L. A. Meyer, Eds., Climate Change 2014: Synthesis
Report. Contribution of Working Groups I, II and III to the Fifth Assessment Report of
the Intergovernmental Panel on Climate Change. Geneva, Switzerland: IPCC, 2014.
[2] D. P. van Vuuren et al., “The representative concentration pathways: An overview,”
Clim. Change, vol. 109, pp. 5–31, 2011, doi: 10.1007/s10584-011-0148-z.
[3] F. Orecchini, “The era of energy vectors,” Int. J. Hydrogen Energy, vol. 31, no. 14, pp.
1951–1954, 2006, doi: 10.1016/j.ijhydene.2006.01.015.
[4] I. Dincer and C. Acar, “Review and evaluation of hydrogen production methods for
better sustainability,” Int. J. Hydrogen Energy, vol. 40, no. 34, pp. 11094–11111, 2015,
doi: 10.1016/j.ijhydene.2014.12.035.
[5] O. Bičáková and P. Straka, “Production of hydrogen from renewable resources and its
effectiveness,” Int. J. Hydrogen Energy, vol. 37, no. 16, pp. 11563–11578, 2012, doi:
10.1016/j.ijhydene.2012.05.047.
[6] I. Dincer, “Green methods for hydrogen production,” Int. J. Hydrogen Energy, vol. 37,
no. 2, pp. 1954–1971, 2012, doi: 10.1016/j.ijhydene.2011.03.173.
[7] S. Mekhilef, R. Saidur, and A. Safari, “Comparative study of different fuel cell
technologies,” Renew. Sustain. Energy Rev., vol. 16, no. 1, pp. 981–989, 2012, doi:
10.1016/j.rser.2011.09.020.
[8] N. Mahato, A. Banerjee, A. Gupta, S. Omar, and K. Balani, “Progress in material
selection for solid oxide fuel cell technology: A review,” Prog. Mater. Sci., vol. 72, pp.
141–337, 2015, doi: 10.1016/j.pmatsci.2015.01.001.
[9] A. J. Appleby, “Fuel cell technology: Status and future prospects,” Energy, vol. 21, no.
7/8, pp. 521–653, 1996, doi: 10.1016/0360-5442(96)00030-8.
[10] A. B. Stambouli, “Fuel cells : The expectations for an environmental-friendly and
sustainable source of energy,” Renew. Sustain. Energy Rev., vol. 15, no. 9, pp. 4507–
4520, 2011, doi: 10.1016/j.rser.2011.07.100.
[11] S. P. S. Badwal, S. Giddey, C. Munnings, and A. Kulkarni, “Review of progress in high
temperature solid oxide fuel cells,” J. Aust. Ceram. Soc., vol. 50, no. 1, pp. 23–37, 2014.
[12] P. E. Dodds et al., “Hydrogen and fuel cell technologies for heating: A review,” Int. J.

References
139
Hydrogen Energy, vol. 40, no. 5, pp. 2065–2083, 2015, doi:
10.1016/j.ijhydene.2014.11.059.
[13] N. Q. Minh, “Solid oxide fuel cell technology - features and applications,” Solid State
Ionics, vol. 174, no. 1–4, pp. 271–277, 2004, doi: 10.1016/j.ssi.2004.07.042.
[14] Y. Zhao et al., “Recent progress on solid oxide fuel cell: Lowering temperature and
utilizing non-hydrogen fuels,” Int. J. Hydrogen Energy, vol. 38, no. 36, pp. 16498–
16517, 2013, doi: 10.1016/j.ijhydene.2013.07.077.
[15] E. D. Wachsman and K. T. Lee, “Lowering the temperature of solid oxide fuel cells,”
Sci., vol. 334, no. 6058, pp. 935–939, 2011, doi: 10.1126/science.1204090.
[16] B. C. H. Steele, “Appraisal of Ce1-yGdyO2-y/2 electrolytes for IT-SOFC operation at
500°C,” Solid State Ionics, vol. 129, no. 1–4, pp. 95–110, 2000, doi: 10.1016/S0167-
2738(99)00319-7.
[17] L. J. Gauckler et al., “Solid oxide fuel cells: Systems and materials,” Chim., vol. 58, no.
12, pp. 837–850, 2004.
[18] G. Constantin, C. Rossignol, J. P. Barnes, and E. Djurado, “Interface stability of thin,
dense CGO film coating on YSZ for solid oxide fuel cells,” Solid State Ionics, vol. 235,
pp. 36–41, 2013, doi: 10.1016/j.ssi.2013.01.015.
[19] S. Takahashi, S. Nishimoto, M. Matsuda, and M. Miyake, “Electrode properties of the
Ruddlesden-Popper series, Lan+1NinO3n+1 (n = 1, 2, and 3), as intermediate-
temperature solid oxide fuel cells,” J. Am. Ceram. Soc., vol. 93, no. 8, pp. 2329–2333,
2010, doi: 10.1111/j.1551-2916.2010.03743.x.
[20] H. Zhao, F. Mauvy, C. Lalanne, J. M. Bassat, S. Fourcade, and J. C. Grenier, “New
cathode materials for ITSOFC: Phase stability, oxygen exchange and cathode properties
of La2-xNiO4+δ,” Solid State Ionics, vol. 179, no. 35–36, pp. 2000–2005, 2008, doi:
10.1016/j.ssi.2008.06.019.
[21] G. Amow and S. J. Skinner, “Recent developments in Ruddlesden-Popper nickelate
systems for solid oxide fuel cell cathodes,” J. Solid State Electrochem., vol. 10, pp. 538–
546, 2006, doi: 10.1007/s10008-006-0127-x.
[22] V. Vibhu, A. Rougier, C. Nicollet, A. Flura, J. C. Grenier, and J. M. Bassat, “La2-
xPrxNiO4+δ as suitable cathodes for metal supported SOFCs,” Solid State Ionics, vol.
278, pp. 32–37, 2015, doi: 10.1016/j.ssi.2015.05.005.

References
140
[23] S. B. Adler, “Factors governing oxygen reduction in solid oxide fuel cell cathodes,”
Chem. Rev., vol. 104, no. 10, pp. 4791–4843, 2004, doi: 10.1021/cr020724o.
[24] Y. Takeda, R. Kanno, M. Noda, Y. Tomida, and O. Yamamoto, “Cathodic polarization
phenomena of perovskite oxide electrodes with stabilized zirconia,” J. Electrochem.
Soc., vol. 134, no. 11, pp. 2656–2661, 1987.
[25] J. Laurencin and J. Mougin, “High Temperature Steam Electrolysis,” in Hydrogen
Production by Electrolysis, Wiley-VCH, 2015, pp. 191–272.
[26] C. Lefrou, P. Fabry, and J.-C. Poignet, Electrochemistry: The Basics, with Examples.
Berlin Heidelberg: Springer-Verlag, 2012.
[27] V. S. Bagotsky, Fundamentals of Electrochemistry, Second Edi. Hoboken, New Jersey:
John Wiley & Sons, Inc., 2006.
[28] V. Ramani, “Fuel Cells,” Electrochem. Soc. Interface, pp. 41–44, 2006.
[29] S. B. Adler, J. A. Lane, and B. C. H. Steele, “Electrode kinetics of porous mixed-
conducting oxygen electrodes,” J. Electrochem. Soc., vol. 143, no. 11, pp. 3554–3564,
1996, doi: 10.1149/1.1837252.
[30] S. N. Ruddlesden and P. Popper, “The compound Sr3Ti2O7 and its structure,” Acta
Crystallogr., vol. 11, no. 1, pp. 54–55, 1958, doi: 10.1107/s0365110x58000128.
[31] M. Greenblatt, “Ruddlesden-Popper Lnn+1NinO3n+1 nickelates: Structure and
properties,” Curr. Opin. Solid State Mater. Sci., vol. 2, no. 2, pp. 174–183, 1997, doi:
10.1016/s1359-0286(97)80062-9.
[32] A. Tarancón, M. Burriel, J. Santiso, S. J. Skinner, and J. A. Kilner, “Advances in layered
oxide cathodes for intermediate temperature solid oxide fuel cells,” J. Mater. Chem., vol.
20, pp. 3799–3813, 2010, doi: 10.1039/b922430k.
[33] K. Yakal-Kremski, L. V. Mogni, A. Montenegro-Hernández, A. Caneiro, and S. A.
Barnett, “Determination of electrode oxygen transport kinetics using electrochemical
impedance spectroscopy combined with three-dimensional microstructure measurement:
Application to Nd2NiO4+δ,” J. Electrochem. Soc., vol. 161, no. 14, pp. F1366–F1374,
2014, doi: 10.1149/2.0521414jes.
[34] G. Amow, I. J. Davidson, and S. J. Skinner, “A comparative study of the Ruddlesden-
Popper series, Lan+1NinO3n+1 (n = 1, 2 and 3), for solid-oxide fuel-cell cathode
References
141
applications,” Solid State Ionics, vol. 177, no. 13–14, pp. 1205–1210, 2006, doi:
10.1016/j.ssi.2006.05.005.
[35] R. K. Sharma, S. K. Cheah, M. Burriel, L. Dessemond, J. M. Bassat, and E. Djurado,
“Design of La2-xPrxNiO4+δ SOFC cathodes: A compromise between electrochemical
performance and thermodynamic stability,” J. Mater. Chem. A, vol. 5, pp. 1120–1132,
2017, doi: 10.1039/c6ta08011a.
[36] V. Vibhu, J.-M. Bassat, A. Flura, C. Nicollet, J.-C. Grenier, and A. Rougier, “Influence
of La/Pr ratio on the ageing properties of La2-XPrxNiO4+ as cathodes in IT-SOFCs,”
ECS Trans., vol. 68, no. 1, pp. 825–835, 2015, doi: 10.1149/06801.0825ecst.
[37] A. Montenegro-Hernández, J. Vega-Castillo, L. Mogni, and A. Caneiro, “Thermal
stability of Ln2NiO4+δ (Ln: La, Pr, Nd) and their chemical compatibility with YSZ and
CGO solid electrolytes,” Int. J. Hydrogen Energy, vol. 36, no. 24, pp. 15704–15714,
2011, doi: 10.1016/j.ijhydene.2011.08.105.
[38] S. Nishimoto, S. Takahashi, Y. Kameshima, M. Matsuda, and M. Miyake, “Properties
of La2-xPrxNiO4 cathode for intermediate-temperature solid oxide fuel cells,” J. Ceram.
Soc. Japan, vol. 119, no. 1387, pp. 246–250, 2011, doi: 10.2109/jcersj2.119.246.
[39] A. J. Jacobson, “New Cathode Materials for Intermediate Temperature Solid Oxide Fuel
Cells,” University of Houston, 2004.
[40] J. C. Park, D. K. Kim, S. H. Byeon, and D. Kim, “XANES study on Ruddlesden-Popper
phase, Lan+1NinO3n+1 (n = 1, 2 and ∞),” J. Synchrotron Radiat., vol. 8, no. 2, pp. 704–
706, 2001, doi: 10.1107/S0909049500015983.
[41] Z. Lou et al., “High performance La3Ni2O7 cathode prepared by a facile sol-gel method
for intermediate temperature solid oxide fuel cells,” Electrochem. commun., vol. 22, pp.
97–100, 2012, doi: 10.1016/j.elecom.2012.06.004.
[42] R. K. Sharma, M. Burriel, and E. Djurado, “La4Ni3O10-δ as an efficient solid oxide
fuel cell cathode: Electrochemical properties versus microstructure,” J. Mater. Chem. A,
vol. 3, pp. 23833–23843, 2015, doi: 10.1039/C5TA07862H.
[43] R. K. Sharma, M. Burriel, L. Dessemond, J.-M. Bassat, and E. Djurado,
“Lan+1NinO3n+1 (n = 2 and 3) phases and composites for solid oxide fuel cell cathodes:
Facile synthesis and electrochemical properties,” J. Power Sources, vol. 325, pp. 337–
345, 2016, doi: 10.1016/j.jpowsour.2016.06.047.
References
142
[44] Y. Wang, W. Li, L. Ma, W. Li, and X. Liu, “Degradation of solid oxide electrolysis cells:
phenomena, mechanisms, and emerging mitigation strategies – a review,” J. Mater. Sci.
Technol., 2019, doi: 10.1016/j.jmst.2019.07.026.
[45] J. Laurencin et al., “Degradation mechanism of La0.6Sr0.4Co0.2Fe0.8O3-
δ/Gd0.1Ce0.9O2-δ composite electrode operated under solid oxide electrolysis and fuel
cell conditions,” Electrochim. Acta, vol. 241, pp. 459–476, 2017, doi:
10.1016/j.electacta.2017.05.011.
[46] T. L. Skafte, J. Hjelm, P. Blennow, and C. R. Graves, “Quantitative review of
degradation and lifetime of solid oxide cells and stacks,” in Proceedings of 12th
European SOFC & SOE Forum 2016, 2016, no. B0501, pp. 8–27.
[47] Q. Fang, L. Blum, and D. Stolten, “Electrochemical performance and degradation
analysis of an SOFC short stack for operation of more than 100,000 hours,” ECS Trans.,
vol. 91, no. 1, pp. 687–696, 2019, doi: 10.1149/09101.0687ecst.
[48] S. J. Kim, K. J. Kim, A. M. Dayaghi, and G. M. Choi, “Polarization and stability of
La2NiO4+δ in comparison with La0.6Sr0.4Co0.2Fe0.8O3−δ as air electrode of solid
oxide electrolysis cell,” Int. J. Hydrogen Energy, vol. 41, no. 33, pp. 14498–14506, 2016,
doi: 10.1016/j.ijhydene.2016.05.284.
[49] N. Coppola et al., “Structural and electrical characterization of sputter-deposited
Gd0.1Ce0.9O2−δ thin buffer layers at the Y-stabilized zirconia electrolyte interface for
IT-solid oxide cells,” Catalysts, vol. 8, no. 12, 2018, doi: 10.3390/catal8120571.
[50] A. Shutka, G. Mezinskis, and A. Pludons, “Preparation of dissimilarly structured ferrite
compounds by sol-gel auto-combustion method,” Chemine Technol., vol. 54, no. 1, pp.
41–46, 2010.
[51] L. Shi, C. Zeng, Y. Jin, T. Wang, and N. Tsubaki, “A sol-gel auto-combustion method
to prepare Cu/ZnO catalysts for low-temperature methanol synthesis,” Catal. Sci.
Technol., vol. 2, pp. 2569–2577, 2012, doi: 10.1039/c2cy20423a.
[52] C. Chen, “Thin-Film Components for Lithium-Ion Batteries,” Delft University of
Technology, 1998.
[53] C. H. Chen, E. M. Kelder, M. J. G. Jak, and J. Schoonman, “Electrostatic spray
deposition of thin layers of cathode materials for lithium battery,” Solid State Ionics, vol.
86–88, no. Part 2, pp. 1301–1306, 1996, doi: 10.1016/0167-2738(96)00305-0.

References
143
[54] A. M. Gañán-Calvo, J. M. López-Herrera, M. A. Herrada, A. Ramos, and J. M.
Montanero, “Review on the physics of electrospray: From electrokinetics to the
operating conditions of single and coaxial Taylor cone-jets, and AC electrospray,” J.
Aerosol Sci., vol. 125, pp. 32–56, 2018, doi: 10.1016/j.jaerosci.2018.05.002.
[55] G. I. Taylor, “Disintegration of water drops in an electric field,” Proc. R. Soc. Lond. A.
Math. Phys. Sci., vol. 280, no. 1382, pp. 383–397, 1964, [Online]. Available:
http://rspa.royalsocietypublishing.org/content/royprsa/280/1382/383.full.pdf.
[56] J. Russell, “Biosurfactants in electrospinning,” 2015.
[57] A. M. Gañán-Calvo, J. Davila, and A. Barrero, “Current and droplet size in the
electrospraying of liquids. Scaling laws,” J. Aerosol Sci., vol. 28, no. 2, pp. 249–275,
1997.
[58] D. Marinha, C. Rossignol, and E. Djurado, “Influence of electrospraying parameters on
the microstructure of La0.6Sr0.4Co0.2F0.8O 3-δ films for SOFCs,” J. Solid State Chem.,
vol. 182, no. 7, pp. 1742–1748, 2009, doi: 10.1016/j.jssc.2009.04.018.
[59] T. Nguyen and E. Djurado, “Deposition and characterization of nanocrystalline
tetragonal zirconia films using electrostatic spray deposition,” Solid State Ionics, vol.
138, no. 3–4, pp. 191–197, 2001, doi: 10.1016/S0167-2738(00)00795-5.
[60] Ӧzden Çelikbilek, L. Dessemond, and E. Djurado, “State-of-the-art
La0.6Sr0.4Co0.2Fe0.8O3-δ cathode for SOFC: Microstructural and electrochemical
properties,” ECS Trans., vol. 78, no. 1, pp. 747–758, 2017, doi: 10.1149/07801.0747ecst.
[61] R. K. Sharma, M. Burriel, L. Dessemond, J. M. Bassat, and E. Djurado, “Design of
interfaces in efficient Ln2NiO4+δ (Ln = La, Pr) cathodes for SOFC applications,” J.
Mater. Chem. A, vol. 4, pp. 12451–12462, 2016, doi: 10.1039/c6ta04845e.
[62] R. K. Sharma et al., “Highly efficient architectured Pr6O11 oxygen electrode for solid
oxide fuel cell,” J. Power Sources, vol. 419, pp. 171–180, 2019, doi:
10.1016/j.jpowsour.2019.02.077.
[63] R. K. Sharma, M. Burriel, L. Dessemond, V. Martin, J.-M. Bassat, and E. Djurado, “An
innovative architectural design to enhance the electrochemical performance of
La2NiO4+δ cathodes for solid oxide fuel cell applications,” J. Power Sources, vol. 316,
pp. 17–28, 2016, doi: 10.1016/j.jpowsour.2016.03.067.
[64] L. A. Giannuzzi and F. A. Stevie, “A review of focused ion beam milling techniques for

References
144
TEM specimen preparation,” Micron, vol. 30, no. 3, pp. 197–204, 1999, doi:
10.1016/S0968-4328(99)00005-0.
[65] J. Gierak, “Focused ion beam nano-patterning from traditional applications to single ion
implantation perspectives,” Nanofabrication, vol. 1, pp. 35–52, 2014, doi:
10.2478/nanofab-2014-0004.
[66] H. Moussaoui et al., “Stochastic geometrical modeling of solid oxide cells electrodes
validated on 3D reconstructions,” Comput. Mater. Sci., vol. 143, pp. 262–276, 2018, doi:
10.1016/j.commatsci.2017.11.015.
[67] F. Usseglio-Viretta, J. Laurencin, G. Delette, J. Villanova, P. Cloetens, and D. Leguillon,
“Quantitative microstructure characterization of a Ni-YSZ bi-layer coupled with
simulated electrode polarisation,” J. Power Sources, vol. 256, pp. 394–403, 2014, doi:
10.1016/j.jpowsour.2014.01.094.
[68] J. Laurencin, R. Quey, G. Delette, H. Suhonen, P. Cloetens, and P. Bleuet,
“Characterisation of Solid Oxide Fuel Cell Ni-8YSZ substrate by synchrotron X-ray
nano-tomography: From 3D reconstruction to microstructure quantification,” J. Power
Sources, vol. 198, pp. 182–189, 2012, doi: 10.1016/j.jpowsour.2011.09.105.
[69] O. M. Pecho et al., “3D microstructure effects in Ni-YSZ anodes: Prediction of effective
transport properties and optimization of redox stability,” Materials (Basel)., vol. 8, no.
9, pp. 5554–5585, 2015, doi: 10.3390/ma8095265.
[70] J. Rodríguez-Carvajal, “Recent advances in magnetic structure determination by neutron
powder diffraction,” Phys. B, vol. 192, no. 1–2, pp. 55–69, 1993, doi: 10.1016/0921-
4526(93)90108-I.
[71] M. Hubert et al., “Role of microstructure on electrode operating mechanisms for mixed
ionic electronic conductors: From synchrotron-based 3D reconstruction to
electrochemical modeling,” Solid State Ionics, vol. 294, pp. 90–107, 2016, doi:
10.1016/j.ssi.2016.07.001.
[72] T. Tao, J. S. Ro, J. Melngailis, Z. Xue, and H. D. Kaesz, “Focused ion beam induced
deposition of platinum,” J. Vac. Sci. Technol. B, vol. 8, no. 6, p. 1826, 1990, doi:
10.1116/1.585167.
[73] G. Ashiotis et al., “The fast azimuthal integration Python library: pyFAI,” J. Appl.
Crystallogr., vol. 48, pp. 510–519, 2015, doi: 10.1107/S1600576715004306.

References
145
[74] W. De Nolf and K. Janssens, “Micro X-ray diffraction and fluorescence tomography for
the study of multilayered automotive paints,” Surf. Interface Anal., vol. 42, no. 5, pp.
411–418, 2010, doi: 10.1002/sia.3125.
[75] W. De Nolf, F. Vanmeert, and K. Janssens, “XRDUA: Crystalline phase distribution
maps by two-dimensional scanning and tomographic (micro) X-ray powder diffraction,”
J. Appl. Crystallogr., vol. 47, no. 3, pp. 1107–1117, 2014, doi:
10.1107/S1600576714008218.
[76] E. Barsoukov and J. R. Macdonald, Eds., Impedance Spectroscopy: Theory, Experiment,
and Applications, Second Edi. Hoboken, New Jersey: John Wiley & Sons, Inc., 2005.
[77] D. Vladikova, “The technique of the differential impedance analysis part I: Basics of the
impedance spectroscopy,” in Proceedings of the International Workshop “Advanced
Techniques for Energy Sources Investigation and Testing,” 2004, pp. L8-1-L8-28,
[Online]. Available:
https://pdfs.semanticscholar.org/b6ac/e8d1aba6e3e917b590045eacdc6352746b38.pdf.
[78] M. R. Somalu, A. Muchtar, W. R. W. Daud, and N. P. Brandon, “Screen-printing inks
for the fabrication of solid oxide fuel cell films: A review,” Renew. Sustain. Energy Rev.,
vol. 75, pp. 426–439, 2017, doi: 10.1016/j.rser.2016.11.008.
[79] M. Wegener, M. Kato, K. Kakimoto, S. Spallek, E. Spiecker, and A. Roosen, “PVP a
binder for the manufacture of ultrathin ITO/polymer nanocomposite films with
improved electrical conductivity,” J. Mater. Sci., vol. 50, pp. 6124–6133, 2015, doi:
10.1007/s10853-015-9168-9.
[80] D. Marinha, L. Dessemond, and E. Djurado, “Electrochemical investigation of oxygen
reduction reaction on La0.6Sr0.4Co0.2Fe0.8O3-δ cathodes deposited by electrostatic
spray deposition,” J. Power Sources, vol. 197, pp. 80–87, 2012, doi:
10.1016/j.jpowsour.2011.09.049.
[81] Ӧzden Çelikbilek, “Optimisation de la cathode pour pile à oxyde électrolyte solide:
approches expérimentale et numérique,” Université Grenoble Alpes, 2016.
[82] D. Marinha, J. Hayd, L. Dessemond, E. Ivers-Tiffée, and E. Djurado, “Performance of
(La,Sr)(Co,Fe)O3-x double-layer cathode films for intermediate temperature solid oxide
fuel cell,” J. Power Sources, vol. 196, no. 11, pp. 5084–5090, 2011, doi:
10.1016/j.jpowsour.2011.01.063.

References
146
[83] F. Ciucci, “Modeling electrochemical impedance spectroscopy,” Curr. Opin.
Electrochem., vol. 13, pp. 132–139, 2019, doi: 10.1016/j.coelec.2018.12.003.
[84] W. Lai and S. M. Haile, “Impedance spectroscopy as a tool for chemical and
electrochemical analysis of mixed conductors: A case study of ceria,” J. Am. Ceram.
Soc., vol. 88, no. 11, pp. 2979–2997, 2005, doi: 10.1111/j.1551-2916.2005.00740.x.
[85] Ӧzden Çelikbilek, E. Siebert, D. Jauffrès, C. L. Martin, and E. Djurado, “Influence of
sintering temperature on morphology and electrochemical performance of LSCF/GDC
composite films as efficient cathode for SOFC,” Electrochim. Acta, vol. 246, pp. 1248–
1258, 2017, doi: 10.1016/j.electacta.2017.06.070.
[86] J. Fleig, “On the current-voltage characteristics of charge transfer reactions at mixed
conducting electrodes on solid electrolytes,” Phys. Chem. Chem. Phys., vol. 7, no. 9, pp.
2027–2037, 2005, doi: 10.1039/b501086a.
[87] B. A. Boukamp, “Electrochemical impedance spectroscopy in solid state ionics: Recent
advances,” Solid State Ionics, vol. 169, no. 1–4, pp. 65–73, 2004, doi:
10.1016/j.ssi.2003.07.002.
[88] T. Jacobsen, P. V. Hendriksen, and S. Koch, “Diffusion and conversion impedance in
solid oxide fuel cells,” Electrochim. Acta, vol. 53, no. 25, pp. 7500–7508, 2008, doi:
10.1016/j.electacta.2008.02.019.
[89] C. Chen, E. M. Kelder, P. J. J. M. van der Put, and J. Schoonman, “Morphology control
of thin LiCoO2 films fabricated using the electrostatic spray deposition (ESD)
technique,” J. Mater. Chem., vol. 6, no. 5, pp. 765–771, 1996, doi:
10.1039/JM9960600765.
[90] P. Li et al., “A novel La2NiO4+δ-La3Ni2O7-δ-Ce0.55La0.45O2-δ ternary composite
cathode prepared by the co-synthesis method for IT-SOFCs,” Int. J. Hydrogen Energy,
vol. 42, no. 27, pp. 17202–17210, 2017, doi: 10.1016/j.ijhydene.2017.05.202.
[91] F. Zurlo et al., “La0.8Sr0.2Fe0.8Cu0.2O3-δ as ‘cobalt-free’ cathode for
La0.8Sr0.2Ga0.8Mg0.2O3-δ electrolyte,” J. Power Sources, vol. 271, pp. 187–194,
2014, doi: 10.1016/j.jpowsour.2014.07.183.
[92] R. J. Woolley and S. J. Skinner, “Novel La2NiO4+δ and La4Ni3O10-δ composites for
solid oxide fuel cell cathodes,” J. Power Sources, vol. 243, pp. 790–795, 2013, doi:
10.1016/j.jpowsour.2013.06.106.

References
147
[93] M. Cimenti, A. C. Co, V. I. Birss, and J. M. Hill, “Distortions in electrochemical
impedance spectroscopy measurements using 3-electrode methods in SOFC. I-effect of
cell geometry,” Fuel Cells, vol. 7, no. 5, pp. 364–376, 2007, doi:
10.1002/fuce.200700019.
[94] A. Hauch, S. H. Jensen, S. Ramousse, and M. B. Mogensen, “Performance and durability
of solid oxide electrolysis cells,” J. Electrochem. Soc., vol. 153, no. 9, pp. A1741–A1747,
2006, doi: 10.1149/1.2216562.
[95] J. Hjelm, M. Søgaard, M. Wandel, M. Menon, M. B. Mogensen, and A. Hagen,
“Electrochemical impedance studies of SOFC cathodes,” ECS Trans., vol. 7, no. 1, pp.
1261–1270, 2007, doi: 10.1149/1.2729227.
[96] G. Chiodelli and L. Malavasi, “Electrochemical open circuit voltage (OCV)
characterization of SOFC materials,” Ionics (Kiel)., vol. 19, pp. 1135–1144, 2013, doi:
10.1007/s11581-013-0843-z.
[97] M. A. Laguna-Bercero, “Recent advances in high temperature electrolysis using solid
oxide fuel cells: A review,” J. Power Sources, vol. 203, pp. 4–16, 2012, doi:
10.1016/j.jpowsour.2011.12.019.
[98] A. Bertei, G. Arcolini, J. P. Ouweltjes, Z. Wuillemin, P. Piccardo, and C. Nicolella,
“Physically-based deconvolution of impedance spectra: Interpretation, fitting and
validation of a numerical model for lanthanum strontium cobalt ferrite-based solid oxide
fuel cells,” Electrochim. Acta, vol. 208, pp. 129–141, 2016, doi:
10.1016/j.electacta.2016.04.181.
[99] V. Thangadurai, R. A. Huggins, and W. Weppner, “Mixed ionic-electronic conductivity
in phases in the praseodymium oxide system,” J. Solid State Electrochem., vol. 5, pp.
531–537, 2001, doi: 10.1007/s100080000187.
[100] B. M. Abu-Zied, Y. A. Mohamed, and A. M. Asiri, “Fabrication, characterization, and
electrical conductivity properties of Pr6O11 nanoparticles,” J. Rare Earths, vol. 31, no.
7, pp. 701–708, 2013, doi: 10.1016/S1002-0721(12)60345-7.
[101] S. Shrestha, C. M. Y. Yeung, C. Nunnerley, and S. C. Tsang, “Comparison of
morphology and electrical conductivity of various thin films containing nano-crystalline
praseodymium oxide particles,” Sensors Actuators A, vol. 136, no. 1, pp. 191–198, 2007,
doi: 10.1016/j.sna.2006.11.019.

References
148
[102] J. Schefold, A. Brisse, and H. Poepke, “23,000 h steam electrolysis with an electrolyte
supported solid oxide cell,” Int. J. Hydrogen Energy, vol. 42, no. 19, pp. 13415–13426,
2017, doi: 10.1016/j.ijhydene.2017.01.072.
[103] F. Tietz, D. Sebold, A. Brisse, and J. Schefold, “Degradation phenomena in a solid oxide
electrolysis cell after 9000 h of operation,” J. Power Sources, vol. 223, pp. 129–135,
2013, doi: 10.1016/j.jpowsour.2012.09.061.
[104] V. Vibhu, “Stability and ageing studies of Praseodymium-based nickelates as cathodes
for Solid Oxide Fuel Cells,” Université de Bordeaux, 2016.
[105] B. G. Hyde, D. J. M. Bevan, and L. Eyring, “On the praseodymium+oxygen system,”
Philos. Trans. R. Soc. A, vol. 259, no. 1106, pp. 583–614, 1966, doi:
10.1098/rsta.1966.0025.
[106] B. J. Inkson, “Scanning electron microscopy (SEM) and transmission electron
microscopy (TEM) for materials characterization,” in Materials Characterization Using
Nondestructive Evaluation (NDE) Methods, Elsevier Ltd, 2016, pp. 17–43.
[107] B. D. Cullity, Elements Of X-Ray Diffraction. Addison-Wesley Publishing Company,
Inc., 1956.
[108] S. T. Misture, “In situ X-ray diffraction studies of electroceramics,” J. Electroceramics,
vol. 16, pp. 167–178, 2006, doi: 10.1007/s10832-006-6202-y.

APPENDIX A: Scanning electron microscopy
149
APPENDIX A: Scanning electron microscopy
Scanning electron microscopy (SEM) has become in 50 years an indispensable tool in the
exploration of the "infinitely small". It is a technique that produces images of a sample by
scanning the surface with a focused beam of electrons. The interaction of the electron beam
with the atoms in the sample produces various signals which give information on the
topography and composition of the analyzed sample. The schematic illustration of SEM set-up
is shown in Fig. A.1a. The electron beam is produced by an electron gun located on the topmost
part of the set-up. There are several types of an electron gun, namely thermionic gun in which
thermal energy is applied on a filament made of materials with high melting point (e.g. tungsten)
to emit electrons and field emission gun (FEG) where the electrons are extracted by a strong
electric field. There are two kinds of FEG SEM; the first one called the cold cathode which
works at room temperature with an extremely fine tungsten (W) tip and the second one called
Schottky cathode in which the tungsten tip is thermally activated and covered by ZrO2 coating.
The emitted electron beam is then focused by utilizing condenser and objective lenses. These
lenses produce a magnetic field to focus the beam at the surface of the sample at a certain focal
distance with the smallest spot size if the resolution is expected. Following the development
on the resolution of SEM, the resolution of a FEG is now around 1 nm and can be decreased
until 0.5 nm. The beam scans the surface of the sample by a deflection of the electron paths
using a series of scanning coils present in the column and mostly inside the objective lens. The
focused electron beam with energy in the range of 0.2 to 40 keV is then entered the sample
chamber. The sample chamber is under a secondary vacuum to prevent interaction between the
electron beam and the air molecules. In the sample chamber, several detectors are placed to
record the signals coming from the interactions between the electron beam and the atoms in
the sample.

APPENDIX A: Scanning electron microscopy
150
Fig. A.1 (a) The schematic illustration of SEM set-up (Inkson, 2016) [106] and (b) the various
interactions between the electron beams and the atoms in the sample (from
https://www.vcbio.science.ru.nl/en/fesem/eds/).
Fig. A.1b shows the various interactions between the electron beam and the sample. Panel A
shows the penetration of the electron beam (referred to as the primary electrons) in the electron
shell of the atoms. The energy of these primary electrons is able to eject the electrons due to an
inelastic interaction from the shell close to the surface of the analyzed sample. These emitted
electrons are called secondary electrons (SE). The number of emitted secondary electrons is
directly related to the topography of the sample because the escape distance is less than 10 nm
from the surface, thus the secondary electron detection is used to reconstruct the topographical
image of the sample surface. In panel B, back-scattered electrons (BSE) from the elastic
scattering of the primary electrons are shown. This scattering happens at deeper locations,
around 10-100 nm depth, from the sample surface. Elastic scattering occurs when the kinetic
energy of the electrons is conserved upon interaction, but the propagation direction is modified.
The resolution of BSE images is not as good as SE images because the emission area of BSE
is larger than SE. However, BSE is directly correlated to the atomic number of the sample.
Thus, BSE images can be used to observe the distribution of different elements or phases
present in the sample. However, the identity of the elements cannot be concluded from BSE
images. Panels C, D, E show that when the electrons inner electron shells are ejected by the
primary electrons, electrons at higher energy levels can fill the electron holes on that inner
shells and release energy. The released energy can be in the form of either light or X-ray and
called characteristic light (cathodoluminescence, CL) and X-ray, respectively. CL can be used
for high-resolution optical imaging of the sample. The energy of characteristic X-ray is specific
(a) (b)

APPENDIX A: Scanning electron microscopy
151
for each chemical element; thus it can be used to identify and quantify the elements present in
the sample by coupling SEM with energy-dispersive X-ray spectroscopy (EDX). Lastly, panels
F, G, H show the energy release due to the emission of Auger electrons which occurs very close
to the sample surface. Auger electrons are ejected from the outer electron shells due to the
energy from the filling of electron holes described previously. The released energy is also
characteristic of each atom.

APPENDIX B: Laboratory X-ray diffraction (XRD): room temperature and in-situ XRD
152
APPENDIX B: Laboratory X-ray diffraction (XRD): room temperature and in-situ XRD
X-ray diffraction (XRD) is an analytical and non-destructive technique to identify the atomic
and molecular structure of a crystalline phase. It provides information on the identity and
quantity of phases in the sample. The structural parameters such as crystallite size, crystallinity,
strain, and crystal defects can also be obtained. XRD can also be used to observe the preferred
texture (crystal orientation).
The principle of XRD is based on the diffraction of an incident beam upon interaction with
well-ordered atoms in a crystal to many specific directions. X-rays are waves of
electromagnetic radiation and thus, it is scattered upon interaction with atoms through elastic
scattering. It means that the waves are scattered in all directions as secondary waves which
have the same kinetic energy, thus, the same wavelength, as the incident X-ray waves. The
scattered waves cancel each other out in most directions due to the destructive interference,
except in a few specific directions where they interfere constructively and increase the intensity.
These specific directions are determined by the so-called Bragg’s Law:
2𝑑ℎ𝑘𝑙 sin 𝜃 = 𝑛𝜆 (Eq. B.1)
In this equation, dhkl is the interplanar distance, θ is the angle of the incident beam with respect
to the hkl lattice planes or also called diffraction angle, n is an integer number, and λ is the
wavelength of the X-ray beam. The graphical illustration behind the explanation of this
equation is presented in Fig. B.1a. To begin the explanation, it is important to first understand
about the crystal itself. Crystal is defined as a solid composed of three-dimensional periodic
patterns of atoms [107]. In crystallography, crystal is built up on a framework consisting of a
set of imaginary points that has a fixed relation in space to the actual atoms in the crystal. Each
point has identical surroundings and is called as point lattice. These points are arranged in
three-dimensional arrays and form three sets of lattice planes as indicated by the yellow arrow
in Fig. B.1b. The planes in each set are parallel and equally spaced. The smallest repeating
group of point lattices which has the symmetry of the crystal structure is called a unit cell as
highlighted in red in Fig. B.1b. The unit cell has various possible shapes depending on the way
the three lattice planes are arranged with respect to each other. The size and shape of the unit
cell are defined by three vectors (a, b, c) taken from a reference point (indicated in bold in Fig.
B.1c). These vectors are called the crystallographic axes. The crystal is built from the repetitive
translation of the unit cell along these axes. The lengths of the vectors (a, b, c) and the angles

APPENDIX B: Laboratory X-ray diffraction (XRD): room temperature and in-situ XRD
153
between them (α, β, γ) are called the lattice parameters or lattice constants or cell parameters.
The orientation of the planes in a lattice is usually indicated by Miller indices which are the
integers h, k, and l. The miller indices are determined from the intercepts of the plane with the
crystallographic axes at a/h, b/k, and c/l.
Back to the diffraction mechanism of X-ray diffraction, constructive interference occurs when
the X-ray beam is scattered at the same angle as the incident beam (specular angle) and the
scattered beams should remain in phase. Since the interplanar distance in a crystal is equal for
each hkl-plane, the difference in the path length of the scattered beam from different hkl-planes
should be equal to the integer multiple n of the wavelength (Fig. B.1a). By applying a simple
trigonometric function based on these conditions, Bragg’s equation (Eq. B.1) is obtained. The
diffraction condition can be determined from this equation. For a specific wavelength of the
X-ray beam, the diffraction angle θ depends only on the interplanar distance dhkl. Since every
crystalline compound has different dhkl, the diffraction angles provide precise information on
the identity of the phases in the sample. Besides, the quantity of the phases can be calculated
from the intensity.

APPENDIX B: Laboratory X-ray diffraction (XRD): room temperature and in-situ XRD
154
Fig. B.1 (a) The graphical illustration of the X-ray beam scattering in constructive interference
(taken from https://fys.kuleuven.be/iks/nvsf/experimental-facilities/x-ray-diffraction-2013-
bruker-d8-discover), (b) the representation of lattice, and (c) a unit cell.
In the laboratory set-up, the incident X-ray beam is produced from an X-ray tube source. It
consists of a cathode and a metal plate (copper is the widely used one) as the anode. The
electrons in the cathode are accelerated by a high electric field and collide with the metal plate
anode at high velocity releasing X-ray. Since the X-ray is generated in various wavelength, a
monochromator is used to single out a wavelength. Afterwards, it is collimated in a single
direction before it is used for the characterization. A 1D, point detector is used to record the
intensity of the diffracted beams.
The laboratory XRD characterization is normally carried out in Bragg-Brentano geometry or
also called reflective geometry. There are two possible configurations: either the X-ray tube
source is fixed while the sample and the detector is rotated by θ and 2θ, respectively, or both
X-ray tube and the detector is rotated from -θ to θ. In either setup the detector records the
intensity of the diffracted beams on every 2θ angle, resulting in the diffraction pattern called
diffractogram which shows the diffraction peaks of phases present in the sample. To use the
Unit cell
Point lattice
Lattice plane
a
b
c
ab
c
αβ
γ
(b)
(a)
(c)

APPENDIX B: Laboratory X-ray diffraction (XRD): room temperature and in-situ XRD
155
obtained pattern for structural analysis, one of the vastly used technique is Rietveld refinement.
This technique used the least square approach to fit the measured patterns with the theoretical
ones. The refinement resulting in the information on the position, amplitude, and width of the
diffraction peaks and can be used for various structural analyses.
Besides measurement at ambient condition, XRD can also be performed in non-ambient
conditions such as under temperature, pressure, electric field, etc. As explained by Misture
[108], this in-situ characterization provides information on the dynamic of the materials under
external variables. To do in-situ XRD, a specific chamber is required depending on the type of
environmental control that is planned.

APPENDIX C: Electrochemical characterization technique: Electrochemical impedance
spectroscopy (EIS)
156
APPENDIX C: Electrochemical characterization technique: Electrochemical impedance
spectroscopy (EIS)
The equivalent electrical elements:
(i) Lumped element: resistance 𝑅.
As has been previously mentioned, there is no phase difference (𝜃 = 0) between the
voltage and current for a pure resistance. Consequently, from Eq. 2.4, the impedance
(which, in this case, equals the resistance) only consists of the real part with the magnitude
of |𝑍|, as shown in Eq. 2.6. Thus, resistance for each frequency is plotted along the 𝑥-axis
in the Nyquist plot (Fig. C.1a). The resistance value explains the energy losses in the
system, for example the ohmic losses due to the electrolyte resistance.
𝑍𝑅(𝜔) = |𝑍| = 𝑅 (Eq. C.1)
Fig. C.1 The Nyquist representation of (a) resistance (𝑅), (b) inductance (𝐿), and (c)
capacitance (𝐶) (Vladikova, 2004) [77].
(ii) Lumped element: inductance 𝐿.
The inductance is characterized by a +90° phase shift (𝜃) between current and voltage.
From the Fourier transform of the Faraday’s law of induction, the impedance related to
inductance is given by Eq. C.2. Thus, inductance only has an imaginary part. The
impedance has a positive value for positive inductance which means that it is plotted in a
Nyquist plot as a vertical line below the 𝑥-axis (Fig. C.1b). Inductance element is used to
model the contribution due to the accumulation of magnetic energy and movement of the
charge carrier, thus it normally used to attribute the contribution from the connecting wires.
𝑍𝐿(𝜔) = 𝑗𝜔𝐿 (Eq. C.2)
(b) (c)(a)

APPENDIX C: Electrochemical characterization technique: Electrochemical impedance
spectroscopy (EIS)
157
(iii) Lumped element: capacitance 𝐶.
The current and voltage in capacitance is -90° out of phase. The impedance related to
capacitance is obtained from the Fourier transform of current-capacitance relation,
resulting in Eq. C.3. As in an inductance, a capacitance also only consists of the imaginary
part. However, contrary to an inductance, it has a negative value for positive capacitance.
In a Nyquist plot, it is plotted as a vertical line above the 𝑥-axis (Fig. C.1c). Capacitance
can be related to the contribution coming from the accumulation of electrostatic energy
and charge carriers.
𝑍𝐶(𝜔) =1
𝑗𝜔𝐶=
−𝑗
𝜔𝐶 (Eq. C.3)
(iv) Frequency-dependent element: constant-phase element 𝐶𝑃𝐸.
Constant-phase element (CPE) is a circuit element that takes into account various factors
on a real electrode such as surface roughness and thickness variations. The impedance
equation is given by Eq. C.4. In this equation, 𝑄 is called the factor of proportionality
which is the value of the admittance (1/|𝑍|) at 𝜔 = 1 rad/s and 𝛼 is the exponent of CPE
with the value between 0 and 1. CPE has a constant, independent of frequency, phase angle
(𝜃) of −(𝛼 × 90)°, as indicated by the Nyquist plot in Fig. C.2. The impedance of CPE
resembles capacitance when the value of 𝛼 is close to 1. CPE can be used to fit many
experimental data which can be fitted by other elements. However, since the exact nature
of CPE itself is not clear, especially at very high or very low frequency, data fitting using
this element should be used only as a basis for the modelling.
𝑍𝐶𝑃𝐸(𝜔) =1
𝑄(𝑗𝜔)𝛼 (Eq. C.4)
Fig. C.2 The Nyquist plot of a constant-phase element (𝐶𝑃𝐸). The arrow indicates the
increasing frequency.
−𝛼𝜋
2
Re[Z]
-Im
[Z]

APPENDIX C: Electrochemical characterization technique: Electrochemical impedance
spectroscopy (EIS)
158
(v) Frequency-dependent element: Warburg 𝑊 and finite-length Warburg 𝐹𝐿𝑊.
Warburg element is used to describe a semi-infinite linear diffusion process. It is derived
from the second Fick’s law of diffusion, yielding on impedance equation indicated by Eq.
C.5. The real and imaginary parts of the impedance are equal; thus the phase angle is 45°
and independent of the frequency as shown in Fig. C.3a.
𝑍𝑊(𝜔) =√2𝜎
√𝑗𝜔 (Eq. C.5)
Fig. C.3 The Nyquist plot of (a) Warburg (𝑊) and (b) finite-length Warburg (𝐹𝐿𝑊). The
arrow indicates the increasing frequency.
Finite-length Warburg (FLW) element is used for linear diffusion on a finite electrode
thickness since no real system has an electrode with infinite thickness as described by the
Warburg element. The equations related to this element are given by Eq. C.6-C.8 and the
Nyquist plot is presented in Fig. C.3b.
𝑍𝐹𝐿𝑊(𝜔) = 𝑅𝐹𝐿𝑊
𝑡𝑎𝑛ℎ(√𝑗𝜔𝜏𝐹𝐿𝑊)
√𝑗𝜔𝜏𝐹𝐿𝑊
(Eq. C.6)
𝜔𝑝𝜏𝐹𝐿𝑊 = 2.54 → 𝑓𝑝 = 2.54
2𝜋𝜏𝐹𝐿𝑊 (Eq. C.7)
𝜏𝐹𝐿𝑊 = 3𝑅𝐹𝐿𝑊𝐶𝐹𝐿𝑊 (Eq. C.8)
(vi) Frequency-dependent element: Gerischer 𝐺 and fractal (modified) Gerischer 𝐺𝑓.
Gerischer element was initially used to explain the homogeneous electrochemical
reactions in aqueous electrolytes. However, Adler, et.al. [29] show that the mathematical
−𝜋
4
2.54
2𝜋𝜏𝐹𝐿𝑊-Im
[Z]
-Im
[Z]
Re[Z] Re[Z]
(a) (b)
𝑅𝐹𝐿𝑊

APPENDIX C: Electrochemical characterization technique: Electrochemical impedance
spectroscopy (EIS)
159
expression of the Gerischer element can also be used to explain the processes on a porous
MIEC electrode, as explained by the Adler-Lane-Steele (ALS) model (§1.2.2). Gerischer
element provides the physical explanation for a non-charge-transfer process such as
oxygen surface exchange (chemical reaction) combined with the solid-state diffusion (with
the electrochemical reaction is taken at equilibrium). Eq. C.9-C.10 show the impedance
equation and the relation between the frequency at the peak of the impedance arc with 𝑅𝐺
and 𝐶𝐺 for this element. The plot of Gerischer element has a characteristic of linear line
with an angle of 45° from 𝑥-axis at high frequency, resembling the Warburg element (Fig.
C.4a).
𝑍𝐺(𝜔) = 𝑅𝐺
√1 + 𝑗𝜔𝜏𝐺
(Eq. C.9)
𝜔𝑝𝜏𝐺 = 𝜔𝑝𝑅𝐺𝐶𝐺 = √3 → 𝑓𝑝 = √3
2𝜋𝑅𝐺𝐶𝐺 (Eq. C.10)
Fig. C.4 The Nyquist plot of (a) Gerischer (𝐺) and (b) fractal Gerischer (𝐺𝑓). The arrow
indicates the increasing frequency.
Several deviations from the ideal Gerischer might take place in the electrode resulting in
the deformation of the shape of the response by a factor called 𝛼 (0 < 𝛼 < 1). This deviation
resulting in an element called fractal Gerischer (𝐺𝑓) with the impedance equation shown
in Eq. C.11. As indicated by Fig. C.4b, the shape of the fractal Gerischer is more depressed
as the value of 𝛼 is closer to 0.
𝑍𝐺𝑓(𝜔) =
𝑅𝐺𝑓
(1 + 𝑗𝜔𝜏𝐺𝑓)𝛼 2⁄
(Eq. C.11)
3
2𝜋𝜏𝐺−𝜋
4
Re[Z] Re[Z]
-Im
[Z]
-Im
[Z]
(a) (b)
𝛼
𝑅𝐺 𝑅𝐺𝑓

APPENDIX C: Electrochemical characterization technique: Electrochemical impedance
spectroscopy (EIS)
160
The Gerischer element derived from ALS model can be used under several assumptions:
(i) the electrode should have a thickness larger than the theoretical diffusion length (i.e.
the active layer where the reactions take place), (ii) the diffusion length should be larger
than the average particle size, and (iii) the limiting step of the electrode kinetics should be
the O2 exchange at electrode/gas interface and transport of O2- across the electrode through
solid-state diffusion. Deviation from one of these assumptions leads to the response related
to fractal Gerischer.
(vii) Examples of common complex elements: resistance in parallel with capacitance 𝑅//𝐶 and
constant phase element 𝑅//𝐶𝑃𝐸.
One of the most common equivalent circuit used to model the impedance response is 𝑅//𝐶
element. It describes the response of a simple charge-transfer electrode with an assumption
that it is not limited by a diffusion process. The capacitance shows the double-layer
charging while the resistance corresponds to the Faradaic impedance. The impedance
equation is given by Eq. C.12. In the Nyquist plot, it is represented as a half-circle with a
diameter of 𝑅 (Fig. C.5a). The relation between the frequency at the peak of the half-circle
with 𝑅 and 𝐶 is given on Eq. C.13.
𝑍𝑅𝐶(𝜔) =𝑅
1 + 𝑗𝜔𝜏𝑅𝐶=
𝑅
1 + 𝑗𝜔𝑅𝐶 (Eq. C.12)
𝜔𝑝𝜏𝑅𝐶 = 𝜔𝑝𝑅𝐶 = 1 → 𝑓𝑝 = 1
2𝜋𝑅𝐶 (Eq. C.13)
Fig. C.5 The Nyquist plot of (a) 𝑅//𝐶 and (b) 𝑅//𝐶𝑃𝐸. The arrow indicates the increasing
frequency.
1
2𝜋(𝑅𝑄)1 𝛼⁄
(a) (b)
𝑅
2
𝑅
2
𝑅 𝑅
1
2𝜋𝑅𝐶

APPENDIX C: Electrochemical characterization technique: Electrochemical impedance
spectroscopy (EIS)
161
Another common complex element is 𝑅//𝐶𝑃𝐸 which is adapted due to the appearance of
a depressed semi-circle instead of half-circle on the Nyquist plot of some systems (Fig.
C.5b). The impedance equation and the relation between the frequency at the peak of the
semi-circle with 𝑅 and 𝑄 for this element are given by Eq. C.14-C.15. When the value of
𝛼 is close to 1, it resembles the equations for an 𝑅//𝐶 element. The ‘true’ capacitance can
be calculated based on Eq. C.16.
𝑍𝑅//𝐶𝑃𝐸(𝜔) = 𝑅
1 + 𝑅𝑄(𝑗𝜔)𝛼 (Eq. C.14)
𝑓𝑝 = 1
2𝜋(𝑅𝑄)1 𝛼⁄ (Eq. C.15)
𝐶 =(𝑅𝑄)1/𝛼
𝑅 (Eq. C.16)