microwave spectrum and rotational isomerism of ethyl nitrate
TRANSCRIPT
Microwave spectrum and rotational isomerism of ethyl nitrateDon G. Scroggin, Jose M. Riveros, and E. Bright Wilson Citation: The Journal of Chemical Physics 60, 1376 (1974); doi: 10.1063/1.1681207 View online: http://dx.doi.org/10.1063/1.1681207 View Table of Contents: http://scitation.aip.org/content/aip/journal/jcp/60/4?ver=pdfcov Published by the AIP Publishing Articles you may be interested in Rotational Isomerism in 1Pentyne from the Microwave Spectrum J. Chem. Phys. 56, 166 (1972); 10.1063/1.1676843 Microwave Spectrum and Rotational Isomerism of Ethyl Formate J. Chem. Phys. 46, 4605 (1967); 10.1063/1.1840610 Rotational Isomerism and Microwave Spectroscopy. II. The Microwave Spectrum of Butyronitrile J. Chem. Phys. 37, 2918 (1962); 10.1063/1.1733117 Rotational Isomerism and Microwave Spectroscopy. I. The Microwave Spectrum of Normal Propyl Fluoride J. Chem. Phys. 37, 283 (1962); 10.1063/1.1701318 Microwave Spectrum and Internal Rotation of Ethyl Cyanide J. Chem. Phys. 31, 1500 (1959); 10.1063/1.1730643
This article is copyrighted as indicated in the article. Reuse of AIP content is subject to the terms at: http://scitation.aip.org/termsconditions. Downloaded to IP:
129.120.242.61 On: Sat, 22 Nov 2014 13:39:43
Microwave spectrum and rotational isomerism of ethyl nitrate*
Don G. Scroggint
Thompson Chemical Laboratory, Williams College, Williamstown, Massachusetts 01267
Jose M. Riveros* and E. Bright Wilson
Mallinckrodt Chemical Laboratory, Harvard University, Cambridge, Massachusetts 02138 (Received I October 1973)
The existence of two rotational isomers of ethyl nitrate (CH3CH20NO,) has been confirmed by gas phase microwave spectroscopy. The isomers are designated trans and gauche to indicate the relative positions of the CH3- and -N02 groups. In the trans form all the heavy atoms lie in a plane. The gauche form differs from the trans by a rotation about the C-O bond of 95° and by an opening of the CON angle by "" 3°; both changes appear to indicate considerable nonbonded interaction of the CH3- and -N02 groups. Stark effect measurements determined the dipole moments to be: M'rans = 3.39 D and fLgauche=3.23 D. The gauche form is less stable by 143± 70 em-I. Several low-lying excited states of the torsional vibration have been assigned for each form. A four-term potential function for internal rotation about the C-O bond was determined. The uncertainties and error limits of a four-term potential function are discussed.
I. INTRODUCTION
Recent studies of molecules by microwave spectroscopy have yielded information about their potential energy barriers to internal rotation. 1 These studies should provide valuable checks on the predictive powers of several theoretical methods of calculating conformational energies. 2
Most of the studies of rotamers by microwave spectroscopy have involved rotation about a C-C single bond. Ethyl formate, whose two isomers differ by rotation about a C -0 bond, was recently studied and the potential function determined. Id Ethyl nitrate is structurally similar to ethyl formate, and the internal rotation of interest also involves rotation about a C -0 bond. Two rotamers are expected, trans and gauc he, as shown in Fig. 1. The Simpler homolog, methyl nitrate, has been studied3 and showed a twofold barrier for rotation for the -N02 group.
This paper concerns the microwave spectrum, structure, dipole moment, rotational isomerism, and potential barrier to internal rotation about the C -0 bond of ethyl nitrate.
No structural study of the two rotamers of ethyl nitrate has been done, although the molecule has been observed by ultraViolet, 4 nuclear magnetic resonance,5,6 and infrared7 spectroscopies_ No information on potential barriers was obtained from these studies.
II. EXPERIMENTAL
Reagent-grade ethyl nitrate from Eastman Kodak was used for these stUdies without further purification. The microwave spectrum was studied at dry-ice temperature with a free-running klystron in a conventional microwave spectrometer8 using 80 kHz square-wave Stark modulation and phase-sensitive detection with both oscilloscope and recorder displays. a- and b-type transitions were observed for both trans and gauche isomers in the region 8 to 40 GHz.
Frequency measurements were made by using harmonics of a phase-locked General Radio 1360B Oscillator (1. 7 to 4.1 GHz) to which rf sidebands were added from a Hewlett-Packard 3200B VHF oscillator. The frequencies of the phase-locked low frequency klystron and the rf oscillator were read directly on a HewlettPackard 5246L electronic counter, which was calibrated against the Atomichron 1 MHz frequency standard in the Cruft Physics Laboratory at Harvard. The frequency pips were generated by a Collins 51J4 receiver set at 2.00 MHz. For strong absorption lines with well-defined peaks, the frequency measurements were reproducible to ± O. 02 MHz.
Relative intensity measurements were recorded using the standard techniques of Esbitt and Wilson. 9 A modified version of the Narath and Gwinn phase-lock stabilization system10 was used for very slow sweeps of the phase-stabilized spectrometerll over certain regions of interest. A Hewlett Packard 8460A microwave rotational resonance (MRR) spectrometer12 was used for the relative intensity measurements at room temperature.
Dipole moment measurements were performed by adding the normal 80 kHz square-wave modulation onto a dc bias of 0-500 V (from a Lamda model 71 regulated power supply). This method has the advantage of very accurate measurement of the stable dc bias even at low voltages.
III. ASSIGNMENT OF THE GROUND STATE SPECTRA OF TRANS AND GAUCHE ETHYL NITRATE
By simple extension of the structural parameters of methyl nitrate3 trial values of the moments of inertia were generated for ethyl nitrate in the planar form and for several dihedral angles of the C -0 torsion. The high K.l> a-type pile-ups of transitions were observed under low resolution with the Hewlett-Packard commercial microwave spectrometer. These pile-ups are spaced by approximately (B+C) for near prolate tops. The complete spectrum of R -branCh, a -type transitions for
1376 The Journal of Chemical Physics, Vol. 60, No.4, 15 February 1974 Copyright © 1974 American Institute of Physics This article is copyrighted as indicated in the article. Reuse of AIP content is subject to the terms at: http://scitation.aip.org/termsconditions. Downloaded to IP:
129.120.242.61 On: Sat, 22 Nov 2014 13:39:43

Scroggin, Riveros, and Wilson: Microwave spectrum of ethyl nitrate 1377
Trans rota mer
Gauche rotamer
FIG. 1. Conformations of trans and gauche rotamers of ethyl nitrate.
both trans and gauche rotamers was then measured and assigned by conventional, high resolution techniques.
Fortunately, the K of ethyl nitrate is - O. 912 for trans and - O. 891 for gauche-values sufficiently different from -1 to give appreciable A dependence in the a-type transitions of each rotamer. Much weaker b-type transitions for each rotamer were found usually less than 20 MHz from their predicted frequencies, and their assignment determined the rotational constant A within 0.1 MHz. The spectra of observed a- and b-type transitions of the ground states of the trans gauche rotamers are included in Table I and Table II, respectively. The assignment of the low J transitions was confirmed by detailed observation of their stark components and by some microwave-microwave and radio frequency-microwave double resonances. The rotational constants of all the states of both isomers, treated as rigid rotors, were obtained by a least squares fitl3 of the observed transitions.
No resolvable splittings of any of the ground state lines was observed, although some of the low J lines appeared broader than expected. Slow sweeping over these lines with the phase-stabilized spectrometer failed to yield any resolvable splitting. Splitting of the lines could arise from several sources: quadrupole coupling of the N nu-
cleus (I = 1) with the rotational angular momentum, appreciable tunneling through the barrier separating the two equivalent gauche forms, or tunneling of the eR3
group.
TABLE 1. Assigned spectrum of trans ethyl nitrate.
Ground state Transition Observed J.I (MHz) Calculated J.I (MHz)
a-types
202 -101 8106.07 8106.00 211 -110 8474.58 8475.18 313 -212 11634.05 11633.94
303 - 202 12129.11 12129.00 322 -221 12177.56 12177.05 321 -220 12224.94 12225.10 312 -211 12705.19 12705.11 414 -313 15498.52 15498.45 404 -303 16116.59 16116.53 423 -322 16226.83 16226.70 422 -321 16346.14 16346.24 413 -312 16925.61 16925.50 515 -414 19352.21 19352.17 505 -404 20058.44 20058.40 524 - 423 20268.31 20268.34 523 -422 20504.90 20504.98 514 -413 21132.63 21132.57 616-515 23193.31 23193.27
606 - 505 23947.22 23947.18 625 -524 24299.96 24299.98 624 -523 24706.84 24706.74 615 -514 25321. 90 25322.00 711 - 616 27020.51 27020.49
707 - 606 27779.83 27779.79 726 - 625 28319.49 28319.64 725 - 624 28952.40 28952.48 716 -615 29488.96 29488.84 818 -711 30833.03 30833.12 808 -707 31558.72 31588.80 827 -726 32325.39 32325.59 826 -725 33237.25 33237.46 817 -716 33627.25 33627.40 919 -818 34630.82 34631.02
909 - 80B 35291. 91 35292.19 928 - 827 36315.60 36315.89 927 - 826 37551. 01 37551.36 91B -817 37730.23 37731.27
100•10 - 909 38991. 07 38991.64
b-types
221 -110 31775.82 31775.79 423 -414 25643.36 25643.42 515 -404 25660.92 25660.80 615 -606 12327.32 12327.31 625 - 616 27666.37 27666.31 716 -707 14036.17 14036.37
711 - 606 31868.85 31868.98
817 - 808 16104.91 16105.00 808 -711 27469.55 27469.66 818-707 34922.16 34922.30 927 - 918 19904.28 19904.32
The calculated frequencies are for the following rotational constants:
A =9974. 95 ± 0.02 MHz B=2208.08±0.01 MHz C = 1850.94 ± 0.01 MHz
The observed frequencies have an estimated uncertainty of ±0.05 MHz.
J. Chern. Phys., Vol. 60, No.4, 15 February 1974 This article is copyrighted as indicated in the article. Reuse of AIP content is subject to the terms at: http://scitation.aip.org/termsconditions. Downloaded to IP:
129.120.242.61 On: Sat, 22 Nov 2014 13:39:43
1378 Scroggin, Riveros, and Wilson: Microwave spectrum of ethyl nitrate
TABLE II. Assigned spectrum of gauche ethyl nitrate.
Ground state Transition Observed J.I (MHz) Calculated J.I (MHz)
a-types
212 -111 9327.94 9327.79 202 -101 9615.93 9615.84 211 -110 9928.32 9928.30 313 -212 13984.32 13984.21 303 -202 14393.50 14393.39 322 -221 14442.53 14442.06 321 -220 14490.45 14490.74 312 -211 14884.69 14884.66 414 -313 18632.04 18632.08 404 -303 19135.34 19135.27 423 -322 19246.76 19246.59 422 -321 19367.08 19367.40 413 -312 19831.16 19831.24
515- 414 23269.19 23269.25 505 -404 23831. 90 23831. 96 524 -423 24043.07 24043.00 523 -422 24280.63 24281.10 514 -413 24763.84 24764.04
616 - 515 27893.75 27894.12
60s-505 28477.56 28477.70 625 "-- 524 28828.96 28829.29 634 -533 28942.56 28942.85 633 -532 28960.17 28960.09 624 -523 29234.65 29235.49 615 -514 29677.85 29678.41 701 -606 33071.89 33072.34 725 -624 34227.03 34228.52 716 -615 34567.98 34568.94 808 --701 37621.19 37622.20
821 - 726 38362.37 38363.86 817 -716 39428.39 39429.40
b-types
826-811 13876.38 13875.90 322 -313 17523.55 17524.06 514 -404 31952.76 31952.46
The calculated frequencies are for the following rotational constants:
A =7945. 62 ± O. 02 MHz B=2557.14±0.01 MHz C =2256. 88± O. 01 MHz
The observed frequencies have an estimated uncertainty of ±0.05 MHz.
Table III lists the observed rotational constants and moments of inertia and the moments of inertia calculated from the assumed structures shown in Table IV.
IV. VIBRATIONAL SATELLITE SPECTRA AND RELATIVE INTENSITIES
A. Trans satellites
A series of lines of decreasing intensity was observed to high frequency for each trans, a-type transition of the ground state. The Stark effects, when resolvable, were the same as for the ground state line. The decreasing intensities of the lines as they became farther displaced from the ground state lines indicated that they were probably the corresponding rotational transitions in low-lying, excited vibrational states. More than one mode was apparent from the irregular spacings of the lines, and often three or four satellites appeared in a single 20 MHz sweep of the crowded spectrum.
A good fit to rigid rotor spectra was obtained for four excited states (labeled TAl, TBI, TA2, and TB2). A weaker satellite set to low frequency (TCI) was also assigned to rotational constants. The predicted and observed frequencies for these five excited states are given in Table V, together with the determined rotational constants. As might be expected from the extreme nearness of the satellite spectra to that of the trans ground state, the changes in rotational constants with vibrational state are very small.
Relative intensity measurements of the trans vibrational satellites indicated two low-lying vibrational states of nearly the same energy (labeled TAl and TBI) and two states at approximately twice this energy. One interpretation of this pattern is that these are the first and second excited states of two low-lying Vibrations-possibly the C -0 torsion and either the - N02 torsion or a low frequency in plane skeletal bend. There may be some interaction between these two modes which could account for the irregular changes in rotational constants for the excited states. Higher excited states of these vibrational modes could not be assigned, in spite of much searching. Table VI gives the energy-differences of the vibrationally excited states from the ground states. 14 The energy differences indicate that a reasonable assignment is:
TAl, T A2 first and second excited states of one mode (C-O torSion).
TBI, TB2 first and second excited states of second mode (-N02 torSion or in plane skeletal bend).
TCl undesignated.
TABLE III. Rotational constants and moments of inertia for trans and gauche ethyl nitrate.
Trans Gauche Obs. Calc. % Dif. Obs. Calc. % Dif.
A 9974.95 9989.35 0.14 7945.62 7951.97 0.08 A B 2208.08 2206.79 0.06 2557.14 2567.41 0.40 B C 1850.94 1849.66 0.07 2256.88 2255.79 0.05 C K - O. 9123 -0.8906 K
bp - O. 0224 - O. 0281 bp Ia 50.665 50.592 63.604 63.554 Ia Ib 228.876 229.010 197.634 196.843 Ib Ie 273.038 273.227 223.927 224.035 Ie
The conversion factor is: (Rotational constant) xI=505377 amu ,\2 MHz.
J. Chem. Phys., Vol. 60, No.4, 15 February 1974 This article is copyrighted as indicated in the article. Reuse of AIP content is subject to the terms at: http://scitation.aip.org/termsconditions. Downloaded to IP:
129.120.242.61 On: Sat, 22 Nov 2014 13:39:43

Scroggin, Riveros, and Wilson: Microwave spectrum of ethyl nitrate 1379
TABLE IV. Proposed structure for trans and gauche ethyl nitrate.
Bond Distances
N-O(1 )
N-0(2)
o 1.215 A
1.215
N-0(4) 1.407
C(5)-0(4) 1.430
C(8)- C(5) 1. 528
C-H 1.089
Bond Angles
Trans Gauche
0(4)-N;-O(l) 1180 1190
0(4)-N-0(2) 1W 110 0
C(5)-0(4)-N 1W 114 0
C(8)-C(5)-0 109470
All methyl bonds tetrahedral
Dihedral Angle e of Rotation about
C(5)-0(4): etrans = 0
- + 3° egauche - 95-
Table VII summarizes the energy parameters of ethyl nitrate and two similar molecules of interest: ethyl formate and methyl nitrate. The frequency of the - N02
torsion for methyl nitrate is reported as 130 ± 20 cm~l. A value for the - N02 torsion in ethyl nitrate of 114 cm,l (TBl) is reasonable, since the addition of another methyl group is not expected to alter appreciably the double bond character of the CO-N bond, and the increase in the reduced moment of inertia should lower somewhat the frequency of this torsional vibration. A similar argument was used in the assignment of the torsional satellites of ethyl formate from the reported values for methyl formate. 1d
No b-type transition satellites were found, but they were expected to be beyond the sensitivity of the spectrometer.
The identification of vibrational satellites was assisted by calculating Av/(J + 1)'" 2AB for each suspected satellite, where Av is the shift from ground state frequency and A B is the change of B on vibrational excitation. 15
For a near prolate rotor, a-type transitions should show near constancy of A B for the same excited state but differentJ. Table VIII lists the Av/(J+1) values for several families of lines of the trans rotamer.
B. Gauche satellites
The vibrational satellites of gauche ethyl nitrate were displaced farther than the trans satellites, but were found to the high frequency side of each transition. Only one mode was apparent, and the satellites formed a reg-
TABLE V. Assigned transitions for vibrationally excited states of trans ethyl nitrate.
Transition
313 - 212 303 - 202 322 - 221 321 -220 423 -322 422 -321 413 -312 515- 414 505 -404 524 -423 523- 422 514 -413 616 -515 606 - 505 625 - 524 624 -523 615- 514
717 - 616 707 - 606 726 - 625 725 - 624 716 - 6t5 818 -717 808 -707 826 - 725 909 - 808
313 -212 303 - 202 423 -322 422 -321 413 -312 524 -423 514 -413 616-515 606 - 505 625 -524 624 -523 615 -514 717 -616 707 - 606 726 - 625 818 - 717 80a -707 826 -725 909 - 808 514 -413 616- 515 615 -514 717 -616 716 - 615 Bta- 717 80a -707 909 - 80a
TAl Obs. v
12132.73 12180.28 12228.41 16231. 20 16349.33 16928.72 19358.22
20273.92 20508.18 21136.96 23201.10 23957.65 24306.86 24709.63 25327.55 27030.31 27793.51 28327.75 28954.55 29496.21
31576.20 33238.36 35313.50
11644.29 12138.46 16238.16 16354.63 16935.88 20282.48 21146.12 23214.14 23972.50 24317.51 24716.19 25338.32 27045.07 27812.01 28340.01 30861. 65 31597.09
35337.52 21130.74 23189.78 25319.90 27016.59 29487.09 30829.19 31555.44 35289.51
TA2
Calc. v
12132.58 12180.03 12227.48 16230.80 16348.85 16928.83 19358.95
20273.64 20507.41 21137.05 23201. 74 23957.93 24306.62 24708.60 25327.88 27030.77 27793.85 28327.81 28953.52 29496.46
31576.32 33237.72 35313.03
11643.33 12138.31 16237.94 16354.92 16935.81 20282.71 21146.01 23213.55 23971. 99 24317.70 24716.22 25339.01 27044.84 27811.33 28341. 01 30861. 74 31597.31
35337.40 21131. 02 23190.08 25320.22 27016.81 29486.87 30828.98 31556.41 35289.55
Obs. v
11642.18 12135.55
16235.12 16353.46 16931.81 19365.89 20070.80 20278.85 20513.51 21140.69 23210.05 23963.10 24312.75 24716.19 25332.13 27040.25 27799.57 28334.53 28962.25 29501.42 30856.10 31582.87 33247.38 35320.55
TBl
TB2
12139.79
16939.12 20285.67 21149.37
23978.08 24320.91
25342.34
.27817.45 28344.50
33247.38 35342.12
Calc. v
11641. 90 12135.66
16235.07 16353.50 16931. 78 19365.78 20070.93 20278.94 20513.42 21140.66 23209.86 23963.24 24312.91 24716.03 25332.07 27040.15 27799.76 28335.06 28962.38 29501.14 30855.96 31582.88 33247.90 35320.42
12139.99
16938.65 20285.25 21149.70
23976.72 24320.86
25343.64
27817.38 28344.84
33247.41 35345.90
The rotational constants for the excited states of the trans isomer are:
TAl TB1 TA2 TB2 Tel
A
10053.27 10000.61 10119.61 10176.70
9998.18
B
2208.33 2208.55 2209.14 2209.58 2207.97
C
1851. 68 1852.53 1852.64 1852.68 1850.60
J. Chern. Phys., Vol. 60, No.4, 15 February 1974 This article is copyrighted as indicated in the article. Reuse of AIP content is subject to the terms at: http://scitation.aip.org/termsconditions. Downloaded to IP:
129.120.242.61 On: Sat, 22 Nov 2014 13:39:43
1380 Scroggin, Riveros, and Wilson: Microwave spectrum of ethyl nitrate
TABLE VI. Energy difference determined by microwave rela-tive intensities for trans and gauche ethyl nitrate.
Experimental intensity (R/C)b with respect to ground state Energy above
Assignment"- (TO or GO) ground state
TO 1. 00 0.00 cm-1
TAl 0.4893 ± 0.168 100.1±15 TBI 0.4433 ± 0.066 114.5 ±20 TA2 0.2423 ± O. 046 198.9±25 TB2 0.086 ± 0.020 200.0±45 TCI 0.0136 ± 0.006 600.0±50
GO 1.00 0.00 G1 0.5258±0.040 89.8±10 G2 0.2827 ± 0.011 176.6±10 G3 0.1245 ± 0.026 291.1±25 G4 O. 0730±0. 033 365.8±35 G5 0.0408 ± O. 009 447.2±40
TO 1. 00 0.00 GO 0.764 ± O. 246 143 ±70
aTO is the trans ground state. GO is the gauche ground state. bSee Eq. (6).
ularly spaced series. The Stark effects were identical to those of the ground state lines. The frequencies of the satellites of the gauche form are given in Table IX together with the rotational constants of the states. Relative intensity measurements of these satellites (Table VI) showed a regular energy spacing of 90 ± 20 cm-t, which indicated a nearly harmonic gauche potential well. No other set of satellites was found for the gauche form despite an intensive search.
The assignment of this single torsional mode cannot be absolutely certain. In the gauche form of ethyl nitrate there is considerable nonbonded interaction between the - N02 and the methyl group, as indicated by the opening of the CON angle by:::: 3° (see Table IV). A comparison with ethyl formate seems appropriate, since the gauche form of both molecules involves rotation about a C-O bond and nonbonded interaction between a methyl group and similar 1T electron clouds. The first excited C-O torsional spacing for gauche ethyl formate is 73± 10 cm-1 above the ground state (Table Vll). The excited state spacing for gauche ethyl nitrate is 90 ± 20 cm-1
through the fifth excited state, which is a reasonable value for the C -0 torsion. As with trans ethyl nitrate, no satellites of the extremely weak b-type lines were observed.
TABLE VII. A comparison of torsional frequencies (cm-!) for ethyl formate, methyl nitrate, and ethyl nitrate.
Molecule vc-o VNOz
Ethyl formate 186± 60 gauche 73 ±10 trans 66±10
Methyl nitrate 130 ±20
Ethyl nitrate 143 ± 70 gauche 90±20 trans 100±20 (114±20)?
TABLE VIII. Av/(J + 1) values for several families of lines of trans ethyl nitrate.
Assignment to excited state
Transition TAl TB1 TA2 TB2 TC1
313 - 212 2.71 3.41 515 -414 1. 20 2.74 - O. 626 616-515 1.30 2.79 3.47 - O. 589 717 - 616 1.40 2.82 3.51 - O. 560 818 -717 2.88 3.58 - 0.480
505 -404 2.47 606 -505 1. 74 2.65 4.22 5.15 707 - 606 1. 96 2.82 4.60 5.38 808 -707 2.19 3.04 4.80 909 - 808 2.40 3.18 5.08 5.58
322 -221 0.908 423 -322 1. 09 2.07 2.83 524 -423 1.12 2.11 2; 84 3.48 625 -524 1.15 2.13 2.92 3.49 726 - 625 1.18 2.15 2.93 3.58
413 -312 0.78 1. 55 2.57 3.38 514 -413 0.87 1.61 2.70 3.35 -0.38 615 -514 0.94 1.71 2.74 3.41 -0.33 716 - 615 1.04 1. 78 2.11 -0.28
The listing of the All/(J + 1) values for all lines nearby the ground state lines of the gauche rotamer also worked well for identifying vibrational satellites.
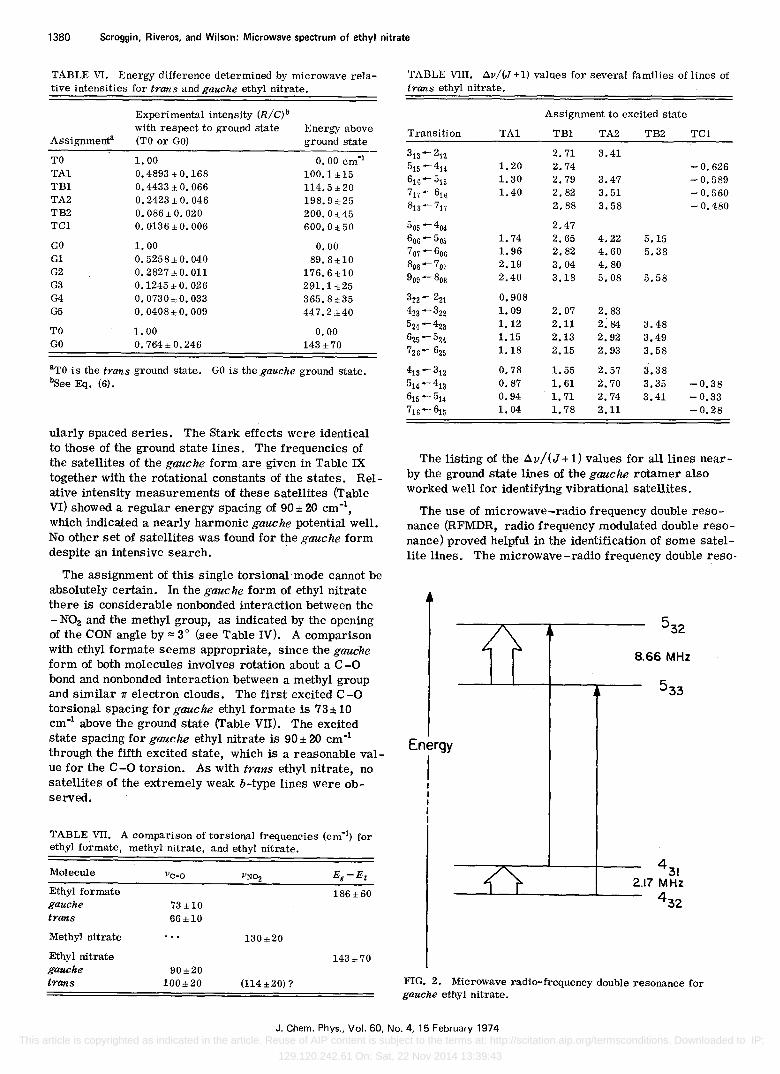
The use of microwave-radio frequency double resonance (RFMDR, radio frequency modulated double r.esonance) proved helpful in the identification of some satellite lineso The microwave-radio frequency double reso-
8.66 MHz
Energy
I
FIG. 2. Microwave radio-frequency double resonance for gauche ethyl nitrate.
J. Chern. Phys., Vol. 60, No.4, 15 February 1974 This article is copyrighted as indicated in the article. Reuse of AIP content is subject to the terms at: http://scitation.aip.org/termsconditions. Downloaded to IP:
129.120.242.61 On: Sat, 22 Nov 2014 13:39:43
Scroggin, Riveros, and Wilson: Microwave spectrum of ethyl nitrate 1381
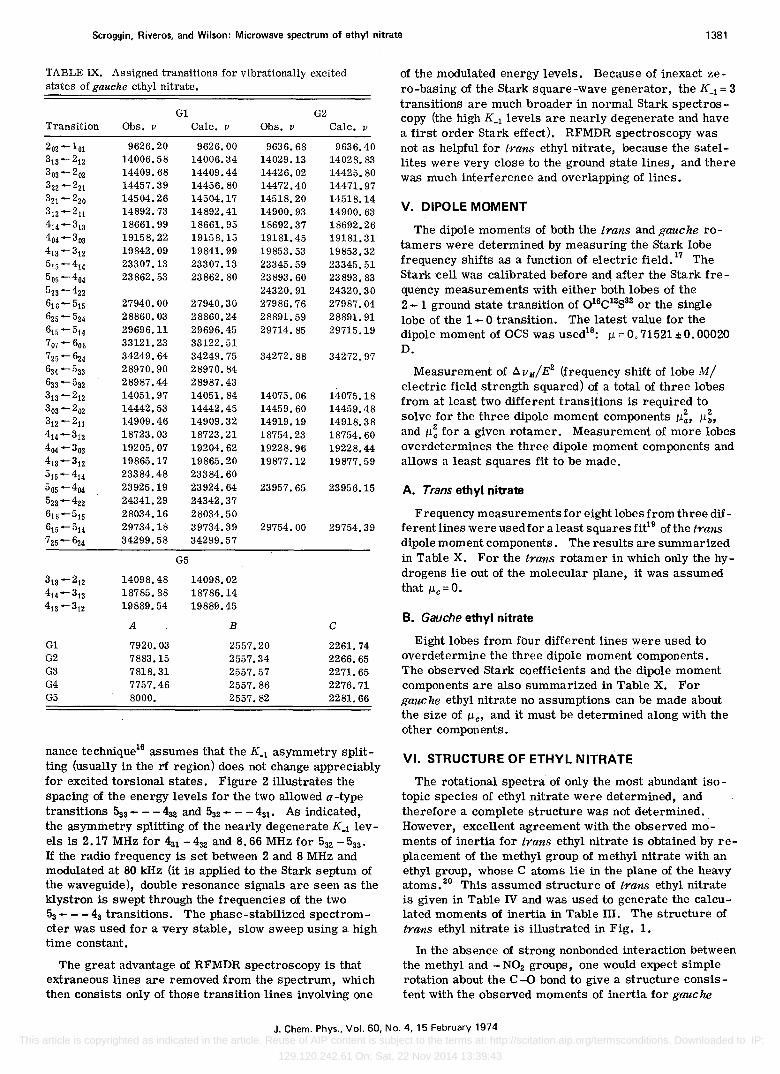
TABLE IX. Assigned transitions for vibrationally excited states of gauche ethyl nitrate.
G1 G2 Transition Obs. jJ Calc. jJ Obs. jJ Calc. jJ
202 -101 9626.20 9626.00 9636.68 9636.40 313 -212 14006.58 14006.34 14029.13 14028.83 303 - 202 14409.68 14409.44 14426.02 14425.80 322 -221 14457.39 14456.80 14472.40 14471.97 321 -220 14504.26 14504.17 14518.20 14518.14 312 -211 14892.73 14892.41 14900.93 14900.63 414 -313 18661. 99 18661. 95 18692.37 18692.26 404 -303 19158.22 19158.15 19181.45 19181.31 413 -312 19842.09 19841.99 19853.53 19853.32 515 -414 23307.13 23307.13 23345.59 23345.51 505 -404 23862.53 23862.80 23893.60 23893.83 523 -422 24320.91 24320.30 616 -515 27940.00 27940.30 27986.76 27987.04 625 - 524 28860.03 28860.24 28891. 59 28891. 91 615 - 514 29696.11 29696.45 29714.85 29715.19 707 -606 33121. 23 33122.51 725 - 624 34249.64 34249.75 34272.88 34272.97 634 - 533 28970.90 28970.84 633 - 532 28987.44 28987.43 313 -212 14051.97 14051. 84 14075.06 14075.18 303 -202 14442.53 14442.45 14459.60 14459.48 312 -211 14909.46 14909.32 14919.19 14918.38 414 -313 18723.03 18723.21 18754.23 18754.60 404 -303 19205.07 19204.62 19228.96 19228.44 413 -312 19865.17 19865.20 19877.12 19877.59 515 -414 23384.48 23384.60 505 -404 23925.19 23924.64 23957.65 23956.15 523- 422 24341.29 24342.37 616 -515 28034.16 28034.50 615 - 514 29734.18 39734.39 29754.00 29754.39 725-~4 34299.58 34299.57
G5
313 -212 14098.48 14098.02 414 -313 18785.88 18786.14 413 -312 19889.54 19889.45
A B C
G1 7920.03 2557.20 2261. 74 G2 7883.15 2557.34 2266.65 G3 7818.31 2557.57 2271.65 G4 7757.46 2557.86 2276.71 G5 8000. 2557.82 2281.66
nance technique16 assumes that the K_1 asymmetry splitting (usually in the rf region) does not change appreciably for excited torSional states. Figure 2 illustrates the spacing of the energy levels for the two allowed a-type transitions 533 - - - 432 and 532 - - - 431 , As indicated, the asymmetry splitting of the nearly degenerate K_l levels is 2.17 MHz for 431 - 432 and 8.66 MHz for 532 - 533 , If the radio frequency is set between 2 and 8 MHz and modulated at 80 kHz (it is applied to the Stark septum of the waveguide), double resonance signals are seen as the klystron is swept through the frequencies of the two 53 - - - 43 transitions. The phase-stabilized spectrometer was used for a very stable, slow sweep using a high time constant.
The great advantage of RFMDR spectroscopy is that extraneous lines are removed from the spectrum, which then consists only of those tranSition lines involving one
of the modulated energy levels. Because of inexact zero-basing of the Stark square-wave generator, the K~l = 3 transitions are much broader in normal Stark spectroscopy (the high K_1 levels are nearly degenerate and have a first order Stark effect). RFMDR spectroscopy was not as helpful for trans ethyl nitrate, because the satellites were very close to the ground state lines, and there was much interference and overlapping of lines.
V. DIPOLE MOMENT
The dipole moments of both the trans and gauche rotamers were determined by measuring the Stark lobe frequency shifts as a function of electric field. 17 The Stark cell was calibrated before and after the Stark frequency measurements with either both lobes of the 2 - 1 ground state transition of o16e12s 32 or the Single lobe of the 1- 0 transition. The latest value for the dipole moment of oes was used18
: M = 0, 71521 ± O. 00020 D.
Measurement of A. v M/E2 (frequency shift of lobe M/ electric field strength squared) of a total of three lobes from at least two different transitions is required to solve for the three dipole moment components M!, M~, and M~ for a given rotamer. Measurement of more lobes overdetermines the three dipole moment components and allows a least squares fit to be made.
A. Trans ethyl nitrate
Frequency measurements for eight lobes from three different lines were used for a least squares fit19 of the trans dipole moment components. The results are summarized in Table X. For the trans rotamer in which only the hydrogens lie out of the molecular plane, it was assumed that Me= O.
B. Gauche ethyl nitrate
Eight lobes from four different lines were used to overdetermine the three dipole moment components. The observed Stark coefficients and the dipole moment components are also summarized in Table X. For gauche ethyl nitrate no assumptions can be made about the size of /le, and it must be determined along with the other components.
VI. STRUCTURE OF ETHYL NITRATE
The rotational spectra of only the most abundant isotopic species of ethyl nitrate were determined, and therefore a complete structure was not determined. However, excellent agreement with the observed moments of inertia for trans ethyl nitrate is obtained by replacement of the methyl group of methyl nitrate with an ethyl group, whose e atoms lie in the plane of the heavy atoms. 20 This assumed structure of trans ethyl nitrate is given in Table IV and was used to generate the calculated moments of inertia in Table Ill. The structure of trans ethyl nitrate is illustrated in Fig. 1.
In the absence of strong nonbonded interaction between the methyl and - N02 groups, one would expect simple rotation about the e -0 bond to give a structure consistent with the observed moments of inertia for gauche
J. Chern. Phys., Vol. 60, No.4, 15 February 1974 This article is copyrighted as indicated in the article. Reuse of AIP content is subject to the terms at: http://scitation.aip.org/termsconditions. Downloaded to IP:
129.120.242.61 On: Sat, 22 Nov 2014 13:39:43

1382 Scroggin, Riveros, and Wilson: Microwave spectrum of ethyl nitrate
A B 11000 .---,---,---,----.---r---r--.--r--.--i--..---..---.r--T--...-~__r_~ 4000
I 10000 3500 :E
en C 0 u; c: 9000 3000 0
U
"0 c: .Q "6
C 3000
2500
2000 FIG. 3. Variation of the rota-tional constants with the dihe-dral angle IJ for ethyl nitrate.
"0 8000 2500 1500 0:::
Dihedral Angle ® (degrees)
ethyl nitrate. Figure 3 shows the changes in the rotational constants A, B, and C for rotation about the C-O bond (the dihedral angle 0). In fact, it is found that no value of this dihedral angle 0 reproduces exactly the gauche ethyl nitrate moments of inertia, although the value of 95° comes very close to doing so.
Although there is some arbitrariness in what structural parameter is to be changed and by how much, chemical intuition and the structures of similar rotamers can serve as a guide. For gauche ethyl nitrate, excellent agreement of calculated and observed moments of inertia is obtained if the rotation about the C -0 axis is
Q)
o E 'o u .:.:
>
9.00
-160 -120 -80 -40 o 40
Dihedral Angle e (degrees)
1000
combined with an opening of the CON angle by 3°. No other single change of structural parameter brings the calculated and observed moments of inertia into good agreement. The analogous angle opening was found for gauc he ethyl formate. The three rotational constants are considerably dependent on these two structural parameters (the angle 0 and the angle CON); if they were not, the changes could not be determined with any certainty.
The assumed structural parameters for gauche ethyl nitrate are included in Table IV.
80 120 160
FIG. 4. Potential function of ethyl nitrate for internal rotation about the c-o bond. See text for discussion of accuracy and error limits.
J. Chern. Phys., Vol. 60, No.4, 15 February 1974 This article is copyrighted as indicated in the article. Reuse of AIP content is subject to the terms at: http://scitation.aip.org/termsconditions. Downloaded to IP:
129.120.242.61 On: Sat, 22 Nov 2014 13:39:43

Scroggin, Riveros, and Wilson: Microwave spectrum of ethyl nitrate 1383
TABLE X. Stark effect and dipole moments.
Trans ethyl nitrate
Av/E2 x 106 [(MHz)(V/Cm}-2] Transition Stark lobe Observed
414 -313 M=O -3.82 M=l 5.46 M=2 32.10
616 -515 M=l -1.15 M=3 4.14 M=4 8.82
404 -303 M=2 4.37
606 - 505 M=3 1.44
The dipole moment components are:
Trans
413 -312
414 -313
303 -202
313 -212
Jla =3.32±0.01 D Jlb = 0.739 ± O. 029 Jle =0 Jlt=3.39±0.02 D
M=2 M=l
M=2 M=l M=O
M=2 M=O
M=l
Gauche ethyl nitrate
- 26. 88 -7.837
35.49 8.035
-1.129
28.60 -13.60
70.80
The dipole moment components are:
Grauche
Jla =3.17±0.02 D 1lb=0.45±0.16 Jle =0.34±0.22 Jlt=3.23±0.04 D
Calculated
-3.91 5.30
32.91
-1.12 4.18 8.82
4.40
1. 48
-27.18 -7.815
35.53 8.032
-1.133
28.09 ....: 13. 87
71.80
It is interesting that the dihedral angle of 95°, which is quite different from the 120° one might at first expect, is precisely the same angle as for gauc he ethyl formate. This observation might indicate that the nonbonded interactions in the two very similar molecules are of the same nature, but the exactly same value for the dihedral angle is surely a coincidence.
VII. TRANS-GAUCHE ENERGY DIFFERENCE
The energy difference of the trans and gauche isomers was determined by the usual method of complete modulation of the transition lines, so that all the Stark lobes were removed. In general, the relative intenSity ratio R =11/12 is given by
(1)
where for any two specific transitions, C is the constant
(2)
where
d = effective path length of absorption cell,
g=degeneracy factor-includes the nuclear spin statistical weight of lower rotational level involved
in the transition and any rotamer degeneracies,
Il, = dipole moment component active in the transition, which depends on whether transition is a-, b-, or c-type,
v = resonant frequency of the absorption line,
A v = half -width of line,
S = transition strength (''line strength").
Taking the In of both sides of Eq. (1) and rearranging,
(3)
Since E1 = E r + E f (the sum of the vibrational and rotational energy), we can express the energy difference of the J = 0 rotational levels of the two vibrational states (the quantity of interest) as
AE"==Ef -E~= -kTln(R/C) _AEr , (4)
where AEr=Ef -E~, R=lt/12, and C is defined above. Thus, Eqs. (4) and (2) give the desired energy difference between the two vibrational states, corrected for any rotational energy differences in the observed transitions, in terms of the experimentally measured intensity ratio, R. It was as,sumed that A V2 = A VI' The average value for E,auehe -Etrans is 143 ± 70 cm-1 (see Table VI).
VIII. POTENTIAL BARRIER TO INTERNAL ROTATION FOR ETHYL NITRATE
To a first apprOXimation, the two rotamers of ethyl nitrate differ only by rotation about the C -0 bond. The potential barrier to internal rotation about this bond is assumed to be of the form:
V(0)=~(Vn/2)(1-cosnO) , (5) n
where 0 is the dihedral angle of the C -0 torsion.
In general, four boundary conditions are imposed on the potential function V(O):
(a) V(O,.)=E, -Et ,
where
0, = dihedral angle for gauche,
E,=E~-ihv, ,
Et=E~-ihvt,
V(Ot)==O,
0t = dihedral angle for trans (assume == 0) ,
(6)
TABLE Xl. Effect of various values of V5 on barriers and Fourier coefficients.
(kcal/mole)
V5= -0.25 0 +0.25 gauche-gauche barrier 2.57 8.65 14.74 gauche-trans barrier 2.39 2.30 2.20 VI 2.013 6.099 10.184 V2 -1. 006 -4.050 -7.094 V3 1.224 2.974 4.724 V4 1. 699 0.830 - O. 039
J. Chern. Phys., Vol. 60, No.4, 15 February 1974 This article is copyrighted as indicated in the article. Reuse of AIP content is subject to the terms at: http://scitation.aip.org/termsconditions. Downloaded to IP:
129.120.242.61 On: Sat, 22 Nov 2014 13:39:43

1384 Scroggin, Riveros, and Wilson: Microwave spectrum of ethyl nitrate
(b) (aV /ae)e=8 .. = 0 (i. e., a minimum in Vat eoo e/f) ,
(c) (azv/aeZ)e=et = 41TZV~(Gi~)trans ,
(d) (azV /8e Z)e=og = 41TZV:(Gi~ )/fauChe •
The quantity Gi! is the diagonal element of the G-1 matrix for torsional vibration, Zl and is essentially the reduced mass of the torsional vibration. The conditions (c) and (d) are rigorously valid for a purely harmonic potential well. The use of (c) and (d) for the potential of ethyl nitrate means that we are assuming only very small anharmonicity near the bottoms of the gauche and trans potential wells. The relative intensity data support this assumption. The first four coefficients (V1, •• " V4 ) were fitted to the experimental data for the dihedral angle, torsional frequencies of the two forms, and the energy difference, by Eqs. (6).
For ethyl nitrate the Gi~ values needed were calculated by the method of PolozZ to give:
Trans Gi! =12. 26 amuN/radz,
Gauche Gi~ = 16.97 amu ;..z;radz
•
Four simultaneous equations1d,1l were solved for the
first four Fourier coefficients:
V1 = 6.099 kcal/mole ,
Vz oo -4.050 kcal/mole,
V300 2.974 kcal/mole,
V4 = O. 830 kcal/mole .
(8)
The determined potential is illustrated in Fig. 4. It is significant to note which sections of the potential curve are well-determined and which are not. The portions of the potential curve near the minima of the wells are well-determined, whereas the barrier heights are much less well known (in the absence of specific tunneling information). The error estimates given below are apprOXimate and are derived from considerations of the uncertainty in V5 (discussed below) and of the propagation of errors from the experimental uncertainties. The barrier heights for ethyl nitrate, measured from the bottoms of the respective potential wells, are determined to be:
gauche-gauche barrier = 8. 65± 6. 0 kcal/mole above gauc he minimum,
(9) trans-gauche barrier = 2. 30±0. 6 kcal/mole above
trans minimum.
Even though nonbonded forces may be causing the CON angle to change during the torSional motion about the C -0 bond and this may have a considerable effect on V(e), it is reasonable to treat the torsional motion as a one-degree-of-freedom problem with reduced moments of inertia dependent on e.
It is at present difficult to put reliable error bounds on the gauche-gauche and trans-gauche barrier heights. One way is to add an additional Fourier term, V5, giving the coefficient various arbitrary fixed values spanning a range thought to be reasonable. For each value the first four coefficients are fitted to the data as explained above
for the choice V5 = O. If the limits on reasonable values of V5 are chos en to be - O. 25 to + O. 25, the results of Table XI are obtained.
It is seen that the Fourier coefficients have little stability. Therefore, their individual values do not have much physical meaning, except in conjunction with a given form for V(e), e. g., a four-term formula. The gauc he -gauc he barrier height also covers a broad range of values. One can probably say only that it is likely to fall in the range 4 to 12 kcal. The gauche-trans barrier is somewhat more accurate with a range 1.7 to 2.9 cal. These variations naturally depend on the range of values chosen for V5 and on the uncertainties in Vtrans and v /fauche' The value chosen is based on the few estimates of V6 values (which run 5 to 100 cal/mole) and those of V4 in other molecules.
IX. DISCUSSION
The steric factors that make a potential minimum at e = 95 0 are apparent from a space-filling model of ethyl nitrate. The opening of the CON angle by 3 0 in the gauche form probably indicates steric repulsions between the methyl group and the NOz group.
The greatest uncertainty in the potential function arises from the experimental difficulties of accurate relative intensity measurements. Far infrared measurements23
on gaseous and liquid samples of ethyl nitrate failed to give resolvable absorption lines in the region 80-167 cm-1
• The far-infrared absorption bands are expected to be broad and weak.
ACKNOWLEDGM ENTS
The authors wish to thank Professor R. C. Lord for the use of his far-infrared spectrometer at the Massachusetts Institute of Technology and Dr. J. Funkhouser and Dr. J. Oberholtzer of the A. D. Little Company for the use of their Hewlett-Packard microwave spectrometer. One of the authors (DGS) wishes to thank Dr. Frank Wodarczyk for many helpful discussions and for the use of several computer programs which he wrote. The authors are grateful to Dr. Wayne Steinmetz for calculating the effects of V5 on the potential.
*This research was supported in part by a grant extended to Harvard University by the National Science Foundation, GP-14012X.
tNational Science Foundation Predoctoral Fellow 1966-1970. Danforth Foundation Fellow 1966-1971.
tpresent address: Instituto de QUirnica, Universidade de Sao Paulo, Cidade Universitaria, Sao Paulo, Brazil.
I(a) E. Hirota, J. Chern. Phys. 37, 283 (1962); (b) 42, 2071 (1965); (c) E. Saegebarth and E. B. Wilson, J. Chern. Phys. 46, 3088 (1967); (d) J. M. Riveros and E. B. Wilson, J. Chern. Phys. 46, 4605 (1967); (e) O. L. Stiefvater, J. Chern. Phys. 50, 5385 (1969); (f) 1. D. Warren and E. B. Wilson, J. Chern. Phys. 56, 2137 (1971).
2For example, (a) J. B. Hendrickson, J. Am. Chern. Soc. 86, 4854 (1964); (b) K. B. Wiberg, J. Am. Chern. Soc. 87, 1070 (1965); (c) J. p. Lowe, J. Chern. Phys. 45, 3059 (1966); (d) N. L. Allinger et aZ., J. Am. Chern. Soc. 89, 4345 (1967); (e) J. Am. Chern. Soc. 90, 1199 (1968); (f) J. Am.
J. Chem. Phys .• Vol. 60, No.4, 15 February 1974 This article is copyrighted as indicated in the article. Reuse of AIP content is subject to the terms at: http://scitation.aip.org/termsconditions. Downloaded to IP:
129.120.242.61 On: Sat, 22 Nov 2014 13:39:43
Scroggin, Riveros, and Wilson: Microwave spectrum of ethyl nitrate 1385
Chem, Soc. 90, 5773 (1968); (g) J. Am. Chem. Soc. 91, 337 (1969); (h) L. C. Allen, Ann. Rev. Phys. Chem. 20, 315 (1969); (i) N. L. Allinger, M. T. Tribble, and M. A. Miller, Tetrahedron 1972, 1173; (j) N. L. Allinger and J. T. Sprague, J. Am. Chem. Soc. 94, 5734 (1972).
3W. B. Dixon and E. B. Wilson, J. Chem. Phys. 35, 191 (1961); J. M. Riveros, An. Acad. Brasil. Cienc. 41, 513 (1969).
4K. Kaze, K. Dawata, and S. Nagakura, Bull. Chem. Soc. Jap. 37, 1057 (1969).
5J. C. Shug, P. E. McMahon, and H. S. Gutowsky, J. Chem. Phys. 33, 843 (1960).
6J . D. Ray, J. Chem. Phys. 40, 3440 (1964). 7T • Urbanski and M. Witanowski, Trans. Faraday Soc. 59,
1039 (1963). 8K• B. McAfee, R. H. Hughes, and E. B. Wilson, Rev. Sci.
Instrum. 20, 821 (1949). 9A• S. Esbitt and E. B. Wilson, Rev. Sci. Instrum. 34, 901
(1963). lOA. Narath and W. Gwinn, Rev. Sci. Instrum. 20, 821 (1962). l1D. G. Scroggin, Ph. D. thesis, Harvard University (1971). 12Rented at the A. D. Little Company of Cambridge, Massa-
chusetts. 13Using the computer program DISTO, written by Dr. Clarence
Thomas and modified for use on Harvard's IBM 360-65 computer.
14Because of the denSity of the trans satellite spectra, complete stark modulation gave erratic relative intensity measure-
ments resulting from overlap of Stark lobes with zero field lines. For the trans rotamer only, suitable lower Stark voltages were used to minimize overlap. This technique gave consistent relative intensity date for the several different transitions used. The assumption of identical Stark effects for trans ground and excited states should introduce little error.
15See also S. Siegel, Ph. D. thesis, Harvard University (1959). 16F • J. Wodarczyk and E. B. Wilson, J. Mol. Spectrosc. 37,
445 (1971). 17S. Golden and E. B. Wilson, J. Chem. Phys. 16, 669 (1948);
and J. E. Wollrab, Rotational Spectra and Molecular Structure (Academic, New York, 1967).
18J. S. Muenter, J. Chem. Phys. 48, 4544 (1968). 19The IBM 1620 computer program LSQDPM, written by F. J.
Wodarczyk, was used for the least squares fit and statistical analysis of the data.
20The Fortran program MOl, written by Robert Beaudet, and CART, written by H. M. Pickett, conveniently calculate the moments of inertia from any assumed structure.
21E. B. Wilson, J. C. Decius, and P. C. Cross, Molecular Vibrations (McGraw-Hill, New York, 1965).
22S. R. Polo, J. Chem. Phys. 24, 1133 (1956). The IBM 360 computer program CART, written by H. M. Pickett, calculates G~1 for any trial structures desired.
23Run in the spectroscopy laboratory of R. C. Lord at the Massachusetts Institute of Technology on the Perkin-Elmer 301 far-infrared spectrometer.
J. Chem. Phys., Vol. 60, No.4, 15 February 1974 This article is copyrighted as indicated in the article. Reuse of AIP content is subject to the terms at: http://scitation.aip.org/termsconditions. Downloaded to IP:
129.120.242.61 On: Sat, 22 Nov 2014 13:39:43