microzone plates study ... the final concentration of poly(ethyleneimine) ... 2-naphthaldehyde...
TRANSCRIPT

Supporting information
Toward wearable sensors: optical sensor for detection of ammonium nitrate-based explosives, ANFO and ANNM.Sara Sheykhi,a Lorenzo Mosca,b Pavel Anzenbacher, Jr.* a
___________________________________a Department of Chemistry and Center for Photochemical Sciences, Bowling Green State University Bowling Green, OH 43403, USAb Department of Chemistry, Northwestern University, Evanston, IL 60208, USA
E-mail: [email protected]
Table of Contents
1. Chemicals and Instrumentation ................................................................................................................2
2. Abbreviation used .....................................................................................................................................2
3. Sensors preparation ..................................................................................................................................3
4. Analytes preparation .................................................................................................................................3
5. Sensors-Analyte study ...............................................................................................................................4
6. Fluorescence studies .................................................................................................................................5
7. Reaction schemes......................................................................................................................................9
8. Paper microzone plates study .................................................................................................................12
9. Hierarchical clustering analysis (HCA) .....................................................................................................15
11. Deposition of non-woven nanofiber mats through a shadow mask .....................................................17
Electronic Supplementary Material (ESI) for ChemComm.This journal is © The Royal Society of Chemistry 2017

2
1. Chemicals and Instrumentation
All chemicals were analytical grade and they were used without purification. Fluorescence spectra were measured with an Edinburgh FLS920 single photon counting fluorimeter. Fluorescence images were recorded on a Kodak Image Station 440CF or Kodak Image Station 4000MM PRO instrument. Mass-spectrometry studies were performed using a Shimadzu LCMS-8030 (ESI-3Q) or a Shimadzu Axima Performance (MALDI-TOF) mass spectrometer. The quantum yields were recorded by using a Hamamatsu Quantaurus QY-C11347 absolute quantum yield integrating sphere.
2. Abbreviation used
NM = nitromethane, NE = nitroethane, 1NP = 1-nitropropane, 2NP = 2-nitropropane, AN = ammonium nitrate, PEI = poly(ethyleneimine), H+ = mineral acid (H2SO4 or HCl), TEA = triethylamine, AcOH = acetic acid.

3
3. Sensors preparation
Preparation of poly(ethyleneimine) solution 7.5%: 5 g of a poly(ethyleneimine) solution (30% in H2O) was diluted with water (5 mL) and absolute ethanol (10 mL).
Preparation of S1: p-dimethylaminobenzaldehyde (DMAPC, 268 mg, 1.79 mmol) was dissolved in absolute ethanol (17.4mL) and 2.6 mL of poly(ethyleneimine) solution (7.5%) were added to get [S1] = 90 mM. The final concentration of poly(ethyleneimine) is 1%.
Preparation of S2: 2-naphthaldehyde (NapC, 305 mg, 1.95 mmol) was dissolved in absolute ethanol (17.4 mL) and 2.6 mL of poly(ethyleneimine) solution (7.5%) were added to get [S2] = 98mM. The final concentration of Poly(ethyleneimine) is 1%. A milky suspension is obtained over the course of 2 hours. This suspension is stable for a week.
Preparation of S3: 1-pyrenecarboxaldehyde (PyrC, 73 mg, 0.317 mmol) was dissolved in absolute ethanol (17.4 mL). The solution is heated to complete dissolution of the solid and then cooled to room temperature. 2.6 mL of poly(ethyleneimine) (7.5%) are added to get [S3] = 16mM. The final concentration of poly(ethyleneimine) is 1%.
Preparation of S4: 2-fluorenecarboxaldehyde (FluoC, 61 mg, 0.314 mmol) was dissolved in absolute ethanol (17.4 mL). 2.6 mL of poly(ethyleneimine) (7.5%) were added to get [S4] = 16mM. The final concentration of poly(ethyleneimine) is 1%.
4. Analytes preparation
Solution of the analytes ([NM] = 458 mM, [NE] = 513 mM, [1NP] = 503 mM, [2NP] = 436 mM) were prepared in 10.0 mL of a water / ethanol mixture (ethanol <5%), to guarantee solubility of the analytes. [AN] = 273 mM and [sulfuric acid] = 15.7 mM were prepared in water (10.0 mL).

4
5. Sensors-Analyte study
Figure S1. MALDI-TOF mass spectra of A) [S1+NM-H2O] + = 192.1, Inset: Calculated isotope pattern for [S1+NM-H2O] + = 192.1, B) [S2+NM-H2O] + = 199.1, Inset: Calculated isotope pattern for [S2+NM-H2O]
+ = 192.1, C) [S3+NM-H2O] + = 273.1, Inset: Calculated isotope pattern for [S3+NM-H2O] + = 273.1, D) [S4+NM-H2O] + = 237.1, Inset: Calculated isotope pattern for [S4+NM-H2O] + = 237.1.

5
6. Fluorescence studies
6.1 Solid state fluorescence spectra
Solid state fluorescence measurements were performed using a sample holder oriented at a 45o angle on the x-y plane between the excitation source and the detector and facing upward at a 45o angle from the the x-y plane to minimize scattering and direct reflection. The sample was prepared by spotting 0.6 μL of S1, S2, S3, and S4 solutions onto chromatographic paper. Analytes were added by spotting 0.5 μL of their respective solutions.
400 450 500 550 600 6500
1x10⁵
2x10⁵
3x10⁵
/ nm
I / a
. u.
S1 S1+NM S1+AN
Figure S2. Solid state fluorescence spectra of S1, S1-NM, S1-AN (λexc = 380 nm).

6
400 450 500 550 6000
1x10⁵
2x10⁵
3x10⁵
I / a
. u.
/ nm
S2 S2+AN S2+NM
Figure S3. Solid state fluorescence spectra of S2, S2-NM, S2-AN (λexc = 365 nm).
450 500 550 600 650 7000
2x10⁵
3x10⁵
5x10⁵
6x10⁵
/ nm
I / a
. u.
S3 S3+AN S3+NM
Figure S4. Solid state fluorescence spectra of S3, S3-NM, S3-AN (λexc = 410 nm).

7
400 450 500 550 6000
1x10⁵
2x10⁵
3x10⁵
4x10⁵
/ nm
I / a
. u.
S4 S4+AN S4+NM
Figure S5. Solid state fluorescence spectra of S4, S4-NM, S4-AN (λexc = 354 nm).

8
6.2 Quantum Yields
/ [%] / [%]DMAPCp-dimethylaminobenzaldehyde
0.43@ 338 nm S1 0.34%
@ 334 nmNapC2-naphthaldehyde
4.88%@ 250 nm S2 4.56%
@ 250 nmPyrC1-pyrenecarboxaldehyde
5.5%@ 287 nm S3 1%
@ 346 nmFluoC2-fluorenecarboxaldehyde
0.46%@ 317 nm S4 0.96%
@ 269 nm
Table S1. Quantum Yields were measured in solutions with A<0.05 at the utilized excitation wavelength. Solutions were prepared in absolute ethanol and the quantum efficiency recorded before and after the addition of PEI.
6.3 Fluorescence titrations in solution
All solutions were prepared in ethanol 96%. The concentrations used were: [S3] = 0.1 µM, [AN] = 545 mM, and [NM] = 60 M.

9
7. Reaction schemes
A)
B)
H2NN
NH
NN
HN
NH2
NH2 NH
NNH2H2N
NH2
O
PyrCPEI
S3
n
NH
NNH
NN
HN
NH
N
NH
NNN
NH2
PET
excemissionquenched
excexcimeremission
S3
10
C)
NHN
NHN
NHN
NH
N
NH
NNN
NH2
PET
excemissionquenched
excexcimeremission
S3
NH4NO3
- NH3NH
NHNH
NH HNHN
NH
N
NH
NHNN
NH3
excemissionquenched
exc excimeremission
n NO3-
NHNH
NHNH HN
HNNH
NH3
NH
NH
NH3
exc monomeremission
n NO3-
NH4NO3
- NH3
hydrolysis
H3N NH3
O

11
D) N
polymer
N
NO2R
H
O
hydrolysis
PEI+
ONRO
O
PEI(H)n++
O
PEI(H)n++
O2N R
H2O x PEI+
O2N R
OH
PEI+
O2N RH
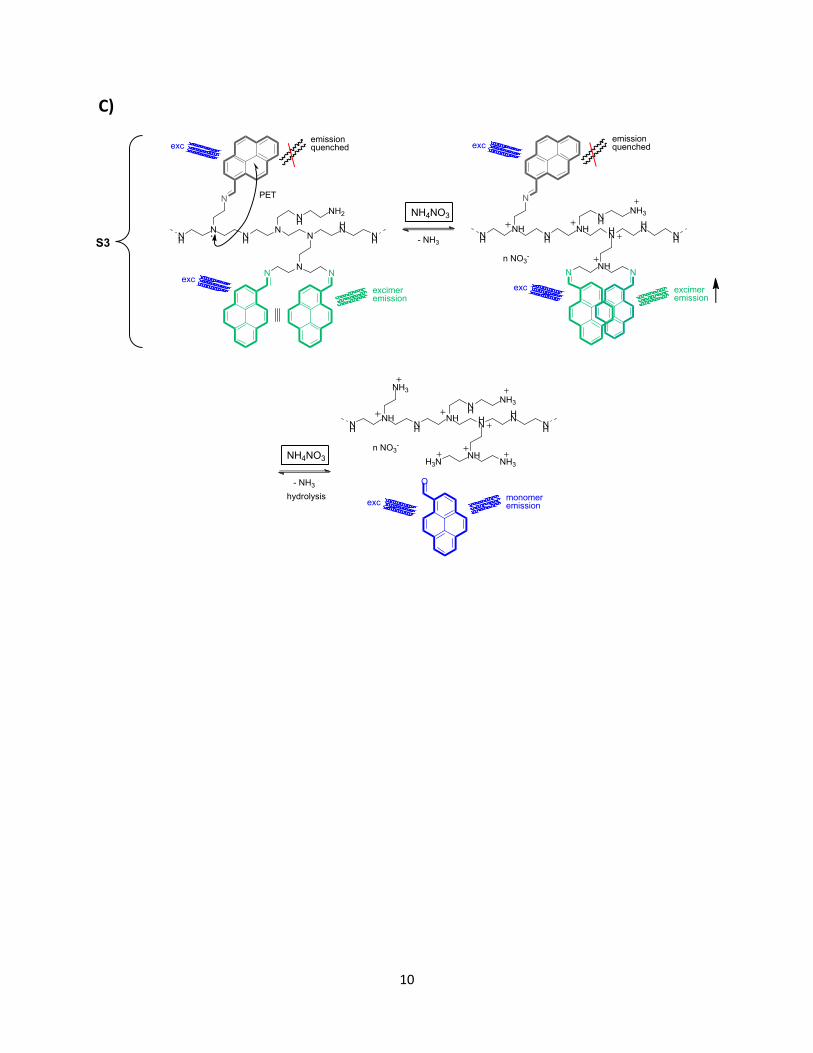
Scheme S6. A) The fluorescence photographs of 1) PyrC, 2) S3, 3) S3+NM, 4) S3+AN, 5) S3+ANNM under black light illumination. B) Formation of S3 from PyrC and PEI. C) Proposed mechanism for S3+AN: in the presence of NH4
+ part of the free amines of PEI are protonated and the pyrene excimer formation is favoured. In the presence of excess of NH4
+ the hydrolysis of the imine bond becomes the dominant process and the monomeric emission of PyrC is restored. D) S3+NM, PEI-promoted formation of the nitroaldol and nitroalkene products leads to a non-fluorescent product.

12
8. Paper microzone plates study
8.1 Paper microzone plates for Linear Discriminant Analysis (LDA) in solution.
The plates were printed on chromatography paper (Whatman) with a Xerox ColorQube model 8570 wax printer. The diameter of a zone on the paper microzone plate was 2.95 ± 0.04 mm and the total size of the plate was 51.2 ± 0.36 53.1 ± 0.17 mm. After printing, it was baked in an oven for 4.5 minutes at 110 oC to allow for the penetration of wax into the paper. Finally, the back side of the paper was covered with tape. These plates were utilized for qualitative classification of analytes using water as the solvent. 600 nL of S1, S2, S3, and S4 solutions were applied to the zones.
For qualitative analysis, [NM] = 458 mM, [NE] = 513 mM, [1NP] = 503 mM, [2NP] = 436 mM were prepared as described before. [AN] = 273 mM and [H+] = 15.7 mM (H2SO4) were dissolved in H2O. Then 500 nL of each analyte were added on the zones and the fluorescence images were recorded. Fluorescence intensities were classified by using Linear Discriminant Analysis (LDA). Validation of the analysis was confirmed with cross validation and 100% classification was achieved (Table S1).

13
Figure S7. LDA score plot for the fluorescence response patterns showing discrimination among six separate analytes.
Jackknifed Classification Matrix 1NP AN Blank H+ NM NE %correct
1NP 6 0 0 0 0 0 100AN 0 6 6 0 0 0 100Blank 0 0 0 6 0 0 100H+ 0 0 0 0 6 0 100NM 0 0 0 0 0 6 100NE 0 0 0 0 0 0 100Total 6 6 6 6 6 6 100Table S2. The jackknifed classification matrix for qualitative analysis in the solid state

14
8.2 Paper microzone plates for vapor sensing.
In qualitative analysis, 600 nL of S1, S2, S3, S4 were applied on microzones of paper. Then 20 L of each analyte were applied to the zones and allowed to equilibrate with the air. The microzone plates were introduced in the jars and exposed to the vapors of the analyte for 5 minutes. The fluorescence images of the microzone plates exposed to analyte vapors were acquired. The fluorescence intensities were classified by using Linear Discriminant Analysis (LDA). Validation of the analysis was confirmed with cross validation and 100% classification was achieved (Table S2). The analytes used were ammonia (NH3, as NH4OH), acetic acid (AcOH), triethylamine (TEA), 1-nitropropane (1NP), 2-nitropropane (2NP), nitroethane (NE), nitromethane (NM).
Jackknifed Classification Matrix 1NP 2NP AN AcOH Blank NE NH3 NM TEA %correct
1NP 5 0 0 0 0 0 0 0 0 1002NP 0 5 0 0 0 0 0 0 0 100AN 0 0 5 0 0 0 0 0 0 100AcOH 0 0 0 5 0 0 0 0 0 100Blank 0 0 0 0 5 0 0 0 0 100NE 0 0 0 0 0 5 0 0 0 100NH3 0 0 0 0 0 0 5 0 0 100NM 0 0 0 0 0 0 0 5 0 100
TEA 0 0 0 0 0 0 0 0 5 100Total 5 5 5 5 5 5 5 5 5 100Table S3. The jackknifed classification matrix for qualitative analysis in solution.

15
9. Hierarchical clustering analysis (HCA)
HCA was performed to quantify differentiability among analytes. In this research, we used the most common clustering criterion (Ward’s minimum variance) method, which takes into consideration the minimum amount of variance between analytes to define a cluster. There is clear discrimination among all ten analytes. The resultant dendrogram shows connectivity and distance between each analytes. (Figure S11)
Figure S8. Dendrogram of euclidean distance between 10 samples with ward linkage.

16
10. Optical sensor array
The plates were printed on chromatography paper (Whatman) with a Xerox ColorQube model 8570 wax printer. The diameter of a zone on paper microzone plates was 2.95 ± 0.04 mm and the total size of the plate was 23.1 ± 0.36 21.3 ± 0.17 mm. After printing, it was baked in an oven for 4.5 minutes at 110 oC to allow for the penetration of wax into the paper. The back side of the microzone plate was covered with tape. 600 nL of the sensors ([S3], [S4] = 16 µM), Rhodamine B (3 µM, H2O), and Fluorescein (3 µM, EtOH) were added on the microzones, then 200 nL of NM, AN, ANNM (60:40) added on the microzones (Figure S12). The picture was taken under a handheld Uv-vis lamp using a compact camera.
Figure S9. The sensor array’s fluorescence under black light (365 nm). Different maps showing the optical sensor array response to NM, AN, and ANNM.

17
11. Deposition of non-woven nanofiber mats through a shadow mask
11.1 Preparation of non-woven nanofiber mats
S3 fibers were electrospun from a solution containing S3 (50 mM), TDMACl (50 M), and 12% w/w of Tecoflex™ (EG-80A, from Lubrizol®) in THF/EtOH 2:1. S3 solution was electrospun from an 8.5 cm height target-to-collector. A typical voltage applied was 5.5 kV and the injection rate was set to 0.198 mL/h. A shadow mask was utilized to electrospin S3 on top of four microscope slides (Figure13A). Then, a few drops of nitromethane were applied to S3 fibers on the microscope slides for 5 minutes (Figure13B). The S3 fiber’s fluorescence under black light (256 nm) was quenched upon exposing to nitromethane. S3 fibers exposed to the ammonium nitrate solution (in water) (Figure13C). After 5 minutes’ exposure, its fluorescence was enhanced. A mixture of ANNM was applied on the S3 microscope slide that fluorescence under black light (256 nm) was different from A, B and C (Figure13D).
Figure S10. Non-woven nanofiber mats: nanofiber mat deposited on a microscope slide A) S3 mat fluorescence under black light (256 nm) B) S3 mat exposed to NM; resulting in fluorescence quenching as seen under black light. C) S3 mat exposed to AN (in water); resulting in fluorescence enhancement as seen under black light. D) S3 mat exposed to the ANNM.
exc
= 256 nm
A B C D