mid-cycle progress report western association of...
TRANSCRIPT

MID-CYCLE PROGRESS REPORT
Noli Indian School District
January 27-29, 2019
Accrediting Commission for Schools Western Association of Schools and Colleges
24335 Soboba Road San Jacinto, CA 92581
NOLI INDIAN SCHOOL

Mid-Cycle Progress Report Rev. 12/13
i
CONTENTS
I. Student/Community Profile Data 1
II. Significant Changes and Developments 11
III. Ongoing School Improvement 13
IV. Progress on Critical Areas for Follow-up/Schoolwide Action Plan 15
V. Schoolwide Action Plan Refinements 18
Appendix A 19
Appendix B 20

Mid-Cycle Progress Report Rev. 12/13
1
I: Student/Community Profile Data
MISSION STATEMENT
In the Luiseño language, noli means “envision.” The Soboba Band of Luiseño Indians envisions a future through educational opportunities provided by Noli Indian School. The school provides a rigorous curriculum, which fosters academic, cultural, and social awareness. It also prepares students to meet and overcome related challenges as a global citizen in the new millennium. Furthermore, Noli Indian School faithfully adjusts and modifies its instructional programs as needed to meet the highest standards for the educational needs of all its students.
VISION STATEMENT
At Noli Indian School, we believe a strong and equitable educational system is central to our success, not only in a global economy, but also in our native communities. We understand that the achievement of high academic standards and organizational success is driven by the skilled performance of all staff members and their passion for what they do every day. We know that it is essential to have a high-performing school system that encourages student participation in collaborative problem-solving activities based on real-world scenarios. As an extension of these core values, we are committed to:
Providing an ethical school system that demands fair treatment, honesty, openness, integrity and respect for all students
Providing all students with the opportunity to perform to their fullest potential and ensuring that there is no discernable difference between the achievement levels of students by any religious affiliation, gender, or economic status
Placing a principal and vice principal with strong instructional leadership and management skills as the key leaders at Noli Indian School
Building and promoting an organizational climate where all teachers take responsibility for the academic achievement of their students
Enhancing our personnel through meaningful on-site professional staff development (every Wednesday morning and periodic teacher in-service days)
Operating effectively and efficiently with the Bureau of Indian Education’s Division of Performance and Accountability
Educating all students in safe and orderly environments conducive to learning
Providing all students access to a well-rounded, rigorous curriculum
Partnering with all stakeholders to maximize student learning
Embracing our community's diversity and using it to enhance the educational environment
Providing multiple pathways to graduation which prepare students to make informed career choices
Preparing all students to be successful in institutions of higher learning or the workforce without a need for remediation
Using internal and external community feedback to continually improve the services we offer
Developing professional learning communities in which shared decision making is expected through Schoolwide Improvement Team meetings every Monday after school (1430 PST)

Mid-Cycle Progress Report Rev. 12/13
2
GENERAL DESCRIPTION OF NOLI INDIAN SCHOOL
Noli Indian School was founded in 1990 as an alternative school for Native American students who were not finding success in the state public school system for a variety of reasons, including but not limited to substance abuse, mental illness, limited or lack of parental support, struggles concerning single-parent households, guardianship by extended, racial prejudice, homelessness, high rates of specific learning disabilities, and challenges assimilating to public school institutional systems. School founders designed Noli Indian School to provide students with an option to attend a comprehensive educational program in a small school setting as compared to a traditional district school which generally had larger enrollment and classroom sizes.
The focused purpose of Noli Indian School, as was communicated to native families, is to be a place where all Native American students and their families are supported by staff members who understand native students’ cultural backgrounds, the importance thereof, and the contributions of Native Americans in the United States. In doing so, Noli Indian School was envisioned to further students’ learning and academic achievements.
Noli Indian School is located on the Soboba Band of Luiseño Indians Reservation. Noli Indian School is a WASC Accredited middle and high school day program. All students are enrolled members of federally recognized tribes and represent over 20 tribes from across the United States. Noli Indian School is also a commuter school. Students commute to Noli from Riverside, San Bernardino, Imperial, and San Diego Counties.
SCHOOLWIDE LEARNER OUTCOMES
Noli Indian School’s “3 Rs” for citizenship are the foundation for the school’s expected Schoolwide Learner Outcomes (SLOs). Through these SLOs, Noli Indian School aspires to develop:
Respectful learners who
Act with compassion and fairness
Embrace diversity
Communicate in a mature manner
Support family and community
Responsible learners who
Take an active role in their education
Manage their time wisely
Demonstrate honesty and integrity
Accept ownership for their words and actions
Reflective learners who
Make decisions with the future in mind
Work from a growth mindset
Apply knowledge and experience to authentic situations

Mid-Cycle Progress Report Rev. 12/13
3
STUDENT DEMOGRAPHICS/ENROLLMENT AND ATTENDANCE
All students at Noli Indian School are of Native American descent. Presently, Noli Indian School services tribal members from 23 sovereign nations from across. The Native American tribes represented in this number are as follows:
TRIBES REPRESENTED STUDENTS ENROLLED LOCATION BY STATE
AGUA CALIENTE BAND OF CAHUILLA INDIANS 6 California
CAHUILLA BAND OF MISSION INDIANS 4 California
DINE NAVAJO NATION 2 Arizona/Nevada/ New Mexico
FORT MOJAVE INDIAN TRIBE 1 Arizona
GILA RIVER 3 Arizona
KLAMATH 1 Washington
LOS COYOTES BAND OF MISSION INDIANS 13 California
MESA GRANDE BAND OF MISSION INDIANS 2 California
MISSISSIPPI CHOCTAW TRIBE 1 Minnesota
MORONGO BAND OF MISSION INDIANS 18 California
OGLALA SIOUX TRIBE 1 South Dakota
PALA BAND OF CUPENO INDIANS 2 California
SOUTHERN PAIUTE 3 Arizona/Nevada
TORRES-MARTINEZ BAND OF CAHUILLA INDIANS
7 California
TOHONO O’ODHAM NATION 1 Arizona
SANTA ROSA BAND OF MISSION INDIANS 1 California
SOBOBA 72 California
BIA RECOGNIZED/NO SPECIFIC TRIBAL AFFILIATION
8 N/A

Mid-Cycle Progress Report Rev. 12/13
4
STUDENT HEAD COUNT 2017-18
The following table is a breakdown of student population by grade level and gender for the 2017-18 school year.
6TH 7TH 8TH 9TH 10TH 11TH 12TH TOTAL
MALE 5 16 4 12 10 10 7 64
FEMALE 9 7 16 14 15 10 11 82
TOTAL 14 23 20 26 25 20 18 146
Noli is a commuter school with students traveling from Riverside, San Bernardino, Imperial, and San Diego counties. The table below reflects the number of students commuting from neighboring reservations. This table does not reflect the displaced Native American students living off of the reservation in neighboring communities.
RESERVATION STUDENTS MILES COUNTY
Soboba 12 3 Riverside
Morongo 15 25 Riverside
San Manuel 1 39 San Bernardino
Pala 3 103 San Diego
Cahuilla 1 163 Riverside
Torres-Martinez 3 168 Imperial/Riverside
Los Coyotes 4 170 San Diego
Santa Rosa 2 170 Riverside
44%56%
Student Population by Gender
Male Female
100%
Student Population by Ethnicity
Native American

Mid-Cycle Progress Report Rev. 12/13
5
STAFF HEAD COUNT 2017-18
The following tables are a breakdown of subject areas taught by each teacher. In this table, teachers are identified by their room numbers rather than names. Please note that many teachers instruct multiple subjects and/or both school levels (middle and high).
MIDDLE SCHOOL:
ROOM LANG. ARTS MATH SOCIAL STUDIES SCIENCE OTHER
2 X X X
5 X X X
7 X
8 X
10 X
11 X X
12 X
13 X X
17 X
PE X
HIGH SCHOOL:
by University of California A-G subject area:
A: History/Social Science B: English C: Mathematics D: Laboratory Science E: Language Other than English F: Visual & Performing Arts G: College-Preparatory Electives
47%53%
Staff Population by Gender
Male Female
20%
80%
Staff Population by Ethnicity
Native American Other

Mid-Cycle Progress Report Rev. 12/13
6
ROOM A B C D E F G Not A-G
3 X
4 X
6 X
7 X X
8 X
9 X X
10 X
11 X
12 X
13 X
14 X X
15 X
16 X
17 X X
PE X
STUDENT ACHIEVEMENT DATA
Student achievement at Noli Indian School is quantitatively measured by attendance, summative assessments, and graduation rates.
ATTENDANCE
The following tables reflect Noli Indian School’s average daily attendance for the 2015-16, 2016-17, and
2017-18 school years. The tables reflect average daily attendance to be 90% or higher.
2015-2016 GRADE
STUDENT COUNT
MEMB. DAYS
ABSENT DAYS
PRESENT DAYS ADM ADA
PERCENT IN ATTENDANCE
6 20 3000 207.06 2792.94 16.22 15.10 93.10%
7 22 3582 325.54 3256.46 19.35 17.60 90.91%
8 21 3272 210.32 3061.68 17.70 16.57 93.57%
9 27 3533 260.53 3272.47 19.1 17.71 92.63%
10 29 4400 391.64 4008.36 23.79 21.71 91.10%
11 22 2958 213.13 2744.87 16.00 14.82 92.79%
12 24 3690 250.03 3439.97 19.95 18.62 93.22%
TOTAL 7 165 24435 1858.25 22576.75 132.11 122.13 92.40%
2016- 2017 GRADE
STUDENT COUNT
MEMB. DAYS
ABSENT DAYS
PRESENT DAYS ADM ADA
PERCENT IN ATTENDANCE
6 16 2865 168.48 2696.52 15.55 14.66 94.12%
7 22 3648 277.58 3370.42 19.83 18.33 92.39%
8 27 3920 384.20 3535.80 21.30 19.21 90.20%
9 26 3973 348.54 3624.46 21.57 19.71 91.23%
10 21 2843 235.97 2607.03 15.47 14.16 91.70%
11 24 3609 257.39 2607.03 15.47 14.16 91.70%
12 20 2587 195.90 2391.10 14.06 13.00 92.43%
TOTAL 7 156 23445 1868.06 21576.94 127.40 117.30 92.03%

Mid-Cycle Progress Report Rev. 12/13
7
2017- 2018 GRADE
STUDENT COUNT
MEMB. DAYS
ABSENT DAYS
PRESENT DAYS ADM ADA
PERCENT IN ATTENDANCE
6 14 2109 184.69 1924.31 11.85 10.80 91.24%
7 22 3515 278.52 3236.48 19.74 18.20 92.08%
8 20 2243 222.65 2020.35 12.62 11.36 90.07%
9 26 4243 388.66 3854.34 23.84 21.65 90.84%
10 25 3560 308.81 3251.19 20.00 18.27 91.33%
11 19 2330 193.03 2136.97 13.10 12.00 91.72%
12 18 2864 253.15 2610.85 16.10 14.68 91.16%
TOTAL 7 144 20864 1829.51 19034.49 117.25 106.96 91.23%
SUMMATIVE ASSESSMENTS The Measures of Academic Progress (MAP) assessment, created by the Northwest Evaluation Association (NWEA), is administered twice during each school year. The test is completed by students in grades 6, 7, 8, and 11 in the subject areas of English-language arts, mathematics, history-social science, and science. It is first administered at the beginning of the year during quarter 1, and then again as a mid-year benchmark in quarter 3. For the district summary reports of these assessments, see Appendix A. The end-of-year assessment used is Smarter Balanced test, published by the Smarter Balanced Assessment Consortium (SBAC), and is the state’s adopted Smarter Balanced assessment system for measuring proficiency in English language arts/literacy and mathematics. The following charts reflect Noli Indian School’s Smarter Balanced results for the 2015-16, 2016-17, and
the 2017-18 school years.
2015-16 Math
GRADE STANDARD NOT MET OR NEARLY MET
(1-2)
STANDARD MET (3)
STANDARD EXCEEDED
(4)
TOTAL
6th 14 0 0 14
7th 16 1 0 17
8th 18 0 0 18
11th 16 0 0 16
Total 64 1 0 65
Total % 98.5% 1.5% 0 100%

Mid-Cycle Progress Report Rev. 12/13
8
2015-16 ELA
GRADE STANDARD NOT MET OR NEARLY MET
(1-2)
STANDARD MET (3)
STANDARD EXCEEDED
(4)
TOTAL
6th 14 0 0 14
7th 16 1 0 17
8th 16 2 0 18
11th 15 1 0 16
Total 61 4 0 65
Total% 93.8% 6.2% 0 100%
2016-17 Math
GRADE STANDARD NOT MET OR NEARLY MET
(1-2)
STANDARD MET (3)
STANDARD EXCEEDED
(4)
TOTAL
6th 14 0 0 14
7th 16 1 0 17
8th 18 0 0 18
11th 16 0 0 16
Total 64 0 0 65
Total % 98% 2% 0 100%
2016-17 ELA
GRADE STANDARD NOT MET OR NEARLY MET
(1-2)
STANDARD MET (3)
STANDARD EXCEEDED
(4)
TOTAL
6th 14 0 0 14
7th 16 1 0 17
8th 16 2 0 18
11th 15 1 0 16
Total 61 4 65
Total% 94% 6% 0 100%

Mid-Cycle Progress Report Rev. 12/13
9
2017-18 Math
GRADE
STANDARD NOT MET OR NEARLY MET
(1-2)
STANDARD MET (3)
STANDARD EXCEEDED
(4) TOTAL
6th 10 1 0 11
7th 17 0 0 17
8th 9 0 0 9
11th 12 1 0 13
Total 48 2 0 50
Total % 96% 4% 0 100%
2017-18 ELA
GRADE
STANDARD NOT MET OR NEARLY
MET (1-2)
STANDARD MET (3)
STANDARD EXCEEDED
(4) TOTAL
6th 10 1 0 11
7th 16 1 0 17
8th 9 0 0 9
11th 9 4 0 13
Total 44 6 0 50
Total% 88% 12% 0 100%
GRADUATION RATES
Graduation rates for the 2017-18 school year show that the rate of graduation was 93.75%. This is down approximately 1% from the 2015 -2016 school year (94.73%) but higher than the previous year (93.33%). Noli Indian School’s mean three-year graduation rate is 93.93%.
Student Counts 2015-16 2016-17 2017-18
Cohort Start 19 15 26
Transfer In 5 6 8
Transfer Out 4 4 14
Other Deduction 1 2 4
Cohort End 19 15 16
Graduates 18 14 15
Dropouts 1 1 1
Remain In School 0 0 0
Graduation Rate 94.73 93.33 93.75

Mid-Cycle Progress Report Rev. 12/13
10
DATA IMPLICATIONS, CRITICAL LEARNER NEEDS, AND STAFF DISCUSSIONS
The Smarter Balanced data summary suggests that there were very moderate gains made in math over the last three years. The data is statistically insignificant and does not necessarily suggest any trends. This past school year, 2017-18, showed a gain in high school language arts. It will remain to be seen if this is an anomaly or the start of a trend.
The MAP assessment data also suggests moderate gains over time in both math and language arts. Teacher feedback notes the limited, though still significant, gains as well. Though these gains do not move students from the basic to proficient bands, the gains do represent personal achievement and growth that should not be disregarded.
Along with the input from the aforementioned summative assessments, Noli Indian School, henceforth referred to as Noli, also uses the informal assessments and input provided by the Institute for Student Achievement (ISA) coaches who partner with the Noli teaching staff and administrators to make informed decisions with a commitment to school-wide improvement. ISA conducts regular analyses of Noli’s academic and social climate, including by classroom observations, student surveys, and the collection of feedback from administrative and teaching staff, to make recommendations for the school. The recommendations from the ISA team advise the development of a more rigorous school curriculum that includes stronger emphasis on higher-level thinking and writing skills.
At ISA’s request, Noli is developing cross-curricular connections in the high school science and math departments by utilizing the Crosscutting Concepts (CCCs) of the Next Generation Science Standards (NGSS) and the Standards of Mathematical Practice (SMPs) from the California math framework, as well as incorporating STEM (science, technology, engineering, and math) activities, to bring cohesion to the types of and expectations for inquiry-driven learning. ISA is working with the science department to evaluate newly-published NGSS curriculum with the intent to soon pilot a program or programs leading to adoption of a new curriculum. ISA coaches also recommended a transition from the traditional math pathway for high school to the integrated math pathway, and the math department is currently in the second year of that implementation.
To help meet these demands, Noli created a Curriculum Coordinator position in the summer of 2016. The position is held by a Noli math teacher (middle and high school levels) who works closely with the ISA coaches to continue these plans for math and science. Additionally, the Curriculum Coordinator has worked with other middle and high school teachers in other subject areas, including computer science, visual arts, and social studies, to revise units of study, refresh classroom resources, and/or adopt updated curricula that meet the demands of teaching 21st century learners.
Noli’s Advisory program is also in its second year. Noli has created an Advisory Coordinator position. The Advisory Coordinator works with the staff to implement a thoughtful Advisory program, which the Coordinator has written specifically for the benefit of the academically, socially, and culturally diverse student population, and which supports teachers in their roles as advisors.

Mid-Cycle Progress Report Rev. 12/13
11
II: Significant Changes and Developments
While there are no significant changes in enrollment, there are several school changes and developments that have positively impacted the quality of education at Noli Indian School. These changes have taken place in the following programs and/or departments.
While we are in the infancy stages of these changes, we have seen a significant change in the school climate and culture. Students are now expecting to be placed on a college level track upon graduation and are taking more responsibility for their education.
The following are significant changes beyond the Schoolwide Action Plan that have had a positive impact on Noli Indian School.
Advisory
Students attend an Advisory period every Monday and Thursday for 18 minutes
Created and filled Advisory Coordinator position
Developed Advisory curriculum
After-School Tutoring
Education Technicians maintain notebooks of weekly homework and focus notes for each class
Math-specific tutoring offered twice a week
Increased and more efficient communication between classroom teachers and Education Technicians regarding class topics, assignments, and homework
Science
Adopted Next Generation Science Standards (NGSS)
Added laboratory Physics course
Begun review of materials for next program adoption
History-Social Science
Adopted new curricula for Geography, Civics (Government), and Economics
Selected new curricula for World History and U.S. History, to be adopted tentatively 2019-20
Visual Arts
Hired new Art teacher in 2016
Updated course offerings
Adopted new curricula
Spanish
Adopted new curriculum

Mid-Cycle Progress Report Rev. 12/13
12
Special Education
Added Educational Technician (same staff member also responsible for transition)
Changed to new assessment company (former has doctor retired)
For a listing of the curricula and programs used in all grades and subject areas, see Appendix C.
IMPACTS ON SCHOOLWIDE ACTION PLAN
Changes in ADVISORY have increased student connectedness and stronger platform for student-teacher communication, which has been reflected in a more positive, supportive school community.
Changes in AFTER-SCHOOL TUTORING have improved communication between teachers, support staff, and students. Teachers report higher rates of homework completion and more academic confidence among student who attend tutoring.
Changes in SCIENCE have ushered in the use an inquiry-based approach to instruction. The addition of Physics has completed the set of A-G laboratory science courses.
Changes in HISTORY-SOCIAL SCIENCE have implemented current curricula to reflect the most recent historical research and events.
Changes in VISUAL ARTS have restructured the department for college-readiness demands.
Changes in SPANISH have provided curricular opportunities for technology integration that support the needs of 21st century students.
Changes in SPECIAL EDUCATION have strengthened and refined the program.

Mid-Cycle Progress Report Rev. 12/13
13
III: Ongoing School Improvement
LEADERSHIP TEAM
The Noli Indian School’s Leadership Team consists of the following individuals:
Donovan Post: Principal
George Barchie: Vice Principal
Kim Marcus: Counselor
Felicia Murrell: Counselor
Clyde Miller: Academic Counselor
Molly Hickerson: Middle School Teacher/NASIS Coordinator
Elizabeth LaCella: High School Teacher/AVID and GATE Coordinator
Bridget Lowe: Middle and High School Teacher/Curriculum Coordinator
Richard Moreno: Middle School Teacher/Advisory Coordinator
Jonathan Ruiz: Athletic Director
Robert Stover: Special Education Coordinator
The Leadership Team provides the school with counsel concerning several areas. The areas include:
a. Native Star
b. ISA
c. AVID
d. Advisory
e. Curriculum
f. Behavior
g. Assessment Data
h. Professional Development
Regarding the above items:
a. Native Star is the program used by the Bureau of Indian Education to create the School-Wide Action Plan. The Leadership Team develops, monitors, and assesses the indicators that help the school to achieve its educational goals.
b. The Leadership Team works with the Institute for Student Achievement to promote both a college-bound atmosphere and rigorous course expectations.
c. Members of the Leadership Team oversee the AVID program in terms of promoting a universal buy-in of Noli teachers for the program. The team helps teachers to understand their role in helping both AVID Elective and Non-AVID Elective students learn good study skills.
d. The Advisory program is monitored by the Leadership Team. The goal is to help Mr. Moreno develop a program that the teachers will find to be beneficial and a real source of support for the students.
e. Curriculum is selected and implemented through a partnership between Ms. Lowe and the content-area department members.
f. Leadership monitors student behavior trends and works with staff members in the endeavor to

Mid-Cycle Progress Report Rev. 12/13
14
maintain positive classroom discipline.
g. Leadership works with staff to interpret summative assessment data and use it to drive instruction.
h. Leadership provides feedback to the administration concerning Professional Development programs and in-service collaboration days. Leadership Team member also provide on-site professional development through workshops and trainings in their areas of expertise. s in-service presentations.
ANNUAL REPORT
The Annual Report is created by the school’s administration with the input from the Leadership team and the staff. The Leadership team also reviews and edits the report. The Administration collects data and reviews the information in Native Star and then creates the report with the assistance of the Leadership Team. There is a general back-and-forth flow of communication that goes on between the Administration and the Leadership team in the writing of the report. It is a very informal process.
STAKEHOLDERS
All stakeholders for the Schoolwide Action Plan (SAP), which is detailed in the following section, are included in the implementation, monitoring, review, and revision of the SAP. This involvement includes, but is not limited to:
STAKEHOLDERS: EXAMPLES OF INVOLVEMENT:
ADMINISTRATORS Oversee and support implementation of the SAP
Sit on the Leadership Team, Schoolwide Improvement Team, and School Board
Provide opportunities for staff professional development
Analyze data and plan next steps
TEACHERS Collaborate with content level teams, administrators, and ISA coaches
Provide feedback and make recommendations
Support implementation at the classroom level
OTHER STAFF MEMBERS Provide feedback and make recommendations
SCHOOL BOARD Receive updates at regularly-scheduled Board meetings
Analyze data and provide feedback
PARENTS/GUARDIANS AND FAMILIES
Provide feedback informally or through parent surveys
Hold positions on School Board
COMMUNITY AND/OR TRIBAL MEMBERS
Partner with school for tribal events
Provide feedback
Hold positions on School Board

Mid-Cycle Progress Report Rev. 12/13
15
IV: Progress on Critical Areas for Follow-up/Schoolwide Action Plan
Task 1a: Hiring of a female counselor to respond to expressed stakeholder
Sought out grant for funding Hired a female counselor 03-13-2017
Task 1b: Appointing a second culture teacher
Second instructor has been appointed
Task 2: Improve parent engagement, involvement, knowledge of programs and attendance at school events
Expanded parent portal (NASIS) Expanded parent teacher conference days to four times a year Noted increase in parent engagement, as measured by data from sign-in sheets at parent
conferences as well as a marked increase in open communication between parents and staff AVID requires parent involvement Purchased automated email and voice messaging through NASIS to increase parent
involvement
Task 3: Enhanced professional development program for teachers
Contracted with ISA to provide personal development to staff twice a month Administration provides personal development once a month Staff are encouraged to attend, and given funding for, trainings that will benefit their
classroom and personal development AVID provides yearly and summer trainings to select staff to implement AVID strategies in
every classroom One staff member participated in a WASC self-study and visitation Staff visited, and continue to visit, other schools and sat in on appropriate classroom
observations and formal teacher interaction
Task 4: Improve student engagement levels by implementing more student-guided and project-based lessons
Cross-curricular writing programs have been and are currently being implemented in all core subject areas
ISA provides assistance in working with teachers and staff on planning and implementing strategies to complete projects
AVID Summer Institute (2-day) to train staff on implementing student-guided projects Advisory program begun to help monitor students’ in class progress Rewards reading program in implementation and includes new writing component
Task 5: A - G course approval through the University of California
All applicable high school courses are approved Two-person committee working with all staff on updates and submissions
Task 6: Regular collaboration among the Schoolwide Improvement Team (SIT) that more thoroughly implements the WASC self -study Process, Native Star, NASIS, and other school and student systems
Staff members added to site leadership team Staff member added to master calendar duties and events
2017
2018
2016-17
2018-19
2016-present
2017
2016-present
Ongoing
2018
2016-present

Mid-Cycle Progress Report Rev. 12/13
16
Two additional staff members received training in NASIS New transitional coordinator Working with ISA on improving the self-study process Collaboration with teachers and staff on direction of education and curriculum Native Star team now consists of four members (three of which are newly added)
Task 7: Increase student academic proficiency levels in reading and math
Test scores show moderate gains in Math Teachers report moderate increases Students are not moving from the first and second score bands to proficient (third score
band), but are showing personal growth Reading test scores remain above the Native American average but below state average New reading program (Rewards) brought in to address oral fluency and increase test scores Reading:
▫ Switched curriculum from Read 180 to Rewards, which added a writing component ▫ Increased student fluency, vocabulary knowledge, and comprehension skills
Mathematics ▫ Hired a third math teacher ▫ Transitioned to high school integrated pathway ▫ Adopted new curricula for middle and high school ▫ Established two pathways for 8th grade students (traditional grade 8 math or pre-
algebra)
2016-present
IMPACTS ON SCHOOLWIDE ACTION PLAN
Changes in TASK 1a have strengthened young women’s programs, provided comfort for female students who would rather speak to a female counselor, and added professional support to the entire counseling department.
Changes in TASK 1b have added a middle school culture class and professional support to the culture department.
Changes in TASK 2 have resulted in a stronger working relationship between parents/families and the school, which is evidenced in higher student achievement and engagement as reported by classroom teachers.
Changes in TASK 3 have supported teachers in curricular transitions, given new perspectives to best practices, and increased teacher morale.
Changes in TASK 4 have positively impacted student abilities to think critically about real-world scenarios. The emphasis on writing across grade levels has led to observable improvement in student achievement.
Changes in TASK 5 have created a more streamlined educational pathway to college.
Changes in TASK 6 have improved the working relationship between staff stakeholders.
Changes in TASK 7 have set up Reading and Mathematics classrooms to better serve students.

Mid-Cycle Progress Report Rev. 12/13
17

Mid-Cycle Progress Report Rev. 12/13
18
V: Schoolwide Action Plan Refinements and Next Steps
Task 1a: Hiring of a female counselor to respond to expressed stakeholder
End of year evaluation of programs
Task 1b: Appointing a second culture teacher
End of year evaluation of programs
Task 2: Improve parent engagement, involvement, knowledge of programs and attendance at school events
Evaluate improvement and refine strategies Compare outcome to previous years
Task 3: Enhanced professional development program for teachers
AVID Summer Institute 2019 Summarize and reflect on changes Analyze student improvement
Task 4: Improve student engagement levels by implementing more student-guided and project-based lessons
End of year evaluation of WICOR implementation (AVID strategies for Writing, Inquiry, Collaboration, Organization, and Reading)
Write and implement more student-guided lessons
Task 5: A-G course approval through the University of California
Review and revise current courses as needed Submit culture department courses for approval during the 2019 submission period
Task 6: Regular collaboration among the Schoolwide Improvement Team (SIT) that more thoroughly implements the WASC self -study Process, Native Star, NASIS, and other school and student systems
Review collaboration strengths and weaknesses, and revise the plan as needed
Task 7: Increase student academic proficiency levels in reading and math
End of year evaluation of programs Review and selection of digital math intervention program Plan for and support students in taking the SAT tests in 11th and 12th grades

Mid-Cycle Progress Report Rev. 12/13
19
APPENDIX A: NWEA/MAP Assessment Data
Please see following pages.

Exp
lan
ato
ry N
ote
sT
ests
sho
wn
in g
ray
are
excl
uded
from
sum
mar
y st
atis
tics.
Eith
er th
e te
st o
ccur
red
outs
ide
the
test
ing
win
dow
for
a te
rm, h
ad a
n in
valid
sco
re, o
r w
as a
rep
eat t
est f
or a
stu
dent
with
in a
term
.
Tes
t Inv
alid
atio
n R
easo
ns:
***1
The
test
dur
atio
n w
as to
o sh
ort t
o pr
ovid
e a
valid
res
ult.
***2
The
ove
rall
RIT
sco
re fo
r th
is te
st is
abo
ve th
e va
lid r
ange
.**
*3 T
he o
vera
ll R
IT s
core
for
this
test
is b
elow
the
valid
ran
ge.
***4
The
sta
ndar
d er
ror
for
this
test
is b
elow
acc
epta
ble
limits
. **
*5 T
he s
tand
ard
erro
r fo
r th
is te
st is
abo
ve a
ccep
tabl
e lim
its.
***6
The
test
has
bee
n id
entif
ied
as in
valid
.**
*7 H
igh
leve
l of r
apid
gue
ssin
g ha
s in
valid
ated
test
.
Due
to s
tatis
tical
unr
elia
bilit
y, s
umm
ary
data
for
grou
ps o
f les
s th
an 1
0 ar
e no
t sho
wn.
* T
his
data
is n
ot a
vaila
ble
for
repo
rtin
g. P
leas
e re
fer
to h
elp
and
docu
men
tatio
n fo
r m
ore
info
rmat
ion.
Lexi
le®
is a
trad
emar
k of
Met
aMet
rics,
Inc.
, and
is r
egis
tere
d in
the
Uni
ted
Sta
tes
and
abro
ad.
Gen
erat
ed12
/14/
18, 1
0:22
:03
AM
CO
NF
IDE
NT
IALI
TY
NO
TIC
E: T
his
info
rmat
ion
may
be
conf
iden
tial a
nd le
gally
pro
tect
ed fr
om d
iscl
osur
e.©
NW
EA
201
8. M
AP
is a
reg
iste
red
trad
emar
k. N
WE
A, M
AP
Gro
wth
and
MA
P S
kills
are
trad
emar
ks o
f NW
EA
in th
e U
.S. a
nd in
oth
er c
ount
ries.
© C
opyr
ight
201
0. N
atio
nal G
over
nors
Ass
ocia
tion
Cen
ter
for
Bes
t Pra
ctic
es a
nd C
ounc
il of
Chi
ef S
tate
Sch
ool O
ffice
rs. A
ll rig
hts
rese
rved
.
Pag
e2
of6
Gra
de
Rep
ort
Gra
de
6T
erm
:F
all 2
018-
2019
Dis
tric
t:N
oli I
ndia
n S
choo
l (B
IE)
Sch
oo
l:N
oli S
choo
l
No
rms
Ref
eren
ce D
ata:
2015
Wee
ks o
f In
stru
ctio
n:
4 (F
all 2
018)
Gro
up
ing
:N
one
Sm
all G
rou
p D
isp
lay:
N
o
Mat
hem
atic
s
Gro
wth
: M
ath
6+
CA
201
0 / C
A C
omm
on C
ore
Mat
hem
atic
s: 2
010
Su
mm
ary
To
tal S
tud
ents
Wit
h V
alid
Gro
wth
Tes
t S
core
s7
Mea
n R
IT*
Sta
nd
ard
Dev
iati
on
*
Dis
tric
t G
rad
e L
evel
Mea
n R
IT20
9.3
Stu
den
ts A
t o
r A
bo
ve D
istr
ict
Gra
de
Lev
el M
ean
RIT
*
No
rm G
rad
e L
evel
Mea
n R
IT21
7.6
Stu
den
ts A
t o
r A
bo
ve N
orm
Gra
de
Lev
el M
ean
RIT
* Lo
%ile
< 2
1L
oA
vg%
ile 2
1-40
Avg
%ile
41-
60H
iAvg
%ile
61-
80H
i%
ile >
80
Mea
n R
IT(+
/- S
mp
Err
)S
td D
ev
Ove
rall
Per
form
ance
cou
nt
%co
un
t%
cou
nt
%co
un
t%
cou
nt
%
Gro
wth
: M
ath
6+
CA
201
0 / C
A C
om
mo
n C
ore
Mat
hem
atic
s:
2010
343
%1
14%
229
%1
14%
00%
**
Go
al A
rea
Op
erat
ion
s an
d A
lgeb
raic
Th
inki
ng
457
%0
0%2
29%
00%
114
%*
*
Th
e R
eal a
nd
Co
mp
lex
Nu
mb
er S
yste
ms
229
%2
29%
114
%1
14%
114
%*
*
Geo
met
ry3
43%
114
%1
14%
114
%1
14%
**
Sta
tist
ics
and
Pro
bab
ility
343
%2
29%
229
%0
0%0
0%*
*
19a

Exp
lan
ato
ry N
ote
sT
ests
sho
wn
in g
ray
are
excl
uded
from
sum
mar
y st
atis
tics.
Eith
er th
e te
st o
ccur
red
outs
ide
the
test
ing
win
dow
for
a te
rm, h
ad a
n in
valid
sco
re, o
r w
as a
rep
eat t
est f
or a
stu
dent
with
in a
term
.
Tes
t Inv
alid
atio
n R
easo
ns:
***1
The
test
dur
atio
n w
as to
o sh
ort t
o pr
ovid
e a
valid
res
ult.
***2
The
ove
rall
RIT
sco
re fo
r th
is te
st is
abo
ve th
e va
lid r
ange
.**
*3 T
he o
vera
ll R
IT s
core
for
this
test
is b
elow
the
valid
ran
ge.
***4
The
sta
ndar
d er
ror
for
this
test
is b
elow
acc
epta
ble
limits
. **
*5 T
he s
tand
ard
erro
r fo
r th
is te
st is
abo
ve a
ccep
tabl
e lim
its.
***6
The
test
has
bee
n id
entif
ied
as in
valid
.**
*7 H
igh
leve
l of r
apid
gue
ssin
g ha
s in
valid
ated
test
.
Due
to s
tatis
tical
unr
elia
bilit
y, s
umm
ary
data
for
grou
ps o
f les
s th
an 1
0 ar
e no
t sho
wn.
* T
his
data
is n
ot a
vaila
ble
for
repo
rtin
g. P
leas
e re
fer
to h
elp
and
docu
men
tatio
n fo
r m
ore
info
rmat
ion.
Lexi
le®
is a
trad
emar
k of
Met
aMet
rics,
Inc.
, and
is r
egis
tere
d in
the
Uni
ted
Sta
tes
and
abro
ad.
Gen
erat
ed12
/14/
18, 1
0:22
:03
AM
CO
NF
IDE
NT
IALI
TY
NO
TIC
E: T
his
info
rmat
ion
may
be
conf
iden
tial a
nd le
gally
pro
tect
ed fr
om d
iscl
osur
e.©
NW
EA
201
8. M
AP
is a
reg
iste
red
trad
emar
k. N
WE
A, M
AP
Gro
wth
and
MA
P S
kills
are
trad
emar
ks o
f NW
EA
in th
e U
.S. a
nd in
oth
er c
ount
ries.
© C
opyr
ight
201
0. N
atio
nal G
over
nors
Ass
ocia
tion
Cen
ter
for
Bes
t Pra
ctic
es a
nd C
ounc
il of
Chi
ef S
tate
Sch
ool O
ffice
rs. A
ll rig
hts
rese
rved
.
Pag
e4
of6
Gra
de
Rep
ort
Gra
de
6T
erm
:F
all 2
018-
2019
Dis
tric
t:N
oli I
ndia
n S
choo
l (B
IE)
Sch
oo
l:N
oli S
choo
l
No
rms
Ref
eren
ce D
ata:
2015
Wee
ks o
f In
stru
ctio
n:
4 (F
all 2
018)
Gro
up
ing
:N
one
Sm
all G
rou
p D
isp
lay:
N
o
Rea
din
g
Gro
wth
: R
ead
ing
6+
CA
201
0 V
2 / C
A C
omm
on C
ore
Eng
lish
Lang
uage
Art
s: 2
010
Su
mm
ary
To
tal S
tud
ents
Wit
h V
alid
Gro
wth
Tes
t S
core
s7
Mea
n R
IT*
Sta
nd
ard
Dev
iati
on
*
Dis
tric
t G
rad
e L
evel
Mea
n R
IT20
4.3
Stu
den
ts A
t o
r A
bo
ve D
istr
ict
Gra
de
Lev
el M
ean
RIT
*
No
rm G
rad
e L
evel
Mea
n R
IT21
1
Stu
den
ts A
t o
r A
bo
ve N
orm
Gra
de
Lev
el M
ean
RIT
* Lo
%ile
< 2
1L
oA
vg%
ile 2
1-40
Avg
%ile
41-
60H
iAvg
%ile
61-
80H
i%
ile >
80
Mea
n R
IT(+
/- S
mp
Err
)S
td D
ev
Ove
rall
Per
form
ance
cou
nt
%co
un
t%
cou
nt
%co
un
t%
cou
nt
%
Gro
wth
: R
ead
ing
6+
CA
201
0 V
2 / C
A C
om
mo
n C
ore
En
glis
h
Lan
gu
age
Art
s: 2
010
229
%3
43%
00%
00%
229
%*
*
Go
al A
rea
Lit
erat
ure
114
%3
43%
114
%0
0%2
29%
**
Info
rmat
ion
al T
ext
229
%3
43%
00%
229
%0
0%*
*
Vo
cab
ula
ry A
cqu
isit
ion
an
d U
se2
29%
343
%0
0%1
14%
114
%*
*
19b

Exp
lan
ato
ry N
ote
sT
ests
sho
wn
in g
ray
are
excl
uded
from
sum
mar
y st
atis
tics.
Eith
er th
e te
st o
ccur
red
outs
ide
the
test
ing
win
dow
for
a te
rm, h
ad a
n in
valid
sco
re, o
r w
as a
rep
eat t
est f
or a
stu
dent
with
in a
term
.
Tes
t Inv
alid
atio
n R
easo
ns:
***1
The
test
dur
atio
n w
as to
o sh
ort t
o pr
ovid
e a
valid
res
ult.
***2
The
ove
rall
RIT
sco
re fo
r th
is te
st is
abo
ve th
e va
lid r
ange
.**
*3 T
he o
vera
ll R
IT s
core
for
this
test
is b
elow
the
valid
ran
ge.
***4
The
sta
ndar
d er
ror
for
this
test
is b
elow
acc
epta
ble
limits
. **
*5 T
he s
tand
ard
erro
r fo
r th
is te
st is
abo
ve a
ccep
tabl
e lim
its.
***6
The
test
has
bee
n id
entif
ied
as in
valid
.**
*7 H
igh
leve
l of r
apid
gue
ssin
g ha
s in
valid
ated
test
.
Due
to s
tatis
tical
unr
elia
bilit
y, s
umm
ary
data
for
grou
ps o
f les
s th
an 1
0 ar
e no
t sho
wn.
* T
his
data
is n
ot a
vaila
ble
for
repo
rtin
g. P
leas
e re
fer
to h
elp
and
docu
men
tatio
n fo
r m
ore
info
rmat
ion.
Lexi
le®
is a
trad
emar
k of
Met
aMet
rics,
Inc.
, and
is r
egis
tere
d in
the
Uni
ted
Sta
tes
and
abro
ad.
Gen
erat
ed12
/14/
18, 1
0:22
:03
AM
CO
NF
IDE
NT
IALI
TY
NO
TIC
E: T
his
info
rmat
ion
may
be
conf
iden
tial a
nd le
gally
pro
tect
ed fr
om d
iscl
osur
e.©
NW
EA
201
8. M
AP
is a
reg
iste
red
trad
emar
k. N
WE
A, M
AP
Gro
wth
and
MA
P S
kills
are
trad
emar
ks o
f NW
EA
in th
e U
.S. a
nd in
oth
er c
ount
ries.
© C
opyr
ight
201
0. N
atio
nal G
over
nors
Ass
ocia
tion
Cen
ter
for
Bes
t Pra
ctic
es a
nd C
ounc
il of
Chi
ef S
tate
Sch
ool O
ffice
rs. A
ll rig
hts
rese
rved
.
Pag
e6
of6
Gra
de
Rep
ort
Gra
de
6T
erm
:F
all 2
018-
2019
Dis
tric
t:N
oli I
ndia
n S
choo
l (B
IE)
Sch
oo
l:N
oli S
choo
l
No
rms
Ref
eren
ce D
ata:
2015
Wee
ks o
f In
stru
ctio
n:
4 (F
all 2
018)
Gro
up
ing
:N
one
Sm
all G
rou
p D
isp
lay:
N
o
Lan
gu
age
Usa
ge
Gro
wth
: L
ang
uag
e 2-
12 C
A 2
010
/ CA
Com
mon
Cor
e E
nglis
h La
ngua
ge A
rts:
201
0
Su
mm
ary
To
tal S
tud
ents
Wit
h V
alid
Gro
wth
Tes
t S
core
s7
Mea
n R
IT*
Sta
nd
ard
Dev
iati
on
*
Dis
tric
t G
rad
e L
evel
Mea
n R
IT19
5.9
Stu
den
ts A
t o
r A
bo
ve D
istr
ict
Gra
de
Lev
el M
ean
RIT
*
No
rm G
rad
e L
evel
Mea
n R
IT21
0.7
Stu
den
ts A
t o
r A
bo
ve N
orm
Gra
de
Lev
el M
ean
RIT
* Lo
%ile
< 2
1L
oA
vg%
ile 2
1-40
Avg
%ile
41-
60H
iAvg
%ile
61-
80H
i%
ile >
80
Mea
n R
IT(+
/- S
mp
Err
)S
td D
ev
Ove
rall
Per
form
ance
cou
nt
%co
un
t%
cou
nt
%co
un
t%
cou
nt
%
Gro
wth
: L
ang
uag
e 2-
12 C
A 2
010
/ CA
Co
mm
on
Co
re E
ng
lish
L
ang
uag
eA
rts:
201
04
57%
00%
229
%1
14%
00%
**
Go
al A
rea
Wri
tin
g:
Pla
n, O
rgan
ize,
Dev
elo
p, R
evis
e, R
esea
rch
457
%1
14%
229
%0
0%0
0%*
*
Lan
gu
age:
Un
der
stan
d, E
dit
fo
r G
ram
mar
, Usa
ge
457
%1
14%
00%
114
%1
14%
**
Lan
gu
age:
Un
der
stan
d, E
dit
Mec
han
ics
457
%0
0%1
14%
229
%0
0%*
*
19c

Exp
lan
ato
ry N
ote
sT
ests
sho
wn
in g
ray
are
excl
uded
from
sum
mar
y st
atis
tics.
Eith
er th
e te
st o
ccur
red
outs
ide
the
test
ing
win
dow
for
a te
rm, h
ad a
n in
valid
sco
re, o
r w
as a
rep
eat t
est f
or a
stu
dent
with
in a
term
.
Tes
t Inv
alid
atio
n R
easo
ns:
***1
The
test
dur
atio
n w
as to
o sh
ort t
o pr
ovid
e a
valid
res
ult.
***2
The
ove
rall
RIT
sco
re fo
r th
is te
st is
abo
ve th
e va
lid r
ange
.**
*3 T
he o
vera
ll R
IT s
core
for
this
test
is b
elow
the
valid
ran
ge.
***4
The
sta
ndar
d er
ror
for
this
test
is b
elow
acc
epta
ble
limits
. **
*5 T
he s
tand
ard
erro
r fo
r th
is te
st is
abo
ve a
ccep
tabl
e lim
its.
***6
The
test
has
bee
n id
entif
ied
as in
valid
.**
*7 H
igh
leve
l of r
apid
gue
ssin
g ha
s in
valid
ated
test
.
Due
to s
tatis
tical
unr
elia
bilit
y, s
umm
ary
data
for
grou
ps o
f les
s th
an 1
0 ar
e no
t sho
wn.
* T
his
data
is n
ot a
vaila
ble
for
repo
rtin
g. P
leas
e re
fer
to h
elp
and
docu
men
tatio
n fo
r m
ore
info
rmat
ion.
Lexi
le®
is a
trad
emar
k of
Met
aMet
rics,
Inc.
, and
is r
egis
tere
d in
the
Uni
ted
Sta
tes
and
abro
ad.
Gen
erat
ed12
/14/
18, 1
0:21
:54
AM
CO
NF
IDE
NT
IALI
TY
NO
TIC
E: T
his
info
rmat
ion
may
be
conf
iden
tial a
nd le
gally
pro
tect
ed fr
om d
iscl
osur
e.©
NW
EA
201
8. M
AP
is a
reg
iste
red
trad
emar
k. N
WE
A, M
AP
Gro
wth
and
MA
P S
kills
are
trad
emar
ks o
f NW
EA
in th
e U
.S. a
nd in
oth
er c
ount
ries.
© C
opyr
ight
201
0. N
atio
nal G
over
nors
Ass
ocia
tion
Cen
ter
for
Bes
t Pra
ctic
es a
nd C
ounc
il of
Chi
ef S
tate
Sch
ool O
ffice
rs. A
ll rig
hts
rese
rved
.
Pag
e2
of6
Gra
de
Rep
ort
Gra
de
7T
erm
:F
all 2
018-
2019
Dis
tric
t:N
oli I
ndia
n S
choo
l (B
IE)
Sch
oo
l:N
oli S
choo
l
No
rms
Ref
eren
ce D
ata:
2015
Wee
ks o
f In
stru
ctio
n:
4 (F
all 2
018)
Gro
up
ing
:N
one
Sm
all G
rou
p D
isp
lay:
N
o
Mat
hem
atic
s
Gro
wth
: M
ath
6+
CA
201
0 / C
A C
omm
on C
ore
Mat
hem
atic
s: 2
010
Su
mm
ary
To
tal S
tud
ents
Wit
h V
alid
Gro
wth
Tes
t S
core
s14
Mea
n R
IT20
4.1
Sta
nd
ard
Dev
iati
on
17
Dis
tric
t G
rad
e L
evel
Mea
n R
IT20
4.1
Stu
den
ts A
t o
r A
bo
ve D
istr
ict
Gra
de
Lev
el M
ean
RIT
6
No
rm G
rad
e L
evel
Mea
n R
IT22
2.6
Stu
den
ts A
t o
r A
bo
ve N
orm
Gra
de
Lev
el M
ean
RIT
2 Lo
%ile
< 2
1L
oA
vg%
ile 2
1-40
Avg
%ile
41-
60H
iAvg
%ile
61-
80H
i%
ile >
80
Mea
n R
IT(+
/- S
mp
Err
)S
td D
ev
Ove
rall
Per
form
ance
cou
nt
%co
un
t%
cou
nt
%co
un
t%
cou
nt
%
Gro
wth
: M
ath
6+
CA
201
0 / C
A C
om
mo
n C
ore
Mat
hem
atic
s:
2010
964
%1
7%3
21%
17%
00%
199-
204-
209
17
Go
al A
rea
Op
erat
ion
s an
d A
lgeb
raic
Th
inki
ng
750
%3
21%
214
%2
14%
00%
203-
208-
212
17.4
Th
e R
eal a
nd
Co
mp
lex
Nu
mb
er S
yste
ms
750
%2
14%
214
%2
14%
17%
203-
208-
214
19.6
Geo
met
ry10
71%
17%
214
%1
7%0
0%19
6-20
1-20
617
Sta
tist
ics
and
Pro
bab
ility
964
%3
21%
214
%0
0%0
0%19
5-20
0-20
517
.8
19d

Exp
lan
ato
ry N
ote
sT
ests
sho
wn
in g
ray
are
excl
uded
from
sum
mar
y st
atis
tics.
Eith
er th
e te
st o
ccur
red
outs
ide
the
test
ing
win
dow
for
a te
rm, h
ad a
n in
valid
sco
re, o
r w
as a
rep
eat t
est f
or a
stu
dent
with
in a
term
.
Tes
t Inv
alid
atio
n R
easo
ns:
***1
The
test
dur
atio
n w
as to
o sh
ort t
o pr
ovid
e a
valid
res
ult.
***2
The
ove
rall
RIT
sco
re fo
r th
is te
st is
abo
ve th
e va
lid r
ange
.**
*3 T
he o
vera
ll R
IT s
core
for
this
test
is b
elow
the
valid
ran
ge.
***4
The
sta
ndar
d er
ror
for
this
test
is b
elow
acc
epta
ble
limits
. **
*5 T
he s
tand
ard
erro
r fo
r th
is te
st is
abo
ve a
ccep
tabl
e lim
its.
***6
The
test
has
bee
n id
entif
ied
as in
valid
.**
*7 H
igh
leve
l of r
apid
gue
ssin
g ha
s in
valid
ated
test
.
Due
to s
tatis
tical
unr
elia
bilit
y, s
umm
ary
data
for
grou
ps o
f les
s th
an 1
0 ar
e no
t sho
wn.
* T
his
data
is n
ot a
vaila
ble
for
repo
rtin
g. P
leas
e re
fer
to h
elp
and
docu
men
tatio
n fo
r m
ore
info
rmat
ion.
Lexi
le®
is a
trad
emar
k of
Met
aMet
rics,
Inc.
, and
is r
egis
tere
d in
the
Uni
ted
Sta
tes
and
abro
ad.
Gen
erat
ed12
/14/
18, 1
0:21
:54
AM
CO
NF
IDE
NT
IALI
TY
NO
TIC
E: T
his
info
rmat
ion
may
be
conf
iden
tial a
nd le
gally
pro
tect
ed fr
om d
iscl
osur
e.©
NW
EA
201
8. M
AP
is a
reg
iste
red
trad
emar
k. N
WE
A, M
AP
Gro
wth
and
MA
P S
kills
are
trad
emar
ks o
f NW
EA
in th
e U
.S. a
nd in
oth
er c
ount
ries.
© C
opyr
ight
201
0. N
atio
nal G
over
nors
Ass
ocia
tion
Cen
ter
for
Bes
t Pra
ctic
es a
nd C
ounc
il of
Chi
ef S
tate
Sch
ool O
ffice
rs. A
ll rig
hts
rese
rved
.
Pag
e4
of6
Gra
de
Rep
ort
Gra
de
7T
erm
:F
all 2
018-
2019
Dis
tric
t:N
oli I
ndia
n S
choo
l (B
IE)
Sch
oo
l:N
oli S
choo
l
No
rms
Ref
eren
ce D
ata:
2015
Wee
ks o
f In
stru
ctio
n:
4 (F
all 2
018)
Gro
up
ing
:N
one
Sm
all G
rou
p D
isp
lay:
N
o
Rea
din
g
Gro
wth
: R
ead
ing
6+
CA
201
0 V
2 / C
A C
omm
on C
ore
Eng
lish
Lang
uage
Art
s: 2
010
Su
mm
ary
To
tal S
tud
ents
Wit
h V
alid
Gro
wth
Tes
t S
core
s13
Mea
n R
IT20
0.7
Sta
nd
ard
Dev
iati
on
18.4
Dis
tric
t G
rad
e L
evel
Mea
n R
IT20
0.7
Stu
den
ts A
t o
r A
bo
ve D
istr
ict
Gra
de
Lev
el M
ean
RIT
7
No
rm G
rad
e L
evel
Mea
n R
IT21
4.4
Stu
den
ts A
t o
r A
bo
ve N
orm
Gra
de
Lev
el M
ean
RIT
3 Lo
%ile
< 2
1L
oA
vg%
ile 2
1-40
Avg
%ile
41-
60H
iAvg
%ile
61-
80H
i%
ile >
80
Mea
n R
IT(+
/- S
mp
Err
)S
td D
ev
Ove
rall
Per
form
ance
cou
nt
%co
un
t%
cou
nt
%co
un
t%
cou
nt
%
Gro
wth
: R
ead
ing
6+
CA
201
0 V
2 / C
A C
om
mo
n C
ore
En
glis
h
Lan
gu
age
Art
s: 2
010
646
%4
31%
00%
215
%1
8%19
5-20
1-20
618
.4
Go
al A
rea
Lit
erat
ure
646
%4
31%
00%
18%
215
%19
5-20
0-20
619
.4
Info
rmat
ion
al T
ext
862
%1
8%2
15%
00%
215
%19
2-19
8-20
522
.1
Vo
cab
ula
ry A
cqu
isit
ion
an
d U
se4
31%
646
%2
15%
00%
18%
199-
203-
207
14.8
19e

Exp
lan
ato
ry N
ote
sT
ests
sho
wn
in g
ray
are
excl
uded
from
sum
mar
y st
atis
tics.
Eith
er th
e te
st o
ccur
red
outs
ide
the
test
ing
win
dow
for
a te
rm, h
ad a
n in
valid
sco
re, o
r w
as a
rep
eat t
est f
or a
stu
dent
with
in a
term
.
Tes
t Inv
alid
atio
n R
easo
ns:
***1
The
test
dur
atio
n w
as to
o sh
ort t
o pr
ovid
e a
valid
res
ult.
***2
The
ove
rall
RIT
sco
re fo
r th
is te
st is
abo
ve th
e va
lid r
ange
.**
*3 T
he o
vera
ll R
IT s
core
for
this
test
is b
elow
the
valid
ran
ge.
***4
The
sta
ndar
d er
ror
for
this
test
is b
elow
acc
epta
ble
limits
. **
*5 T
he s
tand
ard
erro
r fo
r th
is te
st is
abo
ve a
ccep
tabl
e lim
its.
***6
The
test
has
bee
n id
entif
ied
as in
valid
.**
*7 H
igh
leve
l of r
apid
gue
ssin
g ha
s in
valid
ated
test
.
Due
to s
tatis
tical
unr
elia
bilit
y, s
umm
ary
data
for
grou
ps o
f les
s th
an 1
0 ar
e no
t sho
wn.
* T
his
data
is n
ot a
vaila
ble
for
repo
rtin
g. P
leas
e re
fer
to h
elp
and
docu
men
tatio
n fo
r m
ore
info
rmat
ion.
Lexi
le®
is a
trad
emar
k of
Met
aMet
rics,
Inc.
, and
is r
egis
tere
d in
the
Uni
ted
Sta
tes
and
abro
ad.
Gen
erat
ed12
/14/
18, 1
0:21
:54
AM
CO
NF
IDE
NT
IALI
TY
NO
TIC
E: T
his
info
rmat
ion
may
be
conf
iden
tial a
nd le
gally
pro
tect
ed fr
om d
iscl
osur
e.©
NW
EA
201
8. M
AP
is a
reg
iste
red
trad
emar
k. N
WE
A, M
AP
Gro
wth
and
MA
P S
kills
are
trad
emar
ks o
f NW
EA
in th
e U
.S. a
nd in
oth
er c
ount
ries.
© C
opyr
ight
201
0. N
atio
nal G
over
nors
Ass
ocia
tion
Cen
ter
for
Bes
t Pra
ctic
es a
nd C
ounc
il of
Chi
ef S
tate
Sch
ool O
ffice
rs. A
ll rig
hts
rese
rved
.
Pag
e6
of6
Gra
de
Rep
ort
Gra
de
7T
erm
:F
all 2
018-
2019
Dis
tric
t:N
oli I
ndia
n S
choo
l (B
IE)
Sch
oo
l:N
oli S
choo
l
No
rms
Ref
eren
ce D
ata:
2015
Wee
ks o
f In
stru
ctio
n:
4 (F
all 2
018)
Gro
up
ing
:N
one
Sm
all G
rou
p D
isp
lay:
N
o
Lan
gu
age
Usa
ge
Gro
wth
: L
ang
uag
e 2-
12 C
A 2
010
/ CA
Com
mon
Cor
e E
nglis
h La
ngua
ge A
rts:
201
0
Su
mm
ary
To
tal S
tud
ents
Wit
h V
alid
Gro
wth
Tes
t S
core
s13
Mea
n R
IT19
9.5
Sta
nd
ard
Dev
iati
on
15.1
Dis
tric
t G
rad
e L
evel
Mea
n R
IT19
9.5
Stu
den
ts A
t o
r A
bo
ve D
istr
ict
Gra
de
Lev
el M
ean
RIT
6
No
rm G
rad
e L
evel
Mea
n R
IT21
4
Stu
den
ts A
t o
r A
bo
ve N
orm
Gra
de
Lev
el M
ean
RIT
2 Lo
%ile
< 2
1L
oA
vg%
ile 2
1-40
Avg
%ile
41-
60H
iAvg
%ile
61-
80H
i%
ile >
80
Mea
n R
IT(+
/- S
mp
Err
)S
td D
ev
Ove
rall
Per
form
ance
cou
nt
%co
un
t%
cou
nt
%co
un
t%
cou
nt
%
Gro
wth
: L
ang
uag
e 2-
12 C
A 2
010
/ CA
Co
mm
on
Co
re E
ng
lish
L
ang
uag
eA
rts:
201
08
62%
18%
215
%1
8%1
8%19
5-19
9-20
415
.1
Go
al A
rea
Wri
tin
g:
Pla
n, O
rgan
ize,
Dev
elo
p, R
evis
e, R
esea
rch
969
%2
15%
00%
215
%0
0%19
1-19
6-20
117
Lan
gu
age:
Un
der
stan
d, E
dit
fo
r G
ram
mar
, Usa
ge
754
%2
15%
215
%2
15%
00%
198-
202-
206
13.3
Lan
gu
age:
Un
der
stan
d, E
dit
Mec
han
ics
862
%0
0%3
23%
00%
215
%19
5-20
1-20
617
.8
19f

Exp
lan
ato
ry N
ote
sT
ests
sho
wn
in g
ray
are
excl
uded
from
sum
mar
y st
atis
tics.
Eith
er th
e te
st o
ccur
red
outs
ide
the
test
ing
win
dow
for
a te
rm, h
ad a
n in
valid
sco
re, o
r w
as a
rep
eat t
est f
or a
stu
dent
with
in a
term
.
Tes
t Inv
alid
atio
n R
easo
ns:
***1
The
test
dur
atio
n w
as to
o sh
ort t
o pr
ovid
e a
valid
res
ult.
***2
The
ove
rall
RIT
sco
re fo
r th
is te
st is
abo
ve th
e va
lid r
ange
.**
*3 T
he o
vera
ll R
IT s
core
for
this
test
is b
elow
the
valid
ran
ge.
***4
The
sta
ndar
d er
ror
for
this
test
is b
elow
acc
epta
ble
limits
. **
*5 T
he s
tand
ard
erro
r fo
r th
is te
st is
abo
ve a
ccep
tabl
e lim
its.
***6
The
test
has
bee
n id
entif
ied
as in
valid
.**
*7 H
igh
leve
l of r
apid
gue
ssin
g ha
s in
valid
ated
test
.
Due
to s
tatis
tical
unr
elia
bilit
y, s
umm
ary
data
for
grou
ps o
f les
s th
an 1
0 ar
e no
t sho
wn.
* T
his
data
is n
ot a
vaila
ble
for
repo
rtin
g. P
leas
e re
fer
to h
elp
and
docu
men
tatio
n fo
r m
ore
info
rmat
ion.
Lexi
le®
is a
trad
emar
k of
Met
aMet
rics,
Inc.
, and
is r
egis
tere
d in
the
Uni
ted
Sta
tes
and
abro
ad.
Gen
erat
ed12
/14/
18, 1
0:22
:16
AM
CO
NF
IDE
NT
IALI
TY
NO
TIC
E: T
his
info
rmat
ion
may
be
conf
iden
tial a
nd le
gally
pro
tect
ed fr
om d
iscl
osur
e.©
NW
EA
201
8. M
AP
is a
reg
iste
red
trad
emar
k. N
WE
A, M
AP
Gro
wth
and
MA
P S
kills
are
trad
emar
ks o
f NW
EA
in th
e U
.S. a
nd in
oth
er c
ount
ries.
© C
opyr
ight
201
0. N
atio
nal G
over
nors
Ass
ocia
tion
Cen
ter
for
Bes
t Pra
ctic
es a
nd C
ounc
il of
Chi
ef S
tate
Sch
ool O
ffice
rs. A
ll rig
hts
rese
rved
.
Pag
e2
of6
Gra
de
Rep
ort
Gra
de
8T
erm
:F
all 2
018-
2019
Dis
tric
t:N
oli I
ndia
n S
choo
l (B
IE)
Sch
oo
l:N
oli S
choo
l
No
rms
Ref
eren
ce D
ata:
2015
Wee
ks o
f In
stru
ctio
n:
4 (F
all 2
018)
Gro
up
ing
:N
one
Sm
all G
rou
p D
isp
lay:
N
o
Mat
hem
atic
s
Gro
wth
: M
ath
6+
CA
201
0 / C
A C
omm
on C
ore
Mat
hem
atic
s: 2
010
Su
mm
ary
To
tal S
tud
ents
Wit
h V
alid
Gro
wth
Tes
t S
core
s19
Mea
n R
IT20
6.1
Sta
nd
ard
Dev
iati
on
11.1
Dis
tric
t G
rad
e L
evel
Mea
n R
IT20
6.1
Stu
den
ts A
t o
r A
bo
ve D
istr
ict
Gra
de
Lev
el M
ean
RIT
8
No
rm G
rad
e L
evel
Mea
n R
IT22
6.3
Stu
den
ts A
t o
r A
bo
ve N
orm
Gra
de
Lev
el M
ean
RIT
1 Lo
%ile
< 2
1L
oA
vg%
ile 2
1-40
Avg
%ile
41-
60H
iAvg
%ile
61-
80H
i%
ile >
80
Mea
n R
IT(+
/- S
mp
Err
)S
td D
ev
Ove
rall
Per
form
ance
cou
nt
%co
un
t%
cou
nt
%co
un
t%
cou
nt
%
Gro
wth
: M
ath
6+
CA
201
0 / C
A C
om
mo
n C
ore
Mat
hem
atic
s:
2010
1368
%5
26%
15%
00%
00%
203-
206-
209
11.1
Go
al A
rea
Op
erat
ion
s an
d A
lgeb
raic
Th
inki
ng
1368
%3
16%
211
%1
5%0
0%20
3-20
6-20
913
.7
Th
e R
eal a
nd
Co
mp
lex
Nu
mb
er S
yste
ms
1158
%6
32%
211
%0
0%0
0%20
5-20
8-21
113
.8
Geo
met
ry13
68%
421
%2
11%
00%
00%
202-
205-
208
12.6
Sta
tist
ics
and
Pro
bab
ility
1579
%1
5%3
16%
00%
00%
202-
205-
207
12.1
19g

Exp
lan
ato
ry N
ote
sT
ests
sho
wn
in g
ray
are
excl
uded
from
sum
mar
y st
atis
tics.
Eith
er th
e te
st o
ccur
red
outs
ide
the
test
ing
win
dow
for
a te
rm, h
ad a
n in
valid
sco
re, o
r w
as a
rep
eat t
est f
or a
stu
dent
with
in a
term
.
Tes
t Inv
alid
atio
n R
easo
ns:
***1
The
test
dur
atio
n w
as to
o sh
ort t
o pr
ovid
e a
valid
res
ult.
***2
The
ove
rall
RIT
sco
re fo
r th
is te
st is
abo
ve th
e va
lid r
ange
.**
*3 T
he o
vera
ll R
IT s
core
for
this
test
is b
elow
the
valid
ran
ge.
***4
The
sta
ndar
d er
ror
for
this
test
is b
elow
acc
epta
ble
limits
. **
*5 T
he s
tand
ard
erro
r fo
r th
is te
st is
abo
ve a
ccep
tabl
e lim
its.
***6
The
test
has
bee
n id
entif
ied
as in
valid
.**
*7 H
igh
leve
l of r
apid
gue
ssin
g ha
s in
valid
ated
test
.
Due
to s
tatis
tical
unr
elia
bilit
y, s
umm
ary
data
for
grou
ps o
f les
s th
an 1
0 ar
e no
t sho
wn.
* T
his
data
is n
ot a
vaila
ble
for
repo
rtin
g. P
leas
e re
fer
to h
elp
and
docu
men
tatio
n fo
r m
ore
info
rmat
ion.
Lexi
le®
is a
trad
emar
k of
Met
aMet
rics,
Inc.
, and
is r
egis
tere
d in
the
Uni
ted
Sta
tes
and
abro
ad.
Gen
erat
ed12
/14/
18, 1
0:22
:16
AM
CO
NF
IDE
NT
IALI
TY
NO
TIC
E: T
his
info
rmat
ion
may
be
conf
iden
tial a
nd le
gally
pro
tect
ed fr
om d
iscl
osur
e.©
NW
EA
201
8. M
AP
is a
reg
iste
red
trad
emar
k. N
WE
A, M
AP
Gro
wth
and
MA
P S
kills
are
trad
emar
ks o
f NW
EA
in th
e U
.S. a
nd in
oth
er c
ount
ries.
© C
opyr
ight
201
0. N
atio
nal G
over
nors
Ass
ocia
tion
Cen
ter
for
Bes
t Pra
ctic
es a
nd C
ounc
il of
Chi
ef S
tate
Sch
ool O
ffice
rs. A
ll rig
hts
rese
rved
.
Pag
e4
of6
Gra
de
Rep
ort
Gra
de
8T
erm
:F
all 2
018-
2019
Dis
tric
t:N
oli I
ndia
n S
choo
l (B
IE)
Sch
oo
l:N
oli S
choo
l
No
rms
Ref
eren
ce D
ata:
2015
Wee
ks o
f In
stru
ctio
n:
4 (F
all 2
018)
Gro
up
ing
:N
one
Sm
all G
rou
p D
isp
lay:
N
o
Rea
din
g
Gro
wth
: R
ead
ing
6+
CA
201
0 V
2 / C
A C
omm
on C
ore
Eng
lish
Lang
uage
Art
s: 2
010
Su
mm
ary
To
tal S
tud
ents
Wit
h V
alid
Gro
wth
Tes
t S
core
s18
Mea
n R
IT20
4.1
Sta
nd
ard
Dev
iati
on
11.7
Dis
tric
t G
rad
e L
evel
Mea
n R
IT20
4.1
Stu
den
ts A
t o
r A
bo
ve D
istr
ict
Gra
de
Lev
el M
ean
RIT
9
No
rm G
rad
e L
evel
Mea
n R
IT21
7.2
Stu
den
ts A
t o
r A
bo
ve N
orm
Gra
de
Lev
el M
ean
RIT
1 Lo
%ile
< 2
1L
oA
vg%
ile 2
1-40
Avg
%ile
41-
60H
iAvg
%ile
61-
80H
i%
ile >
80
Mea
n R
IT(+
/- S
mp
Err
)S
td D
ev
Ove
rall
Per
form
ance
cou
nt
%co
un
t%
cou
nt
%co
un
t%
cou
nt
%
Gro
wth
: R
ead
ing
6+
CA
201
0 V
2 / C
A C
om
mo
n C
ore
En
glis
h
Lan
gu
age
Art
s: 2
010
950
%4
22%
422
%1
6%0
0%20
1-20
4-20
711
.7
Go
al A
rea
Lit
erat
ure
950
%4
22%
422
%1
6%0
0%20
1-20
4-20
712
.7
Info
rmat
ion
al T
ext
1056
%2
11%
422
%2
11%
00%
200-
204-
208
15.5
Vo
cab
ula
ry A
cqu
isit
ion
an
d U
se8
44%
739
%1
6%2
11%
00%
202-
205-
207
11.4
19h

Exp
lan
ato
ry N
ote
sT
ests
sho
wn
in g
ray
are
excl
uded
from
sum
mar
y st
atis
tics.
Eith
er th
e te
st o
ccur
red
outs
ide
the
test
ing
win
dow
for
a te
rm, h
ad a
n in
valid
sco
re, o
r w
as a
rep
eat t
est f
or a
stu
dent
with
in a
term
.
Tes
t Inv
alid
atio
n R
easo
ns:
***1
The
test
dur
atio
n w
as to
o sh
ort t
o pr
ovid
e a
valid
res
ult.
***2
The
ove
rall
RIT
sco
re fo
r th
is te
st is
abo
ve th
e va
lid r
ange
.**
*3 T
he o
vera
ll R
IT s
core
for
this
test
is b
elow
the
valid
ran
ge.
***4
The
sta
ndar
d er
ror
for
this
test
is b
elow
acc
epta
ble
limits
. **
*5 T
he s
tand
ard
erro
r fo
r th
is te
st is
abo
ve a
ccep
tabl
e lim
its.
***6
The
test
has
bee
n id
entif
ied
as in
valid
.**
*7 H
igh
leve
l of r
apid
gue
ssin
g ha
s in
valid
ated
test
.
Due
to s
tatis
tical
unr
elia
bilit
y, s
umm
ary
data
for
grou
ps o
f les
s th
an 1
0 ar
e no
t sho
wn.
* T
his
data
is n
ot a
vaila
ble
for
repo
rtin
g. P
leas
e re
fer
to h
elp
and
docu
men
tatio
n fo
r m
ore
info
rmat
ion.
Lexi
le®
is a
trad
emar
k of
Met
aMet
rics,
Inc.
, and
is r
egis
tere
d in
the
Uni
ted
Sta
tes
and
abro
ad.
Gen
erat
ed12
/14/
18, 1
0:22
:16
AM
CO
NF
IDE
NT
IALI
TY
NO
TIC
E: T
his
info
rmat
ion
may
be
conf
iden
tial a
nd le
gally
pro
tect
ed fr
om d
iscl
osur
e.©
NW
EA
201
8. M
AP
is a
reg
iste
red
trad
emar
k. N
WE
A, M
AP
Gro
wth
and
MA
P S
kills
are
trad
emar
ks o
f NW
EA
in th
e U
.S. a
nd in
oth
er c
ount
ries.
© C
opyr
ight
201
0. N
atio
nal G
over
nors
Ass
ocia
tion
Cen
ter
for
Bes
t Pra
ctic
es a
nd C
ounc
il of
Chi
ef S
tate
Sch
ool O
ffice
rs. A
ll rig
hts
rese
rved
.
Pag
e6
of6
Gra
de
Rep
ort
Gra
de
8T
erm
:F
all 2
018-
2019
Dis
tric
t:N
oli I
ndia
n S
choo
l (B
IE)
Sch
oo
l:N
oli S
choo
l
No
rms
Ref
eren
ce D
ata:
2015
Wee
ks o
f In
stru
ctio
n:
4 (F
all 2
018)
Gro
up
ing
:N
one
Sm
all G
rou
p D
isp
lay:
N
o
Lan
gu
age
Usa
ge
Gro
wth
: L
ang
uag
e 2-
12 C
A 2
010
/ CA
Com
mon
Cor
e E
nglis
h La
ngua
ge A
rts:
201
0
Su
mm
ary
To
tal S
tud
ents
Wit
h V
alid
Gro
wth
Tes
t S
core
s19
Mea
n R
IT20
2.1
Sta
nd
ard
Dev
iati
on
10.7
Dis
tric
t G
rad
e L
evel
Mea
n R
IT20
2.1
Stu
den
ts A
t o
r A
bo
ve D
istr
ict
Gra
de
Lev
el M
ean
RIT
11
No
rm G
rad
e L
evel
Mea
n R
IT21
6.2
Stu
den
ts A
t o
r A
bo
ve N
orm
Gra
de
Lev
el M
ean
RIT
0 Lo
%ile
< 2
1L
oA
vg%
ile 2
1-40
Avg
%ile
41-
60H
iAvg
%ile
61-
80H
i%
ile >
80
Mea
n R
IT(+
/- S
mp
Err
)S
td D
ev
Ove
rall
Per
form
ance
cou
nt
%co
un
t%
cou
nt
%co
un
t%
cou
nt
%
Gro
wth
: L
ang
uag
e 2-
12 C
A 2
010
/ CA
Co
mm
on
Co
re E
ng
lish
L
ang
uag
eA
rts:
201
011
58%
421
%4
21%
00%
00%
200-
202-
205
10.7
Go
al A
rea
Wri
tin
g:
Pla
n, O
rgan
ize,
Dev
elo
p, R
evis
e, R
esea
rch
1158
%3
16%
526
%0
0%0
0%19
9-20
1-20
410
.9
Lan
gu
age:
Un
der
stan
d, E
dit
fo
r G
ram
mar
, Usa
ge
1368
%1
5%4
21%
15%
00%
198-
201-
204
13.1
Lan
gu
age:
Un
der
stan
d, E
dit
Mec
han
ics
842
%7
37%
316
%0
0%1
5%20
1-20
4-20
712
.5
19i

Exp
lan
ato
ry N
ote
sT
ests
sho
wn
in g
ray
are
excl
uded
from
sum
mar
y st
atis
tics.
Eith
er th
e te
st o
ccur
red
outs
ide
the
test
ing
win
dow
for
a te
rm, h
ad a
n in
valid
sco
re, o
r w
as a
rep
eat t
est f
or a
stu
dent
with
in a
term
.
Tes
t Inv
alid
atio
n R
easo
ns:
***1
The
test
dur
atio
n w
as to
o sh
ort t
o pr
ovid
e a
valid
res
ult.
***2
The
ove
rall
RIT
sco
re fo
r th
is te
st is
abo
ve th
e va
lid r
ange
.**
*3 T
he o
vera
ll R
IT s
core
for
this
test
is b
elow
the
valid
ran
ge.
***4
The
sta
ndar
d er
ror
for
this
test
is b
elow
acc
epta
ble
limits
. **
*5 T
he s
tand
ard
erro
r fo
r th
is te
st is
abo
ve a
ccep
tabl
e lim
its.
***6
The
test
has
bee
n id
entif
ied
as in
valid
.**
*7 H
igh
leve
l of r
apid
gue
ssin
g ha
s in
valid
ated
test
.
Due
to s
tatis
tical
unr
elia
bilit
y, s
umm
ary
data
for
grou
ps o
f les
s th
an 1
0 ar
e no
t sho
wn.
* T
his
data
is n
ot a
vaila
ble
for
repo
rtin
g. P
leas
e re
fer
to h
elp
and
docu
men
tatio
n fo
r m
ore
info
rmat
ion.
Lexi
le®
is a
trad
emar
k of
Met
aMet
rics,
Inc.
, and
is r
egis
tere
d in
the
Uni
ted
Sta
tes
and
abro
ad.
Gen
erat
ed12
/14/
18, 1
0:21
:44
AM
CO
NF
IDE
NT
IALI
TY
NO
TIC
E: T
his
info
rmat
ion
may
be
conf
iden
tial a
nd le
gally
pro
tect
ed fr
om d
iscl
osur
e.©
NW
EA
201
8. M
AP
is a
reg
iste
red
trad
emar
k. N
WE
A, M
AP
Gro
wth
and
MA
P S
kills
are
trad
emar
ks o
f NW
EA
in th
e U
.S. a
nd in
oth
er c
ount
ries.
© C
opyr
ight
201
0. N
atio
nal G
over
nors
Ass
ocia
tion
Cen
ter
for
Bes
t Pra
ctic
es a
nd C
ounc
il of
Chi
ef S
tate
Sch
ool O
ffice
rs. A
ll rig
hts
rese
rved
.
Pag
e2
of7
Gra
de
Rep
ort
Gra
de
11T
erm
:F
all 2
018-
2019
Dis
tric
t:N
oli I
ndia
n S
choo
l (B
IE)
Sch
oo
l:N
oli S
choo
l
No
rms
Ref
eren
ce D
ata:
2015
Wee
ks o
f In
stru
ctio
n:
4 (F
all 2
018)
Gro
up
ing
:N
one
Sm
all G
rou
p D
isp
lay:
N
o
Mat
hem
atic
s
Gro
wth
: M
ath
6+
CA
201
0 / C
A C
omm
on C
ore
Mat
hem
atic
s: 2
010
Su
mm
ary
To
tal S
tud
ents
Wit
h V
alid
Gro
wth
Tes
t S
core
s14
Mea
n R
IT21
0.8
Sta
nd
ard
Dev
iati
on
15.3
Dis
tric
t G
rad
e L
evel
Mea
n R
IT21
1.3
Stu
den
ts A
t o
r A
bo
ve D
istr
ict
Gra
de
Lev
el M
ean
RIT
7
No
rm G
rad
e L
evel
Mea
n R
IT23
3.3
Stu
den
ts A
t o
r A
bo
ve N
orm
Gra
de
Lev
el M
ean
RIT
0 Lo
%ile
< 2
1L
oA
vg%
ile 2
1-40
Avg
%ile
41-
60H
iAvg
%ile
61-
80H
i%
ile >
80
Mea
n R
IT(+
/- S
mp
Err
)S
td D
ev
Ove
rall
Per
form
ance
cou
nt
%co
un
t%
cou
nt
%co
un
t%
cou
nt
%
Gro
wth
: M
ath
6+
CA
201
0 / C
A C
om
mo
n C
ore
Mat
hem
atic
s:
2010
857
%5
36%
17%
00%
00%
207-
211-
215
15.3
Go
al A
rea
Op
erat
ion
s an
d A
lgeb
raic
Th
inki
ng
750
%4
29%
214
%1
7%0
0%21
0-21
4-21
917
.6
Th
e R
eal a
nd
Co
mp
lex
Nu
mb
er S
yste
ms
1071
%3
21%
17%
00%
00%
205-
210-
214
16.3
Geo
met
ry7
50%
429
%3
21%
00%
00%
207-
211-
216
16.3
Sta
tist
ics
and
Pro
bab
ility
964
%4
29%
17%
00%
00%
204-
208-
213
15.8
19j

Exp
lan
ato
ry N
ote
sT
ests
sho
wn
in g
ray
are
excl
uded
from
sum
mar
y st
atis
tics.
Eith
er th
e te
st o
ccur
red
outs
ide
the
test
ing
win
dow
for
a te
rm, h
ad a
n in
valid
sco
re, o
r w
as a
rep
eat t
est f
or a
stu
dent
with
in a
term
.
Tes
t Inv
alid
atio
n R
easo
ns:
***1
The
test
dur
atio
n w
as to
o sh
ort t
o pr
ovid
e a
valid
res
ult.
***2
The
ove
rall
RIT
sco
re fo
r th
is te
st is
abo
ve th
e va
lid r
ange
.**
*3 T
he o
vera
ll R
IT s
core
for
this
test
is b
elow
the
valid
ran
ge.
***4
The
sta
ndar
d er
ror
for
this
test
is b
elow
acc
epta
ble
limits
. **
*5 T
he s
tand
ard
erro
r fo
r th
is te
st is
abo
ve a
ccep
tabl
e lim
its.
***6
The
test
has
bee
n id
entif
ied
as in
valid
.**
*7 H
igh
leve
l of r
apid
gue
ssin
g ha
s in
valid
ated
test
.
Due
to s
tatis
tical
unr
elia
bilit
y, s
umm
ary
data
for
grou
ps o
f les
s th
an 1
0 ar
e no
t sho
wn.
* T
his
data
is n
ot a
vaila
ble
for
repo
rtin
g. P
leas
e re
fer
to h
elp
and
docu
men
tatio
n fo
r m
ore
info
rmat
ion.
Lexi
le®
is a
trad
emar
k of
Met
aMet
rics,
Inc.
, and
is r
egis
tere
d in
the
Uni
ted
Sta
tes
and
abro
ad.
Gen
erat
ed12
/14/
18, 1
0:21
:44
AM
CO
NF
IDE
NT
IALI
TY
NO
TIC
E: T
his
info
rmat
ion
may
be
conf
iden
tial a
nd le
gally
pro
tect
ed fr
om d
iscl
osur
e.©
NW
EA
201
8. M
AP
is a
reg
iste
red
trad
emar
k. N
WE
A, M
AP
Gro
wth
and
MA
P S
kills
are
trad
emar
ks o
f NW
EA
in th
e U
.S. a
nd in
oth
er c
ount
ries.
© C
opyr
ight
201
0. N
atio
nal G
over
nors
Ass
ocia
tion
Cen
ter
for
Bes
t Pra
ctic
es a
nd C
ounc
il of
Chi
ef S
tate
Sch
ool O
ffice
rs. A
ll rig
hts
rese
rved
.
Pag
e5
of7
Gra
de
Rep
ort
Gra
de
11T
erm
:F
all 2
018-
2019
Dis
tric
t:N
oli I
ndia
n S
choo
l (B
IE)
Sch
oo
l:N
oli S
choo
l
No
rms
Ref
eren
ce D
ata:
2015
Wee
ks o
f In
stru
ctio
n:
4 (F
all 2
018)
Gro
up
ing
:N
one
Sm
all G
rou
p D
isp
lay:
N
o
Rea
din
g
Gro
wth
: R
ead
ing
6+
CA
201
0 V
2 / C
A C
omm
on C
ore
Eng
lish
Lang
uage
Art
s: 2
010
Su
mm
ary
To
tal S
tud
ents
Wit
h V
alid
Gro
wth
Tes
t S
core
s15
Mea
n R
IT21
6.1
Sta
nd
ard
Dev
iati
on
15
Dis
tric
t G
rad
e L
evel
Mea
n R
IT21
6.1
Stu
den
ts A
t o
r A
bo
ve D
istr
ict
Gra
de
Lev
el M
ean
RIT
7
No
rm G
rad
e L
evel
Mea
n R
IT22
2.6
Stu
den
ts A
t o
r A
bo
ve N
orm
Gra
de
Lev
el M
ean
RIT
6 Lo
%ile
< 2
1L
oA
vg%
ile 2
1-40
Avg
%ile
41-
60H
iAvg
%ile
61-
80H
i%
ile >
80
Mea
n R
IT(+
/- S
mp
Err
)S
td D
ev
Ove
rall
Per
form
ance
cou
nt
%co
un
t%
cou
nt
%co
un
t%
cou
nt
%
Gro
wth
: R
ead
ing
6+
CA
201
0 V
2 / C
A C
om
mo
n C
ore
En
glis
h
Lan
gu
age
Art
s: 2
010
17%
747
%4
27%
320
%0
0%21
2-21
6-22
015
Go
al A
rea
Lit
erat
ure
320
%3
20%
640
%3
20%
00%
213-
217-
221
14.5
Info
rmat
ion
al T
ext
320
%6
40%
213
%4
27%
00%
211-
215-
220
17
Vo
cab
ula
ry A
cqu
isit
ion
an
d U
se4
27%
320
%5
33%
320
%0
0%21
1-21
5-22
017
19k

Exp
lan
ato
ry N
ote
sT
ests
sho
wn
in g
ray
are
excl
uded
from
sum
mar
y st
atis
tics.
Eith
er th
e te
st o
ccur
red
outs
ide
the
test
ing
win
dow
for
a te
rm, h
ad a
n in
valid
sco
re, o
r w
as a
rep
eat t
est f
or a
stu
dent
with
in a
term
.
Tes
t Inv
alid
atio
n R
easo
ns:
***1
The
test
dur
atio
n w
as to
o sh
ort t
o pr
ovid
e a
valid
res
ult.
***2
The
ove
rall
RIT
sco
re fo
r th
is te
st is
abo
ve th
e va
lid r
ange
.**
*3 T
he o
vera
ll R
IT s
core
for
this
test
is b
elow
the
valid
ran
ge.
***4
The
sta
ndar
d er
ror
for
this
test
is b
elow
acc
epta
ble
limits
. **
*5 T
he s
tand
ard
erro
r fo
r th
is te
st is
abo
ve a
ccep
tabl
e lim
its.
***6
The
test
has
bee
n id
entif
ied
as in
valid
.**
*7 H
igh
leve
l of r
apid
gue
ssin
g ha
s in
valid
ated
test
.
Due
to s
tatis
tical
unr
elia
bilit
y, s
umm
ary
data
for
grou
ps o
f les
s th
an 1
0 ar
e no
t sho
wn.
* T
his
data
is n
ot a
vaila
ble
for
repo
rtin
g. P
leas
e re
fer
to h
elp
and
docu
men
tatio
n fo
r m
ore
info
rmat
ion.
Lexi
le®
is a
trad
emar
k of
Met
aMet
rics,
Inc.
, and
is r
egis
tere
d in
the
Uni
ted
Sta
tes
and
abro
ad.
Gen
erat
ed12
/14/
18, 1
0:21
:44
AM
CO
NF
IDE
NT
IALI
TY
NO
TIC
E: T
his
info
rmat
ion
may
be
conf
iden
tial a
nd le
gally
pro
tect
ed fr
om d
iscl
osur
e.©
NW
EA
201
8. M
AP
is a
reg
iste
red
trad
emar
k. N
WE
A, M
AP
Gro
wth
and
MA
P S
kills
are
trad
emar
ks o
f NW
EA
in th
e U
.S. a
nd in
oth
er c
ount
ries.
© C
opyr
ight
201
0. N
atio
nal G
over
nors
Ass
ocia
tion
Cen
ter
for
Bes
t Pra
ctic
es a
nd C
ounc
il of
Chi
ef S
tate
Sch
ool O
ffice
rs. A
ll rig
hts
rese
rved
.
Pag
e7
of7
Gra
de
Rep
ort
Gra
de
11T
erm
:F
all 2
018-
2019
Dis
tric
t:N
oli I
ndia
n S
choo
l (B
IE)
Sch
oo
l:N
oli S
choo
l
No
rms
Ref
eren
ce D
ata:
2015
Wee
ks o
f In
stru
ctio
n:
4 (F
all 2
018)
Gro
up
ing
:N
one
Sm
all G
rou
p D
isp
lay:
N
o
Lan
gu
age
Usa
ge
Gro
wth
: L
ang
uag
e 2-
12 C
A 2
010
/ CA
Com
mon
Cor
e E
nglis
h La
ngua
ge A
rts:
201
0
Su
mm
ary
To
tal S
tud
ents
Wit
h V
alid
Gro
wth
Tes
t S
core
s13
Mea
n R
IT21
1.8
Sta
nd
ard
Dev
iati
on
14.7
Dis
tric
t G
rad
e L
evel
Mea
n R
IT21
1.8
Stu
den
ts A
t o
r A
bo
ve D
istr
ict
Gra
de
Lev
el M
ean
RIT
10
No
rm G
rad
e L
evel
Mea
n R
IT22
1.5
Stu
den
ts A
t o
r A
bo
ve N
orm
Gra
de
Lev
el M
ean
RIT
2 Lo
%ile
< 2
1L
oA
vg%
ile 2
1-40
Avg
%ile
41-
60H
iAvg
%ile
61-
80H
i%
ile >
80
Mea
n R
IT(+
/- S
mp
Err
)S
td D
ev
Ove
rall
Per
form
ance
cou
nt
%co
un
t%
cou
nt
%co
un
t%
cou
nt
%
Gro
wth
: L
ang
uag
e 2-
12 C
A 2
010
/ CA
Co
mm
on
Co
re E
ng
lish
L
ang
uag
eA
rts:
201
03
23%
538
%5
38%
00%
00%
208-
212-
216
14.7
Go
al A
rea
Wri
tin
g:
Pla
n, O
rgan
ize,
Dev
elo
p, R
evis
e, R
esea
rch
431
%3
23%
538
%1
8%0
0%20
7-21
2-21
616
.2
Lan
gu
age:
Un
der
stan
d, E
dit
fo
r G
ram
mar
, Usa
ge
431
%5
38%
431
%0
0%0
0%20
5-21
0-21
415
.1
Lan
gu
age:
Un
der
stan
d, E
dit
Mec
han
ics
18%
862
%1
8%3
23%
00%
209-
214-
218
15.3
19l

Exp
lan
ato
ry N
ote
sD
ue to
sta
tistic
al u
nrel
iabi
lity,
sum
mar
y da
ta fo
r gr
oups
of l
ess
than
10
are
not s
how
n.A
goa
l mea
n sh
own
with
bo
ld it
alic
rep
rese
nts
perf
orm
ance
that
mig
ht b
e an
are
a of
con
cern
. A g
oal m
ean
show
n w
ith b
old
un
der
line
repr
esen
ts a
n ar
ea o
f rel
ativ
ely
stro
ng p
erfo
rman
ce.
Gen
erat
ed12
/14/
18, 1
0:09
:17
AM
CO
NF
IDE
NT
IALI
TY
NO
TIC
E: T
his
info
rmat
ion
may
be
conf
iden
tial a
nd le
gally
pro
tect
ed fr
om d
iscl
osur
e.©
NW
EA
201
8. M
AP
is a
reg
iste
red
trad
emar
k. N
WE
A, M
AP
Gro
wth
and
MA
P S
kills
are
trad
emar
ks o
f NW
EA
in th
e U
.S. a
nd in
oth
er c
ount
ries.
© C
opyr
ight
201
0. N
atio
nal G
over
nors
Ass
ocia
tion
Cen
ter
for
Bes
t Pra
ctic
es a
nd C
ounc
il of
Chi
ef S
tate
Sch
ool O
ffice
rs. A
ll rig
hts
rese
rved
.
Pag
e2
of20
Dis
tric
t S
um
mar
y R
epo
rt
Ag
gre
gat
e b
y S
cho
ol
Ter
m:
Fal
l 201
8-20
19D
istr
ict:
Nol
i Ind
ian
Sch
ool (
BIE
)G
rou
pin
g:
Non
eS
mal
l Gro
up
Dis
pla
y:
No
Mat
hem
atic
s
No
li S
cho
ol
Gro
wth
: M
ath
6+
CA
201
0C
A C
omm
on C
ore
Mat
hem
atic
s: 2
010
Go
al P
erfo
rman
ce
Ter
mG
rad
eS
tud
ent
Co
un
tM
ean
RIT
Std
Dev
Med
ian
Op
erat
ion
s an
d A
lgeb
raic
T
hin
kin
gT
he
Rea
l an
d C
om
ple
x N
um
ber
S
yste
ms
Geo
met
ryS
tati
stic
s an
d P
rob
abili
ty
Mea
nS
td D
evM
ean
Std
Dev
Mea
nS
td D
evM
ean
Std
Dev
Fal
l 201
8-20
196
7
Fal
l 201
7-20
186
1119
7.5
16.7
202
198.
519
.619
9.2
18.2
197.
516
.619
5.0
16.1
Win
ter
2016
-201
76
1620
0.7
15.9
205
202.
216
.420
4.4
16.5
197.
618
.619
8.9
15.0
Fal
l 201
6-20
176
1520
2.7
18.3
205
202.
123
.320
5.2
20.2
203.
617
.920
0.3
14.8
Fal
l 201
8-20
197
1420
4.1
17.0
204
207.
617
.420
8.1
19.6
200.
817
.019
9.9
17.8
Fal
l 201
7-20
187
1920
3.5
15.6
200
204.
315
.720
5.6
18.3
202.
218
.420
1.4
13.5
Win
ter
2016
-201
77
2020
5.0
17.0
207
203.
921
.920
8.2
15.0
206.
617
.220
1.8
16.3
Fal
l 201
6-20
177
2120
3.0
16.9
204
202.
719
.920
7.0
18.3
200.
914
.420
1.9
19.2
Fal
l 201
8-20
198
1920
6.1
11.1
205
206.
213
.720
8.2
13.8
205.
112
.620
4.6
12.1
Fal
l 201
7-20
188
1320
7.2
12.6
204
207.
214
.521
0.2
14.2
206.
212
.120
5.4
13.0
Win
ter
2016
-201
78
1920
5.0
11.9
206
204.
212
.120
9.0
16.1
201.
911
.920
4.5
15.4
Fal
l 201
6-20
178
2320
5.4
14.2
208
207.
616
.920
7.6
15.0
205.
414
.320
1.7
15.2
Fal
l 201
8-20
1911
1421
0.8
15.3
211
214.
417
.620
9.9
16.3
211.
116
.320
8.3
15.8
Fal
l 201
7-20
1811
1321
9.3
14.2
218
222.
217
.422
0.2
12.0
217.
216
.021
7.2
16.7
Win
ter
2016
-201
711
1822
0.3
16.7
220
222.
918
.321
7.5
19.8
221.
317
.321
8.7
15.9
Fal
l 201
6-20
1711
2122
0.0
15.3
223
222.
115
.521
9.5
14.2
220.
118
.921
8.2
16.4
Mat
h S
urv
ey 2
-5 C
om
mo
n C
ore
V5
Ter
mG
rad
eS
tud
ent
Co
un
tM
ean
RIT
Std
Dev
Med
ian
Win
ter
2014
-201
511
2
Mat
h S
urv
ey 6
+ C
om
mo
n C
ore
V3
Ter
mG
rad
eS
tud
ent
Co
un
tM
ean
RIT
Std
Dev
Med
ian
Fal
l 201
2-20
136
3
Fal
l 201
2-20
137
6
19m

Exp
lan
ato
ry N
ote
sD
ue to
sta
tistic
al u
nrel
iabi
lity,
sum
mar
y da
ta fo
r gr
oups
of l
ess
than
10
are
not s
how
n.A
goa
l mea
n sh
own
with
bo
ld it
alic
rep
rese
nts
perf
orm
ance
that
mig
ht b
e an
are
a of
con
cern
. A g
oal m
ean
show
n w
ith b
old
un
der
line
repr
esen
ts a
n ar
ea o
f rel
ativ
ely
stro
ng p
erfo
rman
ce.
Gen
erat
ed12
/14/
18, 1
0:09
:17
AM
CO
NF
IDE
NT
IALI
TY
NO
TIC
E: T
his
info
rmat
ion
may
be
conf
iden
tial a
nd le
gally
pro
tect
ed fr
om d
iscl
osur
e.©
NW
EA
201
8. M
AP
is a
reg
iste
red
trad
emar
k. N
WE
A, M
AP
Gro
wth
and
MA
P S
kills
are
trad
emar
ks o
f NW
EA
in th
e U
.S. a
nd in
oth
er c
ount
ries.
© C
opyr
ight
201
0. N
atio
nal G
over
nors
Ass
ocia
tion
Cen
ter
for
Bes
t Pra
ctic
es a
nd C
ounc
il of
Chi
ef S
tate
Sch
ool O
ffice
rs. A
ll rig
hts
rese
rved
.
Pag
e8
of20
Dis
tric
t S
um
mar
y R
epo
rt
Ag
gre
gat
e b
y S
cho
ol
Ter
m:
Fal
l 201
8-20
19D
istr
ict:
Nol
i Ind
ian
Sch
ool (
BIE
)G
rou
pin
g:
Non
eS
mal
l Gro
up
Dis
pla
y:
No
Rea
din
g
No
li S
cho
ol
Gro
wth
: R
ead
ing
6+
CA
201
0 V
2C
A C
omm
on C
ore
Eng
lish
Lang
uage
Art
s: 2
010
Go
al P
erfo
rman
ce
Ter
mG
rad
eS
tud
ent
Co
un
tM
ean
RIT
Std
Dev
Med
ian
Lit
erat
ure
Info
rmat
ion
al T
ext
Vo
cab
ula
ry A
cqu
isit
ion
an
d U
se
Mea
nS
td D
evM
ean
Std
Dev
Mea
nS
td D
ev
Fal
l 201
8-20
196
7
Fal
l 201
7-20
186
1120
0.1
18.7
206
199.
320
.620
0.1
18.9
201.
720
.6
Win
ter
2016
-201
76
1520
1.2
10.8
204
202.
412
.119
8.9
12.8
201.
79.
8
Fal
l 201
6-20
176
1519
9.1
16.5
202
197.
116
.719
9.7
17.9
200.
417
.0
Fal
l 201
8-20
197
1320
0.7
18.4
202
200.
419
.419
8.3
22.1
203.
114
.8
Fal
l 201
7-20
187
1820
6.7
10.2
208
205.
711
.920
7.8
10.9
206.
311
.9
Win
ter
2016
-201
77
2020
1.3
16.5
202
200.
520
.420
1.7
16.2
202.
115
.3
Fal
l 201
6-20
177
2120
5.3
13.6
207
205.
015
.520
4.9
15.2
206.
314
.4
Fal
l 201
8-20
198
1820
4.1
11.7
206
203.
912
.720
4.1
15.5
204.
511
.4
Fal
l 201
7-20
188
1320
7.8
12.4
208
209.
613
.520
4.5
12.1
208.
813
.8
Win
ter
2016
-201
78
2120
3.3
15.5
206
202.
317
.320
3.0
17.2
204.
013
.8
Fal
l 201
6-20
178
2420
5.6
14.3
206
206.
816
.920
6.0
15.5
204.
513
.3
Fal
l 201
8-20
1911
1521
6.1
15.0
215
217.
114
.521
5.5
17.0
215.
317
.0
Fal
l 201
7-20
1811
1322
0.0
10.3
226
220.
212
.821
9.9
12.5
219.
810
.3
Win
ter
2016
-201
711
1821
9.7
12.3
221
217.
914
.222
0.2
13.1
220.
412
.8
Fal
l 201
6-20
1711
2121
9.6
11.3
221
219.
212
.421
7.9
12.8
221.
813
.0
Rea
din
g S
urv
ey 6
+ C
om
mo
n C
ore
V3
Ter
mG
rad
eS
tud
ent
Co
un
tM
ean
RIT
Std
Dev
Med
ian
Spr
ing
2012
-201
39
1
19n

Exp
lan
ato
ry N
ote
sD
ue to
sta
tistic
al u
nrel
iabi
lity,
sum
mar
y da
ta fo
r gr
oups
of l
ess
than
10
are
not s
how
n.A
goa
l mea
n sh
own
with
bo
ld it
alic
rep
rese
nts
perf
orm
ance
that
mig
ht b
e an
are
a of
con
cern
. A g
oal m
ean
show
n w
ith b
old
un
der
line
repr
esen
ts a
n ar
ea o
f rel
ativ
ely
stro
ng p
erfo
rman
ce.
Gen
erat
ed12
/14/
18, 1
0:09
:17
AM
CO
NF
IDE
NT
IALI
TY
NO
TIC
E: T
his
info
rmat
ion
may
be
conf
iden
tial a
nd le
gally
pro
tect
ed fr
om d
iscl
osur
e.©
NW
EA
201
8. M
AP
is a
reg
iste
red
trad
emar
k. N
WE
A, M
AP
Gro
wth
and
MA
P S
kills
are
trad
emar
ks o
f NW
EA
in th
e U
.S. a
nd in
oth
er c
ount
ries.
© C
opyr
ight
201
0. N
atio
nal G
over
nors
Ass
ocia
tion
Cen
ter
for
Bes
t Pra
ctic
es a
nd C
ounc
il of
Chi
ef S
tate
Sch
ool O
ffice
rs. A
ll rig
hts
rese
rved
.
Pag
e11
of20
Dis
tric
t S
um
mar
y R
epo
rt
Ag
gre
gat
e b
y S
cho
ol
Ter
m:
Fal
l 201
8-20
19D
istr
ict:
Nol
i Ind
ian
Sch
ool (
BIE
)G
rou
pin
g:
Non
eS
mal
l Gro
up
Dis
pla
y:
No
Lan
gu
age
Usa
ge
No
li S
cho
ol
Gro
wth
: L
ang
uag
e 2-
12 C
A 2
010
CA
Com
mon
Cor
e E
nglis
h La
ngua
ge A
rts:
201
0G
oal
Per
form
ance
Ter
mG
rad
eS
tud
ent
Co
un
tM
ean
RIT
Std
Dev
Med
ian
Wri
tin
g:
Pla
n, O
rgan
ize,
Dev
elo
p, R
evis
e,
Res
earc
hL
ang
uag
e: U
nd
erst
and
, Ed
it f
or
Gra
mm
ar,
Usa
ge
Lan
gu
age:
Un
der
stan
d, E
dit
Mec
han
ics
Mea
nS
td D
evM
ean
Std
Dev
Mea
nS
td D
ev
Fal
l 201
8-20
196
7
Fal
l 201
7-20
186
1119
4.3
20.5
202
193.
920
.419
3.3
21.1
195.
721
.6
Win
ter
2016
-201
76
1620
0.6
16.0
206
197.
815
.220
0.9
15.8
202.
717
.4
Fal
l 201
6-20
176
1519
8.6
15.6
203
197.
015
.019
7.8
16.2
201.
016
.7
Fal
l 201
8-20
197
1319
9.5
15.1
194
196.
017
.020
1.8
13.3
200.
617
.8
Fal
l 201
7-20
187
1920
2.4
12.1
204
203.
310
.920
0.5
12.8
203.
715
.1
Win
ter
2016
-201
77
2020
0.9
17.0
201
199.
217
.720
2.2
15.7
201.
519
.9
Fal
l 201
6-20
177
2120
0.2
14.8
202
198.
316
.620
3.0
15.7
199.
315
.7
Fal
l 201
8-20
198
1920
2.1
10.7
203
201.
310
.920
1.3
13.1
203.
912
.5
Fal
l 201
7-20
188
1320
4.7
11.6
202
203.
413
.720
5.2
13.3
205.
511
.2
Win
ter
2016
-201
78
2020
6.0
11.4
207
206.
111
.420
5.0
12.2
207.
012
.7
Fal
l 201
6-20
178
2320
0.8
16.2
204
200.
215
.620
0.2
17.5
202.
316
.4
Fal
l 201
8-20
1911
1321
1.8
14.7
216
211.
816
.220
9.8
15.1
213.
715
.3
Fal
l 201
7-20
1811
1321
7.7
6.8
216
214.
88.
821
7.4
7.5
220.
67.
8
Win
ter
2016
-201
711
1721
4.9
11.7
217
215.
113
.021
4.9
11.4
214.
812
.8
Fal
l 201
6-20
1711
2121
4.8
10.8
218
216.
511
.721
4.4
10.5
213.
212
.4
19o
Mid-Cycle Progress Report Rev. 12/13
20
APPENDIX B: A-G Approved Course List
Please see following pages.

20a

20b

20c

Mid-Cycle Progress Report Rev. 12/13
21
APPENDIX C: Courses and Curricula
Middle School
Course Title Curriculum
History/Social Science
Social Studies, 6th grade
Ancient Civilizations: Through the Renaissance, Houghton Mifflin Harcourt, 2012
Social Studies, 7th grade
World History, Houghton Mifflin Harcourt, 2012
U.S. History, 8th grade
United States History: Beginnings to 1914, Houghton Mifflin Harcourt, 2012
English
English, 6th grade
Teacher-created units of study, with emphasis on the following novels: Because of Winn-Dixie (Kate Dicamillo), Oliver Twist (Charles Dickens), Zia (Scott O'Dell), Island of the Blue Dolphins (Scott O'Dell), and Make Lemonade (Virginia Euwer Wolff).
English, 7th grade
Teacher-created units of study, with emphasis on the following novels: Freak the Mighty (Rodman Philbrick), Reporting Live (Lesley Stahl), Life and Death (Stephanie Meyer), Family Ties (Ernest Hill), and Beowulf (anonymous).
English, 8th grade
Teacher-created units of study, with emphasis on the following novels: My Life is the Sundance (Leonard Peltier), Holes (Louis Sachar), Ceremony (Leslie Marmon Silko), and The Diary of Anne Frank (Otto Frank).
Mathematics
Math, 6th grade Eureka Math grade 6, 2018
Math, 7th grade Eureka Math grade 7, 2018
Math, 8th grade Eureka Math grade 8, 2018
Math, 8th grade pre-algebra
Illustrative Mathematics grade 8, 2018
Science
Earth Science, 6th grade
Teacher-created units using the Next Generation Science Standards, with Interactive Science: Earth Science (Pearson, 2013).
Life Science, 7th grade
Teacher-created units using the Next Generation Science Standards, with Interactive Science: Life Science (Pearson, 2013).
Physical Science, 8th grade
Teacher-created units using the Next Generation Science Standards, with Interactive Science: Physical Science (Pearson, 2013).
Electives
AVID AVID Secondary Elective (AVID, 2018)
Culture Teacher-created units of study

Mid-Cycle Progress Report Rev. 12/13
22
Physical Education
Teacher-created units of study
Rewards (reading intervention)
Rewards, Voyager Sopris Learning, 2018
Study Skills Support class
System 44 (reading intervention)
System 44, Houghton Mifflin Harcourt, 2018
High School
Course Title AG Status Term Curriculum/Textbook
A- History/Social Science
American Democracy
A Approved Semester Principles of American Democracy, McGraw-Hill, 2019
World History A Approved Year World History: Human Legacy, Holt Rinehart Winston, 2007
U.S. History A Approved Year American Anthem: Modern American History, Holt Rinehart Winston, 2007
B- English
English I B Approved Year Teacher designed units of study supplemented by Literature Treasures: Course 4 (Glencoe/McGraw-Hill, 2010), and inquiry-based novel studies selected from Of Mice and Men, Macbeth, Animal Farm, To Kill a Mockingbird, Romeo and Juliet, Night, Lord of the Flies, The Odyssey, Fahrenheit 451, 1984, The Crucible, The Great Gatsby, Hamlet, Gulliver's Travels, The Canterbury Tales, and Frankenstein.
English II B Approved Year Teacher designed units of study supplemented by Literature Treasures: Course 5 (Glencoe/McGraw-Hill, 2010), and inquiry-based novel studies selected from Of Mice and Men, Macbeth, Animal Farm, To Kill a Mockingbird, Romeo and Juliet, Night, Lord of the Flies, The Odyssey, Fahrenheit 451, 1984, The Crucible, The Great Gatsby, Hamlet, Gulliver's Travels, The Canterbury Tales, and Frankenstein.
English III B Approved Year Teacher designed units of study supplemented by Literature Treasures: American Literature (Glencoe/McGraw-Hill, 2010), and inquiry-based novel studies selected from Of Mice and Men, Animal Farm, To Kill a Mockingbird, Night, Lord of the Flies, Fahrenheit 451, 1984, The Crucible, and The Great Gatsby.

Mid-Cycle Progress Report Rev. 12/13
23
English IV B Approved Year Teacher designed units of study supplemented by Literature Treasures: British Literature (Glencoe/McGraw-Hill, 2010), and inquiry-based novel studies selected from Macbeth, Romeo and Juliet, Night, The Odyssey, Hamlet, Gulliver's Travels, The Canterbury Tales, and Frankenstein.
Honors English II
B Approved Year Same as English II, plus the additional textbook Advanced Language and Literature for Honors and Pre-AP English Courses (BFW Publishers, 2016)
Honors English III
B Approved Year Same as English III, plus the additional textbook Advanced Language and Literature for Honors and Pre-AP English Courses (BFW Publishers, 2016)
Honors English IV
B Approved Year Same as English IV, plus the additional textbook Advanced Language and Literature for Honors and Pre-AP English Courses (BFW Publishers, 2016)
C- Mathematics
Calculus C Approved Year Calculus: Graphical, Numerical, Algebraic, Pearson Education, 2010
Math I C Approved Year Secondary Math I, Mathematics Vision Project, 2016
Math II C Approved Year Secondary Math II, Mathematics Vision Project, 2017
Math III C Approved Year Secondary Math III, Mathematics Vision Project, 2018
D- Lab Science
Biology and the Living Earth
D Approved Year Teacher-created units using the Next Generation Science Standards, and the SDCOE course progression found online at https://ngss.sdcoe.net/CA-NGSS-Course-Models/High-School-9-12/Three-Course-Model/The-Living-Earth/Standards-Pages-Living-Earth and with textbook support from Biology (Pearson Prentice Hall, 2004) and Earth Science (Pearson Prentice Hall, 2006).
Chemistry in the Earth System
D Approved Year Teacher-created units using the Next Generation Science Standards, and the SDCOE course progression found online at https://ngss.sdcoe.net/CA-NGSS-Course-Models/High-School-9-12/Three-Course-Model/Chemistry-in-the-Earth-System/Standards-Pages-Chemistry-in-the-Earth-System and with textbook support from Chemistry (Pearson Prentice Hall, 2007) and Earth Science (Pearson Prentice Hall, 2006).
Physics in the Universe
D Approved Year Teacher-created units using the Next Generation Science Standards, and the SDCOE course progression found online at https://ngss.sdcoe.net/CA-NGSS-Course-Models/High-School-9-12/Three-Course-Model/Physics-of-the-Universe/Standards-Pages-Physics-of-the-Universe and with textbook support from Conceptual Physics (Pearson Prentice Hall, 2006) and Earth Science (Pearson Prentice Hall, 2006).

Mid-Cycle Progress Report Rev. 12/13
24
E- Language other than English
Spanish I E Approved Year Avencemos Level 1, Houghton Mifflin Harcourt, 2018
Spanish II E Approved Year Avencemos Level 2, Houghton Mifflin Harcourt, 2018
Spanish III E Approved Year Avencemos Level 3, Houghton Mifflin Harcourt, 2018
Spanish IV E Approved Year Avencemos Level 4, Houghton Mifflin Harcourt, 2018
F- Visual and Perfomring Arts
Art I F Approved Year Exploring Visual Design, Davis Publications, 2011
Painting I F Approved Year Experience Painting, Davis Publications, 2015
Sculpture I F Approved Year Beginning Sculpture, Davis Publications, 2015
G- College-Prep Electives
Agricultural Science
G Approved Semester Teacher-created units of study, with textbook support from Introduction to World Agriscience and Technology (Interstate Publishers Inc., 1997) and Enduring Seeds (Gary Paul Nabhan, 1989).
Anatomy & Physiology
G Approved Semester Essentials of Human Anatomy and Physiology, Pearson: Benjamin Cummings, 2009
AVID 9 G Approved Year AVID Secondary Elective (AVID, 2018)
AVID 10 G Approved Year AVID Secondary Elective (AVID, 2018)
AVID 11 G Approved Year AVID Secondary Elective (AVID, 2018)
AVID 12 G Approved Year AVID Secondary Elective (AVID, 2018)
Computer Science I
G Approved Year CodeCombat (2018) https://codecombat.com/
Economics G Approved Semester Principles of Economics, McGraw-Hill, 2019
Financial Planning
G Approved Year High School Financial Planning Program, National Endowment for Financial Education https://www.hsfpp.org/
Health G Approved Semester Health, Glencoe, 2010
Marine Biology G Approved Semester Marine Science, Pearson Prentice Hall, 2012
Photography & Digital Arts
G Approved Year The Great Courses: Fundamentals of Photography (National Geographic, 2018) and teacher-created units of study utilizing Adobe Education Exchange https://edex.adobe.com/
World Geography
G Approved Year Geography: The Human and Physical World, McGraw-Hill, 2018
Non- A-G Courses
Basketweaving Teacher-created units of study
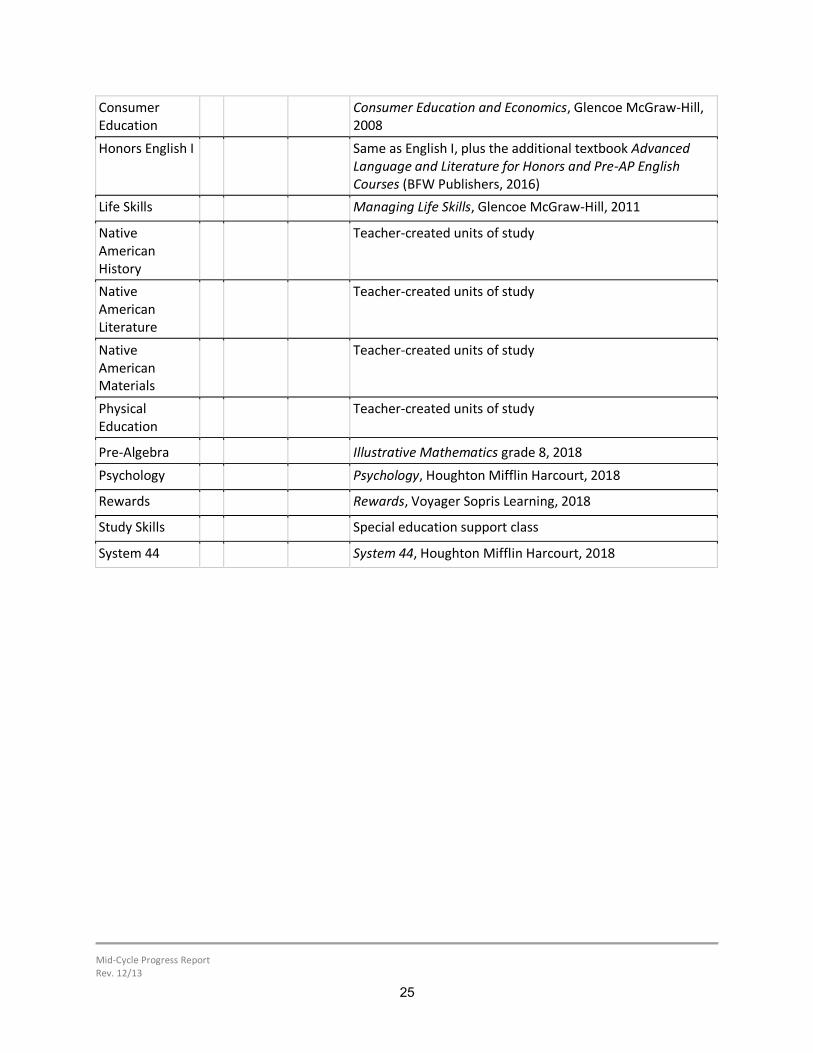
Mid-Cycle Progress Report Rev. 12/13
25
Consumer Education
Consumer Education and Economics, Glencoe McGraw-Hill, 2008
Honors English I Same as English I, plus the additional textbook Advanced Language and Literature for Honors and Pre-AP English Courses (BFW Publishers, 2016)
Life Skills Managing Life Skills, Glencoe McGraw-Hill, 2011
Native American History
Teacher-created units of study
Native American Literature
Teacher-created units of study
Native American Materials
Teacher-created units of study
Physical Education
Teacher-created units of study
Pre-Algebra Illustrative Mathematics grade 8, 2018
Psychology Psychology, Houghton Mifflin Harcourt, 2018
Rewards Rewards, Voyager Sopris Learning, 2018
Study Skills Special education support class
System 44 System 44, Houghton Mifflin Harcourt, 2018