mid day meal scheme
DESCRIPTION
Mid Day Meal Scheme. Ministry of HRD Government of India. MDM-PAB Meeting – ARUNACHAL PRADESH on 27.04.2010. 1. 1. - PowerPoint PPT PresentationTRANSCRIPT

111
Mid Day Meal SchemeMinistry of HRD
Government of IndiaMDM-PAB Meeting – ARUNACHAL PRADESH on
27.04.2010

2
Review of Implementation of
MDMS in ARUNACHAL PRADESH
(Primary + Upper Primary)
(1.4.2009 to 31.12.2009)
Part-I
Ministry of HRD, Govt. of India

33
No. of Schools Covered (PY + UP.PY)
3479
952
4431
3479
952
4431
0
500
1000
1500
2000
2500
3000
3500
4000
4500
5000
Primary Upper Primary Total (PY + U PY)
No. of Institutes No. of Institutes serving MDM

4
PAB Approval Vs State Performance (No. of Working Days in Q1+Q2+Q3)
150146
200
0
50
100
150
200
250
PAB Approval for FY-2009-10
PAB Approval for Q1,Q2, Q3
As per State (Actuals) Q1,Q2, Q3
Ministry of HRD, Govt. of India
73% 75%100%

55
PAB Approval Vs State Performance
(No. of children in Q1+Q2+Q3)
Ministry of HRD, Govt. of India
91% Covered
117% Covered
Note: (Upper Primary): Dibang Valley served only 40% & West Siang 45% childrens
181349
60650
120699
174929
56706
118223
0
20000
40000
60000
80000
100000
120000
140000
160000
180000
200000
Primary Upper Primary Total (PY + U PY)
As per PAB Approval As per State (Actuals)
96%
93%
98%

66
PAB Approval Vs State Performance
(No. of Meals in Q1+Q2+Q3)
1.21
0.89 0.85
1.771.76
2.41
0.00
0.50
1.00
1.50
2.00
2.50
3.00
MEALS[APR-MAR]
MEALSAPPROVED[APR-DEC]
MEALSSERVED
[APR-DEC]
MEALS[APR-MAR]
MEALSAPPROVED[APR-DEC]
MEALSSERVED
[APR-DEC]
100% 73% 73% 100% 73% 70%
PRIMARY
UPPER PRIMRY
Note: (Upper Primary): Dibang Valley served only 30% & West Siang served only 33% meals & Tirap 69% meals served.
7
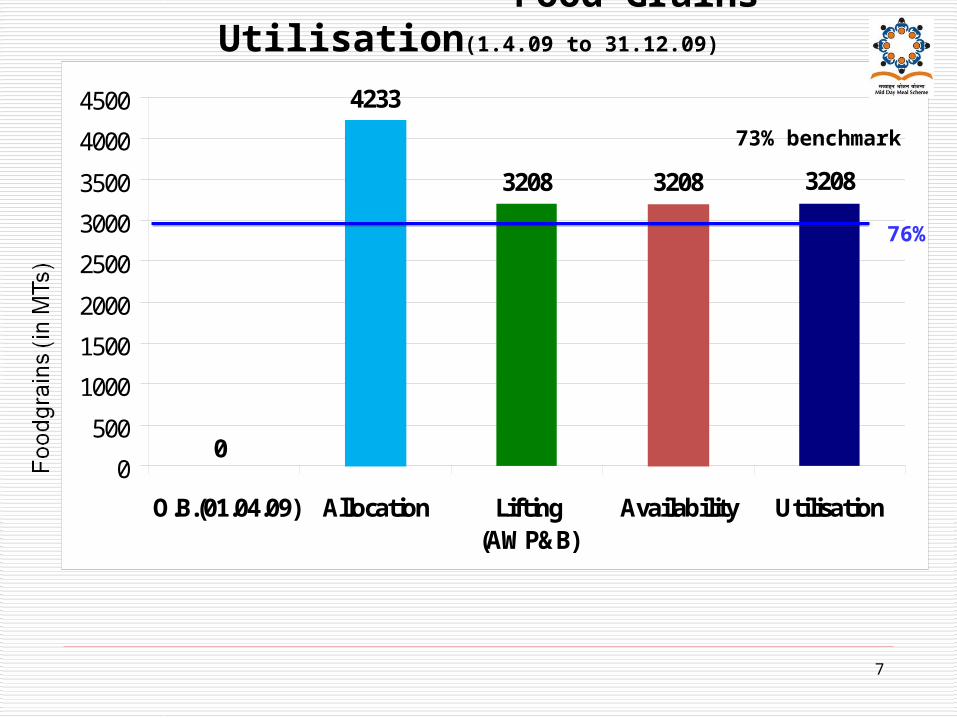
Food Grains Utilisation(1.4.09 to 31.12.09)
3208 3208 3208
0
4233
0
500
1000
1500
2000
2500
3000
3500
4000
4500
O.B.(01.04.09) Allocation Lifting(AWP&B)
Availability Utilisation
73% benchmark
76%

88
Food grains lifting Month-wise(Q1+Q2+Q3)[FCI BIILS]
613613613613613613 613613613
317528222470
21171764
1411
1058
353706
0
500
1000
1500
2000
2500
3000
3500
Apr* May Jun Jul Aug Sep Oct Nov Dec
Cum Actual l ifting Cum Ideal l ifting
Ministry of HRD, Govt. of India
•Including Unspent balance•# FCI had submitted bills only for 1st quarter i.e. 613 MTs
#

9
Ministry of HRD, Govt. of India
791 791
604
0
819
0
100
200
300
400
500
600
700
800
900
O.B.(01.04.09) Allocation Released Availability Utilisation
Cook
ing
Cost
(In
lakh
s) Cooking Cost Utilisation (1.4.09 to 31.12.09)
73% benchmark
74%

10
Mismatch of no of meals served, Cooking Cost utilised & Foodgrains utilised (Q1+Q2+Q3)
74%
72%
76%
70%
80%
1Meals Cooking Cost Foodgrain
Ministry of HRD, Govt. of India
Benchmark : 73%

11
Ministry of HRD, Govt. of India
18.63 18.6317.27
0.00
18.63
0
2
4
6
8
10
12
14
16
18
20
O.B.(01.04.09) Allocation Released Availability Utilisation
MM
E (
In l
akh
s) MME Utilisation (1.4.09 to 31.12.09)
100%
93%
73% benchmark

12
Ministry of HRD, Govt. of India
51.61 52.61 51.61
1.00
52.91
0
10
20
30
40
50
60
O.B.(01.04.09) Allocation Received Availability Utilisation
TA (I
n la
khs)
Transport Assistance Utilisation (1.4.09 to 31.12.09)
100%
98%
73% benchmark
1313
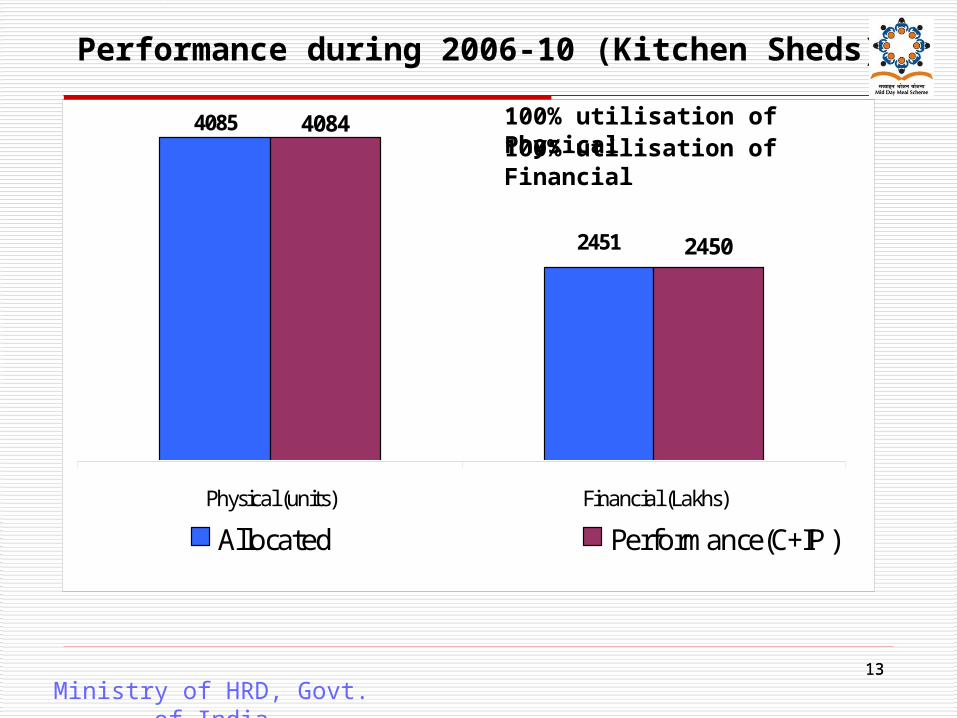
Performance during 2006-10 (Kitchen Sheds)
4084
24502451
4085
Physical (units) Financial (Lakhs)
Allocated Performance(C+IP )
Ministry of HRD, Govt. of India
100% utilisation of Physical 100% utilisation of Financial
1414
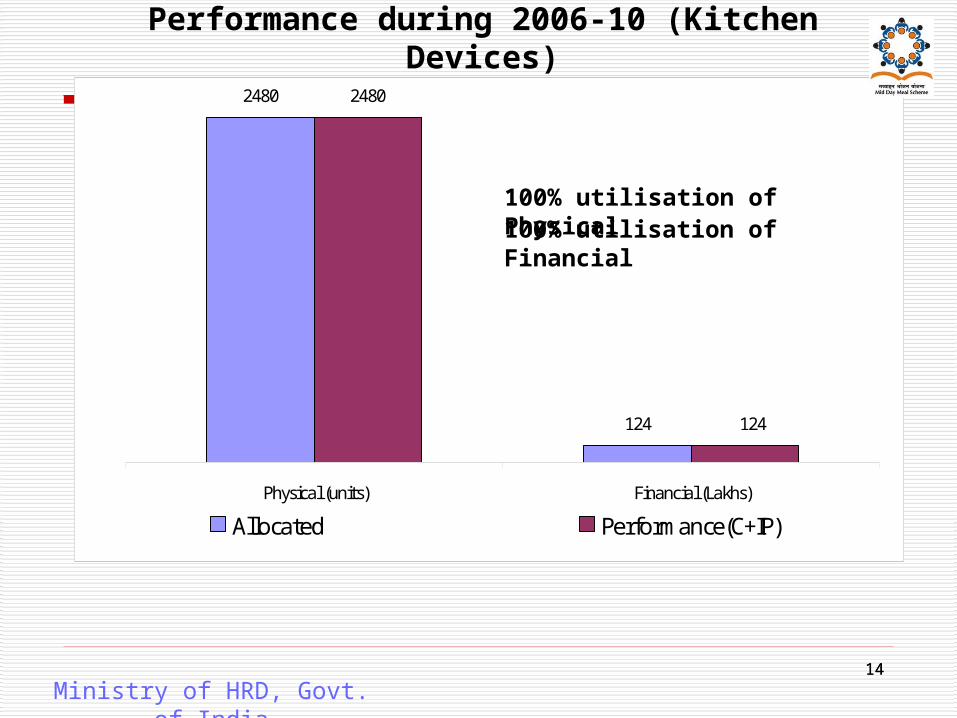
Performance during 2006-10 (Kitchen Devices)
124
2480
124
2480
Physical (units) Financial (Lakhs)
Allocated Performance(C+IP)
Ministry of HRD, Govt. of India
100% utilisation of Physical 100% utilisation of Financial

15
Performance Score card 2009-2010
Sl Component Performance
Benchmark
1. No of Schools covered under MDM
100% 100%
2. No of Children (PY+ UP.PY) 96% 100%
3. No of Working Days 75% 73%
5. Foodgrains Utilisation 76% 73%
6. Cooking Cost Utilisation 76% 73%
7. Meals Served 72% 73%
8. MME Utilisation 93% 75%
9. Transport Assistance 98% 75%
10. Kitchen Shed construction 100% 100%
11. Kitchen Devices procurement
100% 100%
12. QPRs 3 nos. 3 nos.
1616
Analysis of State’s Proposal for 2010-11
Ministry of HRD, Govt. of India

1717
Time Series
No of Children (PRIMARY)
220591
120699 120699120699 118223
0
50000
100000
150000
200000
250000
DISE MDM-PAB Approval AVAILED MDM
2008-09 2009-10
Ministry of HRD, Govt. of India
DIS
E 0
9-1
0 (
NA
)

1818
No of Children (PRIMARY)
220591
120699
187359
118223 118223
0
Ministry of HRD, Govt. of India
DIS
E 0
8-0
9
PA
B A
pp
rova
l
09-1
0
PR
OP
OS
AL
2010
-11
AV
AIL
ED
M
DM
DIS
E 0
9-10
N
A
OP
TE
D M
DM

1919
74844
60650 60650
0
6065056706
0
10000
20000
30000
40000
50000
60000
70000
80000
DISE MDM-PAB Approval AVAILED MDM
2008-09 2009-10
Ministry of HRD, Govt. of India
Time Series
No of Children (UPPER PRIMARY)
DIS
E 0
9-1
0 (N
A)

2020
No of Children (UPPER PRIMARY)
74844
6065057239 56706 56706
0
Ministry of HRD, Govt. of India
DIS
E (
08
-09
)
PA
B A
pp
rov
al 0
9-10
ST
AT
E P
RO
PO
SA
L
2010
-11
AV
AIL
ED
MD
M
OP
TE
D M
DM
DIS
E 0
9-1
0 (
NA
)

2121
No. of School days
No Source of Data No of Days
1 DISE 2008-09 187
2 MDM approval (09-10) 200
3 Benchmark(Q1+Q2+Q3) 146
4 Performance(Q1+Q2+Q3)
150
5 State Proposal: Primary
Upper Primary
244
244

2222
Proposal for Kitchen Devices
No Item No.
1 Total No. of Institutions 4431
2 Total Sanctioned (06-10) 2480
4 Gap 1951
5 State Proposal ( 2010-11) 1500
2323
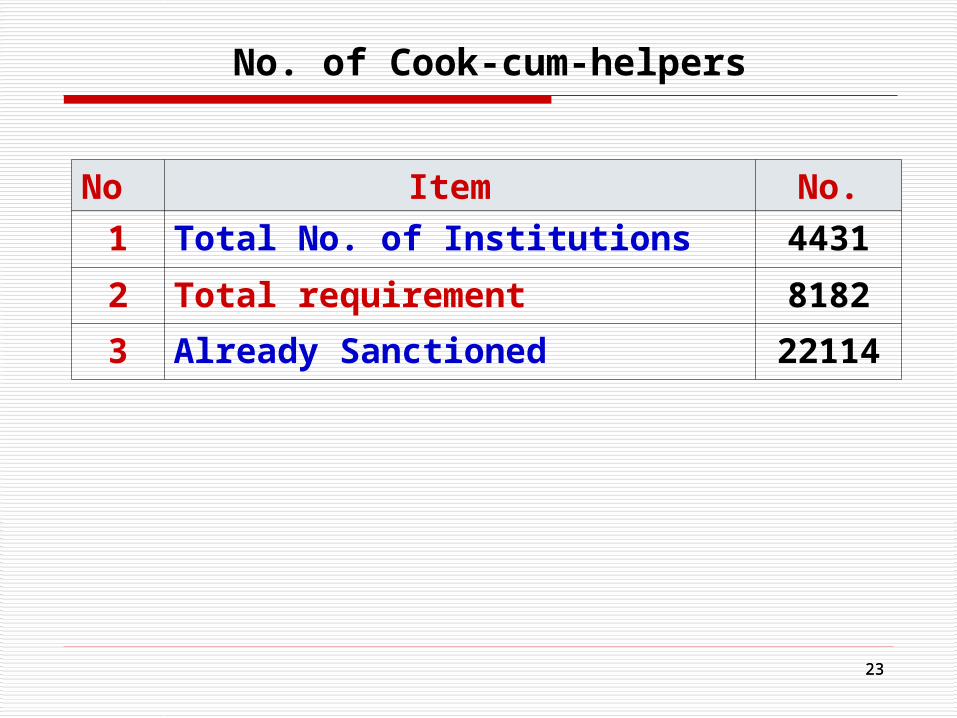
No. of Cook-cum-helpers
No Item No.
1 Total No. of Institutions 4431
2 Total requirement 8182
3 Already Sanctioned 22114

2424
Thank You
Ministry of HRD, Govt. of India