mid-rapidity charged hadron spectra in the au+au collisions at sqrt(s nn ) = 19.6 gev at star...
Post on 19-Dec-2015
215 views
TRANSCRIPT
Mid-rapidity charged hadron spectra in the Au+Au collisions at sqrt(sNN) = 19.6
GeV at STAR
University of California, Davis
for the STAR Collaboration
Daniel CebraRoppon Picha, Juan Romero
Trieu Mai, Mark Allen, Nathan Farr, David Cherney
2
Overview
• 19.6-GeV Introduction• Methods:
– Event selection - centrality determination - Track select.
– PID - Bethe-Bloch, dE/dx vs ,Gaussian fits– Efficiencies - Proton background - p-bar
absorbtion
• Results– mt-m0 spectra - dN/dy distributions– Particle ratios - rapidity and centrality dependence– Comparisons with SPS 17.2 GeV results
• Summary
3
STAR Time Projection Chamber
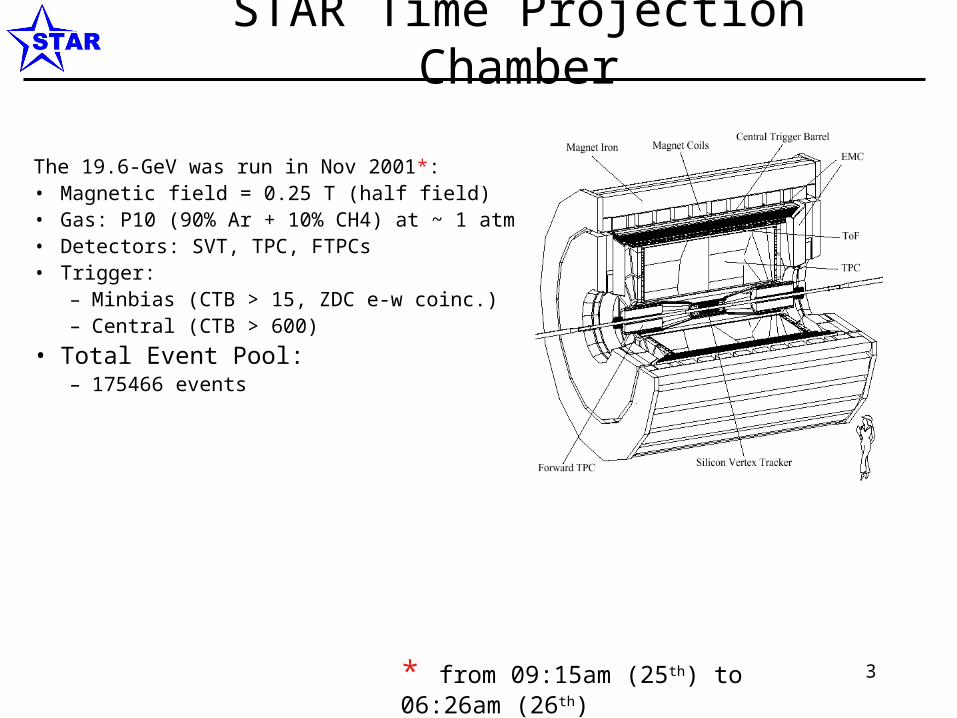
The 19.6-GeV was run in Nov 2001*:• Magnetic field = 0.25 T (half field)• Gas: P10 (90% Ar + 10% CH4) at ~ 1 atm• Detectors: SVT, TPC, FTPCs• Trigger:
– Minbias (CTB > 15, ZDC e-w coinc.)– Central (CTB > 600)
• Total Event Pool:– 175466 events
* from 09:15am (25th) to 06:26am (26th)
4
Event selection
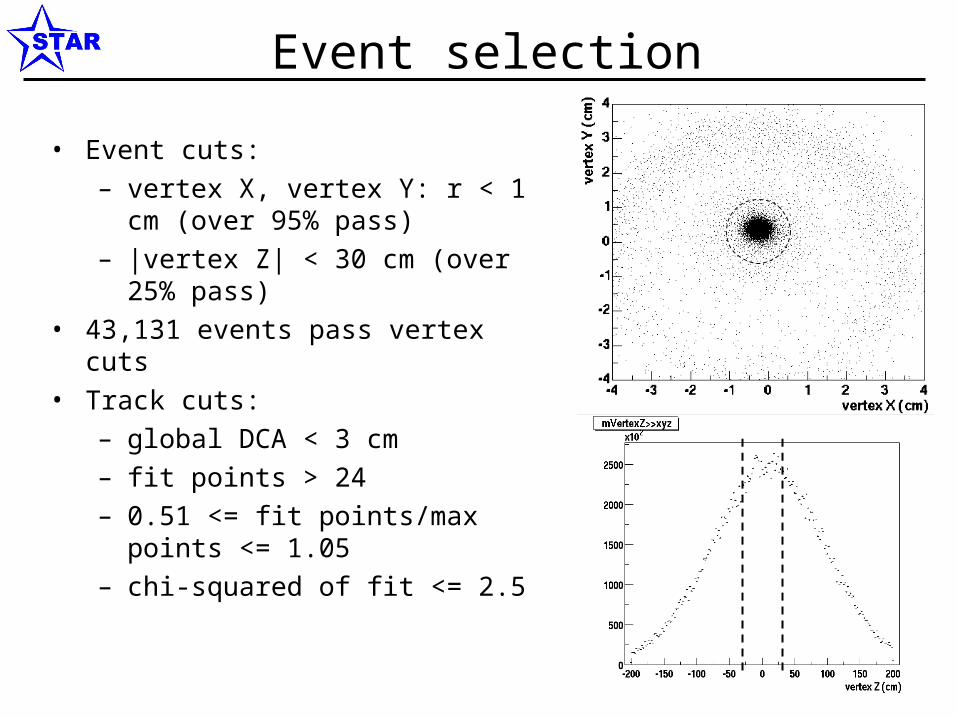
• Event cuts:– vertex X, vertex Y: r < 1 cm (over
95% pass)– |vertex Z| < 30 cm (over 25% pass)
• 43,131 events pass vertex cuts• Track cuts:
– global DCA < 3 cm– fit points > 24– 0.51 <= fit points/max points <=
1.05– chi-squared of fit <= 2.5
5
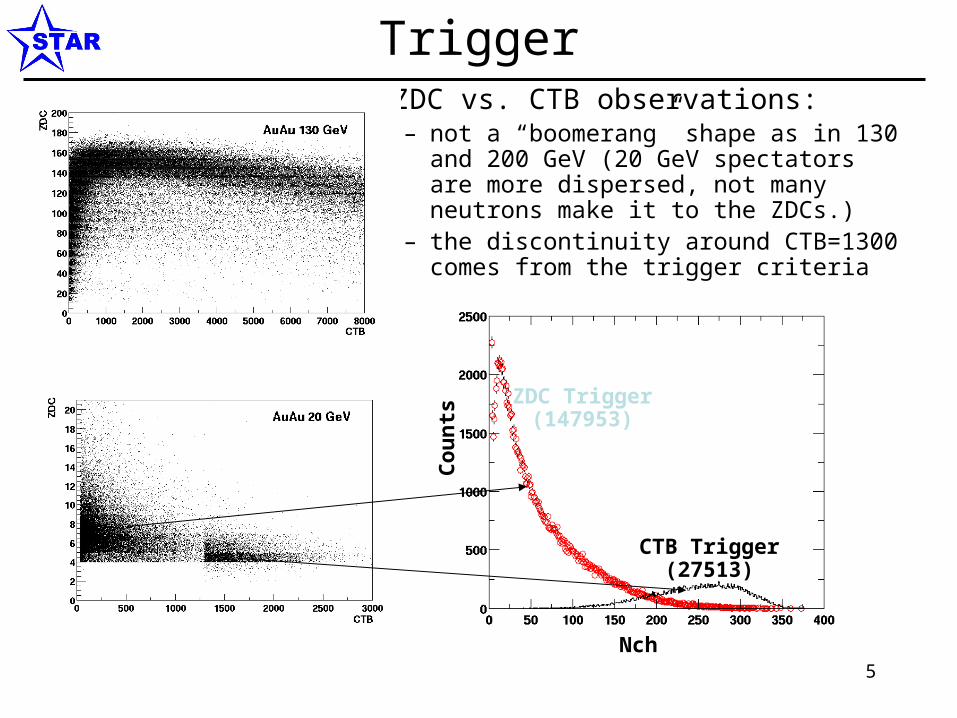
Trigger• ZDC vs. CTB observations:
– not a “boomerang” shape as in 130 and 200 GeV (20 GeV spectators are more dispersed, not many neutrons make it to the ZDCs.)
– the discontinuity around CTB=1300 comes from the trigger criteria
ZDC Trigger(147953)
CTB Trigger(27513)
Nch
Co
un
ts
6
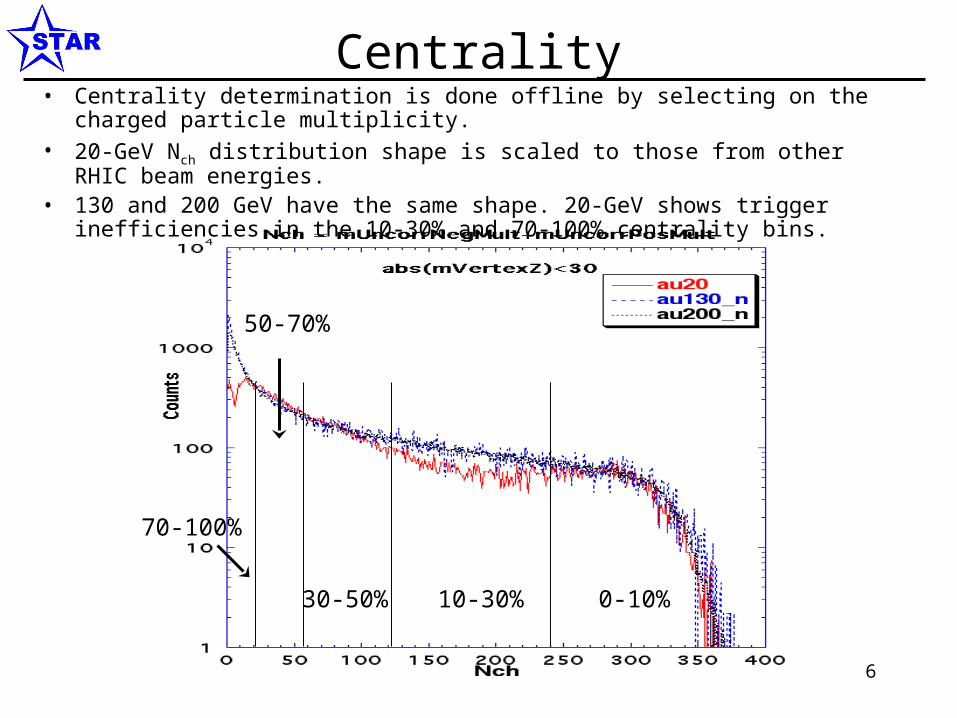
Centrality• Centrality determination is done offline by selecting on the charged particle
multiplicity.• 20-GeV Nch distribution shape is scaled to those from other RHIC beam energies.• 130 and 200 GeV have the same shape. 20-GeV shows trigger inefficiencies in
the 10-30% and 70-100% centrality bins.
0-10%10-30%30-50%
50-70%
70-100%
7
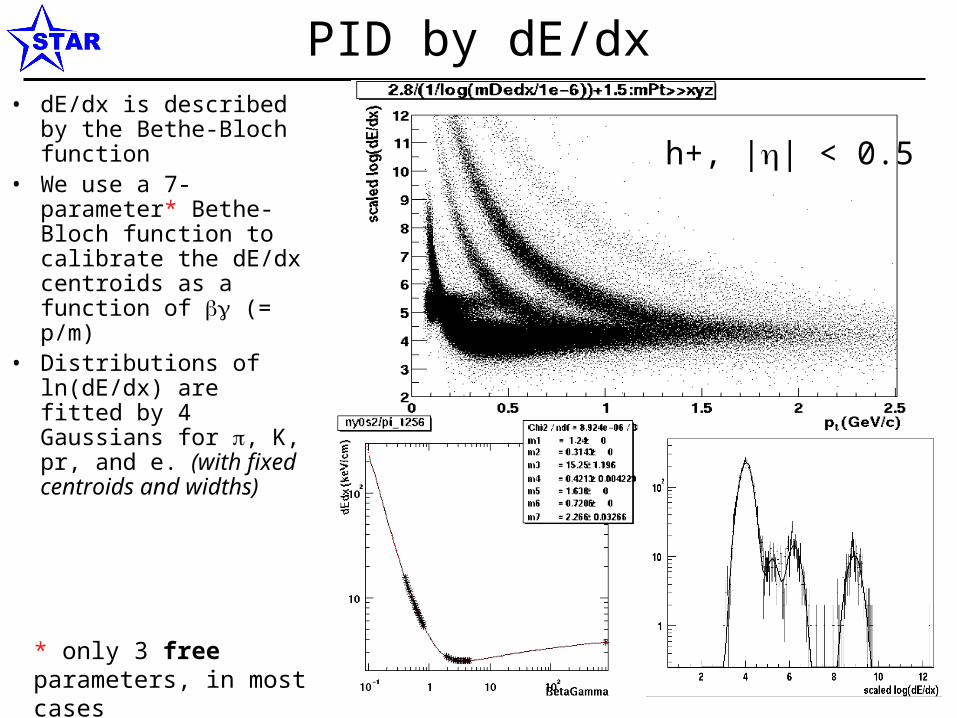
PID by dE/dx• dE/dx is described by
the Bethe-Bloch function
• We use a 7-parameter* Bethe-Bloch function to calibrate the dE/dx centroids as a function of (= p/m)
• Distributions of ln(dE/dx) are fitted by 4 Gaussians for , K, pr, and e. (with fixed centroids and widths)
h+, || < 0.5
* only 3 free parameters, in most cases
8
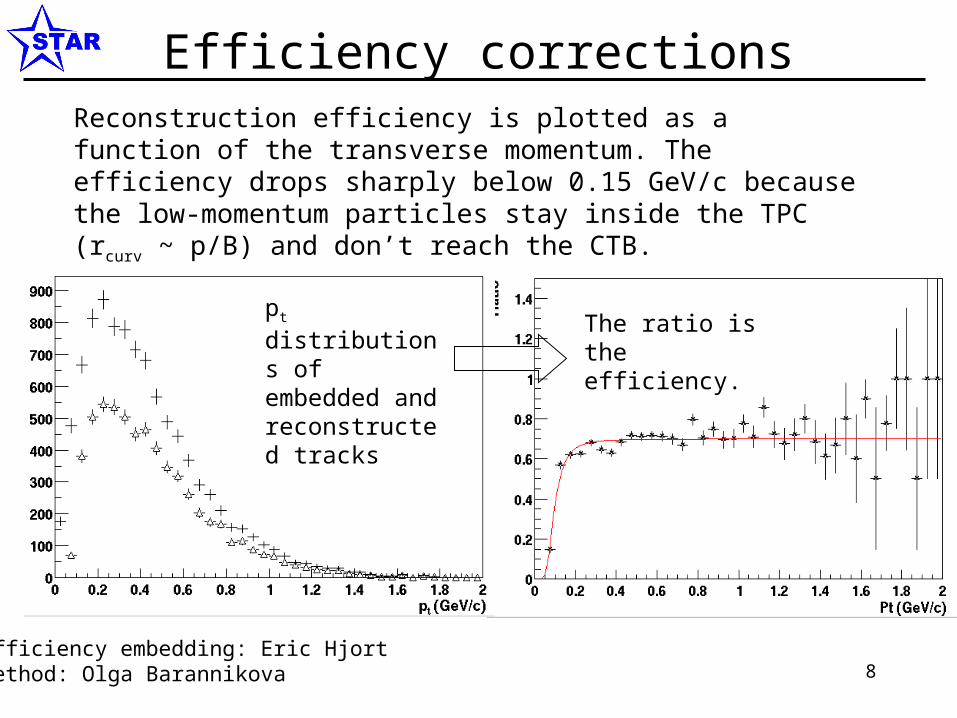
Efficiency corrections
Efficiency embedding: Eric HjortMethod: Olga Barannikova
Reconstruction efficiency is plotted as a function of the transverse momentum. The efficiency drops sharply below 0.15 GeV/c because the low-momentum particles stay inside the TPC (rcurv ~ p/B) and don’t reach the CTB.
pt distributions of embedded and reconstructed tracks
The ratio is the efficiency.
9
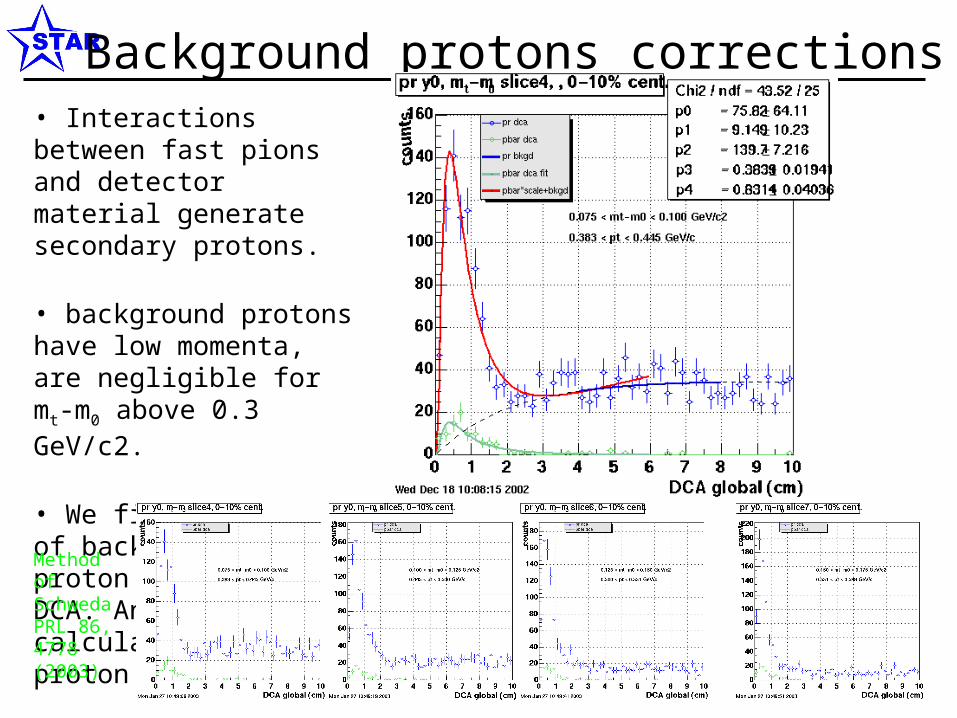
Background protons corrections• Interactions between fast pions and detector material generate secondary protons.
• background protons have low momenta, are negligible for mt-m0 above 0.3 GeV/c2.
• We find the ratio of background/total proton inside 0-3 cm DCA. And use this to calculate real proton yields.Method of SchwedaPRL 86, 4778 (2003)
10
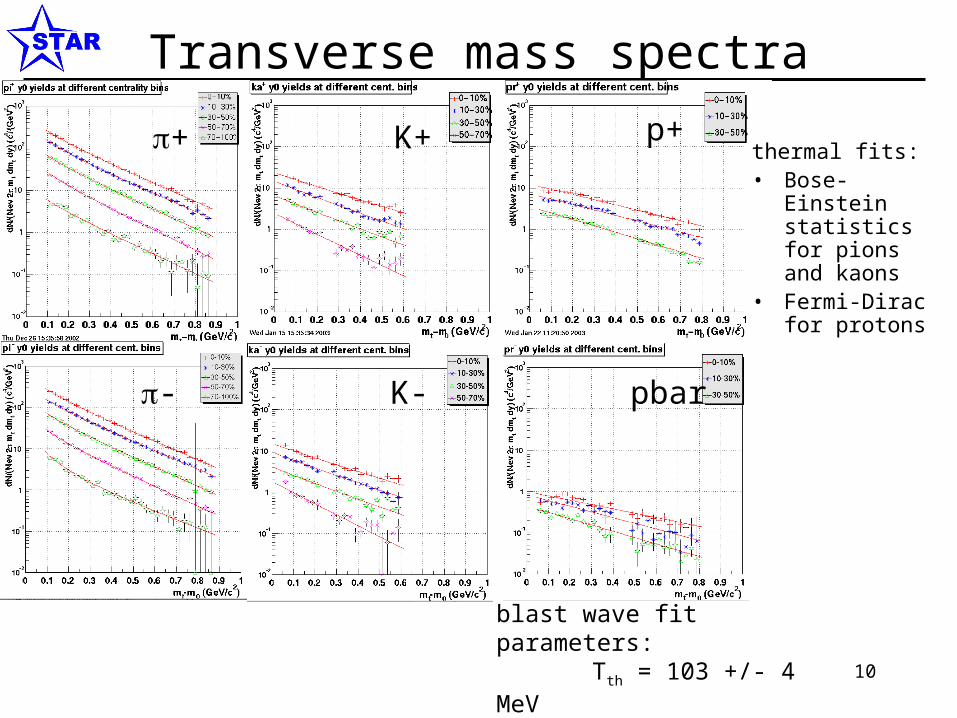
Transverse mass spectra
+ K+ p+
pbarK--
thermal fits:• Bose-Einstein
statistics for pions and kaons
• Fermi-Dirac for protons
blast wave fit parameters:Tth = 103 +/- 4 MeV
r = 0.47 +/- 0.04 c(M. Kaneta, Jul 14, 2002)
11
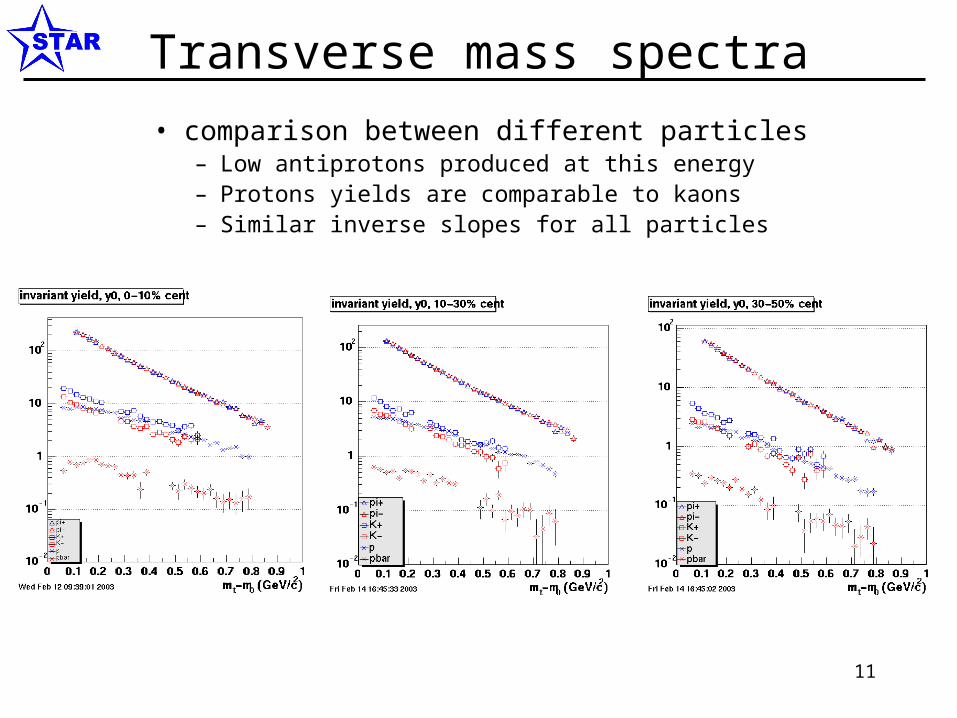
Transverse mass spectra
• comparison between different particles– Low antiprotons produced at this energy– Protons yields are comparable to kaons– Similar inverse slopes for all particles
12
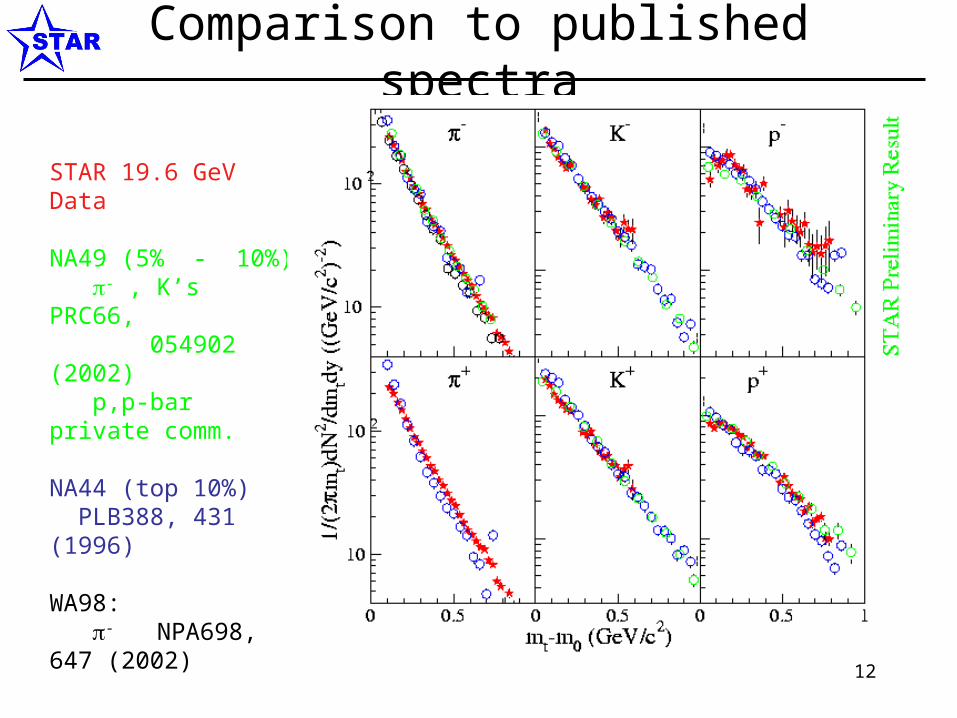
Comparison to published spectra
STAR 19.6 GeV Data
NA49 (5% - 10%) - , K’s PRC66, 054902 (2002) p,p-bar private comm.
NA44 (top 10%) PLB388, 431 (1996)
WA98: - NPA698, 647 (2002)
13
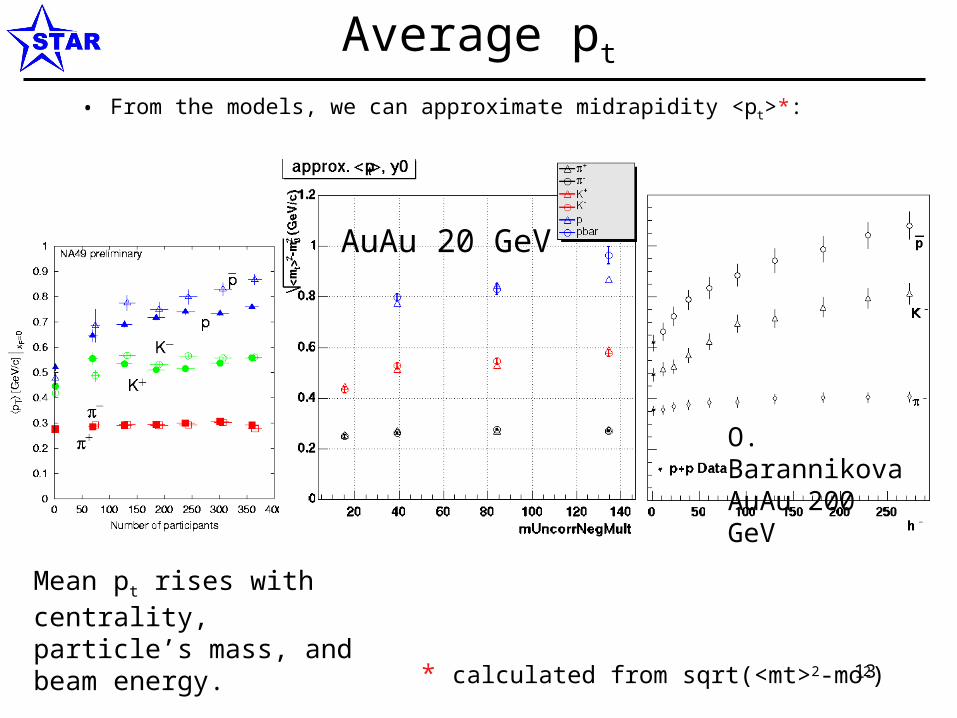
Average pt
• From the models, we can approximate midrapidity <pt>*:
O. BarannikovaAuAu 200 GeV
Mean pt rises with centrality, particle’s mass, and beam energy.
* calculated from sqrt(<mt>2-mo2)
AuAu 20 GeV
14
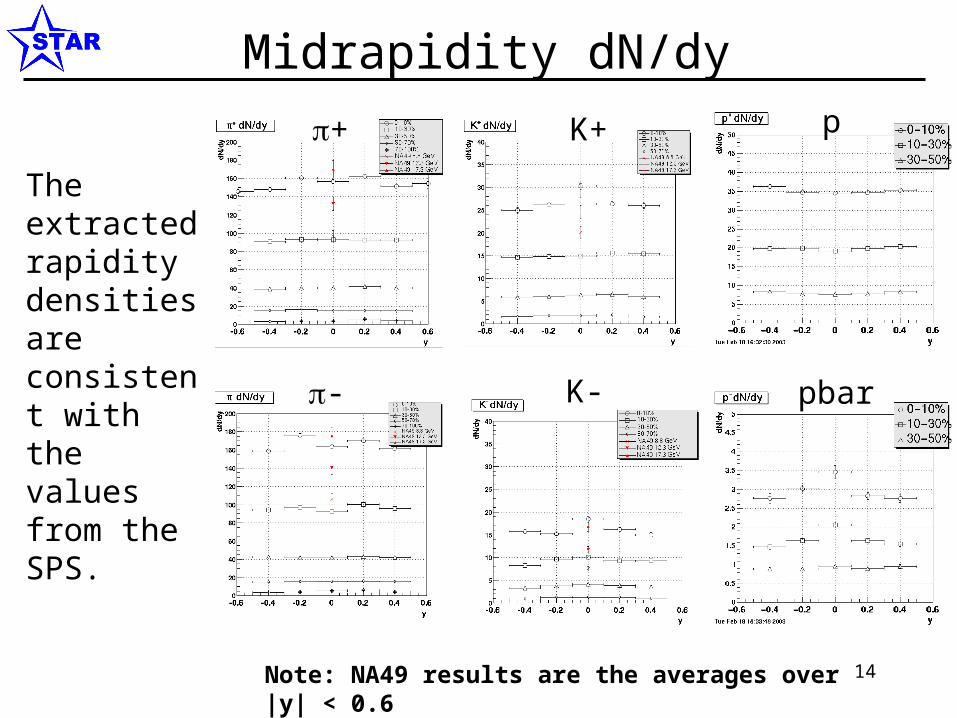
Midrapidity dN/dy
Note: NA49 results are the averages over |y| < 0.6
The extracted rapidity densities are consistent with the values from the SPS.
+
- K-
K+ p
pbar
15
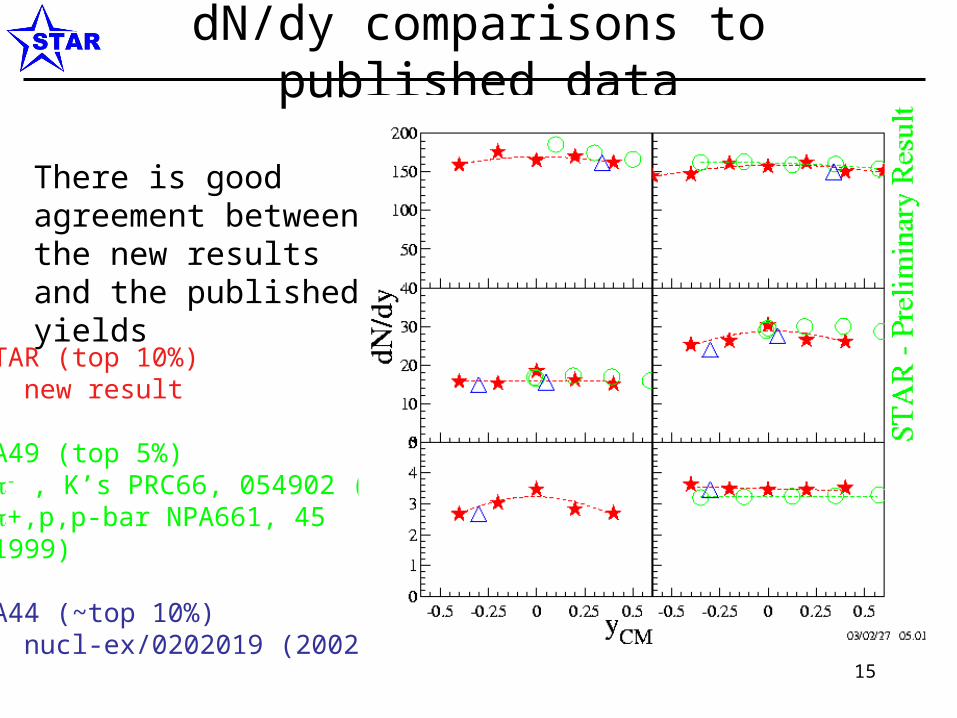
dN/dy comparisons to published data
STAR (top 10%) new result
NA49 (top 5%) - , K’s PRC66, 054902 (2002) +,p,p-bar NPA661, 45 (1999)
NA44 (~top 10%) nucl-ex/0202019 (2002)
There is good agreement between the new results and the published yields
16
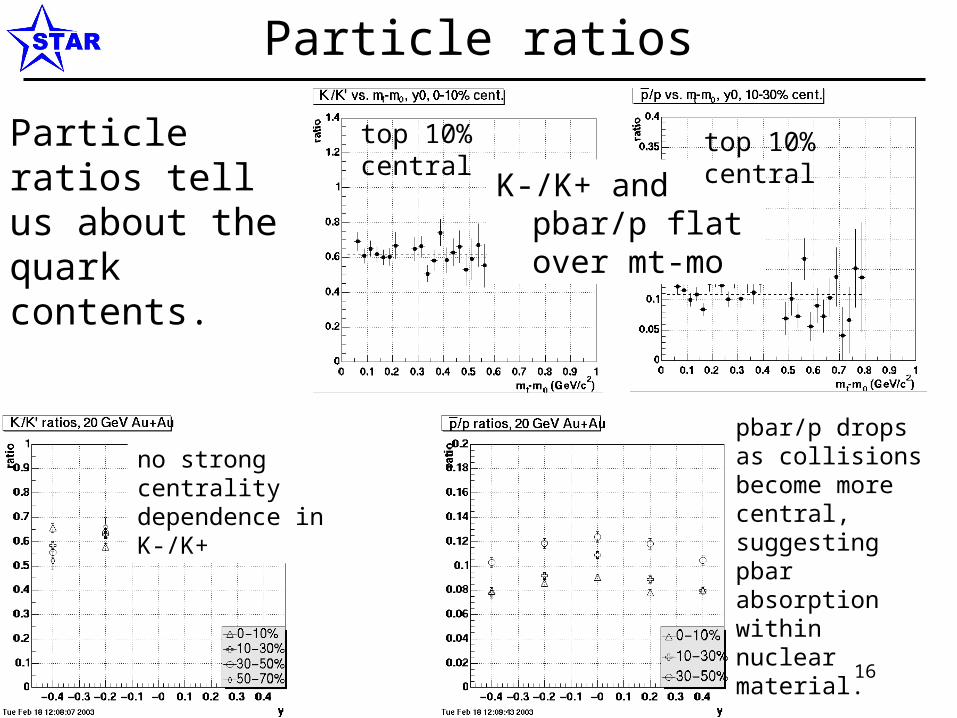
Particle ratios
K-/K+ and pbar/p flat over mt-mo
Particle ratios tell us about the quark contents.
no strong centrality dependence in K-/K+
top 10% centraltop 10% central
pbar/p drops as collisions become more central, suggesting pbar absorption within nuclear material.
17
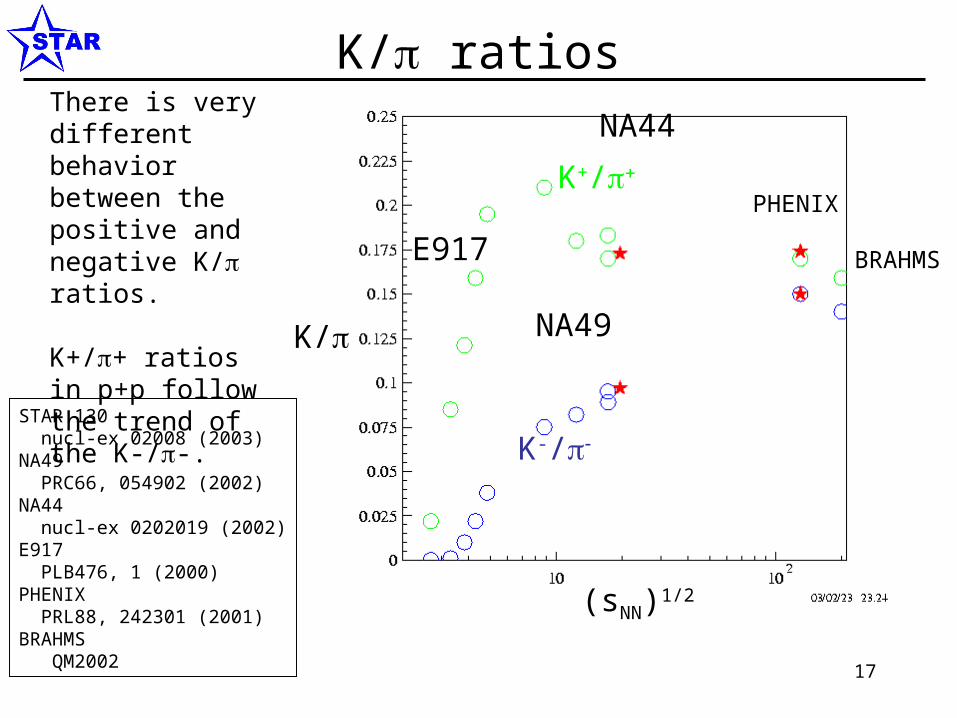
K/ ratios
K/
(sNN)1/2
K+/
K-/
E917
NA49
NA44
BRAHMS
There is very different behavior between the positive and negative K/ ratios.
K+/+ ratios in p+p follow the trend of the K-/-.
PHENIX
STAR 130 nucl-ex 02008 (2003)NA49 PRC66, 054902 (2002)NA44 nucl-ex 0202019 (2002)E917 PLB476, 1 (2000)PHENIX PRL88, 242301 (2001)BRAHMS QM2002
18
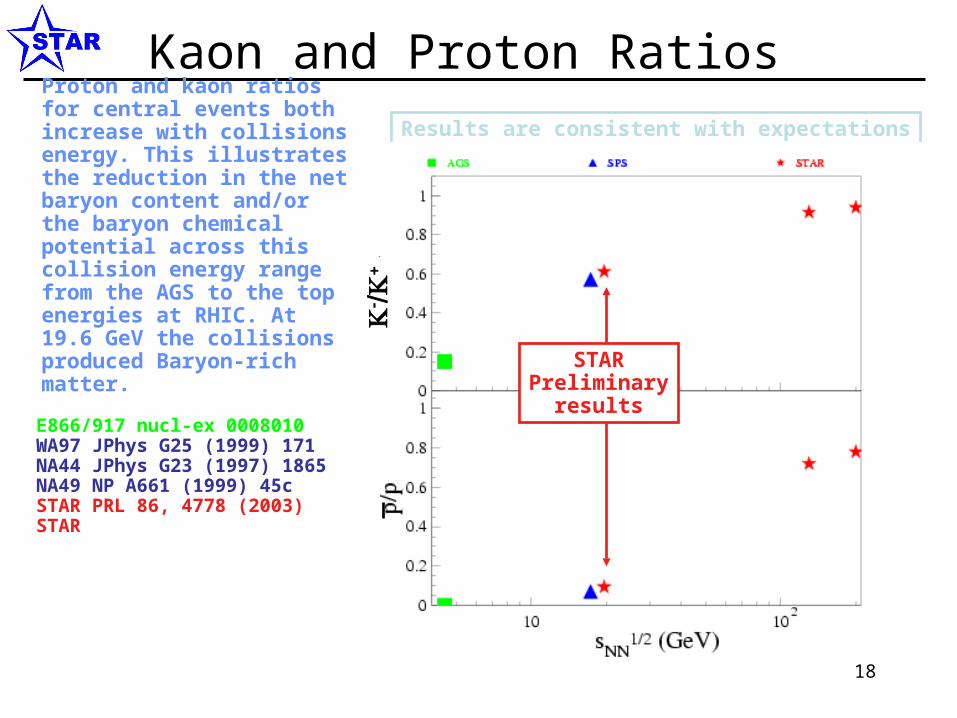
Kaon and Proton Ratios
Results are consistent with expectations
STARPreliminary
results
Proton and kaon ratios for central events both increase with collisions energy. This illustrates the reduction in the net baryon content and/or the baryon chemical potential across this collision energy range from the AGS to the top energies at RHIC. At 19.6 GeV the collisions produced Baryon-rich matter.
E866/917 nucl-ex 0008010WA97 JPhys G25 (1999) 171NA44 JPhys G23 (1997) 1865NA49 NP A661 (1999) 45cSTAR PRL 86, 4778 (2003)STAR
19
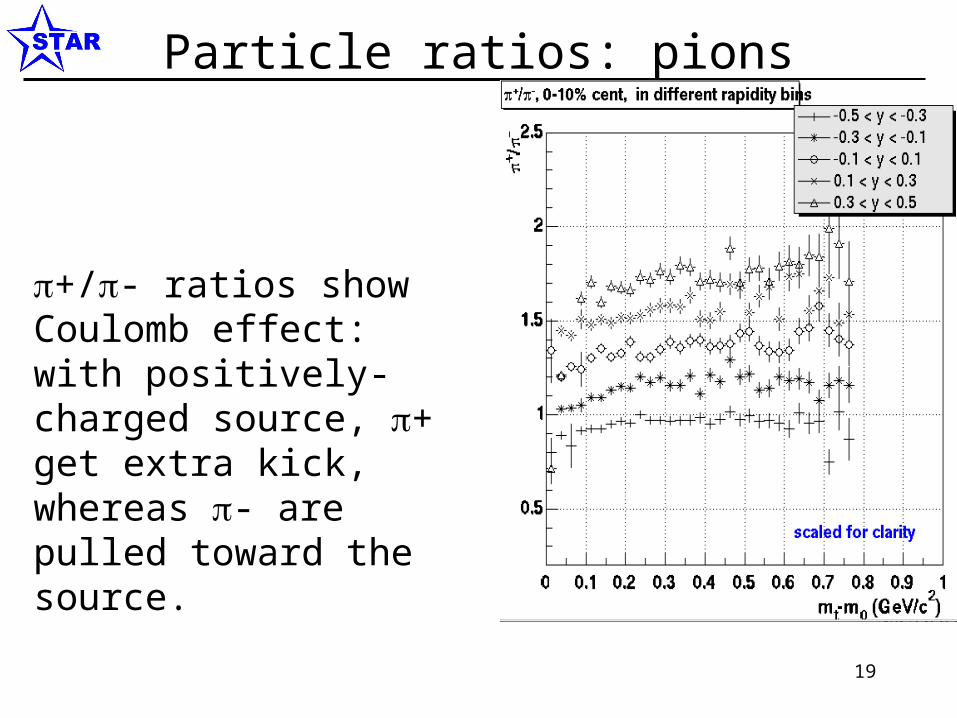
Particle ratios: pions
+/- ratios show Coulomb effect: with positively-charged source, + get extra kick, whereas - are pulled toward the source.
20
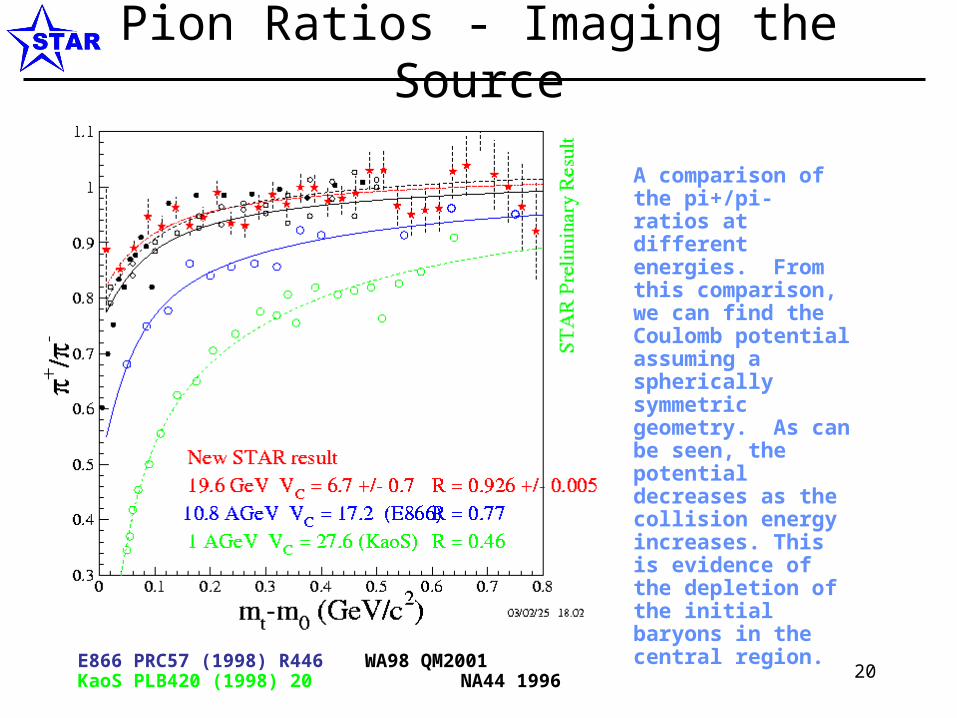
Pion Ratios - Imaging the Source
A comparison of the pi+/pi- ratios at different energies. From this comparison, we can find the Coulomb potential assuming a spherically symmetric geometry. As can be seen, the potential decreases as the collision energy increases. This is evidence of the depletion of the initial baryons in the central region.
E866 PRC57 (1998) R446 WA98 QM2001KaoS PLB420 (1998) 20 NA44 1996
21
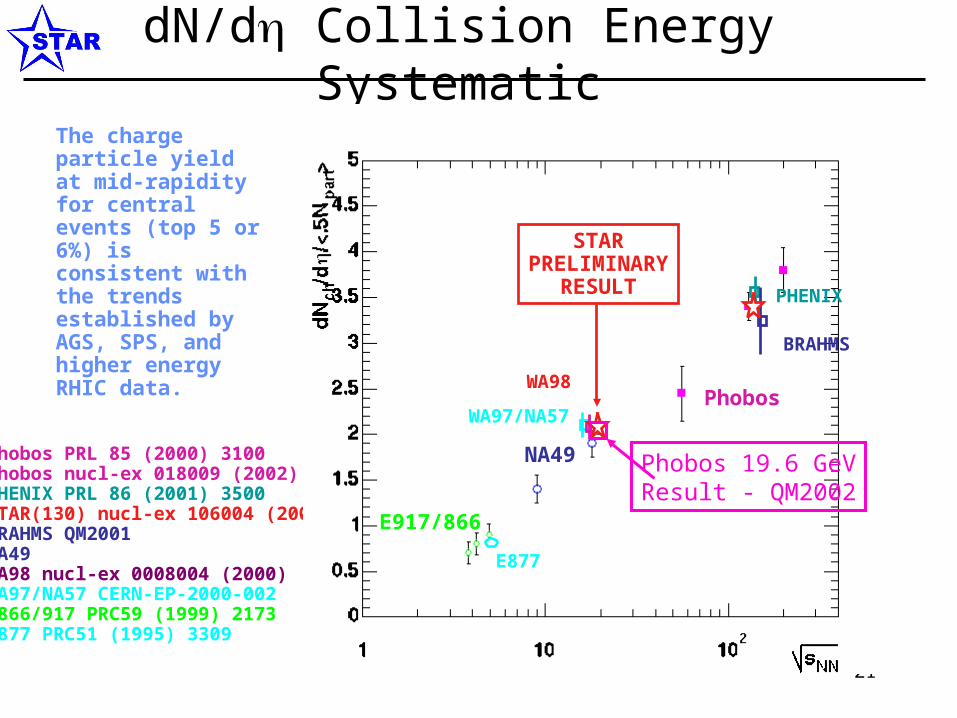
dN/d Collision Energy Systematic
The charge particle yield at mid-rapidity for central events (top 5 or 6%) is consistent with the trends established by AGS, SPS, and higher energy RHIC data.
Phobos PRL 85 (2000) 3100Phobos nucl-ex 018009 (2002)PHENIX PRL 86 (2001) 3500STAR(130) nucl-ex 106004 (2001)BRAHMS QM2001NA49WA98 nucl-ex 0008004 (2000)WA97/NA57 CERN-EP-2000-002E866/917 PRC59 (1999) 2173E877 PRC51 (1995) 3309
WA98
WA97/NA57Phobos
NA49
E917/866
STARPRELIMINARY
RESULT
E877
PHENIX
BRAHMS
Phobos 19.6 GeVResult - QM2002
22
Summary
• Thermal models fit spectra of pions and kaons well; protons show visible peaks near 0.1 GeV/c2 -- a blast wave effect.
• Flat rapidity distributions indicate incomplete stopping within |y| < 0.5.
• Au+Au at 19.6 AGeV - not baryon free.• K-/K+ ~ 0.6, no strong dependence on centrality or rapidity• pbar/p ratio ~ 0.1
– decreases in more forward rapidity bins– decreases with centrality
• Both kaon and pbar/p ratios increase with beam energy; our results consistent with the trend.
• Future: more comparisons to SPS results; higher rapidity results for pions
• Overall, the results confirm the consistency between RHIC and SPS apparatus.