mid year budget and performance assessment report … year assessment/mid-year... · submitted to...
TRANSCRIPT
STEVE TSHWETE
LOCAL MUN IC I PAL ITY
M ID Y EAR BUDGET AND
P ER FORMANCE A S S E S SMENT
REPORT
D E C EMB E R 2 0 1 1
46/01/2012 FINANCES: MID-YEAR BUDGET AND PERFORMANCE ASSESSMENT 2011/2012 FINANCIAL YEAR 5/1/4 (B)/adk Report by the Executive Manager Finance 1. In terms of section 72(1) of the Municipal Finance Management Act, Act 56 of
2003, the accounting officer must, by 25 January of each year, assess the performance of the municipality during the first half of the financial year.
2. Section 72(3) further stipulates that as part of the assessment,
recommendations must be made whether an adjustment budget is necessary, taking into consideration the revised projections for revenue and expenditure to the extent that this may be necessary.
3. The mid-year budget and performance assessment report must be
consistent with the monthly budget statements on the implementation of the annual budget in accordance with the Service Delivery Budget Implementation Plan (SDBIP) for the first half of the financial year and be submitted to the Executive Mayor, National Treasury and the relevant Provincial Treasury.
4. The format of the report is specified in the Municipal Budget and Reporting
Regulation under schedule C and includes all the required tables, charts and explanatory information.
5. It further prescribed that the mid-year budget and performance assessment
report be made public by placing it on the municipal website within five working days of 25 January of each year.
6. The mid-year budget and performance assessment, taking into account the
stipulations of the MFMA, section 72(1) and the Municipal Budget and Reporting Regulations as at 31 December 2011 are attached as ANNEXURE A. The mid-year forecast figures are reflected under the last column with the heading Full Year Forecast.
7. The overall operating results for the first six months ending 31 December
2011 indicates a surplus of R19,0-million compared to the SDBIP deficit of R42,6-million. The favourable deviation is the net result of higher revenue received to the amount of R9,1-million, less expenditure incurred of R46,5-million and more capital transfers and contributions received than planned of R6,0-million.
8. The mid-year full year forecast indicates an unfavourable deviation for
R14,5-million for revenue. Service charges for electricity service is the main contributor and is mainly due to the implementation of the new time of use tariffs.
From the budgeted operating expenditure of R917,7-million, 47% was spent and the proposed expenditure is R898,1-million which reflects a deviation of R2,1%.
At this stage it seems that expenditure can be curtailed for the envisage revenue loss.
9. The total capital expenditure for the first six months amounts to
R84,2-million (31 December 2010: R125,6-million) which is much lower compared to the previous financial year and constitutes 23,2% of the adjusted capital budget for 2011/2012.
10. The total outstanding external loans as at 31 December 2011 amounts to
R134,1-million (30 June 2011: R 145,6-million). R11,4-million was redeemed during the first six months of the financial year and it is planned to take up a new external facility of R90-million during the second half of the financial year to supplement the existing and future capital programmes.
11. Early indications are that the performance against the goals in the Service
Delivery and Budget implementation plans (SDBIP'S) are more or less on track with a favourable deviation of 2% in revenue, whilst operating expenditure indicates an under spending of 10%. The revenue forecast estimate variance for the year against the budget is 2,8% and for operating expenditure it is 2,1%. The actual performance for capital expenditure as at 31 December 2011, deviates with 44% from the SDBIP. Despite this early deviation it is estimated that appropriately 70,1% of the forecasted capital budget will be spent by 30 June 2012 with the likelihood that about R104,7-million will be rolled over to the next financial year, unless the process of evaluating and awarding of tenders is expedited in order to increase capital expenditure.
12. The financial performance indicators for the first six months are well within
targets. The average debtor's collection rate for the year is 100,92% (KPI: 98%). The collection period amounted to a very healthy 20 days with a debtor's turnover rate of 5,1% (KPI: 9%).
Total debtor's outstanding as at 31 December 2011 amounts to R56,8-million (June 2011: R62,5-million). The main decrease is reflected in current debtors to the amount of R7,6-million whilst debt older than 150 days slightly increase with R6,9-million.
13. The inclining investment in infrastructure together with the planned related
expenditure resulted in a decline in the available cash as a large portion of internal funds were used to finance capital expenditure. The net available cash at the end of December 2011 amounts to R390,7-million and the forecasted cash flow of the municipality amounts to R135,4-million (30 June 2011: R243,9-million).
14 The Auditor-General issued an unqualified audit report (clean audit) for the
annual financial statements ended 30 June 2010 and no matters were reported.
15. In light of the financial assessment and forecasting of figures on the annual
budget based on the first six months of the financial year it is recommended

that an adjustment budget for the 2011/2012 financial year is required and it be submitted to the Council during February 2012.
16. It is further suggested that revenue and expenditure for the financial year be
revised in an adjustment budget for the various votes to reflect the additional revenues and to utilize the projected savings on expenditure among the different votes to allow for expected over expenditure.
17. Recommendation: 17.1 That the mid-year budget and performance assessment as tabled be
noted. 17.2 That the 2011/2012 annual budget be adjusted during February 2012. 17.3 That the mid-year budget and performance assessment report be
submitted to the Executive Mayor, the National and Provincial Treasury by 25 January 2012.
17.4 That the mid-year budget and performance assessment report be placed on the municipal website within five working days after it was tabled to the Executive Mayor.
Comments by the Municipal Manager In general terms the report indicates that our finances are well managed within the limits of our operating budget. In spite of the negative influence of the implementation of “time of use” electrical tariffs it seems as though we will be able to balance our budget at the end of the financial year. The continuous 100% payment rate remains an outstanding achievement under adverse economic conditions. The slow pace of capital spending is a source of severe frustration and concern for me as accounting officer. In spite of continuous begging, pleading and even threatening it appears as though the issue of the implementation of capital projects and the acquisition of capital goods is just not taken serious by Executive Managers and Departmental Heads. Monitoring of capital projects was specifically included in the reporting document that is submitted to MMCs and from MMCs to Section 79 Committees, in order to ensure that such projects are given priority attention. However, it seems as though this measure is also not bearing fruit of any substance. Consequently it is proposed that each Executive Manager be instructed to submit a report in which full particulars regarding the progress with each and every capital project is provided and in which implementation delays are explained.
Recommendation by the Municipal Manager
1. THAT the mid-year budget and performance assessment for
2011/2012 financial year as submitted by the Executive Manager: Finance, be noted.
2. THAT the 2011/2012 annual budget be adjusted during February
2012. 3. THAT permission be granted to the Executive Manager: Finance to
submit the mid-year budget and performance assessment report to the Executive Mayor, the National and Provincial Treasury by 25 January 2012.
4. THAT permission be granted to the Executive Manager: Finance to display the mid-year budget and performance assessment report on the municipal website within five working days after it was tabled to the Executive Mayor.
5. THAT each Executive Manager be instructed to submit a report in
which full particulars regarding the progress with each and every capital project is provided and in which implementation delays are explained.

C46/01/2012 FINANCES: MID-YEAR BUDGET AND PERFORMANCE ASSESSMENT 2011/2012 FINANCIAL YEAR 5/1/4 (B)/adk RECOMMENDATION BY THE EXECUTIVE MAYOR
1. THAT the mid-year budget and performance assessment for 2011/2012 financial year as submitted by the Executive Manager: Finance, be noted.
2. THAT the 2011/2012 annual budget be adjusted during February 2012. 3. THAT permission be granted to the Executive Manager: Finance to submit
the mid-year budget and performance assessment report to the Executive Mayor, the National and Provincial Treasury by 25 January 2012.
4. THAT permission be granted to the Executive Manager: Finance to display the mid-year budget and performance assessment report on the municipal website within five working days after it was tabled to the Executive Mayor.
5. THAT each Executive Manager be instructed to submit a report in which
full particulars regarding the progress with each and every capital project is provided and in which implementation delays are explained.
PART 1
MID YEAR BUDGET AND PERFORMANCE ASSESSMENT REPORT
1. Executive Summary
Table C1: Monthly Budget Statement Summary – Mid Year Assessment For the first six months ending December, revenue to the amount of R428,0-million realized. The year to date budgeted revenue amounts to R419,0-million which reflects a favorable deviation of 2%. 50,3% of the budgeted revenue realized at the end of December 2011 whilst the projected forecasted revenue amounts to R837,2-million which is R14,6-million less than original budgeted. Operating expenditure to the amount of R431,7-million was spend against the year to date budgeted expenditure of R478,2-million. This reflects a deviation of 10%. The forecasted operating expenditure amounts to R898,2-million which is a deviation of 2,1% of the original budget. Capital expenditure for the first six months amounts to R84,2-million which is a deviation of 44% against the SDBIP figure of R149,6-million. The projected capital expenditure for 30 June 2012 amounts to R359,2-million with a likely hood that about R104,7-milion will probably be rolled over to the next financial year. Taking the above into consideration the net operating surplus forecast for the year amounts to R13,3-million whilst it is projected that the cash and cash equivalents might decreased to R41,3-million.
2. In-Year Budget Statements Tables – Mid Year Assessment
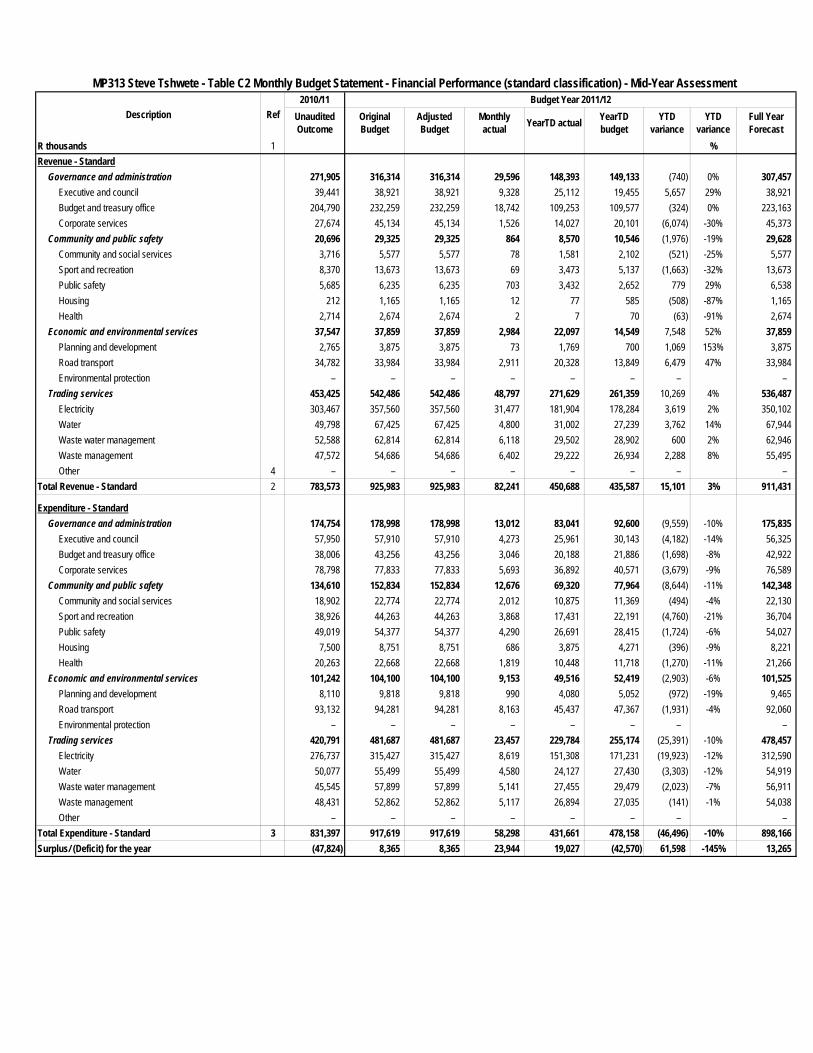
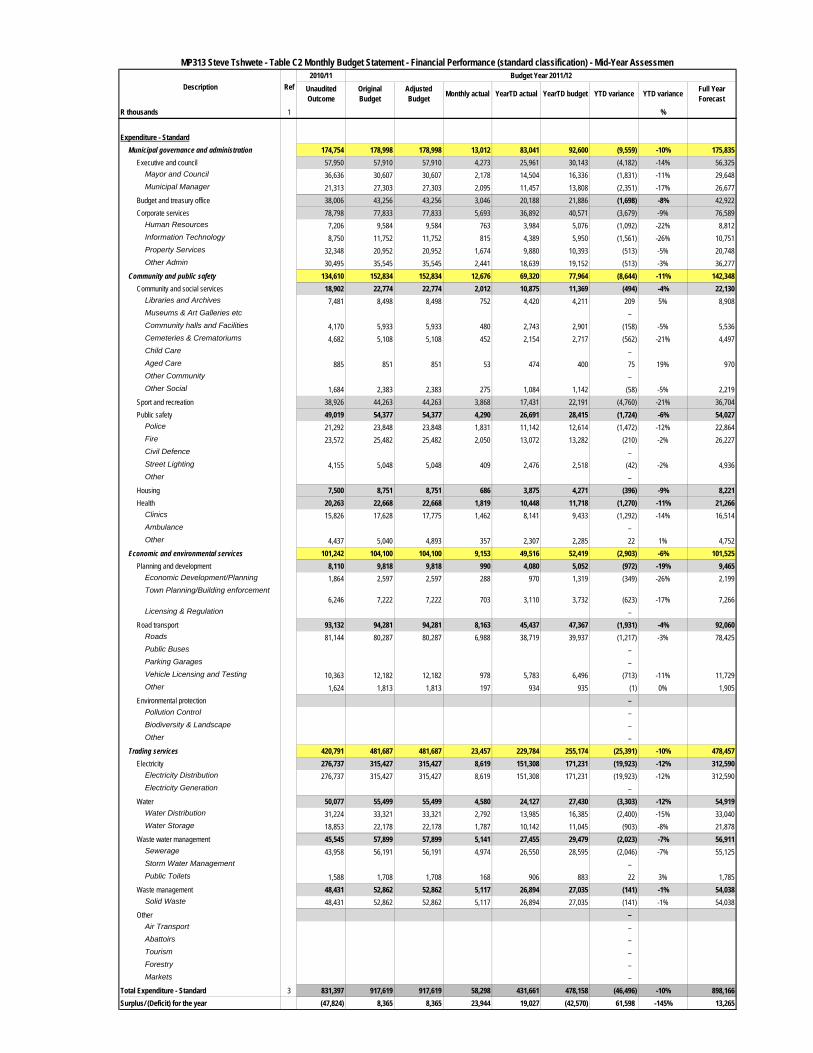
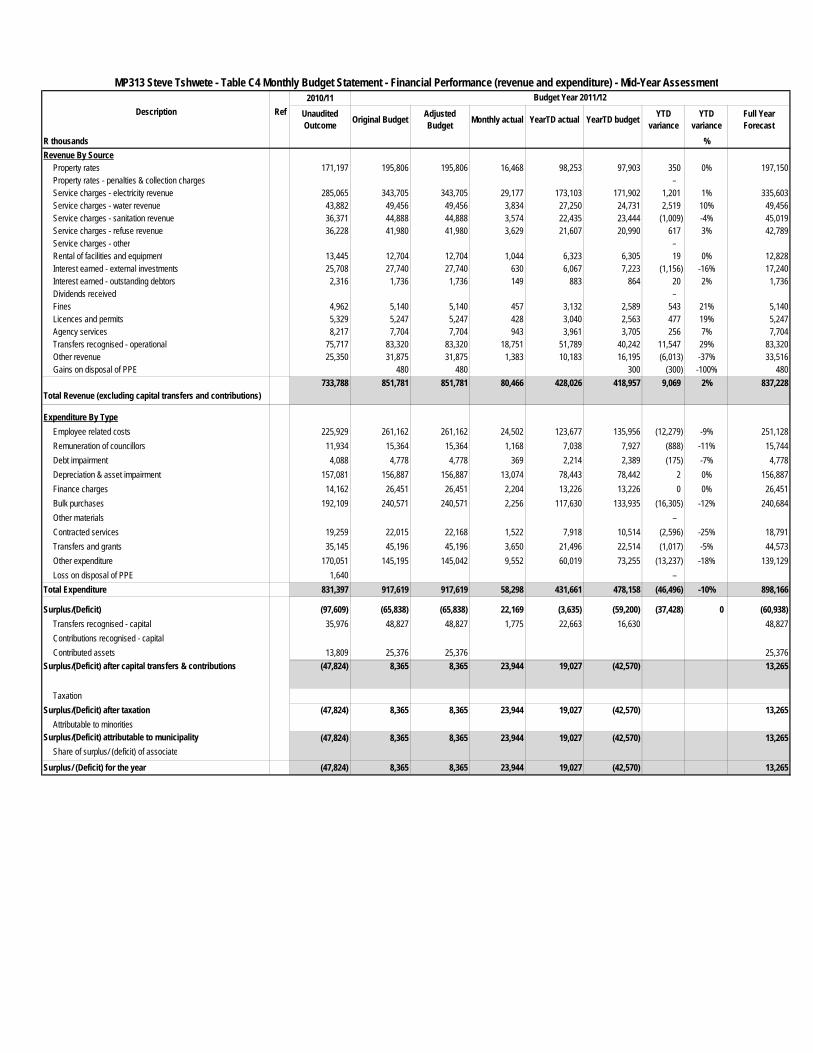
Table C2: Monthly Financial Performance by Vote Table C2 measures the actual performance against the year to date SDBIP figures which realized by vote for revenue and expenditure. The 30 June 2012 forecasted figures by vote are reflected in the last column, full year forecast. The difference in revenue variations between Table C2 and Table C1 is the result of capital grants received, which are included Table C2. Table C4: Monthly Financial Performance by Revenue Source and Expenditure Type. This table provides the actual performance details for revenue by source and expenditure by type. For the purpose of reporting, Table C4
will be used to provide explanations on deviations. Reasons for the full year forecasted deviations will only be provided in cases where the percentages differ with more than 5% of the original budgeted figures and can be viewed in Supporting Table SC1. The actual performance details for revenue by source and expenditure by type with the full year forecasted figures is graphically presented in: Chart 1 – Revenue by major source; Chart 2 - Revenue by minor source; Chart 3 – Expenditure by major type; Chart 4 – Expenditure by minor type;
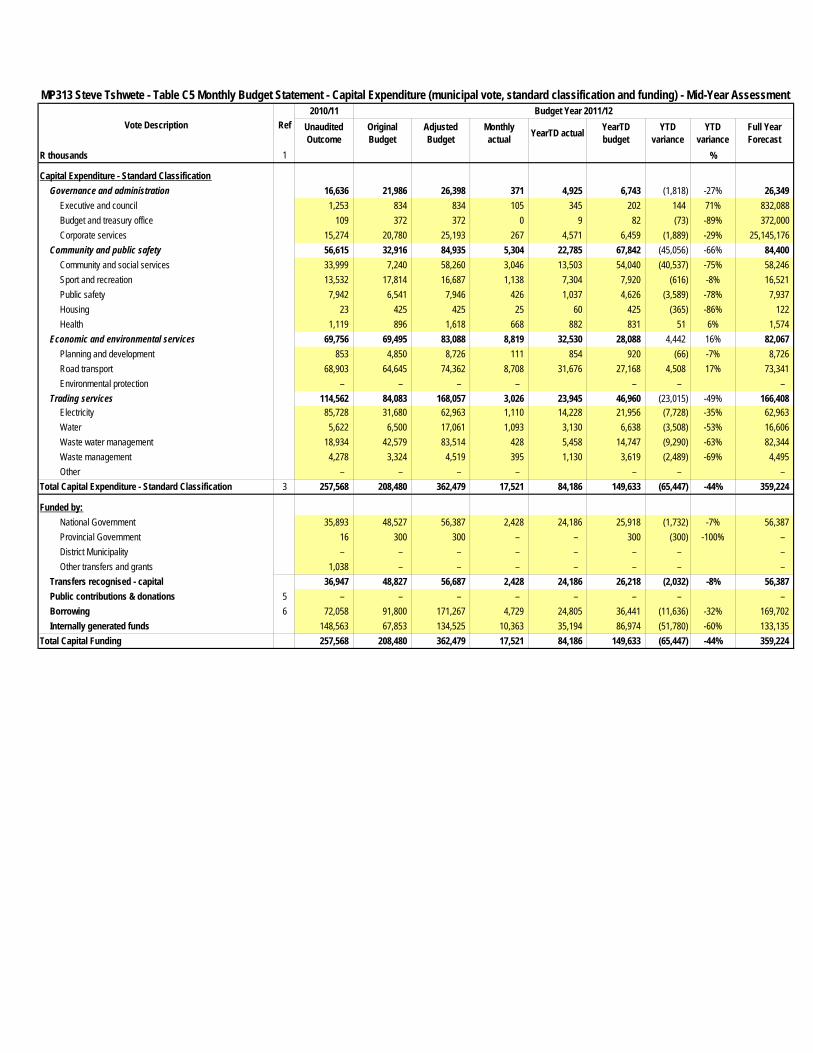
Table C5: Monthly Capital Expenditure by Vote
Table C5 indicates the actual performance details on capital expenditure for all votes, whilst the 30 June 2012 forecasted figures are reflected in the last column, full year forecast.
Capital expenditure for the first six months amounts to R84,2-million which deviates with R65,4-million against the planned figure of R149,6-million and reflects deviation of 44%. The full year forecasted capital expenditure amounts to R359,2-million. Which is R3,2-million less than original planned.
The deviation with the SDBIP figures is spread over the whole vote
structure of the Municipality. Reasons for deviations can be viewed in Supporting Table SC1.
The actual performance detail for capital expenditure by vote is graphically presented in:
Chart 5 – Capex by major vote. Chart 6 – Capex by minor vote.
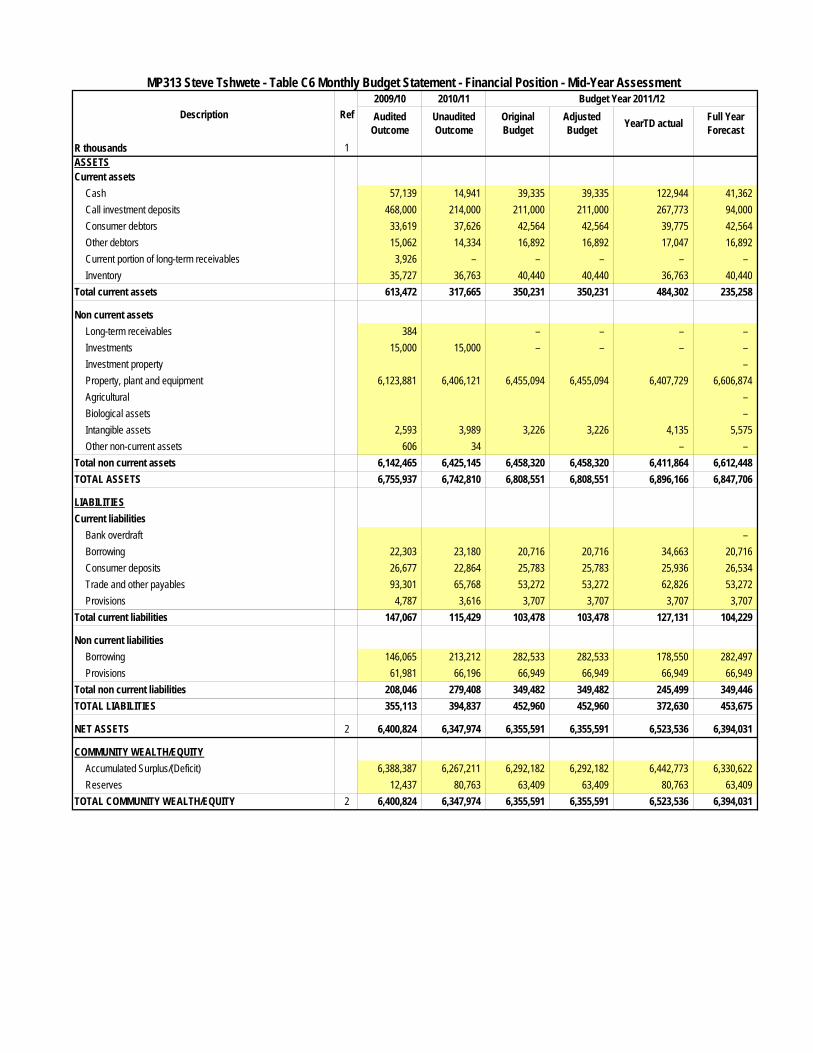
Table C6: Monthly Budget Statement Financial Position
In general the community wealth of the municipality is projected to amount to R6 394, 0-million. Total liabilities amounts to R453,7-million, whilst total assets amounts to R6 847,7-million.
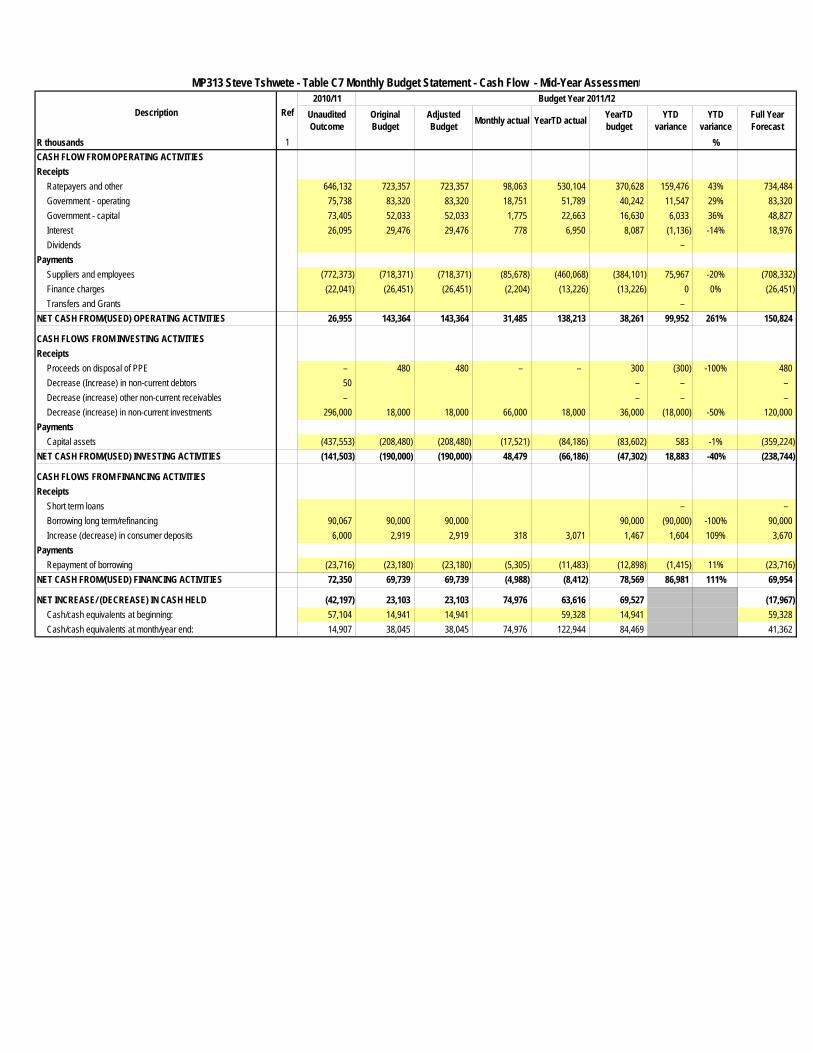
Table C7: Monthly Budget Statement Cash Flow
Table C7 provides detail of the projected cash in- and outflow. A net cash inflow from operating activities of R150,8-million is forecasted, whilst a cash outflow from investing activities to the amount of R238,7-million is projected. The forecasted cash held on 30 June 2012 amounts to R41,4-million.

2010/11Unaudited Outcome
Original Budget
Adjusted Budget
Monthly actual YearTD actual YearTD
budget YTD variance YTD variance
Full Year Forecast
R thousands %Financial Performance
Property rates 171,197 195,806 195,806 16,468 98,253 97,903 350 0% 197,150 Service charges 401,546 480,029 480,029 40,214 244,395 241,067 3,327 1% 472,867 Investment revenue 28,024 29,476 29,476 778 6,950 8,087 (1,136) -14% 18,976 Transfers recognised - operational 75,717 83,320 83,320 18,751 51,789 40,242 11,547 29% 83,320 Other own revenue 57,304 63,150 63,150 4,255 26,639 31,658 (5,019) -16% 64,915
Total Revenue (excluding capital transfers and contributions)
733,788 851,781 851,781 80,466 428,026 418,957 9,069 2% 837,228
Employee costs 225,929 261,162 261,162 24,502 123,677 135,956 (12,279) -9% 251,128 Remuneration of Councillors 11,934 15,364 15,364 1,168 7,038 7,927 (888) -11% 15,744 Depreciation & asset impairment 157,081 156,887 156,887 13,074 78,443 78,442 2 0% 156,887 Finance charges 14,162 26,451 26,451 2,204 13,226 13,226 0 0% 26,451 Materials and bulk purchases 192,109 240,571 240,571 2,256 117,630 133,935 (16,305) -12% 240,684 Transfers and grants 35,145 45,196 45,196 3,650 21,496 22,514 (1,017) 44,573 Other expenditure 195,037 171,988 171,988 11,443 70,151 86,159 (16,008) -19% 162,699
Total Expenditure 831,397 917,619 917,619 58,298 431,661 478,158 (46,496) -10% 898,166 Surplus/(Deficit) (97,609) (65,838) (65,838) 22,169 (3,635) (59,200) 55,565 -94% (60,938)
Transfers recognised - capital 35,976 48,827 48,827 1,775 22,663 16,630 6,033 36% 48,827 Contributions & Contributed assets 13,809 25,376 25,376 – – – – 25,376
Surplus/(Deficit) after capital transfers & contributions
(47,824) 8,365 8,365 23,944 19,027 (42,570) 61,598 -145% 13,265
Share of surplus/ (deficit) of associate – – – – – – – – Surplus/ (Deficit) for the year (47,824) 8,365 8,365 23,944 19,027 (42,570) 61,598 -145% 13,265
Capital expenditure & funds sourcesCapital expenditure 257,568 208,480 362,479 17,521 84,186 149,633 (65,447) -44% 359,224
Capital transfers recognised 36,947 48,827 56,687 2,428 24,186 26,218 (2,032) -8% 56,387 Public contributions & donations – – – – – – – – Borrowing 72,058 91,800 171,267 4,729 24,805 36,441 (11,636) -32% 169,702 Internally generated funds 148,563 67,853 134,525 10,363 35,194 86,974 (51,780) -60% 133,135
Total sources of capital funds 257,568 208,480 362,479 17,521 84,186 149,633 (65,447) -44% 359,224
Financial positionTotal current assets 613,472 350,231 350,231 484,302 235,258 Total non current assets 6,142,465 6,458,320 6,458,320 6,411,864 6,612,448 Total current liabilities 147,067 103,478 103,478 127,131 104,229 Total non current liabilities 208,046 349,482 349,482 245,499 349,446
Community wealth/Equity 6,400,824 6,355,591 6,355,591 6,523,536 6,394,031
Cash flowsNet cash from (used) operating 26,955 143,364 143,364 31,485 138,213 38,261 99,952 261% 150,824 Net cash from (used) investing (141,503) (190,000) (190,000) 48,479 (66,186) (47,302) (18,883) 40% (238,744) Net cash from (used) financing 72,350 69,739 69,739 (4,988) (8,412) 78,569 (86,981) -111% 69,954
Cash/cash equivalents at the month/year end 14,907 38,045 38,045 74,976 122,944 84,469 38,475 46% 41,362
Debtors & creditors analysis 0-30 Days 31-60 Days 61-90 Days 91-120 Days 121-150 Dys 151-180 Dys 181 Dys-1 Yr Over 1Yr Total
Debtors Age AnalysisTotal By Revenue Source 24,743 4,058 2,707 1,986 1,873 21,455 – 0% 56,822 Creditors Age AnalysisTotal Creditors 62,826 – – – – – – 0% 62,826
DescriptionBudget Year 2011/12
MP313 Steve Tshwete - Table C1 Monthly Budget Statement Summary - Mid-Year Assessment
2010/11 Budget Year 2011/12Unaudited Outcome
Original Budget
Adjusted Budget
Monthly actual YearTD actual YearTD
budgetYTD
varianceYTD
varianceFull Year Forecast
R thousands 1 %Revenue - Standard
Governance and administration 271,905 316,314 316,314 29,596 148,393 149,133 (740) 0% 307,457 Executive and council 39,441 38,921 38,921 9,328 25,112 19,455 5,657 29% 38,921 Budget and treasury office 204,790 232,259 232,259 18,742 109,253 109,577 (324) 0% 223,163 Corporate services 27,674 45,134 45,134 1,526 14,027 20,101 (6,074) -30% 45,373
Community and public safety 20,696 29,325 29,325 864 8,570 10,546 (1,976) -19% 29,628 Community and social services 3,716 5,577 5,577 78 1,581 2,102 (521) -25% 5,577 Sport and recreation 8,370 13,673 13,673 69 3,473 5,137 (1,663) -32% 13,673 Public safety 5,685 6,235 6,235 703 3,432 2,652 779 29% 6,538 Housing 212 1,165 1,165 12 77 585 (508) -87% 1,165 Health 2,714 2,674 2,674 2 7 70 (63) -91% 2,674
Economic and environmental services 37,547 37,859 37,859 2,984 22,097 14,549 7,548 52% 37,859 Planning and development 2,765 3,875 3,875 73 1,769 700 1,069 153% 3,875 Road transport 34,782 33,984 33,984 2,911 20,328 13,849 6,479 47% 33,984 Environmental protection – – – – – – – –
Trading services 453,425 542,486 542,486 48,797 271,629 261,359 10,269 4% 536,487 Electricity 303,467 357,560 357,560 31,477 181,904 178,284 3,619 2% 350,102 Water 49,798 67,425 67,425 4,800 31,002 27,239 3,762 14% 67,944 Waste water management 52,588 62,814 62,814 6,118 29,502 28,902 600 2% 62,946 Waste management 47,572 54,686 54,686 6,402 29,222 26,934 2,288 8% 55,495 Other 4 – – – – – – – –
Total Revenue - Standard 2 783,573 925,983 925,983 82,241 450,688 435,587 15,101 3% 911,431
Expenditure - StandardGovernance and administration 174,754 178,998 178,998 13,012 83,041 92,600 (9,559) -10% 175,835
Executive and council 57,950 57,910 57,910 4,273 25,961 30,143 (4,182) -14% 56,325 Budget and treasury office 38,006 43,256 43,256 3,046 20,188 21,886 (1,698) -8% 42,922 Corporate services 78,798 77,833 77,833 5,693 36,892 40,571 (3,679) -9% 76,589
Community and public safety 134,610 152,834 152,834 12,676 69,320 77,964 (8,644) -11% 142,348 Community and social services 18,902 22,774 22,774 2,012 10,875 11,369 (494) -4% 22,130 Sport and recreation 38,926 44,263 44,263 3,868 17,431 22,191 (4,760) -21% 36,704 Public safety 49,019 54,377 54,377 4,290 26,691 28,415 (1,724) -6% 54,027 Housing 7,500 8,751 8,751 686 3,875 4,271 (396) -9% 8,221 Health 20,263 22,668 22,668 1,819 10,448 11,718 (1,270) -11% 21,266
Economic and environmental services 101,242 104,100 104,100 9,153 49,516 52,419 (2,903) -6% 101,525 Planning and development 8,110 9,818 9,818 990 4,080 5,052 (972) -19% 9,465 Road transport 93,132 94,281 94,281 8,163 45,437 47,367 (1,931) -4% 92,060 Environmental protection – – – – – – – –
Trading services 420,791 481,687 481,687 23,457 229,784 255,174 (25,391) -10% 478,457 Electricity 276,737 315,427 315,427 8,619 151,308 171,231 (19,923) -12% 312,590 Water 50,077 55,499 55,499 4,580 24,127 27,430 (3,303) -12% 54,919 Waste water management 45,545 57,899 57,899 5,141 27,455 29,479 (2,023) -7% 56,911 Waste management 48,431 52,862 52,862 5,117 26,894 27,035 (141) -1% 54,038 Other – – – – – – – –
Total Expenditure - Standard 3 831,397 917,619 917,619 58,298 431,661 478,158 (46,496) -10% 898,166 Surplus/ (Deficit) for the year (47,824) 8,365 8,365 23,944 19,027 (42,570) 61,598 -145% 13,265
RefDescription
MP313 Steve Tshwete - Table C2 Monthly Budget Statement - Financial Performance (standard classification) - Mid-Year Assessment

2010/11 Budget Year 2011/12Unaudited Outcome
Original Budget
Adjusted Budget Monthly actual YearTD actual YearTD budget YTD variance YTD variance Full Year
ForecastR thousands 1 %Revenue - Standard
Municipal governance and administration 271,905 316,314 316,314 29,596 148,393 149,133 (740) 0% 307,457Executive and council 39,441 38,921 38,921 9,328 25,112 19,455 5,657 29% 38,921
Mayor and Council 39,325 38,921 38,921 9,328 25,107 19,455 5,652 29% 38,921Municipal Manager 116 5 5 #DIV/0!
Budget and treasury office 204,790 232,259 232,259 18,742 109,253 109,577 (324) 0% 223,163Corporate services 27,674 45,134 45,134 1,526 14,027 20,101 (6,074) -30% 45,373
Human Resources 649 1,031 1,031 416 425 (9) -2% 1,031Information Technology 1 0 32%Property Services 19,694 33,308 33,308 960 8,667 14,926 (6,259) -42% 33,433Other Admin 7,330 10,795 10,795 567 4,944 4,749 195 4% 10,910
Community and public safety 20,696 29,325 29,325 864 8,570 10,546 (1,976) -19% 29,628Community and social services 3,716 5,577 5,577 78 1,581 2,102 (521) -25% 5,577
Libraries and Archives 159 139 139 2 57 74 (17) -23% 139Museums & Art Galleries etc – Community halls and Facilities 343 2,800 2,800 20 611 968 (357) -37% 2,800Cemeteries & Crematoriums 2,931 2,350 2,350 34 778 915 (137) -15% 2,350Child Care – Aged Care 278 288 288 23 135 145 (10) -7% 288Other Community – Other Social 5 –
Sport and recreation 8,370 13,673 13,673 69 3,473 5,137 (1,663) -32% 13,673Public safety 5,685 6,235 6,235 703 3,432 2,652 779 29% 6,538
Police 4,916 5,157 5,157 435 3,110 2,605 504 19% 5,168Fire 195 197 197 268 322 47 275 587% 490Civil Defence – Street Lighting 573 880 880 – 880Other –
Housing 212 1,165 1,165 12 77 585 (508) -87% 1,165Health 2,714 2,674 2,674 2 7 70 (63) -91% 2,674
Clinics 2,409 2,510 2,510 – 2,510Ambulance – Other 305 164 164 2 7 70 (63) -91% 164
Economic and environmental services 37,547 37,859 37,859 2,984 22,097 14,549 7,548 52% 37,859Planning and development 2,765 3,875 3,875 73 1,769 700 1,069 153% 3,875
Economic Development/Planning 5 – Town Planning/Building enforcement
2,760 3,875 3,875 73 1,769 700 1,069 153% 3,875Licensing & Regulation –
Road transport 34,782 33,984 33,984 2,911 20,328 13,849 6,479 47% 33,984Roads 20,486 20,956 20,956 1,535 13,308 7,548 5,760 76% 20,956Public Buses – Parking Garages – Vehicle Licensing and Testing 13,623 12,991 12,991 1,373 7,002 6,282 719 11% 12,991Other 673 37 37 3 18 18 0 0% 37
Environmental protection – Pollution Control – Biodiversity & Landscape – Other –
Trading services 453,425 542,486 542,486 48,797 271,629 261,359 10,269 4% 536,487Electricity 303,467 357,560 357,560 31,477 181,904 178,284 3,619 2% 350,102
Electricity Distribution 303,467 357,560 357,560 31,477 181,904 178,284 3,619 2% 350,102Electricity Generation –
Water 49,798 67,425 67,425 4,800 31,002 27,239 3,762 14% 67,944Water Distribution 49,795 67,425 67,425 4,800 31,002 27,239 3,762 14% 67,944Water Storage 3 –
Waste water management 52,588 62,814 62,814 6,118 29,502 28,902 600 2% 62,946Sewerage 52,588 62,814 62,814 6,118 29,502 28,902 600 2% 62,946Storm Water Management – Public Toilets –
Waste management 47,572 54,686 54,686 6,402 29,222 26,934 2,288 8% 55,495Solid Waste 47,572 54,686 54,686 6,402 29,222 26,934 2,288 8% 55,495
Other – Air Transport – Abattoirs – Tourism – Forestry – Markets –
Total Revenue - Standard 2 783,573 925,983 925,983 82,241 450,688 435,587 15,101 3% 911,431
MP313 Steve Tshwete - Table C2 Monthly Budget Statement - Financial Performance (standard classification) - Mid-Year Assessment
Description Ref
2010/11 Budget Year 2011/12Unaudited Outcome
Original Budget
Adjusted Budget Monthly actual YearTD actual YearTD budget YTD variance YTD variance Full Year
ForecastR thousands 1 %
MP313 Steve Tshwete - Table C2 Monthly Budget Statement - Financial Performance (standard classification) - Mid-Year Assessment
Description Ref
Expenditure - StandardMunicipal governance and administration 174,754 178,998 178,998 13,012 83,041 92,600 (9,559) -10% 175,835
Executive and council 57,950 57,910 57,910 4,273 25,961 30,143 (4,182) -14% 56,325Mayor and Council 36,636 30,607 30,607 2,178 14,504 16,336 (1,831) -11% 29,648Municipal Manager 21,313 27,303 27,303 2,095 11,457 13,808 (2,351) -17% 26,677
Budget and treasury office 38,006 43,256 43,256 3,046 20,188 21,886 (1,698) -8% 42,922Corporate services 78,798 77,833 77,833 5,693 36,892 40,571 (3,679) -9% 76,589
Human Resources 7,206 9,584 9,584 763 3,984 5,076 (1,092) -22% 8,812Information Technology 8,750 11,752 11,752 815 4,389 5,950 (1,561) -26% 10,751Property Services 32,348 20,952 20,952 1,674 9,880 10,393 (513) -5% 20,748Other Admin 30,495 35,545 35,545 2,441 18,639 19,152 (513) -3% 36,277
Community and public safety 134,610 152,834 152,834 12,676 69,320 77,964 (8,644) -11% 142,348Community and social services 18,902 22,774 22,774 2,012 10,875 11,369 (494) -4% 22,130
Libraries and Archives 7,481 8,498 8,498 752 4,420 4,211 209 5% 8,908Museums & Art Galleries etc – Community halls and Facilities 4,170 5,933 5,933 480 2,743 2,901 (158) -5% 5,536Cemeteries & Crematoriums 4,682 5,108 5,108 452 2,154 2,717 (562) -21% 4,497Child Care – Aged Care 885 851 851 53 474 400 75 19% 970Other Community – Other Social 1,684 2,383 2,383 275 1,084 1,142 (58) -5% 2,219
Sport and recreation 38,926 44,263 44,263 3,868 17,431 22,191 (4,760) -21% 36,704Public safety 49,019 54,377 54,377 4,290 26,691 28,415 (1,724) -6% 54,027
Police 21,292 23,848 23,848 1,831 11,142 12,614 (1,472) -12% 22,864Fire 23,572 25,482 25,482 2,050 13,072 13,282 (210) -2% 26,227Civil Defence – Street Lighting 4,155 5,048 5,048 409 2,476 2,518 (42) -2% 4,936Other –
Housing 7,500 8,751 8,751 686 3,875 4,271 (396) -9% 8,221Health 20,263 22,668 22,668 1,819 10,448 11,718 (1,270) -11% 21,266
Clinics 15,826 17,628 17,775 1,462 8,141 9,433 (1,292) -14% 16,514Ambulance – Other 4,437 5,040 4,893 357 2,307 2,285 22 1% 4,752
Economic and environmental services 101,242 104,100 104,100 9,153 49,516 52,419 (2,903) -6% 101,525Planning and development 8,110 9,818 9,818 990 4,080 5,052 (972) -19% 9,465
Economic Development/Planning 1,864 2,597 2,597 288 970 1,319 (349) -26% 2,199Town Planning/Building enforcement
6,246 7,222 7,222 703 3,110 3,732 (623) -17% 7,266Licensing & Regulation –
Road transport 93,132 94,281 94,281 8,163 45,437 47,367 (1,931) -4% 92,060Roads 81,144 80,287 80,287 6,988 38,719 39,937 (1,217) -3% 78,425Public Buses – Parking Garages – Vehicle Licensing and Testing 10,363 12,182 12,182 978 5,783 6,496 (713) -11% 11,729Other 1,624 1,813 1,813 197 934 935 (1) 0% 1,905
Environmental protection – Pollution Control – Biodiversity & Landscape – Other –
Trading services 420,791 481,687 481,687 23,457 229,784 255,174 (25,391) -10% 478,457Electricity 276,737 315,427 315,427 8,619 151,308 171,231 (19,923) -12% 312,590
Electricity Distribution 276,737 315,427 315,427 8,619 151,308 171,231 (19,923) -12% 312,590Electricity Generation –
Water 50,077 55,499 55,499 4,580 24,127 27,430 (3,303) -12% 54,919Water Distribution 31,224 33,321 33,321 2,792 13,985 16,385 (2,400) -15% 33,040Water Storage 18,853 22,178 22,178 1,787 10,142 11,045 (903) -8% 21,878
Waste water management 45,545 57,899 57,899 5,141 27,455 29,479 (2,023) -7% 56,911Sewerage 43,958 56,191 56,191 4,974 26,550 28,595 (2,046) -7% 55,125Storm Water Management – Public Toilets 1,588 1,708 1,708 168 906 883 22 3% 1,785
Waste management 48,431 52,862 52,862 5,117 26,894 27,035 (141) -1% 54,038Solid Waste 48,431 52,862 52,862 5,117 26,894 27,035 (141) -1% 54,038
Other – Air Transport – Abattoirs – Tourism – Forestry – Markets –
Total Expenditure - Standard 3 831,397 917,619 917,619 58,298 431,661 478,158 (46,496) -10% 898,166Surplus/ (Deficit) for the year (47,824) 8,365 8,365 23,944 19,027 (42,570) 61,598 -145% 13,265
2010/11Unaudited Outcome Original Budget Adjusted
Budget Monthly actual YearTD actual YearTD budget YTD variance
YTD variance
Full Year Forecast
R thousands %Revenue By Source
Property rates 171,197 195,806 195,806 16,468 98,253 97,903 350 0% 197,150Property rates - penalties & collection charges – Service charges - electricity revenue 285,065 343,705 343,705 29,177 173,103 171,902 1,201 1% 335,603Service charges - water revenue 43,882 49,456 49,456 3,834 27,250 24,731 2,519 10% 49,456Service charges - sanitation revenue 36,371 44,888 44,888 3,574 22,435 23,444 (1,009) -4% 45,019Service charges - refuse revenue 36,228 41,980 41,980 3,629 21,607 20,990 617 3% 42,789Service charges - other – Rental of facilities and equipment 13,445 12,704 12,704 1,044 6,323 6,305 19 0% 12,828Interest earned - external investments 25,708 27,740 27,740 630 6,067 7,223 (1,156) -16% 17,240Interest earned - outstanding debtors 2,316 1,736 1,736 149 883 864 20 2% 1,736Dividends received – Fines 4,962 5,140 5,140 457 3,132 2,589 543 21% 5,140Licences and permits 5,329 5,247 5,247 428 3,040 2,563 477 19% 5,247Agency services 8,217 7,704 7,704 943 3,961 3,705 256 7% 7,704Transfers recognised - operational 75,717 83,320 83,320 18,751 51,789 40,242 11,547 29% 83,320Other revenue 25,350 31,875 31,875 1,383 10,183 16,195 (6,013) -37% 33,516Gains on disposal of PPE 480 480 300 (300) -100% 480
Total Revenue (excluding capital transfers and contributions)733,788 851,781 851,781 80,466 428,026 418,957 9,069 2% 837,228
Expenditure By TypeEmployee related costs 225,929 261,162 261,162 24,502 123,677 135,956 (12,279) -9% 251,128Remuneration of councillors 11,934 15,364 15,364 1,168 7,038 7,927 (888) -11% 15,744Debt impairment 4,088 4,778 4,778 369 2,214 2,389 (175) -7% 4,778Depreciation & asset impairment 157,081 156,887 156,887 13,074 78,443 78,442 2 0% 156,887Finance charges 14,162 26,451 26,451 2,204 13,226 13,226 0 0% 26,451Bulk purchases 192,109 240,571 240,571 2,256 117,630 133,935 (16,305) -12% 240,684Other materials – Contracted services 19,259 22,015 22,168 1,522 7,918 10,514 (2,596) -25% 18,791Transfers and grants 35,145 45,196 45,196 3,650 21,496 22,514 (1,017) -5% 44,573Other expenditure 170,051 145,195 145,042 9,552 60,019 73,255 (13,237) -18% 139,129Loss on disposal of PPE 1,640 –
Total Expenditure 831,397 917,619 917,619 58,298 431,661 478,158 (46,496) -10% 898,166
Surplus/(Deficit) (97,609) (65,838) (65,838) 22,169 (3,635) (59,200) (37,428) 0 (60,938)Transfers recognised - capital 35,976 48,827 48,827 1,775 22,663 16,630 48,827Contributions recognised - capitalContributed assets 13,809 25,376 25,376 25,376
Surplus/(Deficit) after capital transfers & contributions (47,824) 8,365 8,365 23,944 19,027 (42,570) 13,265
TaxationSurplus/(Deficit) after taxation (47,824) 8,365 8,365 23,944 19,027 (42,570) 13,265
Attributable to minoritiesSurplus/(Deficit) attributable to municipality (47,824) 8,365 8,365 23,944 19,027 (42,570) 13,265
Share of surplus/ (deficit) of associate
Surplus/ (Deficit) for the year (47,824) 8,365 8,365 23,944 19,027 (42,570) 13,265
Description RefBudget Year 2011/12
MP313 Steve Tshwete - Table C4 Monthly Budget Statement - Financial Performance (revenue and expenditure) - Mid-Year Assessment
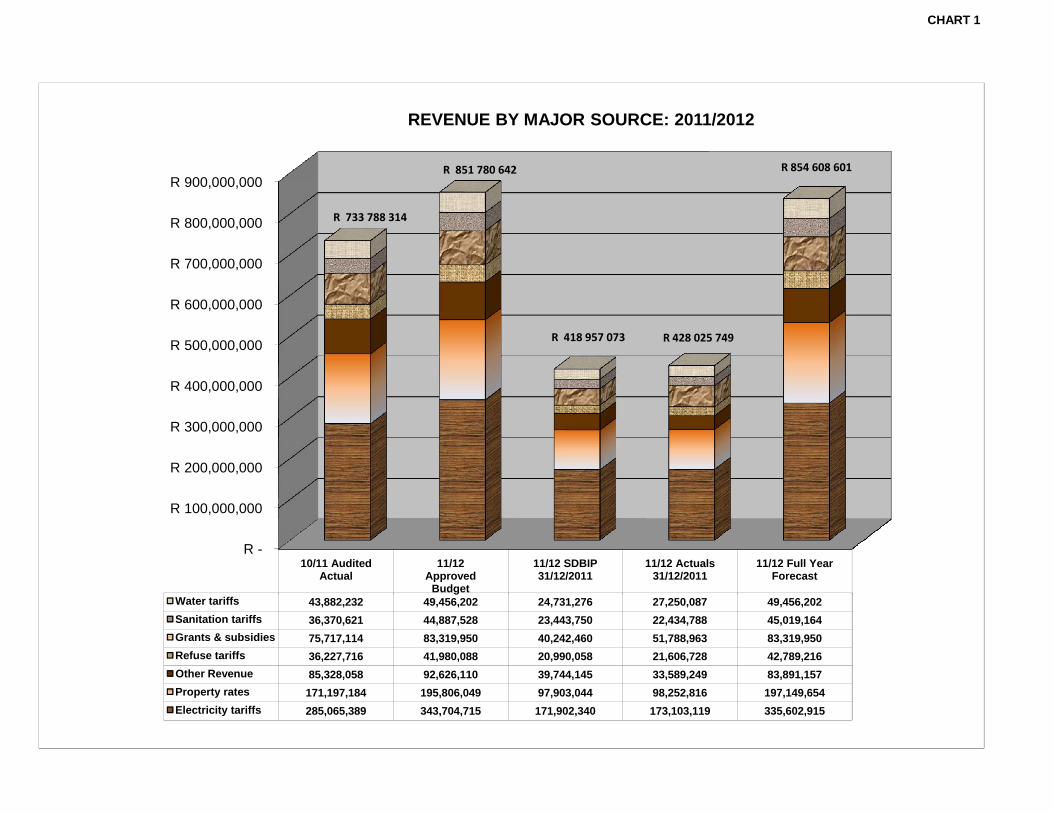
CHART 1
R 300,000,000
R 400,000,000
R 500,000,000
R 600,000,000
R 700,000,000
R 800,000,000
R 900,000,000
REVENUE BY MAJOR SOURCE: 2011/2012
R 418 957 073 R 428 025 749
R 854 608 601
R 733 788 314
R 851 780 642
R -
R 100,000,000
R 200,000,000
10/11 Audited Actual
11/12 Approved
Budget
11/12 SDBIP 31/12/2011
11/12 Actuals 31/12/2011
11/12 Full Year Forecast
Water tariffs 43,882,232 49,456,202 24,731,276 27,250,087 49,456,202Sanitation tariffs 36,370,621 44,887,528 23,443,750 22,434,788 45,019,164Grants & subsidies 75,717,114 83,319,950 40,242,460 51,788,963 83,319,950Refuse tariffs 36,227,716 41,980,088 20,990,058 21,606,728 42,789,216Other Revenue 85,328,058 92,626,110 39,744,145 33,589,249 83,891,157Property rates 171,197,184 195,806,049 97,903,044 98,252,816 197,149,654Electricity tariffs 285,065,389 343,704,715 171,902,340 173,103,119 335,602,915
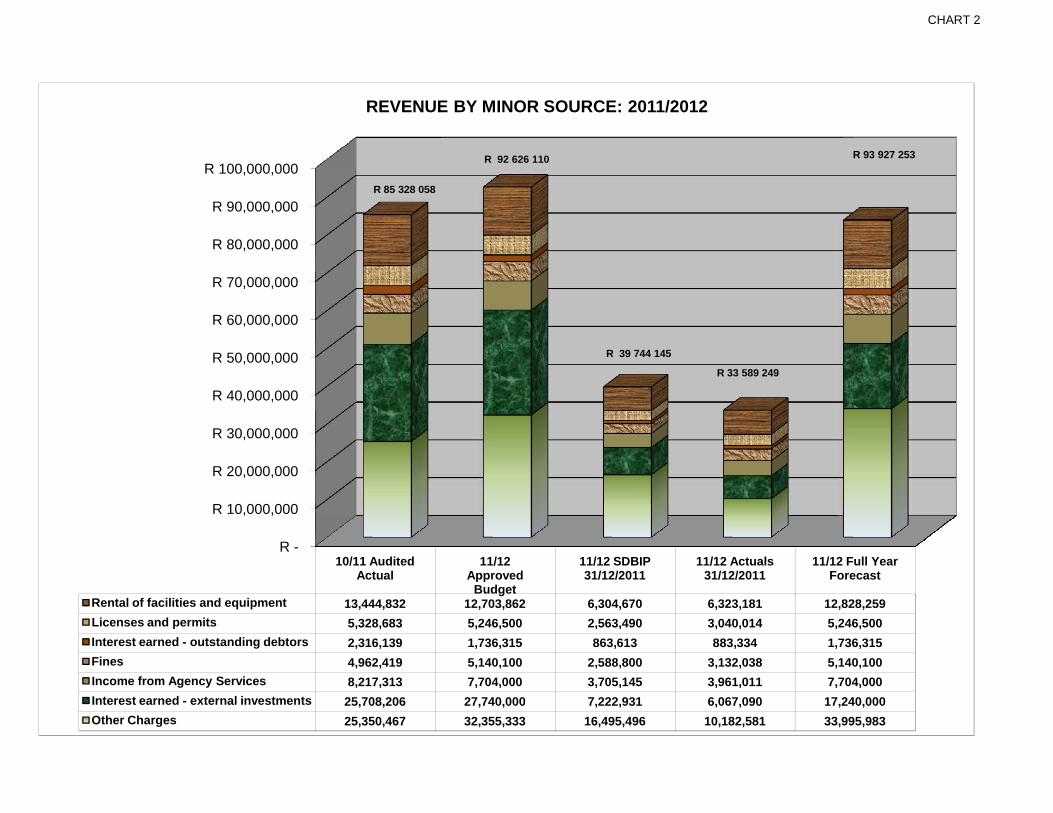
CHART 2
R 30,000,000
R 40,000,000
R 50,000,000
R 60,000,000
R 70,000,000
R 80,000,000
R 90,000,000
R 100,000,000
REVENUE BY MINOR SOURCE: 2011/2012
R 85 328 058
R 92 626 110
R 39 744 145
R 33 589 249
R 93 927 253
R -
R 10,000,000
R 20,000,000
10/11 Audited Actual
11/12 Approved
Budget
11/12 SDBIP 31/12/2011
11/12 Actuals 31/12/2011
11/12 Full Year Forecast
Rental of facilities and equipment 13,444,832 12,703,862 6,304,670 6,323,181 12,828,259Licenses and permits 5,328,683 5,246,500 2,563,490 3,040,014 5,246,500Interest earned - outstanding debtors 2,316,139 1,736,315 863,613 883,334 1,736,315Fines 4,962,419 5,140,100 2,588,800 3,132,038 5,140,100Income from Agency Services 8,217,313 7,704,000 3,705,145 3,961,011 7,704,000Interest earned - external investments 25,708,206 27,740,000 7,222,931 6,067,090 17,240,000Other Charges 25,350,467 32,355,333 16,495,496 10,182,581 33,995,983
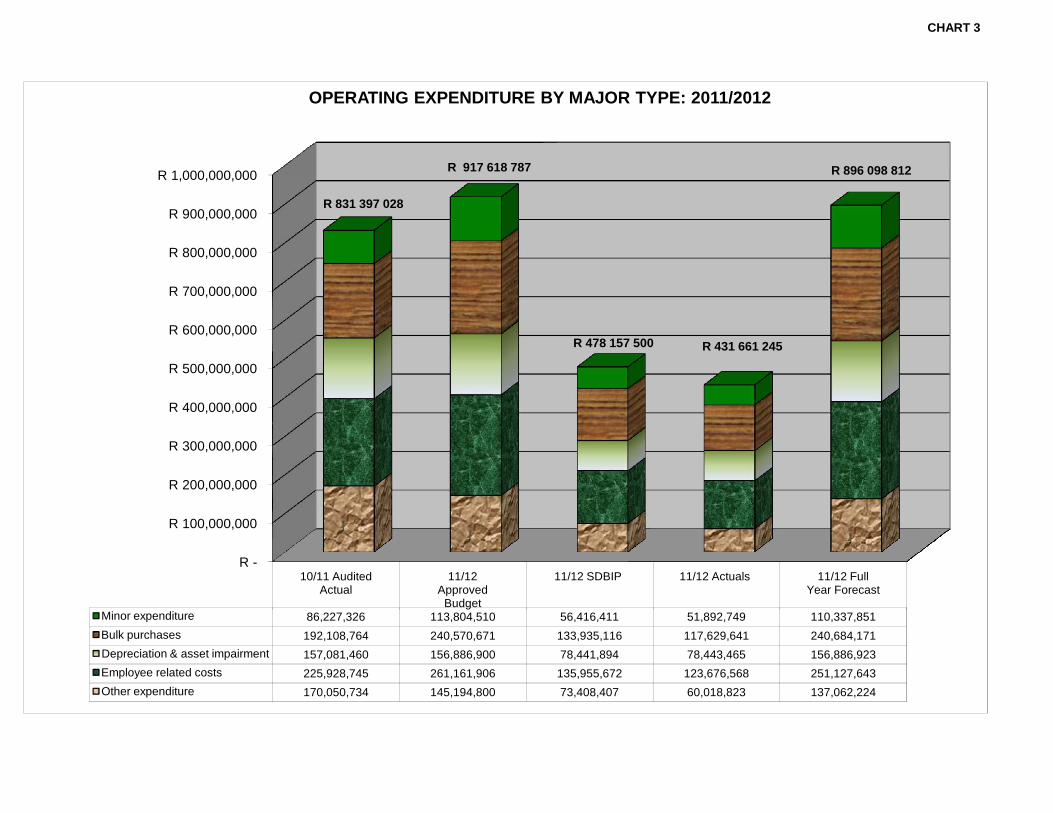
CHART 3
R 300,000,000
R 400,000,000
R 500,000,000
R 600,000,000
R 700,000,000
R 800,000,000
R 900,000,000
R 1,000,000,000
OPERATING EXPENDITURE BY MAJOR TYPE: 2011/2012
R 831 397 028
R 917 618 787
R 478 157 500 R 431 661 245
R 896 098 812
R -
R 100,000,000
R 200,000,000
10/11 Audited Actual
11/12 Approved
Budget
11/12 SDBIP 11/12 Actuals 11/12 Full Year Forecast
Minor expenditure 86,227,326 113,804,510 56,416,411 51,892,749 110,337,851Bulk purchases 192,108,764 240,570,671 133,935,116 117,629,641 240,684,171Depreciation & asset impairment 157,081,460 156,886,900 78,441,894 78,443,465 156,886,923Employee related costs 225,928,745 261,161,906 135,955,672 123,676,568 251,127,643Other expenditure 170,050,734 145,194,800 73,408,407 60,018,823 137,062,224
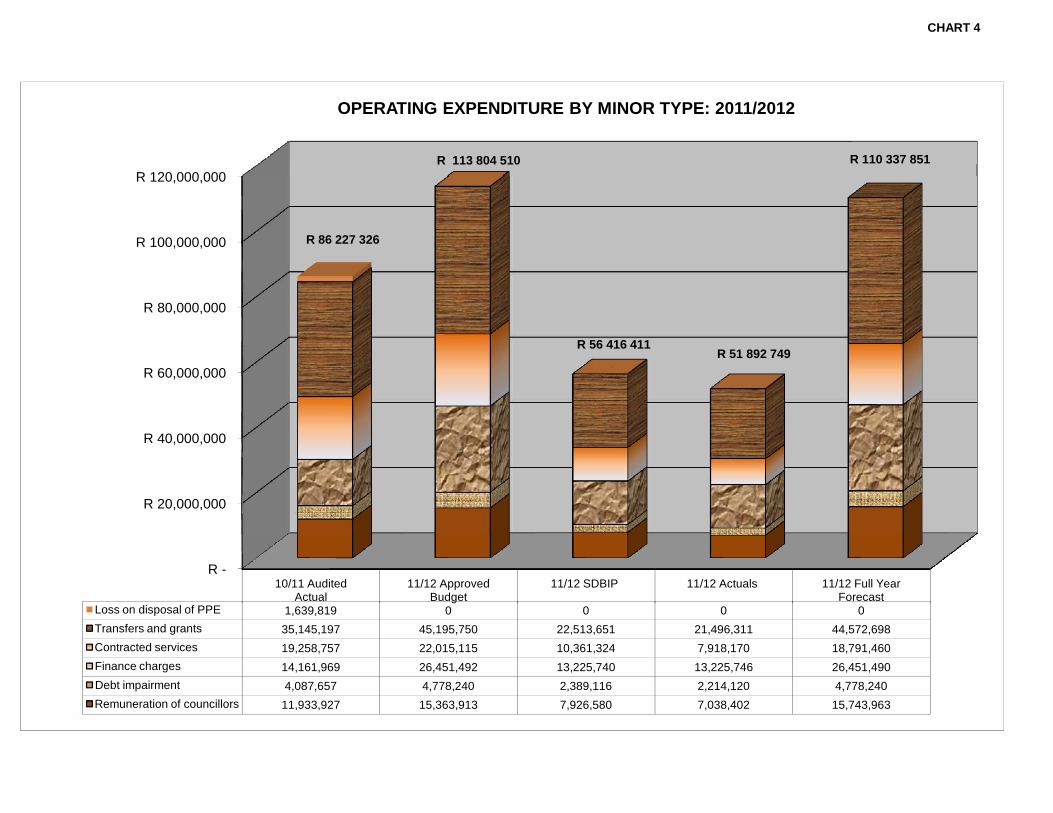
CHART 4
R 40,000,000
R 60,000,000
R 80,000,000
R 100,000,000
R 120,000,000
OPERATING EXPENDITURE BY MINOR TYPE: 2011/2012
R 86 227 326
R 113 804 510
R 56 416 411R 51 892 749
R 110 337 851
R -
R 20,000,000
10/11 Audited Actual
11/12 Approved Budget
11/12 SDBIP 11/12 Actuals 11/12 Full Year Forecast
Loss on disposal of PPE 1,639,819 0 0 0 0Transfers and grants 35,145,197 45,195,750 22,513,651 21,496,311 44,572,698Contracted services 19,258,757 22,015,115 10,361,324 7,918,170 18,791,460Finance charges 14,161,969 26,451,492 13,225,740 13,225,746 26,451,490Debt impairment 4,087,657 4,778,240 2,389,116 2,214,120 4,778,240Remuneration of councillors 11,933,927 15,363,913 7,926,580 7,038,402 15,743,963
2010/11 Budget Year 2011/12Unaudited Outcome
Original Budget
Adjusted Budget
Monthly actual YearTD actual YearTD
budgetYTD
varianceYTD
varianceFull Year Forecast
R thousands 1 %
Capital Expenditure - Standard ClassificationGovernance and administration 16,636 21,986 26,398 371 4,925 6,743 (1,818) -27% 26,349
Executive and council 1,253 834 834 105 345 202 144 71% 832,088 Budget and treasury office 109 372 372 0 9 82 (73) -89% 372,000 Corporate services 15,274 20,780 25,193 267 4,571 6,459 (1,889) -29% 25,145,176
Community and public safety 56,615 32,916 84,935 5,304 22,785 67,842 (45,056) -66% 84,400 Community and social services 33,999 7,240 58,260 3,046 13,503 54,040 (40,537) -75% 58,246 Sport and recreation 13,532 17,814 16,687 1,138 7,304 7,920 (616) -8% 16,521 Public safety 7,942 6,541 7,946 426 1,037 4,626 (3,589) -78% 7,937 Housing 23 425 425 25 60 425 (365) -86% 122 Health 1,119 896 1,618 668 882 831 51 6% 1,574
Economic and environmental services 69,756 69,495 83,088 8,819 32,530 28,088 4,442 16% 82,067 Planning and development 853 4,850 8,726 111 854 920 (66) -7% 8,726 Road transport 68,903 64,645 74,362 8,708 31,676 27,168 4,508 17% 73,341 Environmental protection – – – – – – –
Trading services 114,562 84,083 168,057 3,026 23,945 46,960 (23,015) -49% 166,408 Electricity 85,728 31,680 62,963 1,110 14,228 21,956 (7,728) -35% 62,963 Water 5,622 6,500 17,061 1,093 3,130 6,638 (3,508) -53% 16,606 Waste water management 18,934 42,579 83,514 428 5,458 14,747 (9,290) -63% 82,344 Waste management 4,278 3,324 4,519 395 1,130 3,619 (2,489) -69% 4,495 Other – – – – – – –
Total Capital Expenditure - Standard Classification 3 257,568 208,480 362,479 17,521 84,186 149,633 (65,447) -44% 359,224
Funded by:National Government 35,893 48,527 56,387 2,428 24,186 25,918 (1,732) -7% 56,387 Provincial Government 16 300 300 – – 300 (300) -100% – District Municipality – – – – – – – – Other transfers and grants 1,038 – – – – – – –
Transfers recognised - capital 36,947 48,827 56,687 2,428 24,186 26,218 (2,032) -8% 56,387 Public contributions & donations 5 – – – – – – – – Borrowing 6 72,058 91,800 171,267 4,729 24,805 36,441 (11,636) -32% 169,702 Internally generated funds 148,563 67,853 134,525 10,363 35,194 86,974 (51,780) -60% 133,135
Total Capital Funding 257,568 208,480 362,479 17,521 84,186 149,633 (65,447) -44% 359,224
MP313 Steve Tshwete - Table C5 Monthly Budget Statement - Capital Expenditure (municipal vote, standard classification and funding) - Mid-Year Assessment
Vote Description Ref
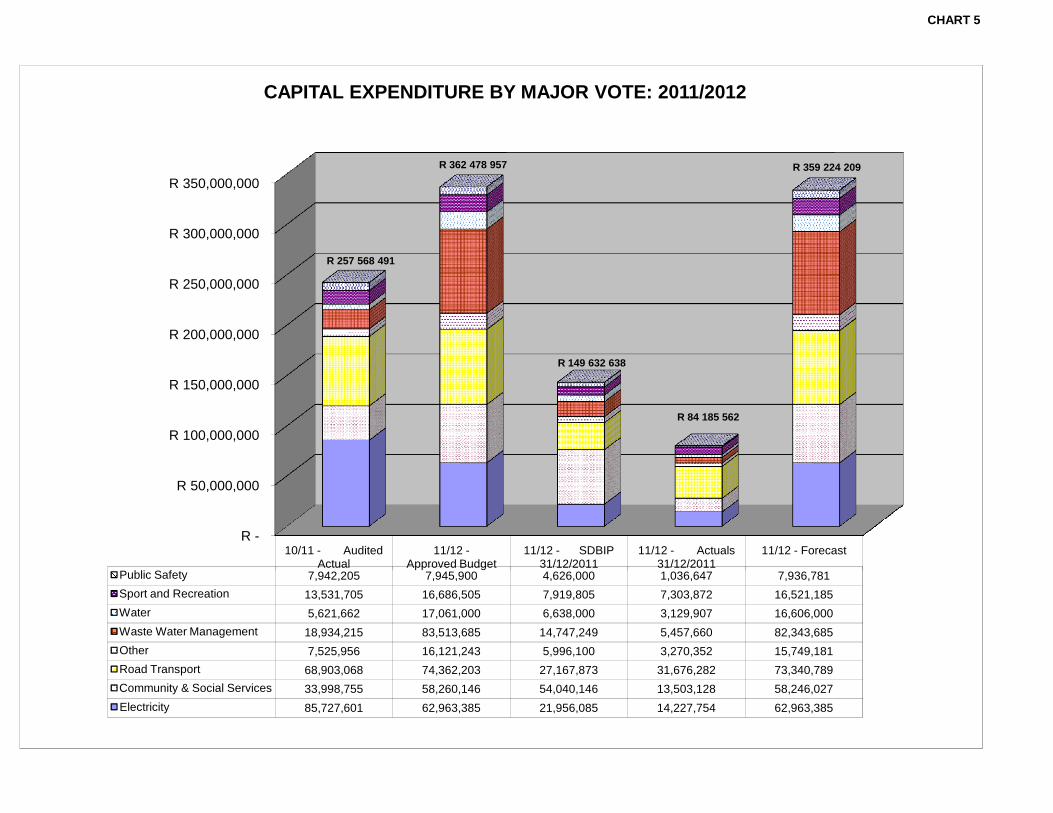
CHART 5
R 100,000,000
R 150,000,000
R 200,000,000
R 250,000,000
R 300,000,000
R 350,000,000
CAPITAL EXPENDITURE BY MAJOR VOTE: 2011/2012
R 362 478 957
R 257 568 491
R 149 632 638
R 84 185 562
R 359 224 209
R -
R 50,000,000
, ,
10/11 - Audited Actual
11/12 -Approved Budget
11/12 - SDBIP 31/12/2011
11/12 - Actuals 31/12/2011
11/12 - Forecast
Public Safety 7,942,205 7,945,900 4,626,000 1,036,647 7,936,781Sport and Recreation 13,531,705 16,686,505 7,919,805 7,303,872 16,521,185Water 5,621,662 17,061,000 6,638,000 3,129,907 16,606,000Waste Water Management 18,934,215 83,513,685 14,747,249 5,457,660 82,343,685Other 7,525,956 16,121,243 5,996,100 3,270,352 15,749,181Road Transport 68,903,068 74,362,203 27,167,873 31,676,282 73,340,789Community & Social Services 33,998,755 58,260,146 54,040,146 13,503,128 58,246,027Electricity 85,727,601 62,963,385 21,956,085 14,227,754 62,963,385
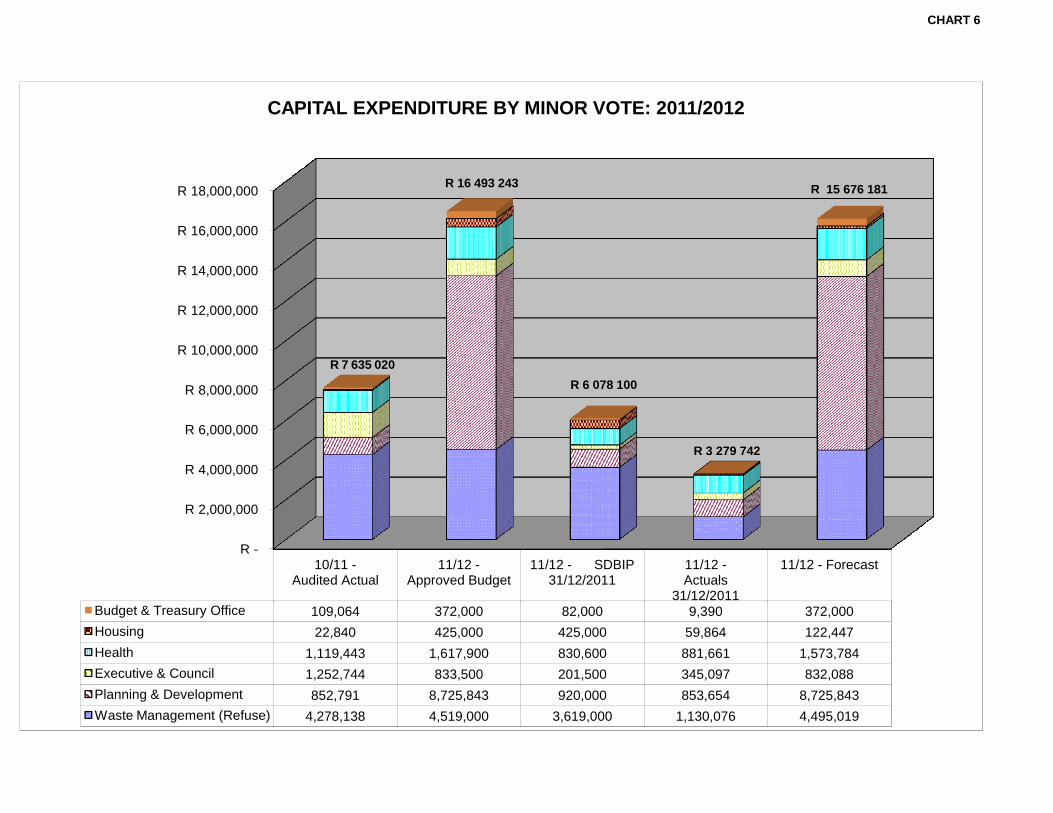
CHART 6
R 6,000,000
R 8,000,000
R 10,000,000
R 12,000,000
R 14,000,000
R 16,000,000
R 18,000,000
CAPITAL EXPENDITURE BY MINOR VOTE: 2011/2012
R 7 635 020
R 16 493 243
R 6 078 100
R 3 279 742
R 15 676 181
R -
R 2,000,000
R 4,000,000
10/11 -Audited Actual
11/12 -Approved Budget
11/12 - SDBIP 31/12/2011
11/12 -Actuals
31/12/2011
11/12 - Forecast
Budget & Treasury Office 109,064 372,000 82,000 9,390 372,000Housing 22,840 425,000 425,000 59,864 122,447Health 1,119,443 1,617,900 830,600 881,661 1,573,784Executive & Council 1,252,744 833,500 201,500 345,097 832,088Planning & Development 852,791 8,725,843 920,000 853,654 8,725,843Waste Management (Refuse) 4,278,138 4,519,000 3,619,000 1,130,076 4,495,019
2009/10 2010/11 Budget Year 2011/12Audited
OutcomeUnaudited Outcome
Original Budget
Adjusted Budget YearTD actual Full Year
ForecastR thousands 1ASSETSCurrent assets
Cash 57,139 14,941 39,335 39,335 122,944 41,362 Call investment deposits 468,000 214,000 211,000 211,000 267,773 94,000 Consumer debtors 33,619 37,626 42,564 42,564 39,775 42,564 Other debtors 15,062 14,334 16,892 16,892 17,047 16,892 Current portion of long-term receivables 3,926 – – – – – Inventory 35,727 36,763 40,440 40,440 36,763 40,440
Total current assets 613,472 317,665 350,231 350,231 484,302 235,258
Non current assetsLong-term receivables 384 – – – – Investments 15,000 15,000 – – – – Investment property – Property, plant and equipment 6,123,881 6,406,121 6,455,094 6,455,094 6,407,729 6,606,874 Agricultural – Biological assets – Intangible assets 2,593 3,989 3,226 3,226 4,135 5,575 Other non-current assets 606 34 – –
Total non current assets 6,142,465 6,425,145 6,458,320 6,458,320 6,411,864 6,612,448 TOTAL ASSETS 6,755,937 6,742,810 6,808,551 6,808,551 6,896,166 6,847,706
LIABILITIESCurrent liabilities
Bank overdraft – Borrowing 22,303 23,180 20,716 20,716 34,663 20,716 Consumer deposits 26,677 22,864 25,783 25,783 25,936 26,534 Trade and other payables 93,301 65,768 53,272 53,272 62,826 53,272 Provisions 4,787 3,616 3,707 3,707 3,707 3,707
Total current liabilities 147,067 115,429 103,478 103,478 127,131 104,229
Non current liabilitiesBorrowing 146,065 213,212 282,533 282,533 178,550 282,497 Provisions 61,981 66,196 66,949 66,949 66,949 66,949
Total non current liabilities 208,046 279,408 349,482 349,482 245,499 349,446 TOTAL LIABILITIES 355,113 394,837 452,960 452,960 372,630 453,675
NET ASSETS 2 6,400,824 6,347,974 6,355,591 6,355,591 6,523,536 6,394,031
COMMUNITY WEALTH/EQUITYAccumulated Surplus/(Deficit) 6,388,387 6,267,211 6,292,182 6,292,182 6,442,773 6,330,622 Reserves 12,437 80,763 63,409 63,409 80,763 63,409
TOTAL COMMUNITY WEALTH/EQUITY 2 6,400,824 6,347,974 6,355,591 6,355,591 6,523,536 6,394,031
Description Ref
MP313 Steve Tshwete - Table C6 Monthly Budget Statement - Financial Position - Mid-Year Assessment
2010/11 Budget Year 2011/12Unaudited Outcome
Original Budget
Adjusted Budget Monthly actual YearTD actual YearTD
budgetYTD
varianceYTD
varianceFull Year Forecast
R thousands 1 %CASH FLOW FROM OPERATING ACTIVITIESReceipts
Ratepayers and other 646,132 723,357 723,357 98,063 530,104 370,628 159,476 43% 734,484 Government - operating 75,738 83,320 83,320 18,751 51,789 40,242 11,547 29% 83,320 Government - capital 73,405 52,033 52,033 1,775 22,663 16,630 6,033 36% 48,827 Interest 26,095 29,476 29,476 778 6,950 8,087 (1,136) -14% 18,976 Dividends –
PaymentsSuppliers and employees (772,373) (718,371) (718,371) (85,678) (460,068) (384,101) 75,967 -20% (708,332) Finance charges (22,041) (26,451) (26,451) (2,204) (13,226) (13,226) 0 0% (26,451) Transfers and Grants –
NET CASH FROM/(USED) OPERATING ACTIVITIES 26,955 143,364 143,364 31,485 138,213 38,261 99,952 261% 150,824
CASH FLOWS FROM INVESTING ACTIVITIESReceipts
Proceeds on disposal of PPE – 480 480 – – 300 (300) -100% 480 Decrease (Increase) in non-current debtors 50 – – – Decrease (increase) other non-current receivables – – – – Decrease (increase) in non-current investments 296,000 18,000 18,000 66,000 18,000 36,000 (18,000) -50% 120,000
PaymentsCapital assets (437,553) (208,480) (208,480) (17,521) (84,186) (83,602) 583 -1% (359,224)
NET CASH FROM/(USED) INVESTING ACTIVITIES (141,503) (190,000) (190,000) 48,479 (66,186) (47,302) 18,883 -40% (238,744)
CASH FLOWS FROM FINANCING ACTIVITIESReceipts
Short term loans – – Borrowing long term/refinancing 90,067 90,000 90,000 90,000 (90,000) -100% 90,000 Increase (decrease) in consumer deposits 6,000 2,919 2,919 318 3,071 1,467 1,604 109% 3,670
PaymentsRepayment of borrowing (23,716) (23,180) (23,180) (5,305) (11,483) (12,898) (1,415) 11% (23,716)
NET CASH FROM/(USED) FINANCING ACTIVITIES 72,350 69,739 69,739 (4,988) (8,412) 78,569 86,981 111% 69,954
NET INCREASE/ (DECREASE) IN CASH HELD (42,197) 23,103 23,103 74,976 63,616 69,527 (17,967) Cash/cash equivalents at beginning: 57,104 14,941 14,941 59,328 14,941 59,328 Cash/cash equivalents at month/year end: 14,907 38,045 38,045 74,976 122,944 84,469 41,362
Description Ref
MP313 Steve Tshwete - Table C7 Monthly Budget Statement - Cash Flow - Mid-Year Assessment
PART 2
MID YEAR BUDGET AND PERFORMANCE ASSESSMENT REPORT- SUPPORTING DOCUMENTATIONS
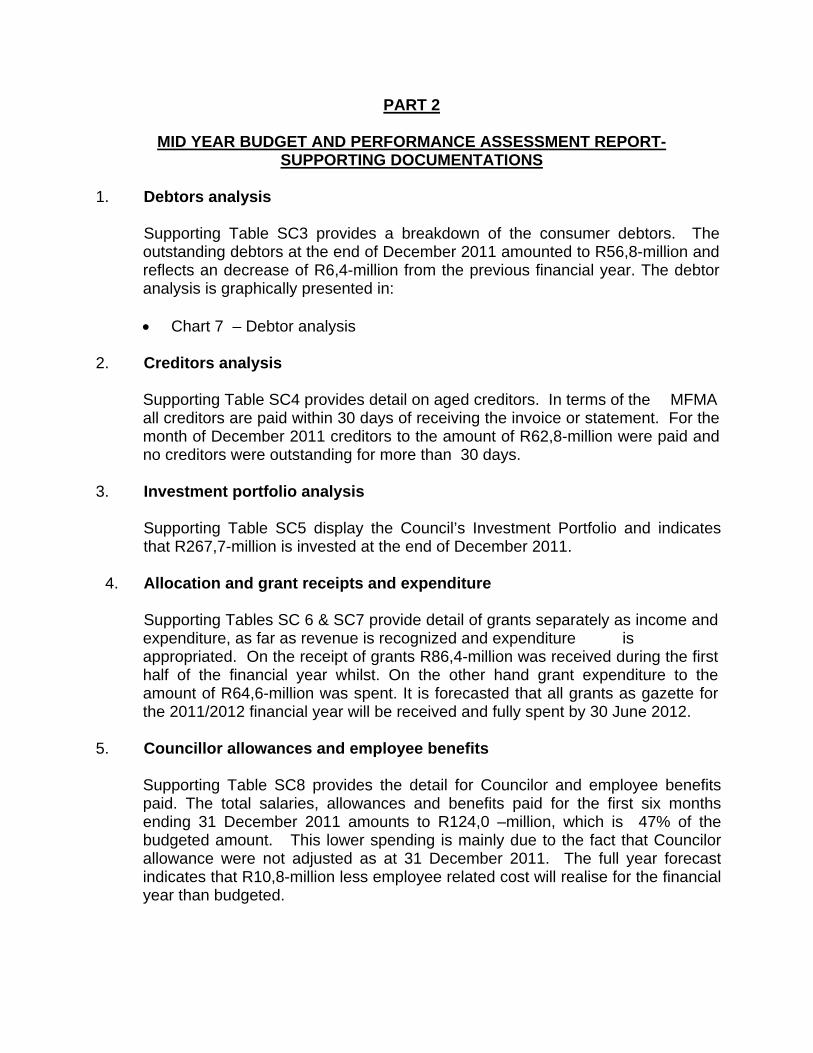
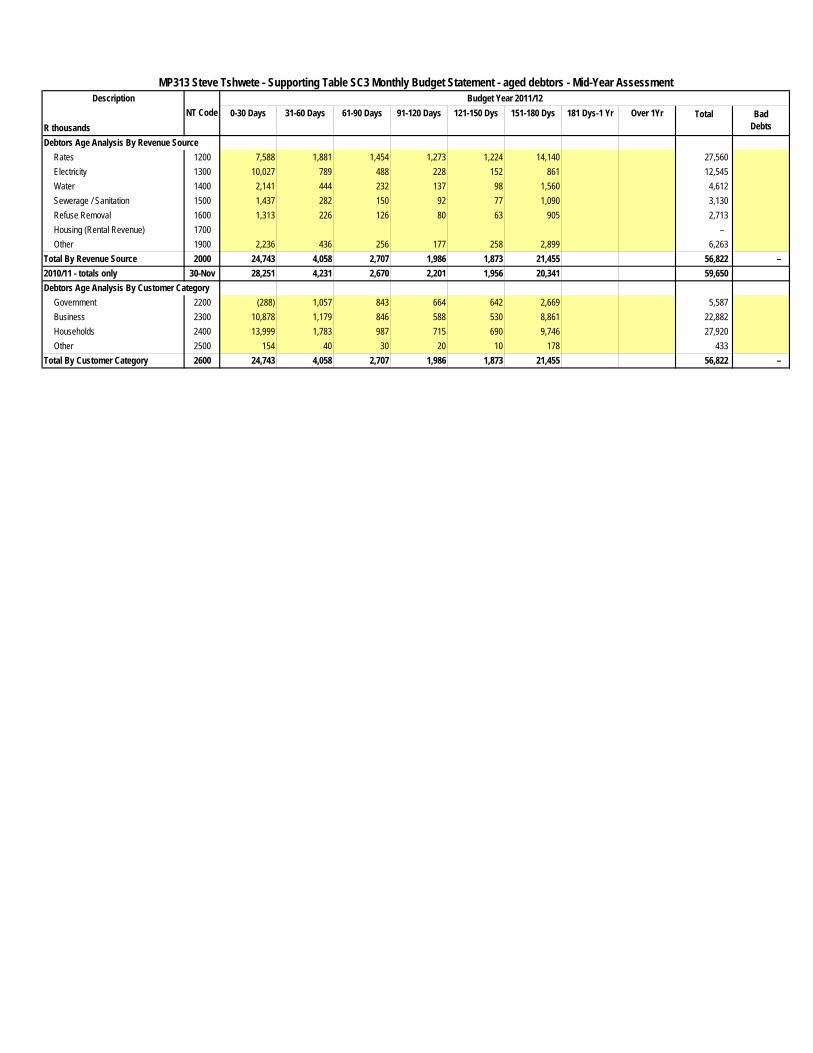
1. Debtors analysis
Supporting Table SC3 provides a breakdown of the consumer debtors. The outstanding debtors at the end of December 2011 amounted to R56,8-million and reflects an decrease of R6,4-million from the previous financial year. The debtor analysis is graphically presented in:
• Chart 7 – Debtor analysis
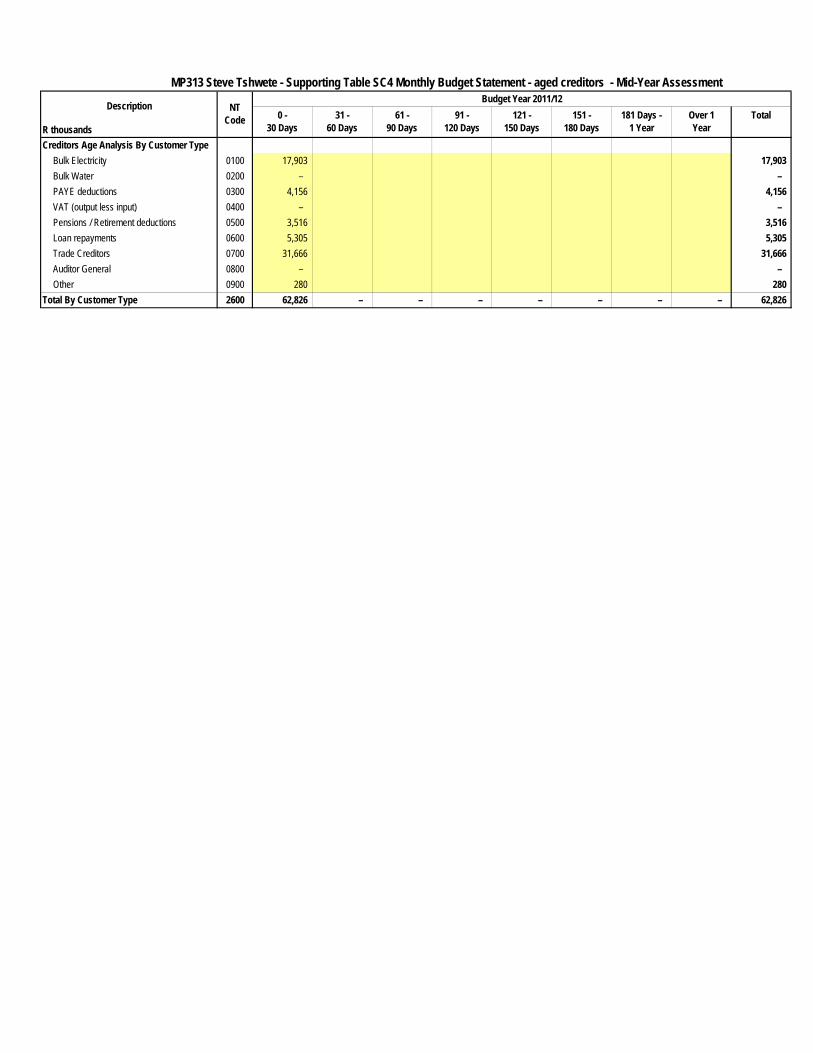
2. Creditors analysis
Supporting Table SC4 provides detail on aged creditors. In terms of the MFMA all creditors are paid within 30 days of receiving the invoice or statement. For the month of December 2011 creditors to the amount of R62,8-million were paid and no creditors were outstanding for more than 30 days.
3. Investment portfolio analysis
Supporting Table SC5 display the Council’s Investment Portfolio and indicates that R267,7-million is invested at the end of December 2011.
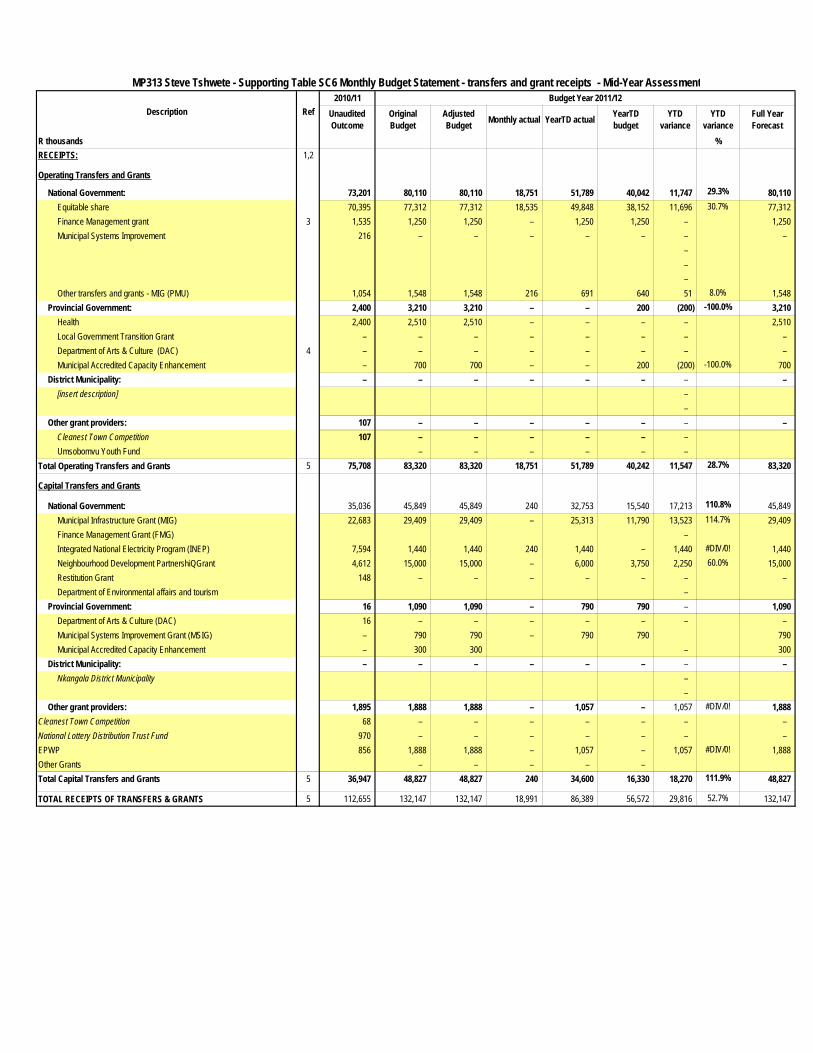
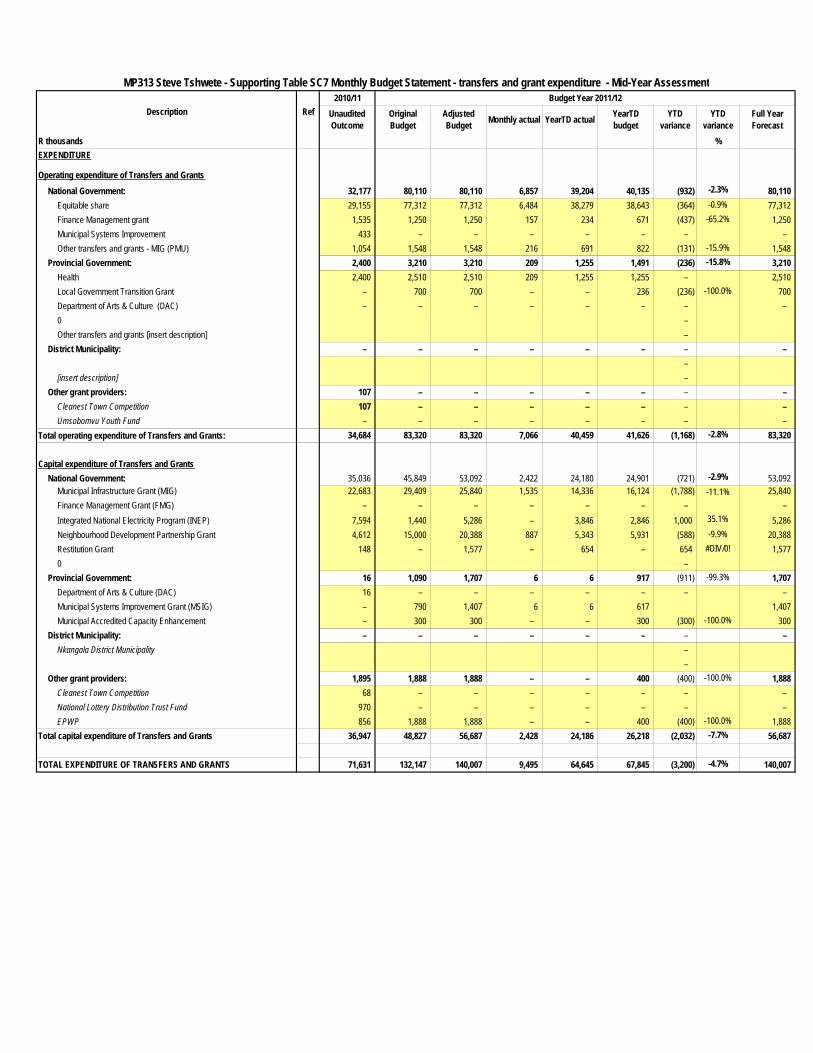
4. Allocation and grant receipts and expenditure
Supporting Tables SC 6 & SC7 provide detail of grants separately as income and expenditure, as far as revenue is recognized and expenditure is appropriated. On the receipt of grants R86,4-million was received during the first half of the financial year whilst. On the other hand grant expenditure to the amount of R64,6-million was spent. It is forecasted that all grants as gazette for the 2011/2012 financial year will be received and fully spent by 30 June 2012.
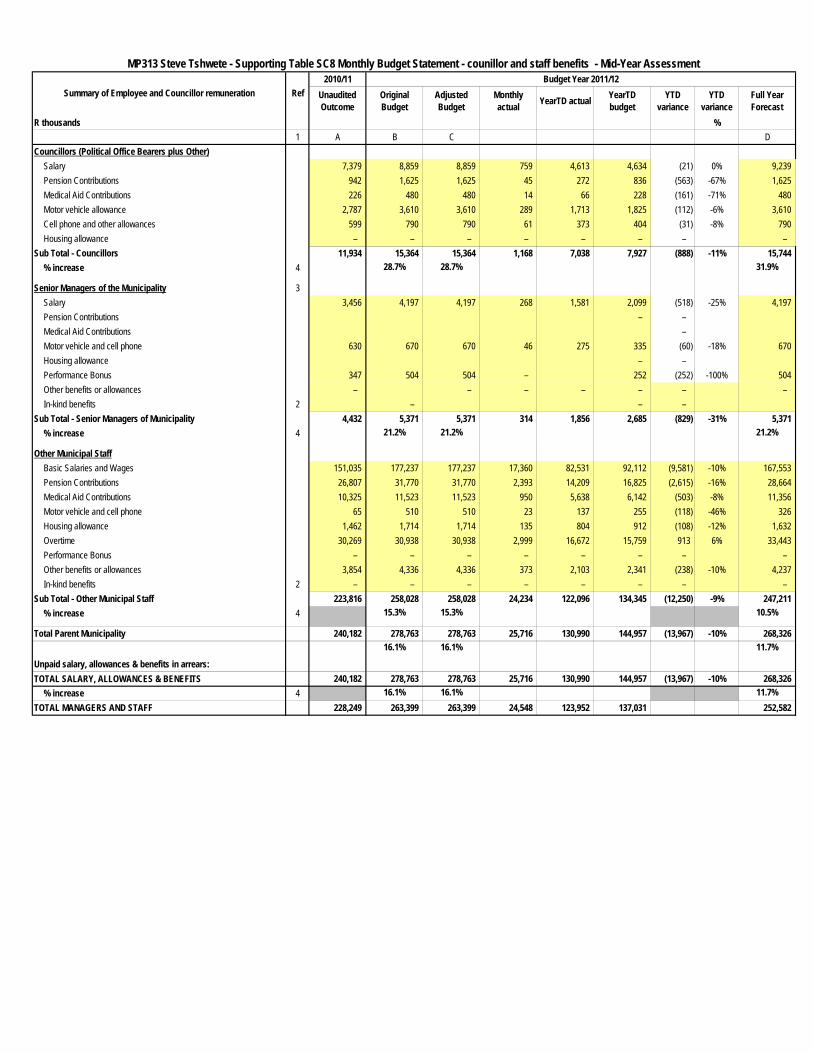
5. Councillor allowances and employee benefits
Supporting Table SC8 provides the detail for Councilor and employee benefits paid. The total salaries, allowances and benefits paid for the first six months ending 31 December 2011 amounts to R124,0 –million, which is 47% of the budgeted amount. This lower spending is mainly due to the fact that Councilor allowance were not adjusted as at 31 December 2011. The full year forecast indicates that R10,8-million less employee related cost will realise for the financial year than budgeted.
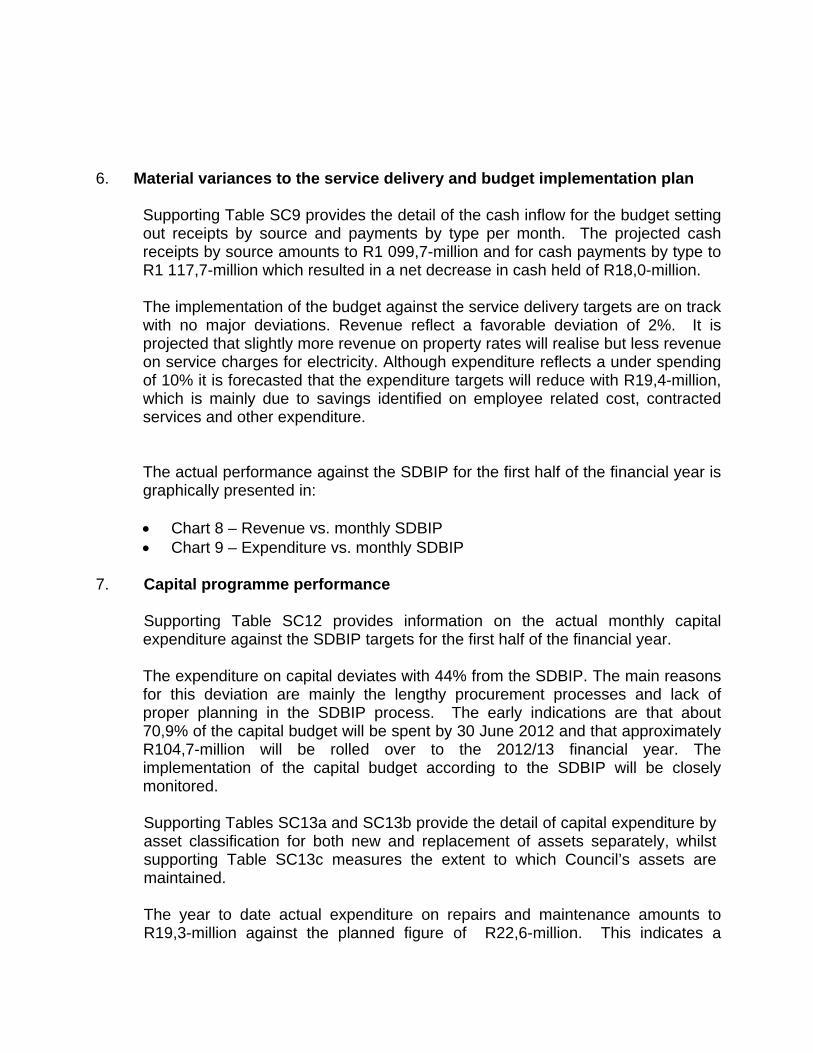
6. Material variances to the service delivery and budget implementation plan
Supporting Table SC9 provides the detail of the cash inflow for the budget setting out receipts by source and payments by type per month. The projected cash receipts by source amounts to R1 099,7-million and for cash payments by type to R1 117,7-million which resulted in a net decrease in cash held of R18,0-million. The implementation of the budget against the service delivery targets are on track with no major deviations. Revenue reflect a favorable deviation of 2%. It is projected that slightly more revenue on property rates will realise but less revenue on service charges for electricity. Although expenditure reflects a under spending of 10% it is forecasted that the expenditure targets will reduce with R19,4-million, which is mainly due to savings identified on employee related cost, contracted services and other expenditure.
The actual performance against the SDBIP for the first half of the financial year is graphically presented in:
• Chart 8 – Revenue vs. monthly SDBIP • Chart 9 – Expenditure vs. monthly SDBIP
7. Capital programme performance
Supporting Table SC12 provides information on the actual monthly capital expenditure against the SDBIP targets for the first half of the financial year. The expenditure on capital deviates with 44% from the SDBIP. The main reasons for this deviation are mainly the lengthy procurement processes and lack of proper planning in the SDBIP process. The early indications are that about 70,9% of the capital budget will be spent by 30 June 2012 and that approximately R104,7-million will be rolled over to the 2012/13 financial year. The implementation of the capital budget according to the SDBIP will be closely monitored. Supporting Tables SC13a and SC13b provide the detail of capital expenditure by asset classification for both new and replacement of assets separately, whilst supporting Table SC13c measures the extent to which Council’s assets are maintained.
The year to date actual expenditure on repairs and maintenance amounts to R19,3-million against the planned figure of R22,6-million. This indicates a
deviation in expenditure of R3,3-million on repairs and maintenance. The full year forecast amounts to R46,9-million which is R0,4-million less than the original budget. The actual performance on capital expenditure against the SDBIP is graphically presented in:
• Chart 10 – Capital expenditure vs. monthly SDBIP
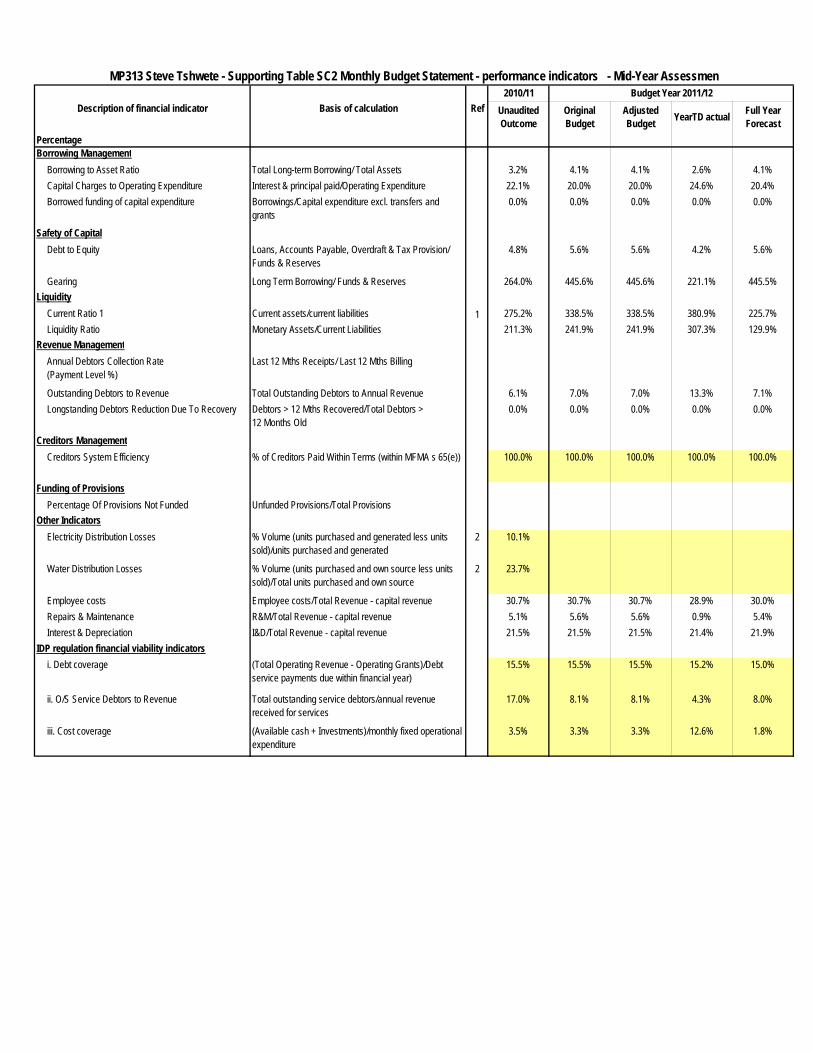
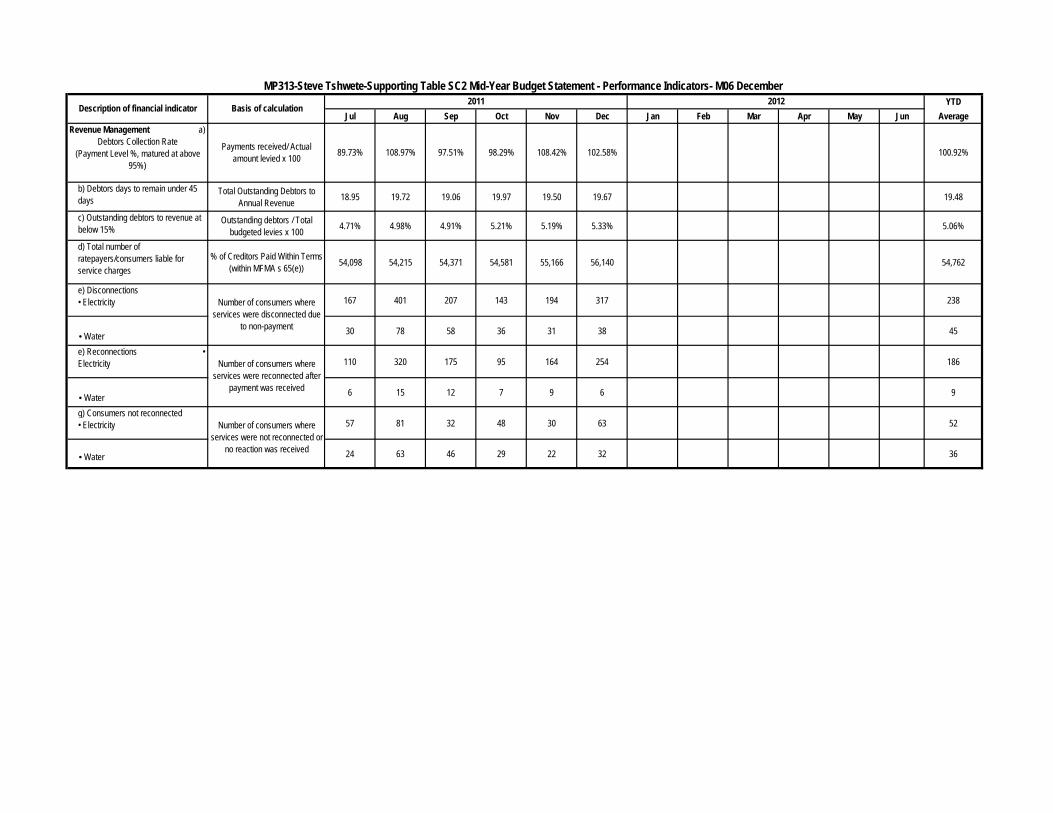
8. Performance indicators
Supporting table SC2 provides detail on the financial performance indicators. The average payment rate for the past financial year was 100,3% and for the current year to date amounts to 100,92%. The collection period remains healthy at 20 days with a debtors turnover rate of 51%. The financial performance indicators for the first six months are well within the targets.
9. Municipal Managers quality certification
QUALITY CERTIFICATE 31 DECEMBER 2011
I, WILHELM DIEDERICK FOUCHÉ, municipal manager of STEVE TSHWETE LOCAL MUNICIPALITY, hereby certify that the mid-year budget and performance assessment report for the first half of the financial year end of December 2011 has been prepared in accordance with the Municipal Finance Management Act and the regulations made under the Act.
W.D. FOUCHÉ MUNICIPAL MANAGER of STEVE TSHWETE LOCAL MUNICIPALITY MP313
SIGNATURE DATE 16 January 2012

Variance Reasons for material deviations Remedial or corrective steps/remarksR thousands
1 Revenue By SourceInterest earned- External Investment (10,500) The forecast for interest received is less due to less investments made and lower
interest rates.Other revenue (1,641) It is projected that the main services contributions will be less than originally budgeted
for.2 Expenditure By Type
Contracted services (3,377) The projected expenditure for security services and cleaning services are less than originally planned for.
Other expenditure (9,582) The largest contributing factors to this deviations are legal fees, skills development training, consulting fees, Eskom connection fees for maximum demand, which did not realised as planned.
3 Capital ExpenditureCorporate Services (2,596) The following projects are possible roll-overs:
P 0900166 - Self services terminals for vending and account payments R596 000P 1100194 - Extension of Civic Centre R1 500 000P 1100234 - Upgrade Access control at Civic Centre R500 000.
Public safety (825) The following projects are possible roll-overs: P 0007474 - 227 Stands Aerorand Streetlights R825 000
Health (722) The following projects are possible roll-overs:P 1000231 - Extension of waiting room at Nasaret clinc R721 900
Planning & Development (1,253) The following projects are possible roll-overs:P 1000245 - Township Development- New developments R 1253 000
Road Transport (5,500) The following projects are possible roll-overs:P 0008140 - Stormwater Villages R1 000 000P 0008181 - Roads new - Industrial area ext 11 R3 000 000P 1000076 - Stormwater Middelburg R1 500 000
Electricity (24,732) The following projects are possible roll-overs:P 0000111 - Sipress supply area R1 499 984P 0000162 - Provision elect Rockdale (500 stands) R2 364 984P 0008077 - Install ring main units R911 000P 0008080 - HT Links R2 000 000P 0008174 - Aerorand electrification R3 683 500P 0008176 - Extension 11: Industrial erf connections and mini sub R1 150 000P 0008206 - Replace mini sub stations R1 800 000P 0900192 - RTU replacements R450 000P 0900237 - Nasaret new substation R6 732 090P 1000309 - Lang supply area R2 000 000P 1200094 - 88kv Cable R1 500 000P 1200095 - Banquet hall - Medium firm supply R640 000
Water (350) The following projects are possible roll-overs: P 1100155 - Construction of sludge dams R350 000Waste Water Management (62,289) The following projects are possible roll-overs:
P 1000260 - Sanitation Mafube Village R1 388 700P 1200064 - Sanitation Mafube Village R900 000P 0900244 - Upgrade Boskrans sewer plant R60 000 000
Waste management (445) The following projects are possible roll-overs:P 0007168 - Develop further phases of landfill site R445 000
Ref Description
MP313 Steve Tshwete - Supporting Table SC1 Material variance explanations - Mid-Year Assessment
2010/11 Budget Year 2011/12Unaudited Outcome
Original Budget
Adjusted Budget YearTD actual Full Year
ForecastPercentageBorrowing Management
Borrowing to Asset Ratio Total Long-term Borrowing/ Total Assets 3.2% 4.1% 4.1% 2.6% 4.1%Capital Charges to Operating Expenditure Interest & principal paid/Operating Expenditure 22.1% 20.0% 20.0% 24.6% 20.4%Borrowed funding of capital expenditure Borrowings/Capital expenditure excl. transfers and
grants0.0% 0.0% 0.0% 0.0% 0.0%
Safety of CapitalDebt to Equity Loans, Accounts Payable, Overdraft & Tax Provision/
Funds & Reserves4.8% 5.6% 5.6% 4.2% 5.6%
Gearing Long Term Borrowing/ Funds & Reserves 264.0% 445.6% 445.6% 221.1% 445.5%Liquidity
Current Ratio 1 Current assets/current liabilities 1 275.2% 338.5% 338.5% 380.9% 225.7%Liquidity Ratio Monetary Assets/Current Liabilities 211.3% 241.9% 241.9% 307.3% 129.9%
Revenue ManagementAnnual Debtors Collection Rate (Payment Level %)
Last 12 Mths Receipts/ Last 12 Mths Billing
Outstanding Debtors to Revenue Total Outstanding Debtors to Annual Revenue 6.1% 7.0% 7.0% 13.3% 7.1%Longstanding Debtors Reduction Due To Recovery Debtors > 12 Mths Recovered/Total Debtors >
12 Months Old0.0% 0.0% 0.0% 0.0% 0.0%
Creditors ManagementCreditors System Efficiency % of Creditors Paid Within Terms (within MFMA s 65(e)) 100.0% 100.0% 100.0% 100.0% 100.0%
Funding of ProvisionsPercentage Of Provisions Not Funded Unfunded Provisions/Total Provisions
Other IndicatorsElectricity Distribution Losses % Volume (units purchased and generated less units
sold)/units purchased and generated2 10.1%
Water Distribution Losses % Volume (units purchased and own source less units sold)/Total units purchased and own source
2 23.7%
Employee costs Employee costs/Total Revenue - capital revenue 30.7% 30.7% 30.7% 28.9% 30.0%Repairs & Maintenance R&M/Total Revenue - capital revenue 5.1% 5.6% 5.6% 0.9% 5.4%Interest & Depreciation I&D/Total Revenue - capital revenue 21.5% 21.5% 21.5% 21.4% 21.9%
IDP regulation financial viability indicatorsi. Debt coverage (Total Operating Revenue - Operating Grants)/Debt
service payments due within financial year)15.5% 15.5% 15.5% 15.2% 15.0%
ii. O/S Service Debtors to Revenue Total outstanding service debtors/annual revenue received for services
17.0% 8.1% 8.1% 4.3% 8.0%
iii. Cost coverage (Available cash + Investments)/monthly fixed operational expenditure
3.5% 3.3% 3.3% 12.6% 1.8%
Description of financial indicator Basis of calculation Ref
MP313 Steve Tshwete - Supporting Table SC2 Monthly Budget Statement - performance indicators - Mid-Year Assessment
YTDJul Aug Sep Oct Nov Dec Jan Feb Mar Apr May Jun Average
b) Debtors days to remain under 45 days
Total Outstanding Debtors to Annual Revenue 18.95 19.72 19.06 19.97 19.50 19.67 19.48
c) Outstanding debtors to revenue at below 15%
Outstanding debtors / Total budgeted levies x 100 4.71% 4.98% 4.91% 5.21% 5.19% 5.33% 5.06%
d) Total number of ratepayers/consumers liable for service charges
% of Creditors Paid Within Terms (within MFMA s 65(e)) 54,098 54,215 54,371 54,581 55,166 56,140 54,762
e) Disconnections • Electricity 167 401 207 143 194 317 238
• Water 30 78 58 36 31 38 45
e) Reconnections • Electricity 110 320 175 95 164 254 186
• Water 6 15 12 7 9 6 9
g) Consumers not reconnected • Electricity 57 81 32 48 30 63 52
• Water 24 63 46 29 22 32 36
100.92%
Number of consumers where services were not reconnected or
no reaction was received
Revenue Management a) Debtors Collection Rate
(Payment Level %, matured at above 95%)
Payments received/ Actual amount levied x 100 89.73%
Number of consumers where services were disconnected due
to non-payment
Number of consumers where services were reconnected after
payment was received
MP313-Steve Tshwete-Supporting Table SC2 Mid-Year Budget Statement - Performance Indicators- M06 December
Description of financial indicator Basis of calculation2011 2012
108.97% 97.51% 98.29% 108.42% 102.58%
Description Budget Year 2011/120-30 Days 31-60 Days 61-90 Days 91-120 Days 121-150 Dys 151-180 Dys 181 Dys-1 Yr Over 1Yr
R thousandsDebtors Age Analysis By Revenue Source
Rates 1200 7,588 1,881 1,454 1,273 1,224 14,140 27,560 Electricity 1300 10,027 789 488 228 152 861 12,545 Water 1400 2,141 444 232 137 98 1,560 4,612 Sewerage / Sanitation 1500 1,437 282 150 92 77 1,090 3,130 Refuse Removal 1600 1,313 226 126 80 63 905 2,713 Housing (Rental Revenue) 1700 – Other 1900 2,236 436 256 177 258 2,899 6,263
Total By Revenue Source 2000 24,743 4,058 2,707 1,986 1,873 21,455 56,822 – 2010/11 - totals only 30-Nov 28,251 4,231 2,670 2,201 1,956 20,341 59,650 Debtors Age Analysis By Customer Category
Government 2200 (288) 1,057 843 664 642 2,669 5,587 Business 2300 10,878 1,179 846 588 530 8,861 22,882 Households 2400 13,999 1,783 987 715 690 9,746 27,920 Other 2500 154 40 30 20 10 178 433
Total By Customer Category 2600 24,743 4,058 2,707 1,986 1,873 21,455 56,822 –
MP313 Steve Tshwete - Supporting Table SC3 Monthly Budget Statement - aged debtors - Mid-Year Assessment
Bad Debts
NT Code Total

CHART 7
30 DAYS 60 DAYS 90 DAYS 120 DAYS 150 DAYS 150+ DAYS
30-Jun-11 35,644,336 3,139,005 1,766,434 1,266,785 1,183,298 19,478,482 31-Dec-11 24,742,522 4,058,331 2,706,836 1,986,243 1,872,833 21,455,224
-
3,000,000
6,000,000
9,000,000
12,000,000
15,000,000
18,000,000
21,000,000
24,000,000
27,000,000
30,000,000
33,000,000
36,000,000
39,000,000
42,000,000
CONSUMER DEBTORS 31 December 2011
JUN 2011: R62 478 339
DEC 2011: R56 821 990
Budget Year 2011/12
R thousandsCreditors Age Analysis By Customer Type
Bulk Electricity 0100 17,903 17,903 Bulk Water 0200 – – PAYE deductions 0300 4,156 4,156 VAT (output less input) 0400 – – Pensions / Retirement deductions 0500 3,516 3,516 Loan repayments 0600 5,305 5,305 Trade Creditors 0700 31,666 31,666 Auditor General 0800 – – Other 0900 280 280
Total By Customer Type 2600 62,826 – – – – – – – 62,826
121 - 150 Days
151 - 180 Days
Description
MP313 Steve Tshwete - Supporting Table SC4 Monthly Budget Statement - aged creditors - Mid-Year Assessment
NT Code 0 -
30 Days31 -
60 Days181 Days -
1 YearOver 1Year
Total61 - 90 Days
91 - 120 Days
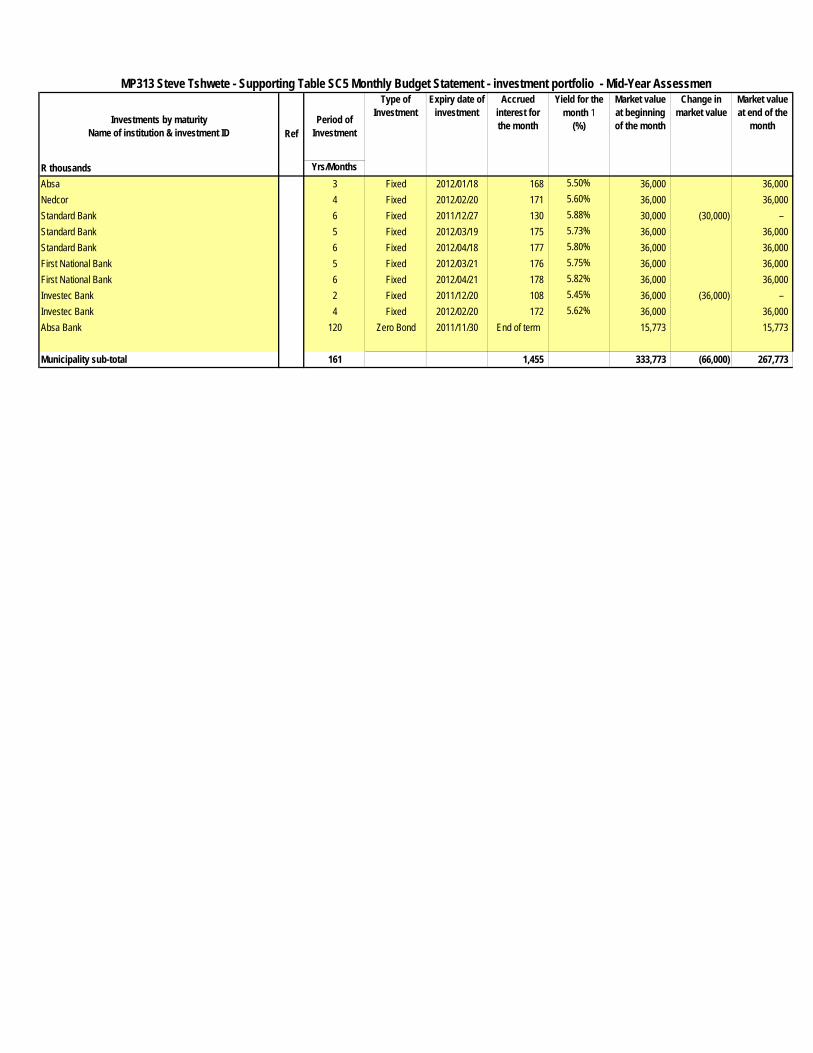
Investments by maturityName of institution & investment ID
Period of Investment
R thousands Yrs/MonthsAbsa 3 Fixed 2012/01/18 168 5.50% 36,000 36,000 Nedcor 4 Fixed 2012/02/20 171 5.60% 36,000 36,000 Standard Bank 6 Fixed 2011/12/27 130 5.88% 30,000 (30,000) – Standard Bank 5 Fixed 2012/03/19 175 5.73% 36,000 36,000 Standard Bank 6 Fixed 2012/04/18 177 5.80% 36,000 36,000 First National Bank 5 Fixed 2012/03/21 176 5.75% 36,000 36,000 First National Bank 6 Fixed 2012/04/21 178 5.82% 36,000 36,000 Investec Bank 2 Fixed 2011/12/20 108 5.45% 36,000 (36,000) – Investec Bank 4 Fixed 2012/02/20 172 5.62% 36,000 36,000 Absa Bank 120 Zero Bond 2011/11/30 End of term 15,773 15,773
Municipality sub-total 161 1,455 333,773 (66,000) 267,773
MP313 Steve Tshwete - Supporting Table SC5 Monthly Budget Statement - investment portfolio - Mid-Year Assessment
Ref
Type of Investment
Expiry date of investment
Market value at end of the
month
Accrued interest for the month
Yield for the month 1
(%)
Market value at beginning of the month
Change in market value
2010/11 Budget Year 2011/12Unaudited Outcome
Original Budget
Adjusted Budget Monthly actual YearTD actual YearTD
budgetYTD
varianceYTD
varianceFull Year Forecast
R thousands %RECEIPTS: 1,2
Operating Transfers and Grants
National Government: 73,201 80,110 80,110 18,751 51,789 40,042 11,747 29.3% 80,110 Equitable share 70,395 77,312 77,312 18,535 49,848 38,152 11,696 30.7% 77,312 Finance Management grant 3 1,535 1,250 1,250 – 1,250 1,250 – 1,250 Municipal Systems Improvement 216 – – – – – – –
– – –
Other transfers and grants - MIG (PMU) 1,054 1,548 1,548 216 691 640 51 8.0% 1,548 Provincial Government: 2,400 3,210 3,210 – – 200 (200) -100.0% 3,210
Health 2,400 2,510 2,510 – – – – 2,510 Local Government Transition Grant – – – – – – – – Department of Arts & Culture (DAC) 4 – – – – – – – – Municipal Accredited Capacity Enhancement – 700 700 – – 200 (200) -100.0% 700
District Municipality: – – – – – – – – [insert description] –
– Other grant providers: 107 – – – – – – –
Cleanest Town Competition 107 – – – – – – Umsobomvu Youth Fund – – – – – –
Total Operating Transfers and Grants 5 75,708 83,320 83,320 18,751 51,789 40,242 11,547 28.7% 83,320
Capital Transfers and Grants
National Government: 35,036 45,849 45,849 240 32,753 15,540 17,213 110.8% 45,849 Municipal Infrastructure Grant (MIG) 22,683 29,409 29,409 – 25,313 11,790 13,523 114.7% 29,409 Finance Management Grant (FMG) – Integrated National Electricity Program (INEP) 7,594 1,440 1,440 240 1,440 – 1,440 #DIV/0! 1,440 Neighbourhood Development PartnershiQGrant 4,612 15,000 15,000 – 6,000 3,750 2,250 60.0% 15,000 Restitution Grant 148 – – – – – – – Department of Environmental affairs and tourism –
Provincial Government: 16 1,090 1,090 – 790 790 – 1,090 Department of Arts & Culture (DAC) 16 – – – – – – – Municipal Systems Improvement Grant (MSIG) – 790 790 – 790 790 790 Municipal Accredited Capacity Enhancement – 300 300 – 300
District Municipality: – – – – – – – – Nkangala District Municipality –
– Other grant providers: 1,895 1,888 1,888 – 1,057 – 1,057 #DIV/0! 1,888
Cleanest Town Competition 68 – – – – – – – National Lottery Distribution Trust Fund 970 – – – – – – – EPWP 856 1,888 1,888 – 1,057 – 1,057 #DIV/0! 1,888 Other Grants – – – – – Total Capital Transfers and Grants 5 36,947 48,827 48,827 240 34,600 16,330 18,270 111.9% 48,827
TOTAL RECEIPTS OF TRANSFERS & GRANTS 5 112,655 132,147 132,147 18,991 86,389 56,572 29,816 52.7% 132,147
Description Ref
MP313 Steve Tshwete - Supporting Table SC6 Monthly Budget Statement - transfers and grant receipts - Mid-Year Assessment
2010/11 Budget Year 2011/12Unaudited Outcome
Original Budget
Adjusted Budget Monthly actual YearTD actual YearTD
budgetYTD
varianceYTD
varianceFull Year Forecast
R thousands %EXPENDITURE
Operating expenditure of Transfers and GrantsNational Government: 32,177 80,110 80,110 6,857 39,204 40,135 (932) -2.3% 80,110
Equitable share 29,155 77,312 77,312 6,484 38,279 38,643 (364) -0.9% 77,312 Finance Management grant 1,535 1,250 1,250 157 234 671 (437) -65.2% 1,250 Municipal Systems Improvement 433 – – – – – – – Other transfers and grants - MIG (PMU) 1,054 1,548 1,548 216 691 822 (131) -15.9% 1,548
Provincial Government: 2,400 3,210 3,210 209 1,255 1,491 (236) -15.8% 3,210 Health 2,400 2,510 2,510 209 1,255 1,255 – 2,510 Local Government Transition Grant – 700 700 – – 236 (236) -100.0% 700 Department of Arts & Culture (DAC) – – – – – – – – 0 – Other transfers and grants [insert description] –
District Municipality: – – – – – – – – –
[insert description] – Other grant providers: 107 – – – – – – –
Cleanest Town Competition 107 – – – – – – – Umsobomvu Youth Fund – – – – – – – –
Total operating expenditure of Transfers and Grants: 34,684 83,320 83,320 7,066 40,459 41,626 (1,168) -2.8% 83,320
Capital expenditure of Transfers and GrantsNational Government: 35,036 45,849 53,092 2,422 24,180 24,901 (721) -2.9% 53,092
Municipal Infrastructure Grant (MIG) 22,683 29,409 25,840 1,535 14,336 16,124 (1,788) -11.1% 25,840 Finance Management Grant (FMG) – – – – – – – – Integrated National Electricity Program (INEP) 7,594 1,440 5,286 – 3,846 2,846 1,000 35.1% 5,286 Neighbourhood Development Partnership Grant 4,612 15,000 20,388 887 5,343 5,931 (588) -9.9% 20,388 Restitution Grant 148 – 1,577 – 654 – 654 #DIV/0! 1,577 0 –
Provincial Government: 16 1,090 1,707 6 6 917 (911) -99.3% 1,707 Department of Arts & Culture (DAC) 16 – – – – – – – Municipal Systems Improvement Grant (MSIG) – 790 1,407 6 6 617 1,407 Municipal Accredited Capacity Enhancement – 300 300 – – 300 (300) -100.0% 300
District Municipality: – – – – – – – – Nkangala District Municipality –
– Other grant providers: 1,895 1,888 1,888 – – 400 (400) -100.0% 1,888
Cleanest Town Competition 68 – – – – – – – National Lottery Distribution Trust Fund 970 – – – – – – – EPWP 856 1,888 1,888 – – 400 (400) -100.0% 1,888
Total capital expenditure of Transfers and Grants 36,947 48,827 56,687 2,428 24,186 26,218 (2,032) -7.7% 56,687
TOTAL EXPENDITURE OF TRANSFERS AND GRANTS 71,631 132,147 140,007 9,495 64,645 67,845 (3,200) -4.7% 140,007
Description Ref
MP313 Steve Tshwete - Supporting Table SC7 Monthly Budget Statement - transfers and grant expenditure - Mid-Year Assessment
2010/11 Budget Year 2011/12Unaudited Outcome
Original Budget
Adjusted Budget
Monthly actual YearTD actual YearTD
budgetYTD
varianceYTD
varianceFull Year Forecast
R thousands %1 A B C D
Councillors (Political Office Bearers plus Other)Salary 7,379 8,859 8,859 759 4,613 4,634 (21) 0% 9,239 Pension Contributions 942 1,625 1,625 45 272 836 (563) -67% 1,625 Medical Aid Contributions 226 480 480 14 66 228 (161) -71% 480 Motor vehicle allowance 2,787 3,610 3,610 289 1,713 1,825 (112) -6% 3,610 Cell phone and other allowances 599 790 790 61 373 404 (31) -8% 790 Housing allowance – – – – – – – –
Sub Total - Councillors 11,934 15,364 15,364 1,168 7,038 7,927 (888) -11% 15,744 % increase 4 28.7% 28.7% 31.9%
Senior Managers of the Municipality 3Salary 3,456 4,197 4,197 268 1,581 2,099 (518) -25% 4,197 Pension Contributions – – Medical Aid Contributions – Motor vehicle and cell phone 630 670 670 46 275 335 (60) -18% 670 Housing allowance – – Performance Bonus 347 504 504 – 252 (252) -100% 504 Other benefits or allowances – – – – – – – In-kind benefits 2 – – –
Sub Total - Senior Managers of Municipality 4,432 5,371 5,371 314 1,856 2,685 (829) -31% 5,371 % increase 4 21.2% 21.2% 21.2%
Other Municipal StaffBasic Salaries and Wages 151,035 177,237 177,237 17,360 82,531 92,112 (9,581) -10% 167,553 Pension Contributions 26,807 31,770 31,770 2,393 14,209 16,825 (2,615) -16% 28,664 Medical Aid Contributions 10,325 11,523 11,523 950 5,638 6,142 (503) -8% 11,356 Motor vehicle and cell phone 65 510 510 23 137 255 (118) -46% 326 Housing allowance 1,462 1,714 1,714 135 804 912 (108) -12% 1,632 Overtime 30,269 30,938 30,938 2,999 16,672 15,759 913 6% 33,443 Performance Bonus – – – – – – – – Other benefits or allowances 3,854 4,336 4,336 373 2,103 2,341 (238) -10% 4,237 In-kind benefits 2 – – – – – – – –
Sub Total - Other Municipal Staff 223,816 258,028 258,028 24,234 122,096 134,345 (12,250) -9% 247,211 % increase 4 15.3% 15.3% 10.5%
Total Parent Municipality 240,182 278,763 278,763 25,716 130,990 144,957 (13,967) -10% 268,326 16.1% 16.1% 11.7%
Unpaid salary, allowances & benefits in arrears:TOTAL SALARY, ALLOWANCES & BENEFITS 240,182 278,763 278,763 25,716 130,990 144,957 (13,967) -10% 268,326
% increase 4 16.1% 16.1% 11.7%TOTAL MANAGERS AND STAFF 228,249 263,399 263,399 24,548 123,952 137,031 252,582
Summary of Employee and Councillor remuneration Ref
MP313 Steve Tshwete - Supporting Table SC8 Monthly Budget Statement - counillor and staff benefits - Mid-Year Assessment

July August Sept October Nov Dec January Feb March April May JuneR thousands 1 Outcome Outcome Outcome Outcome Outcome Outcome Forecast Forecast Forecast Forecast Forecast ForecastCash Receipts By Source
Property rates 16,315 16,334 16,366 16,375 16,395 16,468 16,317 16,317 16,317 16,317 16,317 17,311 197,150 213,089 231,628Property rates - penalties & collection charges – Service charges - electricity revenue 25,183 33,113 29,931 27,753 27,946 29,177 26,651 25,651 26,651 27,651 27,651 28,245 335,603 395,260 465,431Service charges - water revenue 3,687 4,354 4,885 4,833 5,656 3,834 3,821 3,819 3,824 3,512 3,602 3,627 49,456 56,433 63,585Service charges - sanitation revenue 3,694 3,750 3,751 3,753 3,913 3,574 3,741 3,741 3,741 3,741 3,741 3,881 45,019 53,529 62,819Service charges - refuse 3,599 3,584 3,600 3,588 3,606 3,629 3,498 3,498 3,498 3,498 3,498 3,691 42,789 46,120 50,917Service charges - other – Rental of facilities and equipment 1,120 940 1,018 1,045 1,156 1,044 1,065 1,063 1,073 1,072 1,046 1,186 12,828 13,496 14,251Interest earned - external investments 2,371 2,476 1,907 2,513 (3,829) 630 1,677 1,770 1,703 1,859 2,006 2,158 17,240 26,759 27,232Interest earned - outstanding debtors 139 170 142 145 138 149 159 129 141 141 150 133 1,736 1,754 1,771Dividends received – Fines 724 497 288 576 589 457 367 364 367 328 299 284 5,140 5,356 5,574Licences and permits 490 530 397 639 556 428 381 378 370 361 357 360 5,247 5,503 5,783Agency services 740 737 824 718 943 627 582 568 574 503 888 7,704 7,781 7,859Transfer receipts - operating 31,371 1,306 64 77 220 18,751 616 853 19,146 190 210 10,516 83,320 92,872 98,608Other revenue 21,968 17,361 6,613 62,147 24,403 38,509 1,556 948 994 668 884 (142,503) 33,548 46,379 80,296
Cash Receipts by Source 110,660 85,153 69,701 124,268 81,469 117,592 60,476 59,113 78,393 59,911 60,264 (70,221) 836,780 964,332 1,115,754 Other Cash Flows by Source
Transfer receipts - capital 4,466 4,312 7,647 504 3,959 1,775 4,080 5,630 4,900 6,010 2,150 3,394 48,827 55,758 67,725Contributions & Contributed assets – Proceeds on disposal of PPE 80 400 480 482 484Short term loans – Borrowing long term/refinancing 90,000 90,000 80,910 98,750Increase in consumer deposits 501 643 423 771 415 318 47 25 163 122 120 122 3,670 3,270 3,300Receipt of non-current debtors – Receipt of non-current receivables – Change in non-current investments 72,000 102,000 36,000 (258,000) 66,000 9,000 (9,000) 102,000 120,000 (36,000) (63,000)
Total Cash Receipts by Source 187,628 192,108 113,770 (132,457) 85,843 185,685 64,603 73,768 74,456 66,124 62,534 125,695 1,099,758 1,068,752 1,223,014 Cash Payments by Type –
Employee related costs 18,518 18,590 21,086 20,514 20,467 24,502 21,328 21,124 20,971 22,520 20,854 20,654 251,128 281,742 304,737Remuneration of councillors 1,175 1,159 1,171 1,168 1,197 1,168 1,307 1,328 1,377 1,498 1,574 1,622 15,744 16,593 17,920Interest paid 2,204 2,204 2,204 2,204 2,204 2,204 2,204 2,204 2,204 2,204 2,204 2,204 26,451 32,197 40,021Bulk purchases - Electricity 30,495 31,956 19,382 15,732 15,692 1,790 23,607 14,790 16,615 18,378 20,388 22,867 231,692 277,170 331,457Bulk purchases - Water & Sewer 229 132 1,290 465 466 1,037 942 936 989 989 1,517 8,992 10,172 10,717Other materials – Contracted services 849 1,117 1,196 1,523 1,599 1,553 1,866 1,827 1,834 1,865 1,860 1,703 18,791 23,632 26,273Grants and subsidies paid - other municipalities – Grants and subsidies paid - other 3,320 3,419 3,979 3,493 3,636 3,650 3,831 3,772 3,711 3,964 3,692 4,107 44,573 49,312 52,861General expenses 5,060 9,529 5,872 7,314 6,664 5,610 10,650 12,981 16,532 19,329 18,968 18,903 137,412 152,593 160,216
Cash Payments by Type 61,621 68,203 55,022 53,238 51,924 40,944 65,831 58,968 64,180 70,748 70,528 73,577 734,783 843,412 944,203 Other Cash Flows/Payments by Type
Capital assets 1,483 10,922 21,014 14,160 19,087 17,521 16,519 17,206 18,508 18,161 19,771 184,873 359,224 212,992 257,180Repayment of borrowing 1,649 4,528 5,305 1,738 10,496 23,716 20,715,649.00 22,792Other Cash Flows/Payments 28,925 17,589 22,777 18,150 7,962 46,939 (142,342)
Total Cash Payments by Type 92,029 96,714 100,461 85,547 83,501 110,709 82,350 76,175 84,425 88,909 90,299 126,604 1,117,724 1,077,120 1,224,175 NET INCREASE/(DECREASE) IN CASH HELD 95,598 95,394 13,309 (218,004) 2,342 74,976 (17,747) (2,407) (9,969) (22,785) (27,766) (910) (17,967) (8,368) (1,162)
Cash/cash equivalents at the month/year beginning: 59,328 154,927 250,321 263,630 45,626 47,968 122,944 105,197 102,791 92,822 70,037 42,271 59,328 41,362 32,993Cash/cash equivalents at the month/year end: 154,927 250,321 263,630 45,626 47,968 122,944 105,197 102,791 92,822 70,037 42,271 41,362 41,362 32,993 31,832
MP313 Steve Tshwete - Supporting Table SC9 Monthly Budget Statement - actuals and revised targets for cash receipts - Mid-Year Assessment
Budget Year +1 2012/13
Budget Year +2 2013/14
DescriptionBudget Year
2011/12
RefBudget Year 2011/12 2011/12 Medium Term Revenue & Expenditure
Framework
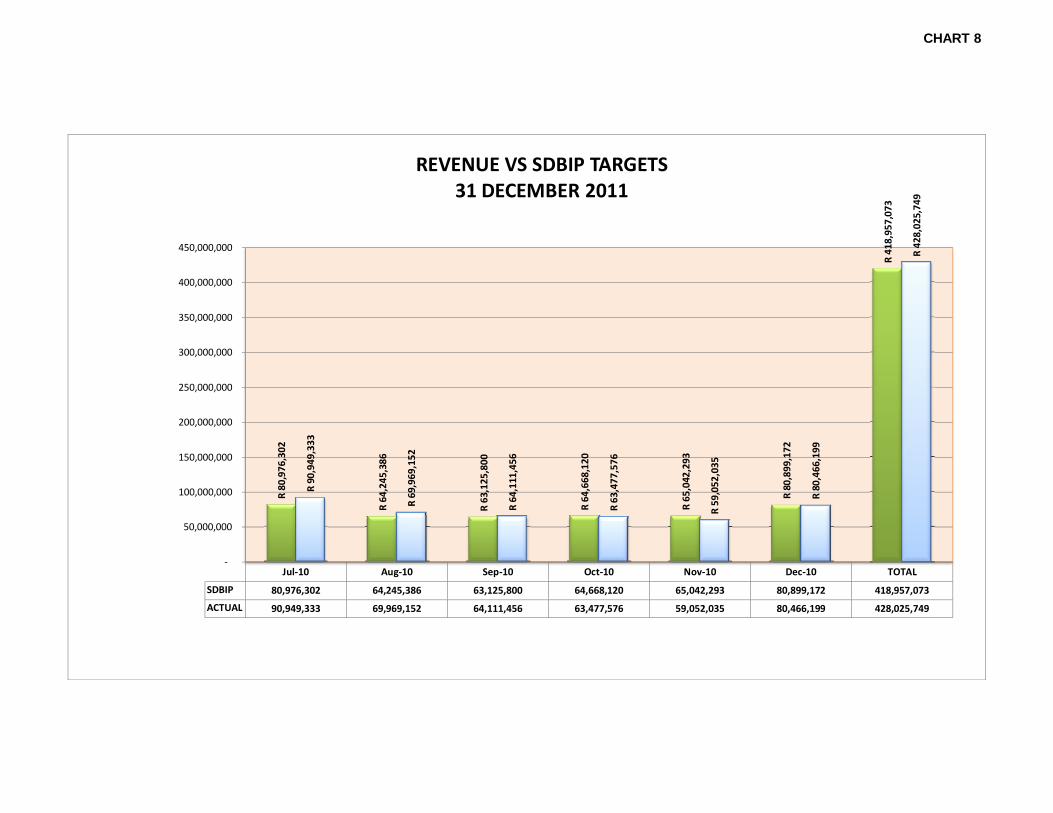
CHART 8
Jul‐10 Aug‐10 Sep‐10 Oct‐10 Nov‐10 Dec‐10 TOTAL
SDBIP 80,976,302 64,245,386 63,125,800 64,668,120 65,042,293 80,899,172 418,957,073
ACTUAL 90,949,333 69,969,152 64,111,456 63,477,576 59,052,035 80,466,199 428,025,749
R 80,976,302
R 64,245,386
R 63,125,800
R 64,668,120
R 65,042,293
R 80,899,172
R 418,957,073
R 90,949,333
R 69,969,152
R 64,111,456
R 63,477,576
R 59,052,035
R 80,466,199
R 428,025,749
‐
50,000,000
100,000,000
150,000,000
200,000,000
250,000,000
300,000,000
350,000,000
400,000,000
450,000,000
REVENUE VS SDBIP TARGETS 31 DECEMBER 2011
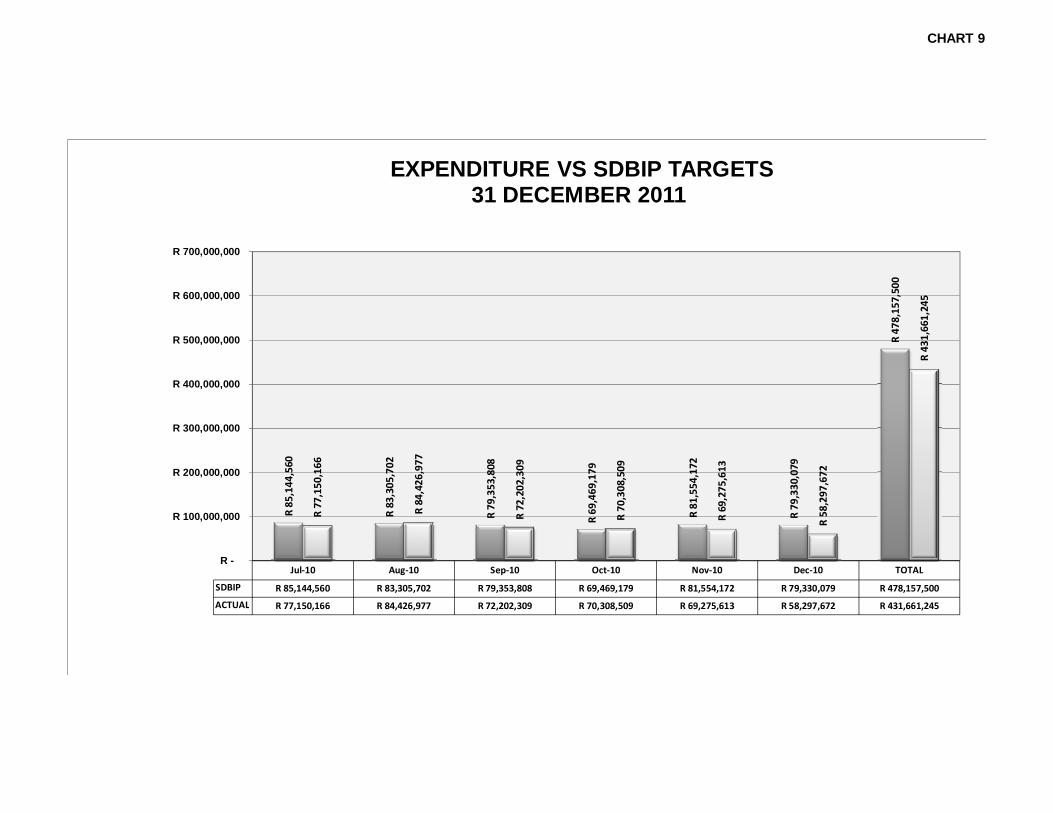
CHART 9
Jul‐10 Aug‐10 Sep‐10 Oct‐10 Nov‐10 Dec‐10 TOTAL
SDBIP R 85,144,560 R 83,305,702 R 79,353,808 R 69,469,179 R 81,554,172 R 79,330,079 R 478,157,500
ACTUAL R 77,150,166 R 84,426,977 R 72,202,309 R 70,308,509 R 69,275,613 R 58,297,672 R 431,661,245
R 85,144,560
R 83,305,702
R 79,353,808
R 69,469,179
R 81,554,172
R 79,330,079
R 478,157,500
R 77,150,166
R 84,426,977
R 72,202,309
R 70,308,509
R 69,275,613
R 58,297,672
R 431,661,245
R -
R 100,000,000
R 200,000,000
R 300,000,000
R 400,000,000
R 500,000,000
R 600,000,000
R 700,000,000
EXPENDITURE VS SDBIP TARGETS31 DECEMBER 2011

2010/11
Unaudited Outcome
Original Budget Adjusted Budget Monthly actual YearTD actual YearTD budget YTD variance YTD
variance% spend of
Original Budget
R thousands %Monthly expenditure performance trend
July 2,178 3,634 3,634 1,483 1,483 3,634 2,150 59.2% 1%August 12,388 8,969 8,969 10,922 12,405 12,602 197 1.6% 6%September 24,852 16,669 20,725 21,014 33,419 33,327 (91) -0.3% 16%October 22,540 16,056 36,532 14,160 47,578 69,860 22,281 31.9% 23%November 26,710 17,724 45,348 19,087 66,665 115,207 48,542 42.1% 32%December 36,963 20,551 34,425 17,521 84,186 149,633 65,447 43.7% 40%January 6,008 16,519 24,611 – 174,244 – February 18,627 17,206 31,865 – 206,109 – March 20,301 23,508 38,293 – 244,401 – April 13,754 23,161 38,324 – 282,726 – May 18,540 19,771 36,616 – 319,342 – June 54,707 24,712 43,137 – 362,479 –
Total Capital expenditure 257,568 208,480 362,479 84,186
2010/2011Unaudited Outcome
Original Budget Adjusted Budget Monthly actual YearTD actual YearTD budget YTD variance YTD
varianceFull Year Forecast
R thousands %Capital Expenditure - Funding Sources
INS (Insurance Fund) – – – – – – – – CRR (Capital Replacement Reserve) 148,563 67,853 134,525 10,363 35,194 86,974 (51,780) -59.5% 133,135 CTC (Cleanest Town Competition) 68 – – – – – – – COG (COGTA) – – – – – – – – DAC (Department of Arts & Culture) 16 – – – – – – – EFF (External Financing Fund) 72,058 91,800 171,267 4,729 24,805 36,441 (11,636) -31.9% 169,702 FIN (FINANCE LEASE) – – – – – – – EPWP 856 1,888 1,888 – – 400 1,888 FMG (Finance Management Grant) – – – – – – – – INEP (Integrated National Electricity Program) 7,594 1,440 5,286 – 3,846 2,846 1,000 35.1% 5,286 MACEF (Municipal Accreditation Capacity Enhancement Funding – 300 300 – – 300 (300) -100.0% – MIG (Municipal Infrastructure Grant) 22,683 29,409 25,840 1,535 14,336 16,124 (1,788) -11.1% 25,840 MSIG (Municipal Systems Improvement Grant) – 790 1,407 6 6 617 (611) -99.0% 1,407 NDM (Nkangala District Municipality) – – – – – – – – NDPG 4,612 15,000 20,388 887 5,343 5,931 20,388 NLDTF 970 – – – – – – RG(Town Planning) 148 – 1,577 – 654 – 654 #DIV/0! 1,577
Total Capital Expenditure - Funding Sources 257,568 208,480 362,479 17,521 84,186 149,633 (64,459) -43.1% 359,224,209
Month
MP313 Steve Tshwete - Supporting Table SC12 Monthly Budget Statement - capital expenditure trend - Mid-Year AssessmentBudget Year 2011/12
Steve Tshwete Local Municipality: Monthly Budget Statement-Capital Expenditure by Funding Source
Vote DescriptionBudget Year 2011/2012
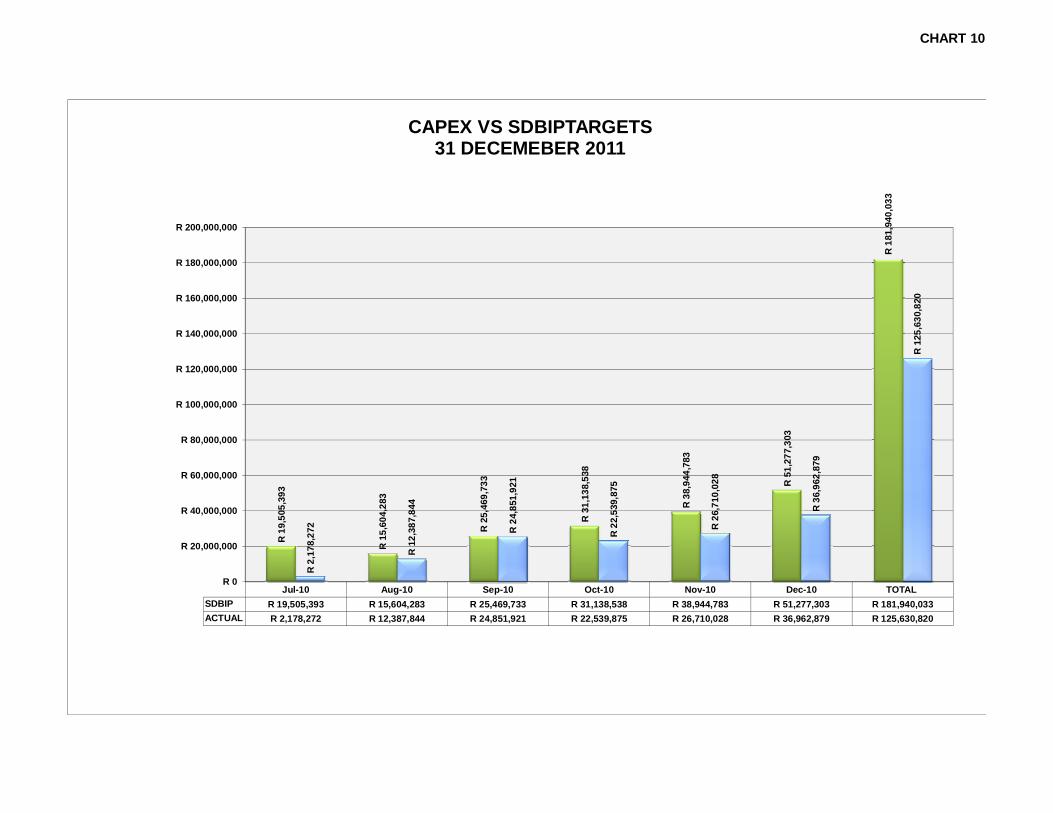
CHART 10
Jul-10 Aug-10 Sep-10 Oct-10 Nov-10 Dec-10 TOTAL SDBIP R 19,505,393 R 15,604,283 R 25,469,733 R 31,138,538 R 38,944,783 R 51,277,303 R 181,940,033ACTUAL R 2,178,272 R 12,387,844 R 24,851,921 R 22,539,875 R 26,710,028 R 36,962,879 R 125,630,820
R 1
9,50
5,39
3
R 1
5,60
4,28
3
R 2
5,46
9,73
3
R 3
1,13
8,53
8
R 3
8,94
4,78
3
R 5
1,27
7,30
3
R 1
81,9
40,0
33
R 2
,178
,272
R 1
2,38
7,84
4
R 2
4,85
1,92
1
R 2
2,53
9,87
5
R 2
6,71
0,02
8
R 3
6,96
2,87
9
R 1
25,6
30,8
20
R 0
R 20,000,000
R 40,000,000
R 60,000,000
R 80,000,000
R 100,000,000
R 120,000,000
R 140,000,000
R 160,000,000
R 180,000,000
R 200,000,000
CAPEX VS SDBIPTARGETS31 DECEMEBER 2011
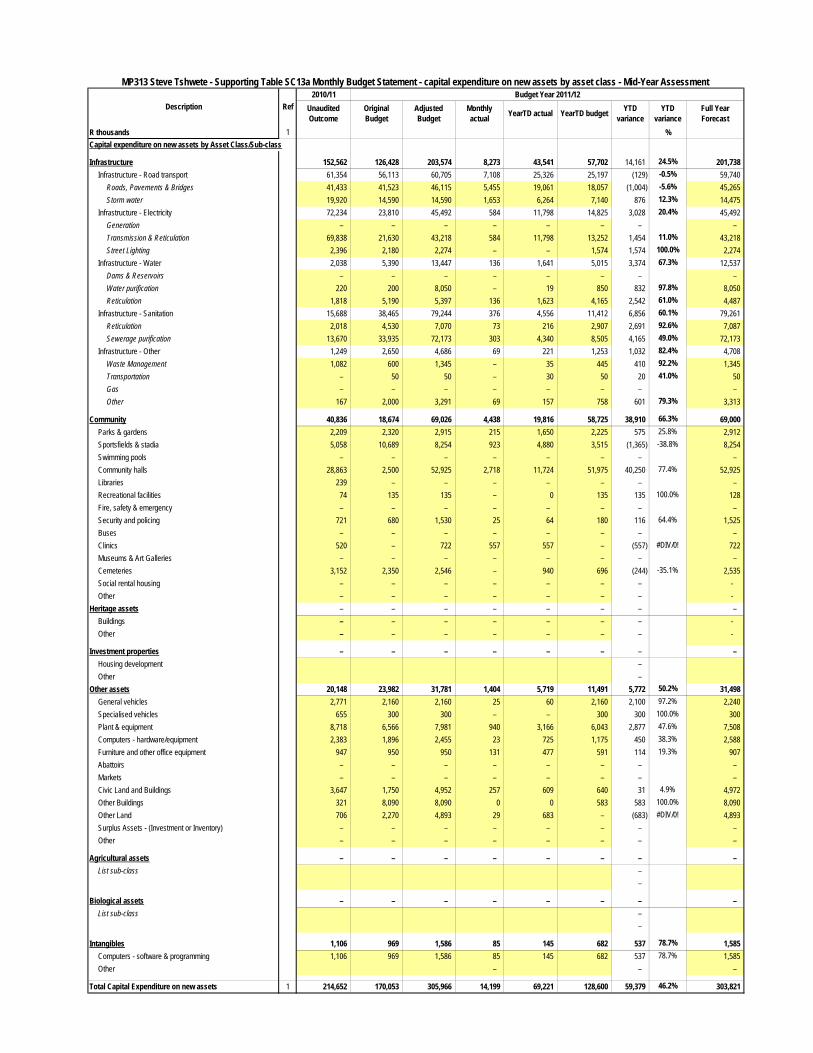
2010/11 Budget Year 2011/12Unaudited Outcome
Original Budget
Adjusted Budget
Monthly actual YearTD actual YearTD budget YTD
varianceYTD
varianceFull Year Forecast
R thousands 1 %Capital expenditure on new assets by Asset Class/Sub-class
Infrastructure 152,562 126,428 203,574 8,273 43,541 57,702 14,161 24.5% 201,738 Infrastructure - Road transport 61,354 56,113 60,705 7,108 25,326 25,197 (129) -0.5% 59,740
Roads, Pavements & Bridges 41,433 41,523 46,115 5,455 19,061 18,057 (1,004) -5.6% 45,265 Storm water 19,920 14,590 14,590 1,653 6,264 7,140 876 12.3% 14,475
Infrastructure - Electricity 72,234 23,810 45,492 584 11,798 14,825 3,028 20.4% 45,492 Generation – – – – – – – – Transmission & Reticulation 69,838 21,630 43,218 584 11,798 13,252 1,454 11.0% 43,218 Street Lighting 2,396 2,180 2,274 – – 1,574 1,574 100.0% 2,274
Infrastructure - Water 2,038 5,390 13,447 136 1,641 5,015 3,374 67.3% 12,537 Dams & Reservoirs – – – – – – – – Water purification 220 200 8,050 – 19 850 832 97.8% 8,050 Reticulation 1,818 5,190 5,397 136 1,623 4,165 2,542 61.0% 4,487
Infrastructure - Sanitation 15,688 38,465 79,244 376 4,556 11,412 6,856 60.1% 79,261 Reticulation 2,018 4,530 7,070 73 216 2,907 2,691 92.6% 7,087 Sewerage purification 13,670 33,935 72,173 303 4,340 8,505 4,165 49.0% 72,173
Infrastructure - Other 1,249 2,650 4,686 69 221 1,253 1,032 82.4% 4,708 Waste Management 1,082 600 1,345 – 35 445 410 92.2% 1,345 Transportation – 50 50 – 30 50 20 41.0% 50 Gas – – – – – – – – Other 167 2,000 3,291 69 157 758 601 79.3% 3,313
Community 40,836 18,674 69,026 4,438 19,816 58,725 38,910 66.3% 69,000 Parks & gardens 2,209 2,320 2,915 215 1,650 2,225 575 25.8% 2,912 Sportsfields & stadia 5,058 10,689 8,254 923 4,880 3,515 (1,365) -38.8% 8,254 Swimming pools – – – – – – – – Community halls 28,863 2,500 52,925 2,718 11,724 51,975 40,250 77.4% 52,925 Libraries 239 – – – – – – – Recreational facilities 74 135 135 – 0 135 135 100.0% 128 Fire, safety & emergency – – – – – – – – Security and policing 721 680 1,530 25 64 180 116 64.4% 1,525 Buses – – – – – – – – Clinics 520 – 722 557 557 – (557) #DIV/0! 722 Museums & Art Galleries – – – – – – – – Cemeteries 3,152 2,350 2,546 – 940 696 (244) -35.1% 2,535 Social rental housing – – – – – – – - Other – – – – – – – -
Heritage assets – – – – – – – – Buildings – – – – – – – - Other – – – – – – – -
Investment properties – – – – – – – – Housing development – Other –
Other assets 20,148 23,982 31,781 1,404 5,719 11,491 5,772 50.2% 31,498 General vehicles 2,771 2,160 2,160 25 60 2,160 2,100 97.2% 2,240 Specialised vehicles 655 300 300 – – 300 300 100.0% 300 Plant & equipment 8,718 6,566 7,981 940 3,166 6,043 2,877 47.6% 7,508 Computers - hardware/equipment 2,383 1,896 2,455 23 725 1,175 450 38.3% 2,588 Furniture and other office equipment 947 950 950 131 477 591 114 19.3% 907 Abattoirs – – – – – – – – Markets – – – – – – – – Civic Land and Buildings 3,647 1,750 4,952 257 609 640 31 4.9% 4,972 Other Buildings 321 8,090 8,090 0 0 583 583 100.0% 8,090 Other Land 706 2,270 4,893 29 683 – (683) #DIV/0! 4,893 Surplus Assets - (Investment or Inventory) – – – – – – – – Other – – – – – – – –
Agricultural assets – – – – – – – – List sub-class –
–
Biological assets – – – – – – – – List sub-class –
–
Intangibles 1,106 969 1,586 85 145 682 537 78.7% 1,585 Computers - software & programming 1,106 969 1,586 85 145 682 537 78.7% 1,585 Other – – –
Total Capital Expenditure on new assets 1 214,652 170,053 305,966 14,199 69,221 128,600 59,379 46.2% 303,821
Description Ref
MP313 Steve Tshwete - Supporting Table SC13a Monthly Budget Statement - capital expenditure on new assets by asset class - Mid-Year Assessment
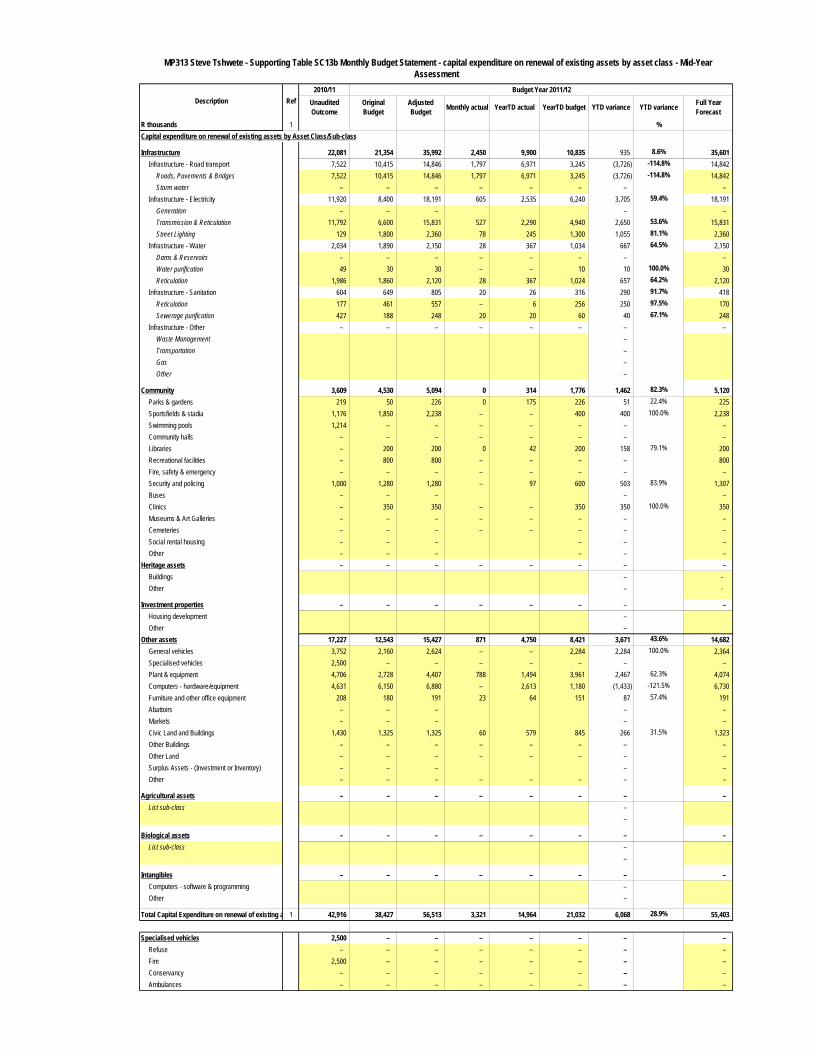
2010/11 Budget Year 2011/12Unaudited Outcome
Original Budget
Adjusted Budget Monthly actual YearTD actual YearTD budget YTD variance YTD variance Full Year
ForecastR thousands 1 %Capital expenditure on renewal of existing assets by Asset Class/Sub-class
Infrastructure 22,081 21,354 35,992 2,450 9,900 10,835 935 8.6% 35,601 Infrastructure - Road transport 7,522 10,415 14,846 1,797 6,971 3,245 (3,726) -114.8% 14,842
Roads, Pavements & Bridges 7,522 10,415 14,846 1,797 6,971 3,245 (3,726) -114.8% 14,842 Storm water – – – – – – – –
Infrastructure - Electricity 11,920 8,400 18,191 605 2,535 6,240 3,705 59.4% 18,191 Generation – – – – – Transmission & Reticulation 11,792 6,600 15,831 527 2,290 4,940 2,650 53.6% 15,831 Street Lighting 129 1,800 2,360 78 245 1,300 1,055 81.1% 2,360
Infrastructure - Water 2,034 1,890 2,150 28 367 1,034 667 64.5% 2,150 Dams & Reservoirs – – – – – – – – Water purification 49 30 30 – – 10 10 100.0% 30 Reticulation 1,986 1,860 2,120 28 367 1,024 657 64.2% 2,120
Infrastructure - Sanitation 604 649 805 20 26 316 290 91.7% 418 Reticulation 177 461 557 – 6 256 250 97.5% 170 Sewerage purification 427 188 248 20 20 60 40 67.1% 248
Infrastructure - Other – – – – – – – – Waste Management – Transportation – Gas – Other –
Community 3,609 4,530 5,094 0 314 1,776 1,462 82.3% 5,120 Parks & gardens 219 50 226 0 175 226 51 22.4% 225 Sportsfields & stadia 1,176 1,850 2,238 – – 400 400 100.0% 2,238 Swimming pools 1,214 – – – – – – – Community halls – – – – – – – – Libraries – 200 200 0 42 200 158 79.1% 200 Recreational facilities – 800 800 – – – – 800 Fire, safety & emergency – – – – – – – – Security and policing 1,000 1,280 1,280 – 97 600 503 83.9% 1,307 Buses – – – – – Clinics – 350 350 – – 350 350 100.0% 350 Museums & Art Galleries – – – – – – – – Cemeteries – – – – – – – – Social rental housing – – – – – – Other – – – – – –
Heritage assets – – – – – – – – Buildings – - Other – -
Investment properties – – – – – – – – Housing development – Other –
Other assets 17,227 12,543 15,427 871 4,750 8,421 3,671 43.6% 14,682 General vehicles 3,752 2,160 2,624 – – 2,284 2,284 100.0% 2,364 Specialised vehicles 2,500 – – – – – – – Plant & equipment 4,706 2,728 4,407 788 1,494 3,961 2,467 62.3% 4,074 Computers - hardware/equipment 4,631 6,150 6,880 – 2,613 1,180 (1,433) -121.5% 6,730 Furniture and other office equipment 208 180 191 23 64 151 87 57.4% 191 Abattoirs – – – – – Markets – – – – – Civic Land and Buildings 1,430 1,325 1,325 60 579 845 266 31.5% 1,323 Other Buildings – – – – – – – – Other Land – – – – – – – – Surplus Assets - (Investment or Inventory) – – – – – Other – – – – – – – –
Agricultural assets – – – – – – – – List sub-class –
–
Biological assets – – – – – – – – List sub-class –
–
Intangibles – – – – – – – – Computers - software & programming – Other –
Total Capital Expenditure on renewal of existing a 1 42,916 38,427 56,513 3,321 14,964 21,032 6,068 28.9% 55,403
Specialised vehicles 2,500 – – – – – – – Refuse – – – – – – – – Fire 2,500 – – – – – – – Conservancy – – – – – – – – Ambulances – – – – – – – –
MP313 Steve Tshwete - Supporting Table SC13b Monthly Budget Statement - capital expenditure on renewal of existing assets by asset class - Mid-Year Assessment
Description Ref
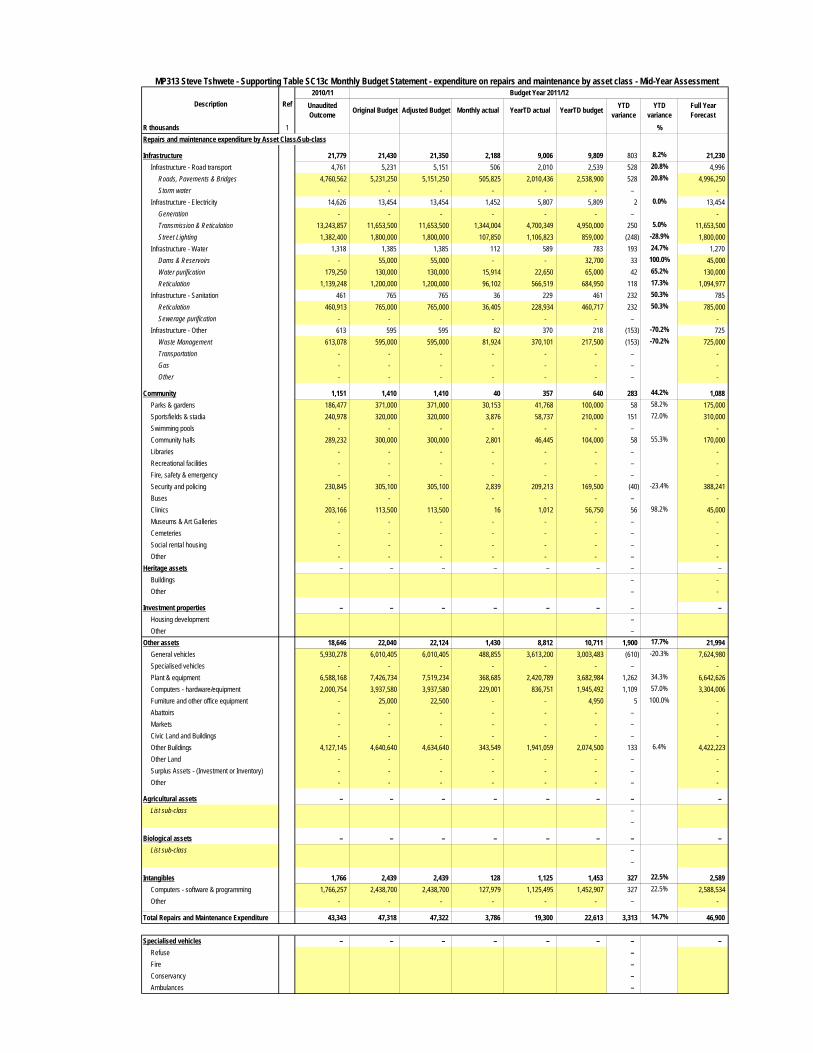
2010/11 Budget Year 2011/12Unaudited Outcome Original Budget Adjusted Budget Monthly actual YearTD actual YearTD budget YTD
varianceYTD
varianceFull Year Forecast
R thousands 1 %Repairs and maintenance expenditure by Asset Class/Sub-class
Infrastructure 21,779 21,430 21,350 2,188 9,006 9,809 803 8.2% 21,230 Infrastructure - Road transport 4,761 5,231 5,151 506 2,010 2,539 528 20.8% 4,996
Roads, Pavements & Bridges 4,760,562 5,231,250 5,151,250 505,825 2,010,436 2,538,900 528 20.8% 4,996,250 Storm water - - - - - - – -
Infrastructure - Electricity 14,626 13,454 13,454 1,452 5,807 5,809 2 0.0% 13,454 Generation - - - - - - – - Transmission & Reticulation 13,243,857 11,653,500 11,653,500 1,344,004 4,700,349 4,950,000 250 5.0% 11,653,500 Street Lighting 1,382,400 1,800,000 1,800,000 107,850 1,106,823 859,000 (248) -28.9% 1,800,000
Infrastructure - Water 1,318 1,385 1,385 112 589 783 193 24.7% 1,270 Dams & Reservoirs - 55,000 55,000 - - 32,700 33 100.0% 45,000 Water purification 179,250 130,000 130,000 15,914 22,650 65,000 42 65.2% 130,000 Reticulation 1,139,248 1,200,000 1,200,000 96,102 566,519 684,950 118 17.3% 1,094,977
Infrastructure - Sanitation 461 765 765 36 229 461 232 50.3% 785 Reticulation 460,913 765,000 765,000 36,405 228,934 460,717 232 50.3% 785,000 Sewerage purification - - - - - - – -
Infrastructure - Other 613 595 595 82 370 218 (153) -70.2% 725 Waste Management 613,078 595,000 595,000 81,924 370,101 217,500 (153) -70.2% 725,000 Transportation - - - - - - – - Gas - - - - - - – - Other - - - - - - – -
Community 1,151 1,410 1,410 40 357 640 283 44.2% 1,088 Parks & gardens 186,477 371,000 371,000 30,153 41,768 100,000 58 58.2% 175,000 Sportsfields & stadia 240,978 320,000 320,000 3,876 58,737 210,000 151 72.0% 310,000 Swimming pools - - - - - - – - Community halls 289,232 300,000 300,000 2,801 46,445 104,000 58 55.3% 170,000 Libraries - - - - - - – - Recreational facilities - - - - - - – - Fire, safety & emergency - - - - - - – - Security and policing 230,845 305,100 305,100 2,839 209,213 169,500 (40) -23.4% 388,241 Buses - - - - - - – - Clinics 203,166 113,500 113,500 16 1,012 56,750 56 98.2% 45,000 Museums & Art Galleries - - - - - - – - Cemeteries - - - - - - – - Social rental housing - - - - - - – - Other - - - - - - – -
Heritage assets – – – – – – – – Buildings – - Other – -
Investment properties – – – – – – – – Housing development – Other –
Other assets 18,646 22,040 22,124 1,430 8,812 10,711 1,900 17.7% 21,994 General vehicles 5,930,278 6,010,405 6,010,405 488,855 3,613,200 3,003,483 (610) -20.3% 7,624,980 Specialised vehicles - - - - - - – - Plant & equipment 6,588,168 7,426,734 7,519,234 368,685 2,420,789 3,682,984 1,262 34.3% 6,642,626 Computers - hardware/equipment 2,000,754 3,937,580 3,937,580 229,001 836,751 1,945,492 1,109 57.0% 3,304,006 Furniture and other office equipment - 25,000 22,500 - - 4,950 5 100.0% - Abattoirs - - - - - - – - Markets - - - - - - – - Civic Land and Buildings - - - - - - – - Other Buildings 4,127,145 4,640,640 4,634,640 343,549 1,941,059 2,074,500 133 6.4% 4,422,223 Other Land - - - - - - – - Surplus Assets - (Investment or Inventory) - - - - - - – - Other - - - - - - – -
Agricultural assets – – – – – – – – List sub-class –
–
Biological assets – – – – – – – – List sub-class –
–
Intangibles 1,766 2,439 2,439 128 1,125 1,453 327 22.5% 2,589 Computers - software & programming 1,766,257 2,438,700 2,438,700 127,979 1,125,495 1,452,907 327 22.5% 2,588,534 Other - - - - - - – -
Total Repairs and Maintenance Expenditure 43,343 47,318 47,322 3,786 19,300 22,613 3,313 14.7% 46,900
Specialised vehicles – – – – – – – – Refuse – Fire – Conservancy – Ambulances –
MP313 Steve Tshwete - Supporting Table SC13c Monthly Budget Statement - expenditure on repairs and maintenance by asset class - Mid-Year Assessment
Description Ref