middle education text - new hampshire and labor market information bureau, new hampshire employment...
TRANSCRIPT
Economic and Labor Market Information Bureau, New Hampshire Employment Security
August 2017
Perspectives on
Middle Education Occupations in New Hampshire
Perspecti ves on Middle Educati on Occupati ons
in New Hampshire
State of New HampshireChristopher T. Sununu, Governor
New Hampshire Employment SecurityGeorge N. Copadis, Commissioner
Economic and Labor Market Informati on BureauBruce R. DeMay, Director
August 2017

Anita Josten(603) [email protected]
Katrina Evans(603) [email protected]
Economic and Labor Market Informati on BureauNew Hampshire Employment Security45 South Fruit StConcord, New Hampshire 03301(603) [email protected]/elmi
This workforce product was funded by a grant awarded by the U.S. Department of Labor’s Employment and Training Administration. The product was created by the grantee and does not necessarily refl ect the offi cial position of the U.S. Department of Labor. The Department of Labor makes no guarantees, warranties, or assurances of any kind, express or implied, with respect to such information, including any information on linked sites and including, but not limited to, accuracy of the information or its completeness, timeliness, usefulness, adequacy, continued availability, or ownership. This product is copyrighted by the institution that created it. Internal use by an organization and/or personal use by an individual for non-commercial purposes is permissible. All other uses require the prior authorization of the copyright owner.
The following New Hampshire Employment Security staff members were instrumental in producing this publicati on:
Economic and Labor Market Informati on BureauAnnett e Nielsen, EconomistAnita Josten, Research AnalystMichael Argiropolis, Labor Market AnalystKatrina Evans, Assistant Director
For further informati on about this publicati on:
Annett e Nielsen (603) 229-4427Annett [email protected]
Michael Argiropolis(603) [email protected]
Acknowledgments
Introduction ............................................................................................................................................................................ 1
Overview ................................................................................................................................................................................... 3
Perspectives on Middle Education Occupations
• Educational Attainment of the Current Workforce by Age ................................................................... 11
• Comparing Worker Education to Job Expectations .................................................................................. 23
• Workforce Upskilling - Fact or Myth? ............................................................................................................. 49
• Apprenticeable Occupations - Exploring the Learning While Earning Model .............................. 59
• Modeling the Economic Impact of Jobs in Middle Education Occupations .................................... 69
Appendices
• Appendix A: Occupational Education, Expaerience and Training Definitions ............................. 81
• Appendix B: Employment Projections for Middle Education Occupations .....................................83
Table of Contents
Perspecti ves on Middle Educati on Occupati ons in New Hampshire

Perspecti ves on Middle Educati on Occupati ons in New Hampshire
Economic and Labor Market Informati on Bureau, New Hampshire Employment Security
Economic and Labor Market Informati on Bureau, New Hampshire Employment Security 1
Perspecti ves on Middle Educati on Occupati ons in New Hampshire
Introducti onNew Hampshire’s labor market has improved substantially since the end of the Great Recession in 2009. Jobs in nonfarm employment reached a historical high in 2016 1 and the unemployment rate continues to rank among the lowest in the nation. The outcry for programs to help the unemployed has quieted, while workforce education and training programs designed to upgrade worker skills and meet employer demand have sprouted like weeds.
Occupations with higher levels of education — a Bachelor’s degree and above — have long been proven the road to career success. People with more education have been statistically shown to have lower unemployment rates and higher earnings over their lifetime.2 But not everyone wants a job that requires at least four years of college, regardless of prospective financial benefits. For many, middle education occupations are the answer to career success.
What exactly are “middle education” occupations? These are jobs in the middle of the labor market, those that usually require more than a high school diploma but less than a four-year degree for entry-level employment. Middle education occupations are sometimes called “middle skill” occupations; however, the actual skills needed for each occupation are not easily analyzed, whereas typical entry-level education and training for each occupation is readily available.
The career value of middle education occupations is wide-spread. According to the New Hampshire Department of Education, nearly 23 percent of 2016 high school graduates intended to enter postsecondary education other than a four-year college — and that percentage was divided evenly between males and females.3 Roughly 37 percent of New Hampshire residents age 18 and over have not attained education beyond a high school diploma.4 For many people in New Hampshire, middle education occupations can make career advancement achievable with minimal time and expense investments. Middle education occupations are also well-suited for apprenticeships, an opportunity to earn wages while learning a job and gaining valuable experience. Middle education occupations will continue to meet a variety of labor market needs, both now and into the future.
Jobs in middle education occupations are significant to New Hampshire’s economy and its workforce. The following analyses provide a variety of perspectives on the jobs and workers in middle education occupations, and their impact on the New Hampshire workforce.
1 Current Employment Stati sti cs, 2016 Benchmark2 U.S. Bureau of Labor Stati sti cs, Earnings and unemployment rates by educati onal att ainment, 2015. Data are for persons age 25 and
over; earnings are for full-ti me wage and salary workers. htt ps://www.bls.gov/emp/ep_chart_001.htm3 New Hampshire Department of Educati on, Bureau of Accountability, Data Analysis and Management, 2015 – 2016 State Total
Completers by Category in Public Schools and Public Academies. February 24, 2017.4 U.S. Census Bureau, 2011-2015 American Community Survey 5-Year Esti mates, Table S1501

Perspecti ves on Middle Educati on Occupati ons in New Hampshire
2 Economic and Labor Market Informati on Bureau, New Hampshire Employment Security

Economic and Labor Market Informati on Bureau, New Hampshire Employment Security 3
Perspecti ves on Middle Educati on Occupati ons in New Hampshire
Overview
Educational Attainment in New Hampshire
There are only small differences in the shares of New Hampshire’s population age 18 and over when divided among three levels educational attainment: 28.9 percent hold a high school diploma or equivalent; 30.9 percent have completed some college or an Associate’s degree; and 32.1 percent hold a Bachelor’s or higher degree. Among residents age 18 and over, 8.1 percent have less than a high school education. Compared to the U.S. as a whole, New Hampshire has a smaller share of residents with less than a high school education, and a larger share with a Bachelor’s degree or higher.
Source: U.S. Census Bureau, 2011-2015 American Community Survey 5-Year Esti mates, Table S1501
Less than high school graduate,
8.1%
High school or equivalent, 28.9%
Some college or Associate's
degree, 30.9%
Bachelor's degree or higher, 32.1%
New Hampshire Age 18+ Population by Educational Attainment
Less than high school graduate,
13.5%
High school or equivalent, 28.0%
Some college or Associate's
degree, 31.3%
Bachelor's degree or higher, 27.2%
U.S. Age 18+ Population by Educational Attainment
Perspecti ves on Middle Educati on Occupati ons in New Hampshire
4 Economic and Labor Market Informati on Bureau, New Hampshire Employment Security
New Hampshire residents under age 18, who presumably have not yet completed secondary education, represent 20.5 percent of the state’s total population, compared to 23.3 percent for the U.S. as a whole. New Hampshire’s smaller share of residents under the age of 18 is a reflection of the state’s median age of 42.2 years, the third highest among the states. 5
Middle Education Occupations Defined
The U.S. Bureau of Labor Statistics, Employment Projections Program, establishes the typical education, related work experience, and on-the-job training needed for entry-level employment in each occupation.6 For purposes of this analysis, middle education occupations have been defined as occupations with typical entry-level education, experience, and training requirements of:
(1) A high school diploma or equivalent plus related work experience or at least one year of on-the-job training (long-term OJT), including apprenticeship;
(2) Up to two years of postsecondary education, resulting in a non-degree certificate;
(3) Some college-level education, without completion of a degree; or
(4) An Associate’s degree.
Based on this definition, middle education occupations cover a wide spectrum of work activities.7There were 180 occupations meeting the criteria; all occupational groups with the exception of Community and social services occupations were represented. Among these middle education occupations, 44 are related to science and engineering, apprenticeship is a training option for 112, and 30 occupations require a New Hampshire license to practice.
5 U.S. Census Bureau, 2011-2015 American Community Survey 5-Year Estimates, Tables B01003 and B090016 See Appendix A for a complete descripti on of entry-level educati on, related work experience, and typical on-the-job training required
to att ain competency.7 See Appendix B for a full list of middle educati on occupati ons.
Economic and Labor Market Informati on Bureau, New Hampshire Employment Security 5
Perspecti ves on Middle Educati on Occupati ons in New Hampshire
Future Outlook for Middle Education Occupations
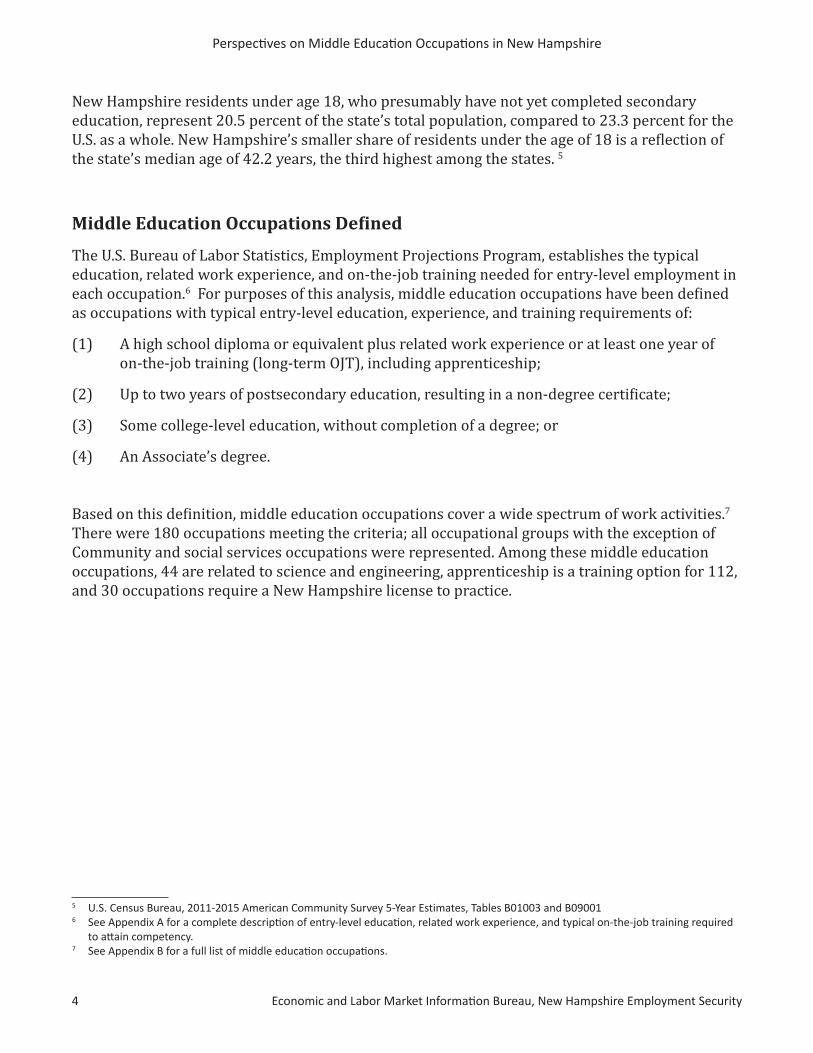
From 2014 through 2024, employment in New Hampshire is projected to grow by 7.0 percent, gaining just over 47,000 jobs. The annual average number of job openings is expected to reach 21,370. Roughly 75 percent of annual job openings will be due to replacements — the need to replace a worker who leaves the occupation, largely because of retirement.
In 2014, about 25 percent of estimated employment in New Hampshire was in occupations with middle education entry-level requirements. That share is projected to remain the same through 2024. Compared to the U.S. as a whole, the share of both employment and average annual job openings for middle education jobs in New Hampshire is roughly two percentage points higher.
There is a general idea that employment growth in higher-education occupations and lower-education occupations will squeeze out jobs requiring mid-level education and/or training. Demand for workers in middle education jobs, however, is not disappearing.
0% 5% 10% 15% 20% 25% 30%
Average Annual Job Openings
2024 Projected Employment
2014 Estimated Employment
Perc
ent o
f Tot
al, A
ll O
ccup
atio
ns
U.S. NH
2014 -2024 Employment Projections, Middle Education Occupations
Sources: Economic and Labor Market Informati on Bureau, NH Employment Security; U.S. Bureau of Labor Stati sti cs

Perspecti ves on Middle Educati on Occupati ons in New Hampshire
6 Economic and Labor Market Informati on Bureau, New Hampshire Employment Security
Middle Education Wage Ranges
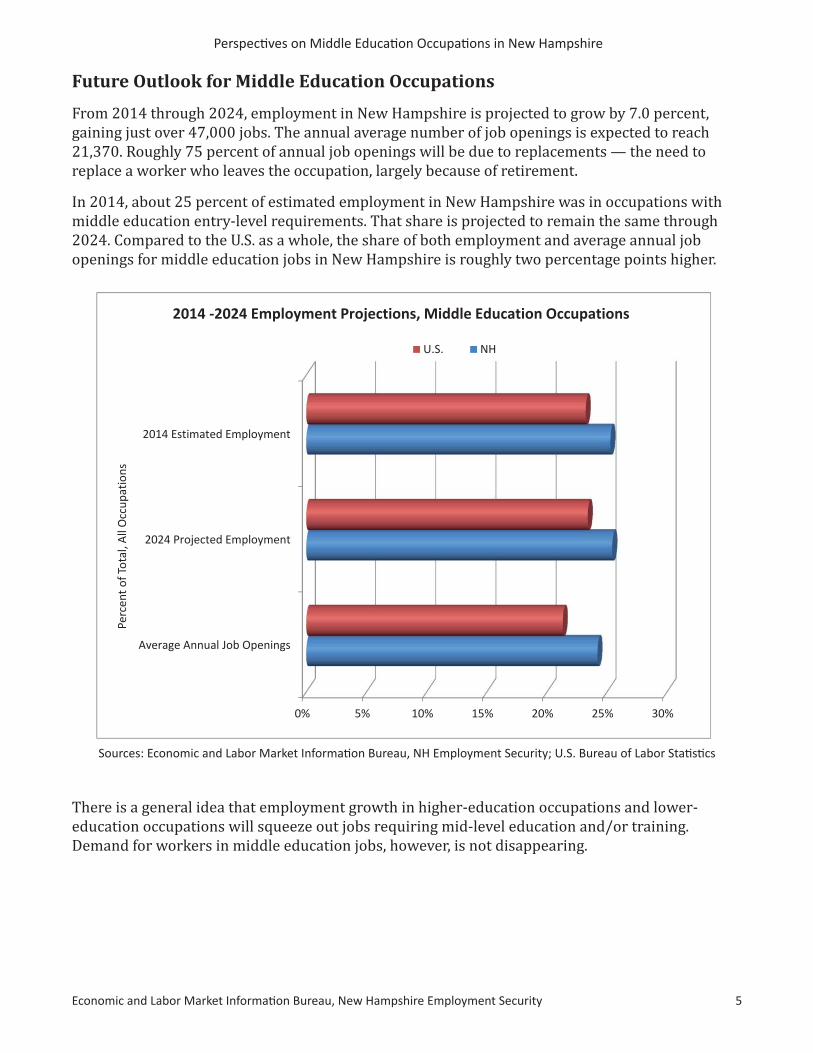
In 2016, the median annual wage8 for all occupations was $38,270. Among the middle education occupations,9 80 percent had a median annual wage above the median for all occupations. Median annual wages ranged from about $25,000 for Bailiffs, Hairdressers, hairstylists, and cosmetologists, and Manicurists and pedicurists to $100,000 for Transportation, storage, and distribution managers and Air traffic controllers.
8 Wage data are based on the May 2015 occupati onal wage survey results (the latest available) updated to June 2016 using the Employment Cost Index (ECI), a quarterly measure of changes in labor costs produced by the U.S. Bureau of Labor Stati sti cs. Updated occupati onal wages provides data users a bett er idea of current wage esti mates.
9 Among the 180 occupati ons identi fi ed as middle educati on, New Hampshire wage data were not available for 41 occupati ons.
Comparing the share of projected annual average job openings for occupations in the three levels of education shows that replacement openings — those caused by workers leaving an occupation for a different occupation or departing the workforce — continue to represent the largest portion of annual average job openings. While occupations usually requiring lower levels of education for entry-level employment hold the largest share of all openings, occupations usually requiring middle and higher levels of education are nearly equal, in both new job openings and replacements.
Source: Economic and Labor Market Informati on Bureau, NH Employment Security
0%
10%
20%
30%
40%
50%
60%
Lower Middle Higher
11.0%6.6% 6.7%
43.5%
16.3% 15.9%
Usual Entry-level Education
2014-2024 Projected Annual Average Job Openings in New Hampshire by Usual Entry-Level Education
Average Replacements Average New Job Openings
Economic and Labor Market Informati on Bureau, New Hampshire Employment Security 7
Perspecti ves on Middle Educati on Occupati ons in New Hampshire
Comparing annual wages at the 25th percentile, 94 percent of middle education occupations with available data ranked above the $25,680 25th percentile wage for all occupations. Middle education occupations were less likely to rank among the highest wages, however. The annual wage at the 75th percentile was $60,060 for all occupations. Among the 140 middle education occupations (with available data), half of the occupations had a 75th percentile wage above that value, while half were below.
Of the 12 middle education occupations with the highest estimated employment in 2014,10 seven had median annual wages above the $38,270 median wage for all occupations in New Hampshire. At the 25th percentile, nine of the 12 largest occupations had annual wages above the total for all occupations. Fewer of these 12 occupations bested the $60,060 annual wage for all occupations at the 75th percentile, with just two of the largest occupations having higher annual wages at the 75th percentile.
Overall, these comparisons indicate a strong average wage potential for workers in middle education occupations.
10 Occupati ons selected had the largest esti mated number of workers in 2014 meeti ng middle educati on criteria. New Hampshire Occupati onal Employment Projecti ons, Economic and Labor Market Informati on Bureau, NH Employment Security
$33,310
$31,750
$35,360
$34,740
$46,630
$60,060
$48,810
$49,540
$50,890
$49,030
$51,320
$67,280
$79,610
$25,240
$27,570
$28,980
$29,610
$36,940
$38,270
$39,470
$40,010
$40,310
$41,750
$43,880
$52,650
$66,700
$19,260
$23,660
$22,960
$26,030
$29,240
$25,680
$32,230
$33,010
$32,260
$35,660
$36,260
$42,050
$56,560
$10,000 $20,000 $30,000 $40,000 $50,000 $60,000 $70,000 $80,000 $90,000
Hairdressers, Hairstylists,and Cosmetologists
Preschool Teachers,Except Special Education
Teacher Assistants
Nursing Assistants
First-Line Supervisors of FoodPreparation and Serving Workers
Bookkeeping, Accounting,and Auditing Clerks
Maintenance and RepairWorkers, General
Automotive ServiceTechnicians and Mechanics
Heavy and Tractor-TrailerTruck Drivers
Carpenters
First-Line Supervisors of Office andAdministrative Support Workers
Registered Nurses
Source: Occupational Employment Statistics Program, May 2016 survey data.
75th percentile
2016 Hourly Wages for Middle Education Occupations Ranked by Median Annual Wage
25th percentile
Median
TOTAL, ALL OCCUPATIONS
Perspecti ves on Middle Educati on Occupati ons in New Hampshire
8 Economic and Labor Market Informati on Bureau, New Hampshire Employment Security
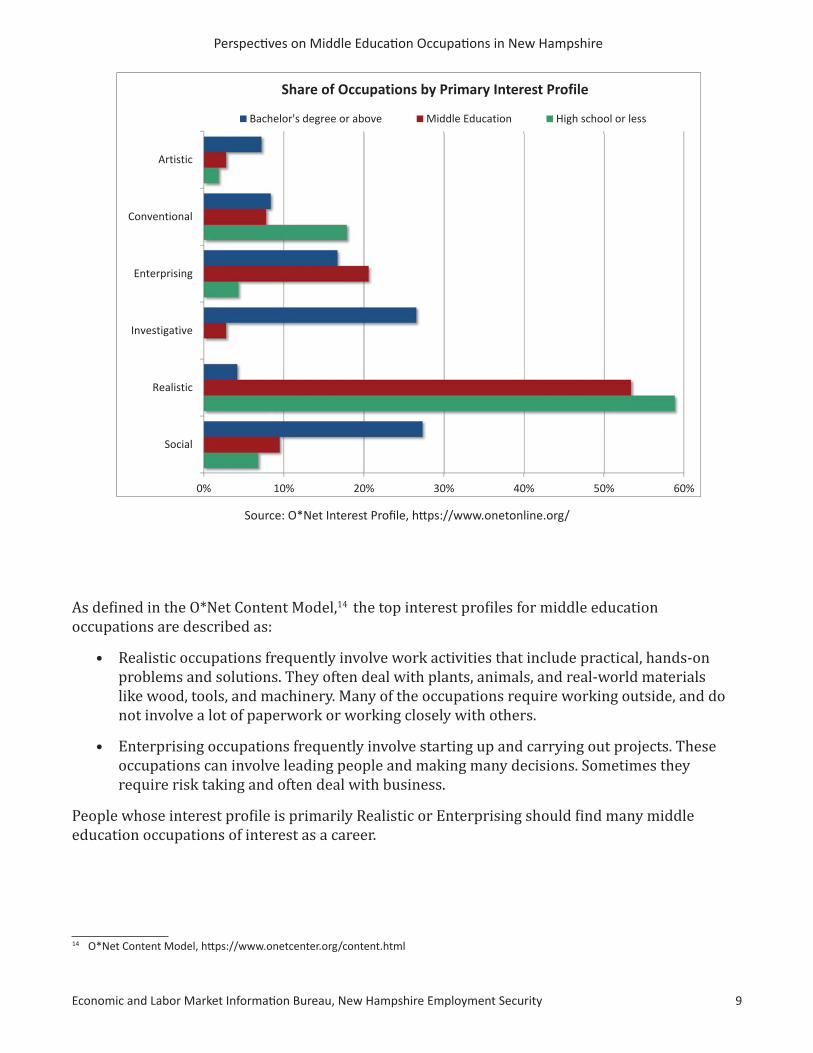
O*Net, the Occupational Information Network, compiles standardized descriptors of hundreds of occupations.11 One descriptor is a worker’s occupational interests, which indicates preferences for work environments. The interest profile, aligned with the Holland Theory of Career Choice,12 identifies six work environments to which occupations, and the workers in those occupations, are strongly connected. The six types are Realistic, Investigative, Artistic, Social, Enterprising, and Conventional, commonly referred to as RIASEC. A worker whose interests are aligned with the interest profile of an occupation is more likely to find their work environment rewarding.13
Comparing the share of occupations with common primary interest profiles clearly illustrates the differences between middle education occupations and occupations requiring higher education (Bachelor’s degree or above) for entry-level employment. Middle education occupations are most likely to have a Realistic profile, as are lower education occupations — those usually needing a high school diploma or less for entry-level employment.
The largest share of occupations with an Enterprising interest profile is in middle education occupations, as are smaller shares of occupations with Social and Conventional interest profiles. Among occupations with a Conventional interest profile, the largest share is most likely to need only a high school diploma or less education. Higher education occupations are more diverse in interests, and have large shares of occupations with Social, Investigative, and Enterprising interest profiles, as well as the largest share of occupations with an Artistic interest profile.
11 O*Net Content Model, htt ps://www.onetcenter.org/content.html12 John L. Holland developed the theory that people can be described by a combinati on of six personality types. The theory proposed
that people seek out work environments that match their personality type. A bett er match means more job sati sfacti on, because the person fi nds the job interesti ng. Occupati ons can be assigned a Hollands code just as people can determine the Holland type for their own personality. htt ps://www.careerkey.org/choose-a-career/hollands-theory-of-career-choice.html
13 For more on interest profi les with New Hampshire-specifi c informati on, see htt p://www.nhes.nh.gov/elmi/career/career-assess.htm
Interests
Economic and Labor Market Informati on Bureau, New Hampshire Employment Security 9
Perspecti ves on Middle Educati on Occupati ons in New Hampshire
Source: O*Net Interest Profi le, htt ps://www.onetonline.org/
As defined in the O*Net Content Model,14 the top interest profiles for middle education occupations are described as:
• Realistic occupations frequently involve work activities that include practical, hands-on problems and solutions. They often deal with plants, animals, and real-world materials like wood, tools, and machinery. Many of the occupations require working outside, and do not involve a lot of paperwork or working closely with others.
• Enterprising occupations frequently involve starting up and carrying out projects. These occupations can involve leading people and making many decisions. Sometimes they require risk taking and often deal with business.
People whose interest profile is primarily Realistic or Enterprising should find many middle education occupations of interest as a career.
14 O*Net Content Model, htt ps://www.onetcenter.org/content.html
0% 10% 20% 30% 40% 50% 60%
Social
Realistic
Investigative
Enterprising
Conventional
Artistic
Share of Occupations by Primary Interest Profile
Bachelor's degree or above Middle Education High school or less

Perspecti ves on Middle Educati on Occupati ons in New Hampshire
10 Economic and Labor Market Informati on Bureau, New Hampshire Employment Security

Economic and Labor Market Informati on Bureau, New Hampshire Employment Security 11
Perspecti ves on Middle Educati on Occupati ons in New Hampshire
Business and educati onal leaders are calling for an increase in the educati onal and skills att ainment for the state’s working age populati on to meet future workforce needs. In order to assess such policy goal, it is important to evaluate the educati onal att ainment of New Hampshire’s current populati on. Despite the state showing a higher level of educati onal att ainment than the nati on overall, evaluati ng the educati onal att ainment for the New Hampshire populati on by age groups shows signifi cant diff erences between younger and older age groups.
Author: Annett e Nielsen, Economist
Educati onal Att ainment of the Current Workforce by Age

Perspecti ves on Middle Educati on Occupati ons in New Hampshire
12 Economic and Labor Market Informati on Bureau, New Hampshire Employment Security
Economic and Labor Market Informati on Bureau, New Hampshire Employment Security 13
Perspecti ves on Middle Educati on Occupati ons in New Hampshire
he New Hampshire Coalition for Business and Education, a group of educators, business, and government leaders has endorsed a statewide workforce goal called “65 by 25.” Based on estimates of the Granite State’s future workforce needs, the initiative’s goal is to have
65 percent of the state’s working age adults hold a postsecondary degree or a high-value credential by 2025, hence the “65 by 25.”15
In order to discuss the above and similar initiatives, it is important to evaluate the educational attainment of New Hampshire’s current population. According to Lumina Foundation estimates, New Hampshire’s postsecondary attainment rate was 49.2 percent in 2014. This rate is based on New Hampshire’s working age population (age 25-64) with an educational attainment of an Associate’s degree or higher and residents with high-quality certificates.16
Overall, the educational attainment of New Hampshire’s population is high in comparison to the nation. According to the 2015 American Community Survey, 64.6 percent of New Hampshire’s population age 25 and over had attained education above a high school diploma (includes Some college, no degree through Graduate or professional degree). In comparison, only 59.6 percent of the nation’s population attained education above a high school diploma in 2015.17
The educational attainment of New Hampshire’s population age 25 and over has improved over time. In 2005, the share of New Hampshire’s population with educational attainment above a high school diploma was 59.2 percent, which improved to 64.6 percent by 2015. Whether the state is close to achieving the goal of “65 by 25” is hard to say as there is a large share of the population with Some college, no degree. In 2015, 19.2 percent of New Hampshire population age 25 or over had achieved Some college, no degree. The Georgetown University Center on Education and the Workforce estimated that 2.0 percent of New Hampshire residents had attained high-value postsecondary certificates as their highest earned credential in 2014.18 This means that a large group of residents could still gain from achieving a postsecondary credential or high-quality certificate.
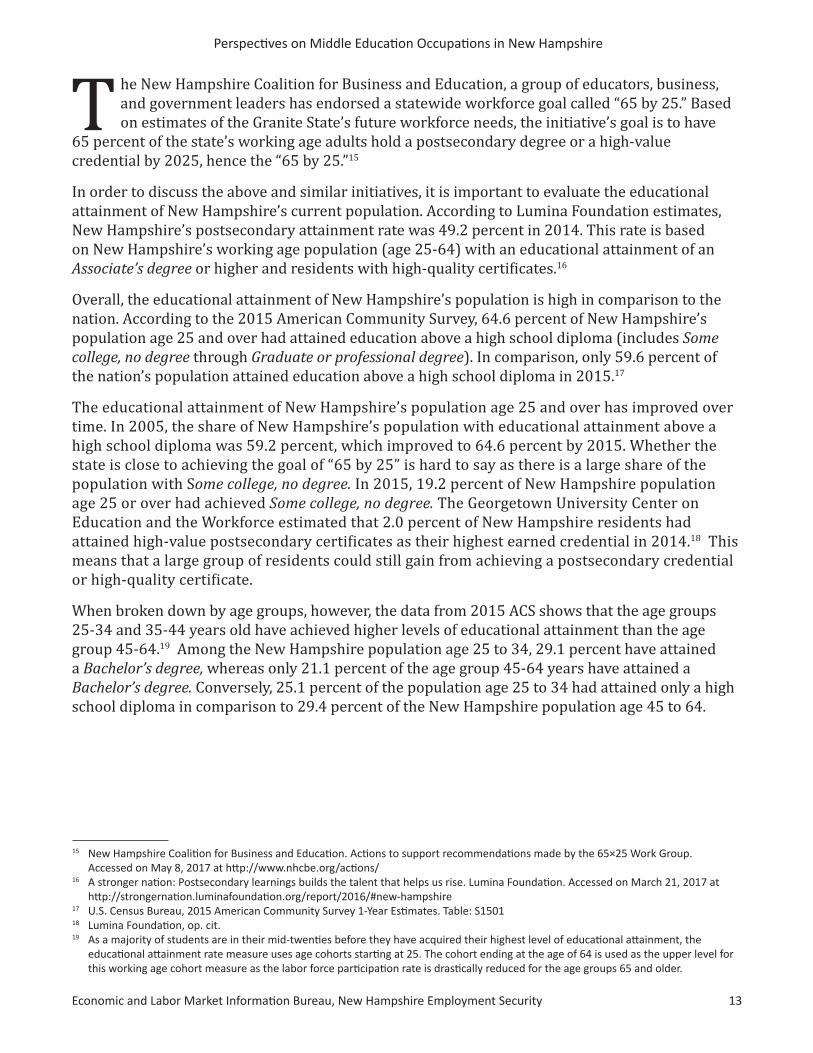
When broken down by age groups, however, the data from 2015 ACS shows that the age groups 25-34 and 35-44 years old have achieved higher levels of educational attainment than the age group 45-64.19 Among the New Hampshire population age 25 to 34, 29.1 percent have attained a Bachelor’s degree, whereas only 21.1 percent of the age group 45-64 years have attained a Bachelor’s degree. Conversely, 25.1 percent of the population age 25 to 34 had attained only a high school diploma in comparison to 29.4 percent of the New Hampshire population age 45 to 64.
T
15 New Hampshire Coaliti on for Business and Educati on. Acti ons to support recommendati ons made by the 65×25 Work Group. Accessed on May 8, 2017 at htt p://www.nhcbe.org/acti ons/
16 A stronger nati on: Postsecondary learnings builds the talent that helps us rise. Lumina Foundati on. Accessed on March 21, 2017 at htt p://strongernati on.luminafoundati on.org/report/2016/#new-hampshire
17 U.S. Census Bureau, 2015 American Community Survey 1-Year Esti mates. Table: S150118 Lumina Foundati on, op. cit.19 As a majority of students are in their mid-twenti es before they have acquired their highest level of educati onal att ainment, the
educati onal att ainment rate measure uses age cohorts starti ng at 25. The cohort ending at the age of 64 is used as the upper level for this working age cohort measure as the labor force parti cipati on rate is drasti cally reduced for the age groups 65 and older.

Perspecti ves on Middle Educati on Occupati ons in New Hampshire
14 Economic and Labor Market Informati on Bureau, New Hampshire Employment Security
The age cohort 25-34 years, though, has a lower share of the population with a Graduate or professional degree in comparison to the two older age cohorts. In many professional jobs, some work experience is encouraged before the person pursues a graduate degree; in other cases, workers are encouraged to pursue post-baccalaureate education later in life for professional development or other advancement opportunities.
When comparing these same three age cohorts over time, the ACS data show that educational attainment has risen for the two younger cohorts, but to a lesser degree for the age cohort 45 to 65 years. From 2005 to 2015, the share of the age cohort 25 to 34 years with educational attainment beyond high school increased from 64.2 percent to 69.7 percent - a gain of more than five percentage points. The age cohort 35 to 44 years experienced similar large improvements in educational attainment, whereas the age cohort 45 to 64 years experienced a more modest improvement of 2.7 percentage points. In the younger age cohort (age 25-34 years), the population with a Bachelor’s degree improved the most, whereas the largest improvement in the age cohort 35-44 years was for a Graduate and professional degree and for the oldest cohort, most gain was at the Associate’s degree level.
Source: U.S. Census Bureau, 2015 American Community Survey 1-Year Esti mates
4.6%
4.7%
4.3%
25.1%
23.6%
29.4%
19.6%
20.3%
19.0%
9.3%
10.5%
11.0%
29.1%
24.4%
21.1%
11.7%
15.3%
13.5%
0.0% 20.0% 40.0% 60.0% 80.0% 100.0%
25-34 years
35-44 years
45 -64 years
Less than 9th grade 9th to 12th grade, no diploma High School Graduate or GEDSome College, No Degree Associate's Degree Bachelor's DegreeGraduate or Professional
2015 Educational attainment for New Hampshire population age 25 to 64
Economic and Labor Market Informati on Bureau, New Hampshire Employment Security 15
Perspecti ves on Middle Educati on Occupati ons in New Hampshire
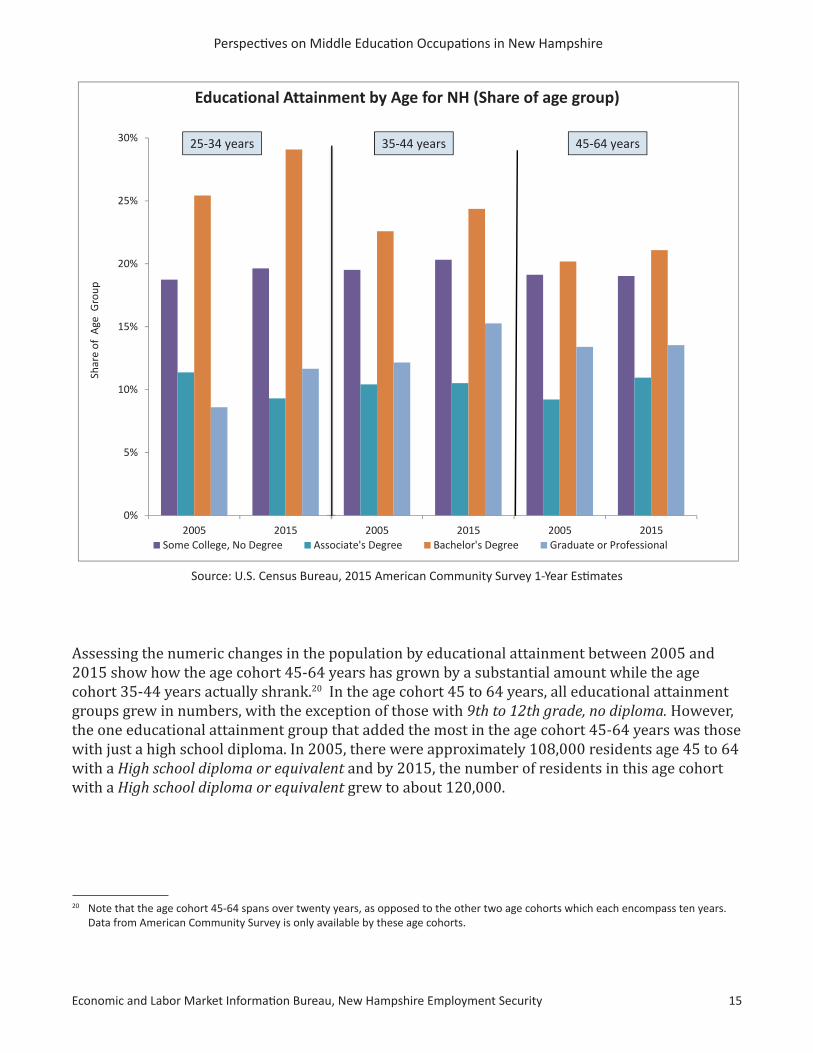
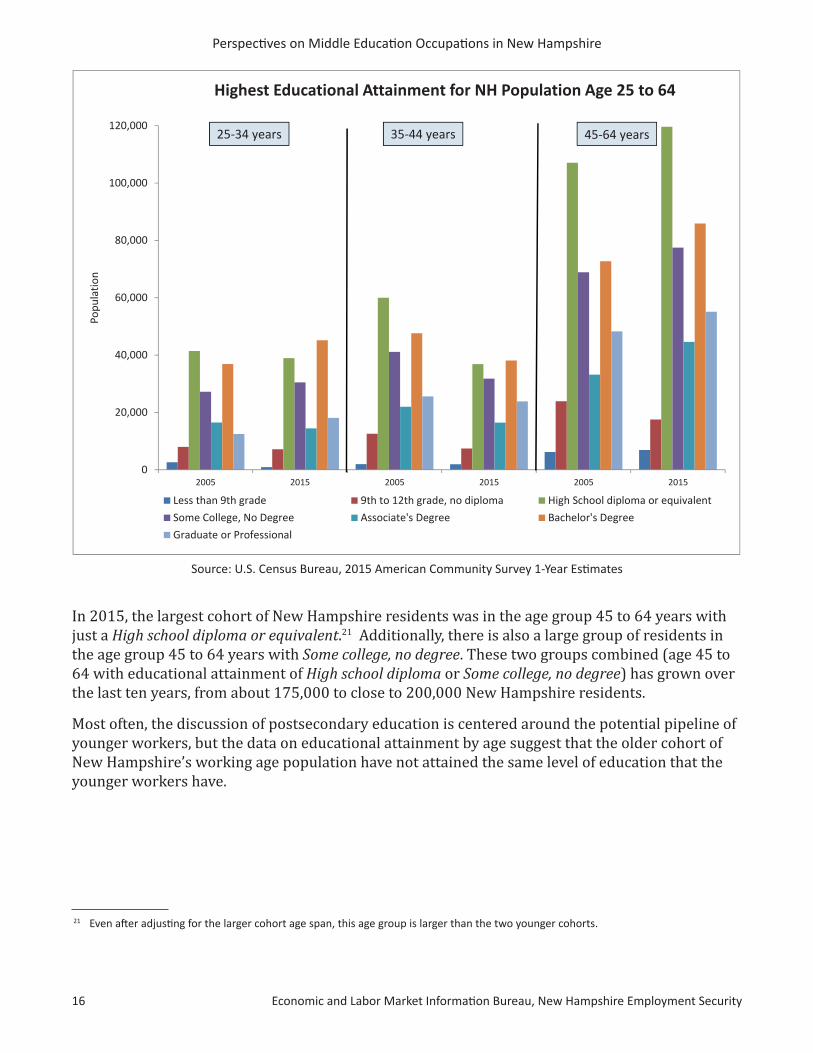
Assessing the numeric changes in the population by educational attainment between 2005 and 2015 show how the age cohort 45-64 years has grown by a substantial amount while the age cohort 35-44 years actually shrank.20 In the age cohort 45 to 64 years, all educational attainment groups grew in numbers, with the exception of those with 9th to 12th grade, no diploma. However, the one educational attainment group that added the most in the age cohort 45-64 years was those with just a high school diploma. In 2005, there were approximately 108,000 residents age 45 to 64 with a High school diploma or equivalent and by 2015, the number of residents in this age cohort with a High school diploma or equivalent grew to about 120,000.
20 Note that the age cohort 45-64 spans over twenty years, as opposed to the other two age cohorts which each encompass ten years. Data from American Community Survey is only available by these age cohorts.
Source: U.S. Census Bureau, 2015 American Community Survey 1-Year Esti mates
0%
5%
10%
15%
20%
25%
30%
2005 2015 2005 2015 2005 2015
Shar
e of
Age
Gro
upEducational Attainment by Age for NH (Share of age group)
Some College, No Degree Associate's Degree Bachelor's Degree Graduate or Professional
25-34 years 35-44 years 45-64 years
Perspecti ves on Middle Educati on Occupati ons in New Hampshire
16 Economic and Labor Market Informati on Bureau, New Hampshire Employment Security
In 2015, the largest cohort of New Hampshire residents was in the age group 45 to 64 years with just a High school diploma or equivalent.21 Additionally, there is also a large group of residents in the age group 45 to 64 years with Some college, no degree. These two groups combined (age 45 to 64 with educational attainment of High school diploma or Some college, no degree) has grown over the last ten years, from about 175,000 to close to 200,000 New Hampshire residents.
Most often, the discussion of postsecondary education is centered around the potential pipeline of younger workers, but the data on educational attainment by age suggest that the older cohort of New Hampshire’s working age population have not attained the same level of education that the younger workers have.
21 Even aft er adjusti ng for the larger cohort age span, this age group is larger than the two younger cohorts.
Source: U.S. Census Bureau, 2015 American Community Survey 1-Year Esti mates
0
20,000
40,000
60,000
80,000
100,000
120,000
2005 2015 2005 2015 2005 2015
Popu
latio
nHighest Educational Attainment for NH Population Age 25 to 64
Less than 9th grade 9th to 12th grade, no diploma High School diploma or equivalent
Some College, No Degree Associate's Degree Bachelor's Degree
Graduate or Professional
25-34 years 35-44 years 45-64 years
Economic and Labor Market Informati on Bureau, New Hampshire Employment Security 17
Perspecti ves on Middle Educati on Occupati ons in New Hampshire
22 U.S. Census Bureau, unpublished Current Populati on Survey data for 2016 (12 Month Average). Average weekly earnings for New Hampshire’s full-ti me workers in age cohort 25-34 was $933.10 in comparison to average weekly earnings for New Hampshire’s full-ti me workers of $1,278.30 for age cohort 45-54 and $1,201.70 for age cohort 55-64.
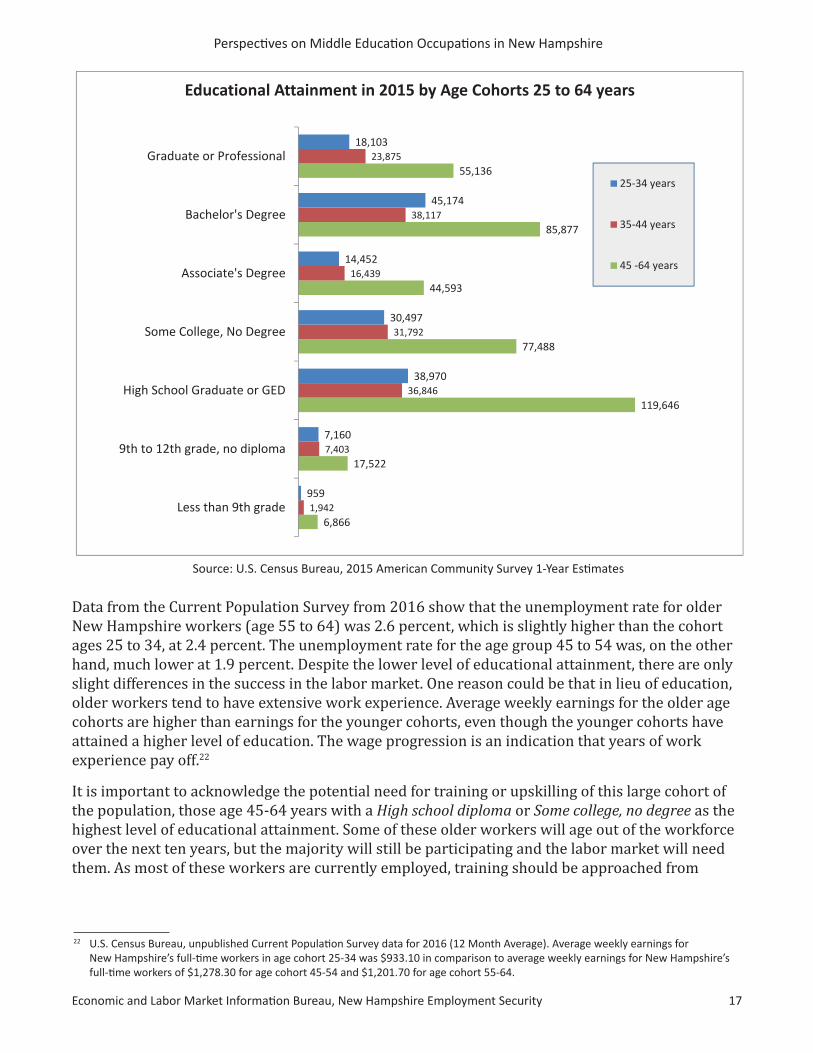
Data from the Current Population Survey from 2016 show that the unemployment rate for older New Hampshire workers (age 55 to 64) was 2.6 percent, which is slightly higher than the cohort ages 25 to 34, at 2.4 percent. The unemployment rate for the age group 45 to 54 was, on the other hand, much lower at 1.9 percent. Despite the lower level of educational attainment, there are only slight differences in the success in the labor market. One reason could be that in lieu of education, older workers tend to have extensive work experience. Average weekly earnings for the older age cohorts are higher than earnings for the younger cohorts, even though the younger cohorts have attained a higher level of education. The wage progression is an indication that years of work experience pay off.22
It is important to acknowledge the potential need for training or upskilling of this large cohort of the population, those age 45-64 years with a High school diploma or Some college, no degree as the highest level of educational attainment. Some of these older workers will age out of the workforce over the next ten years, but the majority will still be participating and the labor market will need them. As most of these workers are currently employed, training should be approached from
Source: U.S. Census Bureau, 2015 American Community Survey 1-Year Esti mates
6,866
17,522
119,646
77,488
44,593
85,877
55,136
1,942
7,403
36,846
31,792
16,439
38,117
23,875
959
7,160
38,970
30,497
14,452
45,174
18,103
Less than 9th grade
9th to 12th grade, no diploma
High School Graduate or GED
Some College, No Degree
Associate's Degree
Bachelor's Degree
Graduate or Professional
Educational Attainment in 2015 by Age Cohorts 25 to 64 years
25-34 years
35-44 years
45 -64 years
Perspecti ves on Middle Educati on Occupati ons in New Hampshire
18 Economic and Labor Market Informati on Bureau, New Hampshire Employment Security
the perspective of finding ways to provide these workers with additional skills and educational enhancement (upskilling) in their field of expertise. Rather than retraining these workers in new fields, efforts should be explored to find ways to build upon the applied knowledge these workers might have and provide additional skills that will be needed in the future labor market.
A look at the younger talent pipeline
Feeding the workforce with new, highly-educated workers is a somewhat complicated equation influenced by migration patterns. In the past, New Hampshire has relied on highly-educated workers moving into the state. As the state’s population growth has slowed, policymakers and other stakeholders have raised concerns that more should be done to retain and regain college graduates to the state.
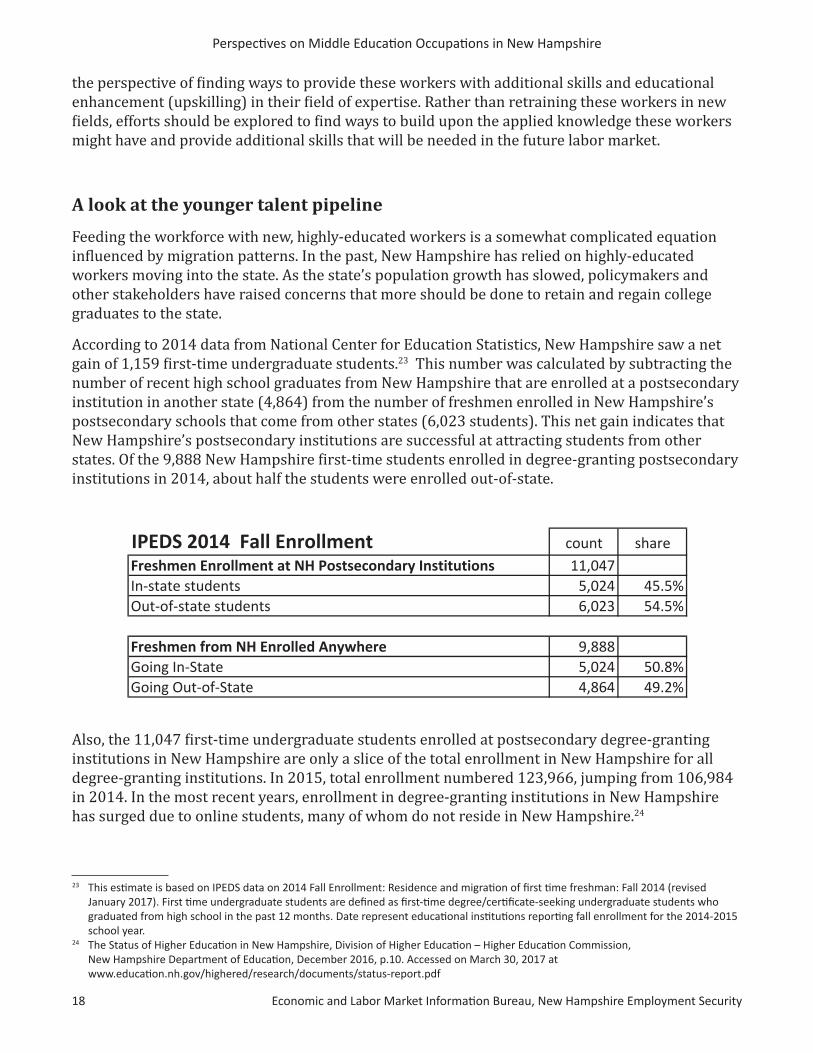
According to 2014 data from National Center for Education Statistics, New Hampshire saw a net gain of 1,159 first-time undergraduate students.23 This number was calculated by subtracting the number of recent high school graduates from New Hampshire that are enrolled at a postsecondary institution in another state (4,864) from the number of freshmen enrolled in New Hampshire’s postsecondary schools that come from other states (6,023 students). This net gain indicates that New Hampshire’s postsecondary institutions are successful at attracting students from other states. Of the 9,888 New Hampshire first-time students enrolled in degree-granting postsecondary institutions in 2014, about half the students were enrolled out-of-state.
Also, the 11,047 first-time undergraduate students enrolled at postsecondary degree-granting institutions in New Hampshire are only a slice of the total enrollment in New Hampshire for all degree-granting institutions. In 2015, total enrollment numbered 123,966, jumping from 106,984 in 2014. In the most recent years, enrollment in degree-granting institutions in New Hampshire has surged due to online students, many of whom do not reside in New Hampshire.24
23 This esti mate is based on IPEDS data on 2014 Fall Enrollment: Residence and migrati on of fi rst ti me freshman: Fall 2014 (revised January 2017). First ti me undergraduate students are defi ned as fi rst-ti me degree/certi fi cate-seeking undergraduate students who graduated from high school in the past 12 months. Date represent educati onal insti tuti ons reporti ng fall enrollment for the 2014-2015 school year.
24 The Status of Higher Educati on in New Hampshire, Division of Higher Educati on – Higher Educati on Commission, New Hampshire Department of Educati on, December 2016, p.10. Accessed on March 30, 2017 at www.educati on.nh.gov/highered/research/documents/status-report.pdf
IPEDS 2014 Fall Enrollment count shareFreshmen Enrollment at NH Postsecondary Institutions 11,047In-state students 5,024 45.5%Out-of-state students 6,023 54.5%
Freshmen from NH Enrolled Anywhere 9,888Going In-State 5,024 50.8%Going Out-of-State 4,864 49.2%
Economic and Labor Market Informati on Bureau, New Hampshire Employment Security 19
Perspecti ves on Middle Educati on Occupati ons in New Hampshire
This inflow and outflow of college bound population creates a positive dynamic for the economy as it promotes talent intermingling, encouraging the interchange of ideas. A consistent outpour of potential talent could be devastating for the state’s future workforce.
The educational attainment of the future workforce can be impacted by two strategies:
• One is to retain more of the students that came from other states to stay in New Hampshire after graduation.
• The other is to regain some of the New Hampshire students that went out-of-state to attend college.
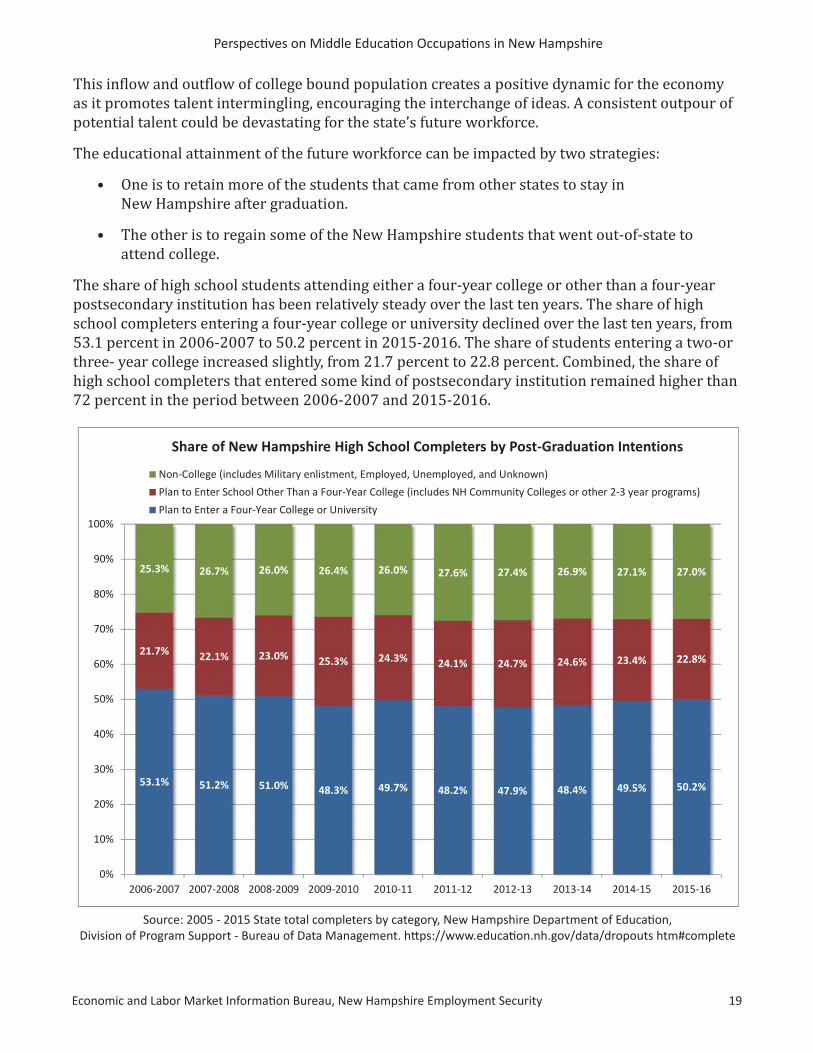
The share of high school students attending either a four-year college or other than a four-year postsecondary institution has been relatively steady over the last ten years. The share of high school completers entering a four-year college or university declined over the last ten years, from 53.1 percent in 2006-2007 to 50.2 percent in 2015-2016. The share of students entering a two-or three- year college increased slightly, from 21.7 percent to 22.8 percent. Combined, the share of high school completers that entered some kind of postsecondary institution remained higher than 72 percent in the period between 2006-2007 and 2015-2016.
Source: 2005 - 2015 State total completers by category, New Hampshire Department of Educati on, Division of Program Support - Bureau of Data Management. htt ps://www.educati on.nh.gov/data/dropouts htm#complete
53.1% 51.2% 51.0% 48.3% 49.7% 48.2% 47.9% 48.4% 49.5% 50.2%
21.7% 22.1% 23.0% 25.3% 24.3% 24.1% 24.7% 24.6% 23.4% 22.8%
25.3% 26.7% 26.0% 26.4% 26.0% 27.6% 27.4% 26.9% 27.1% 27.0%
0%
10%
20%
30%
40%
50%
60%
70%
80%
90%
100%
2006-2007 2007-2008 2008-2009 2009-2010 2010-11 2011-12 2012-13 2013-14 2014-15 2015-16
Share of New Hampshire High School Completers by Post-Graduation Intentions
Non-College (includes Military enlistment, Employed, Unemployed, and Unknown)
Plan to Enter School Other Than a Four-Year College (includes NH Community Colleges or other 2-3 year programs)
Plan to Enter a Four-Year College or University
Perspecti ves on Middle Educati on Occupati ons in New Hampshire
20 Economic and Labor Market Informati on Bureau, New Hampshire Employment Security
25 According to Census populati on esti mates, there were 325,802 persons under age 20 in 2010, in comparison to 301,754 in 2015.
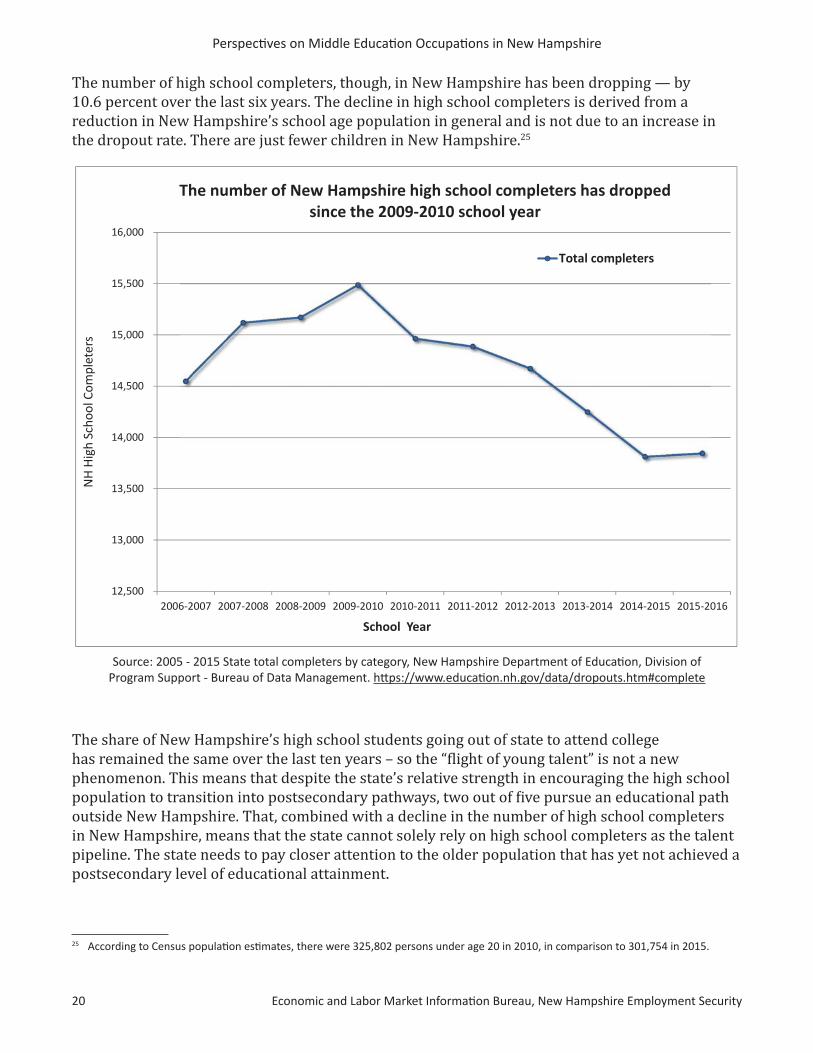
The number of high school completers, though, in New Hampshire has been dropping — by 10.6 percent over the last six years. The decline in high school completers is derived from a reduction in New Hampshire’s school age population in general and is not due to an increase in the dropout rate. There are just fewer children in New Hampshire.25
The share of New Hampshire’s high school students going out of state to attend college has remained the same over the last ten years – so the “flight of young talent” is not a new phenomenon. This means that despite the state’s relative strength in encouraging the high school population to transition into postsecondary pathways, two out of five pursue an educational path outside New Hampshire. That, combined with a decline in the number of high school completers in New Hampshire, means that the state cannot solely rely on high school completers as the talent pipeline. The state needs to pay closer attention to the older population that has yet not achieved a postsecondary level of educational attainment.
Source: 2005 - 2015 State total completers by category, New Hampshire Department of Educati on, Division of Program Support - Bureau of Data Management. htt ps://www.educati on.nh.gov/data/dropouts.htm#complete
12,500
13,000
13,500
14,000
14,500
15,000
15,500
16,000
2006-2007 2007-2008 2008-2009 2009-2010 2010-2011 2011-2012 2012-2013 2013-2014 2014-2015 2015-2016
NH
Hig
h Sc
hool
Com
plet
ers
School Year
The number of New Hampshire high school completers has dropped since the 2009-2010 school year
Total completers
Economic and Labor Market Informati on Bureau, New Hampshire Employment Security 21
Perspecti ves on Middle Educati on Occupati ons in New Hampshire
26 The Status of Higher Educati on in New Hampshire, Division of Higher Educati on – Higher Educati on Commission, New Hampshire Department of Educati on. Op. cit., p. 10.
The above data on high school completers is only an indication of where the New Hampshire high school graduates start out. Some postsecondary students transfer to other schools and some do not complete college. Fortunately, New Hampshire four-year public colleges have the second highest college completion rates in the nation, at 90.2 percent for full-time students.26 Still, about one in five of New Hampshire’s residents has attained Some college, no degree, but has not completed a college degree.
There is, therefore, room for some creative thinking to find new ways to connect persons with Some college, no degree with New Hampshire’s postsecondary institutions. Converting prior credits obtained into partial degrees or assessing life and work experience in lieu of classroom studies could help these individuals back on a pathway to completing an Associate’s degree or a high-value certification.

Perspecti ves on Middle Educati on Occupati ons in New Hampshire
22 Economic and Labor Market Informati on Bureau, New Hampshire Employment Security
Economic and Labor Market Informati on Bureau, New Hampshire Employment Security 23
Perspecti ves on Middle Educati on Occupati ons in New Hampshire
Comparing Worker Educati on to Job Expectati ons
How does the educati onal att ainment of the current workforce compare to the level of educati on expected by employers? To help answer this questi on, the current educati onal att ainment of workers in middle educati on occupati ons, based on the U.S. Census Bureau’s Equal Employment Opportunity (EEO) tabulati on for New Hampshire, was compared to the preferred level of educati on for those same occupati ons found in online job ads.
Author: Anita Josten, Research Analyst

Perspecti ves on Middle Educati on Occupati ons in New Hampshire
24 Economic and Labor Market Informati on Bureau, New Hampshire Employment Security
Economic and Labor Market Informati on Bureau, New Hampshire Employment Security 25
Perspecti ves on Middle Educati on Occupati ons in New Hampshire
ew Hampshire’s adult population is well-educated. Among residents age 18 and over, 63 percent have completed some postsecondary education. Compared to other states and the District of Columbia, the share of New Hampshire residents age 18 and over
completing any postsecondary education ranked 11th highest.27 Roughly 60 percent of New Hampshire residents age 18 years and older had attained at least a high school diploma up to some college or an Associate’s degree. Compared to other states, the share of residents with this level of education in New Hampshire ranked 35th.
How does the educational attainment of those currently in the workforce compare to the education required for advertised jobs? By comparing the educational attainment of workers by occupation to preferred level of education in job ads, the potential need for improvement in educational attainment can be assessed.
Assessment of current worker educational attainment compared to educational requirements of jobs
To compare worker educational attainment to the education preferred by employers, three data sources were used. First, middle education occupations were selected based on the education, related work experience, and post-hire training values established by the U.S. Bureau of Labor Statistics to identify typical preparation for entry-level employment. The selected occupations were then compared the U.S. Census Bureau’s Equal Employment Opportunity (EEO) Tabulation for New Hampshire, which was used as a proxy for occupational employment by educational attainment. The EEO tabulation estimates the number of workers by educational attainment for occupations. Finally, using Labor/Insight, Burning Glass Technologies, available online job postings were evaluated for the same selected occupations to identify employers’ preferred level of education for job applicants.
This comparison provides an assessment of the differences between worker educational attainment and employer preferences for job applicants in middle education occupations.
N
27 2011-2015 American Community Survey 5-Year Esti mates, Table S1501: EDUCATIONAL ATTAINMENT
Perspecti ves on Middle Educati on Occupati ons in New Hampshire
26 Economic and Labor Market Informati on Bureau, New Hampshire Employment Security
Education and Training Comparison Methodology
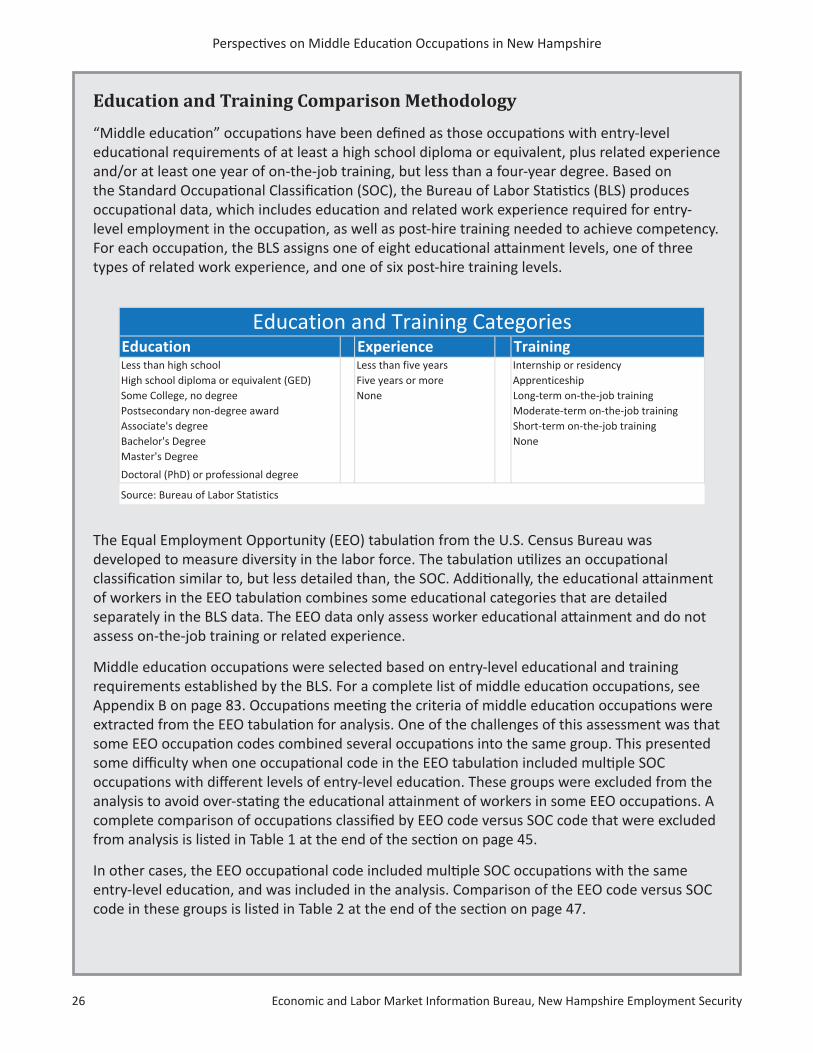
“Middle educati on” occupati ons have been defi ned as those occupati ons with entry-level educati onal requirements of at least a high school diploma or equivalent, plus related experience and/or at least one year of on-the-job training, but less than a four-year degree. Based on the Standard Occupati onal Classifi cati on (SOC), the Bureau of Labor Stati sti cs (BLS) produces occupati onal data, which includes educati on and related work experience required for entry-level employment in the occupati on, as well as post-hire training needed to achieve competency. For each occupati on, the BLS assigns one of eight educati onal att ainment levels, one of three types of related work experience, and one of six post-hire training levels.
The Equal Employment Opportunity (EEO) tabulati on from the U.S. Census Bureau was developed to measure diversity in the labor force. The tabulati on uti lizes an occupati onal classifi cati on similar to, but less detailed than, the SOC. Additi onally, the educati onal att ainment of workers in the EEO tabulati on combines some educati onal categories that are detailed separately in the BLS data. The EEO data only assess worker educati onal att ainment and do not assess on-the-job training or related experience.
Middle educati on occupati ons were selected based on entry-level educati onal and training requirements established by the BLS. For a complete list of middle educati on occupati ons, see Appendix B on page 83. Occupati ons meeti ng the criteria of middle educati on occupati ons were extracted from the EEO tabulati on for analysis. One of the challenges of this assessment was that some EEO occupati on codes combined several occupati ons into the same group. This presented some diffi culty when one occupati onal code in the EEO tabulati on included multi ple SOC occupati ons with diff erent levels of entry-level educati on. These groups were excluded from the analysis to avoid over-stati ng the educati onal att ainment of workers in some EEO occupati ons. A complete comparison of occupati ons classifi ed by EEO code versus SOC code that were excluded from analysis is listed in Table 1 at the end of the secti on on page 45.
In other cases, the EEO occupati onal code included multi ple SOC occupati ons with the same entry-level educati on, and was included in the analysis. Comparison of the EEO code versus SOC code in these groups is listed in Table 2 at the end of the secti on on page 47.
Education Experience TrainingLess than high school Less than five years Internship or residencyHigh school diploma or equivalent (GED) Five years or more ApprenticeshipSome College, no degree None Long-term on-the-job trainingPostsecondary non-degree award Moderate-term on-the-job trainingAssociate's degree Short-term on-the-job trainingBachelor's Degree NoneMaster's Degree
Doctoral (PhD) or professional degree
Source: Bureau of Labor Statistics
Education and Training Categories
Economic and Labor Market Informati on Bureau, New Hampshire Employment Security 27
Perspecti ves on Middle Educati on Occupati ons in New Hampshire
Worker counts in the EEO data were summed for EEO occupations in the same education and training category. Percentages were based on the total number of workers within each education and training group.
To compare the educational attainment of workers to employer expectations of worker education, New Hampshire online job ads for the 12-month period of April 2016 to March 2017 were extracted from Labor/Insight, Burning Glass Technologies. In an effort to keep the occupational content consistent between the sources, selected job ads were for the same occupations used from the EEO tabulations. The same methodology of eliminating occupation groups that included occupations with multiple levels of education was used. Percentages were based on the total number of corresponding online job ads extracted.
The EEO Tabulation is a custom sum of data from the 2006-2010 American Community Survey 5-Year Estimates, conducted by the U.S. Census Bureau. Data include civilians employed at work who are 16 years of age and over. In the EEO Tabulation, detailed occupations may be collapsed as a method of disclosure avoidance.
EEO tabulations were produced as part of the 2006-2010 American Community Survey 5-Year Estimates. Source tables include:
• S1501: EDUCATIONAL ATTAINMENT 2011-2015 American Community Survey 5-Year Estimates Population age 18 and over
• EEO-ALL08W-Geography-New Hampshire Estimate-Estimate: EEO 8w. Detailed Census Occupation by . . . Educational Attainment (5), Sex, and Race/Ethnicity for Worksite Geography, Total Population-Universe: . Civilians employed at work 16 years and over
• EEO 9w. Detailed Census Occupation by Educational Attainment (6), Sex, and Race/Ethnicity for Worksite Geography, Total Population Universe: Civilians employed at work 16 years and over
Perspecti ves on Middle Educati on Occupati ons in New Hampshire
28 Economic and Labor Market Informati on Bureau, New Hampshire Employment Security
High School Diploma or Equivalent plus Related Work Experience
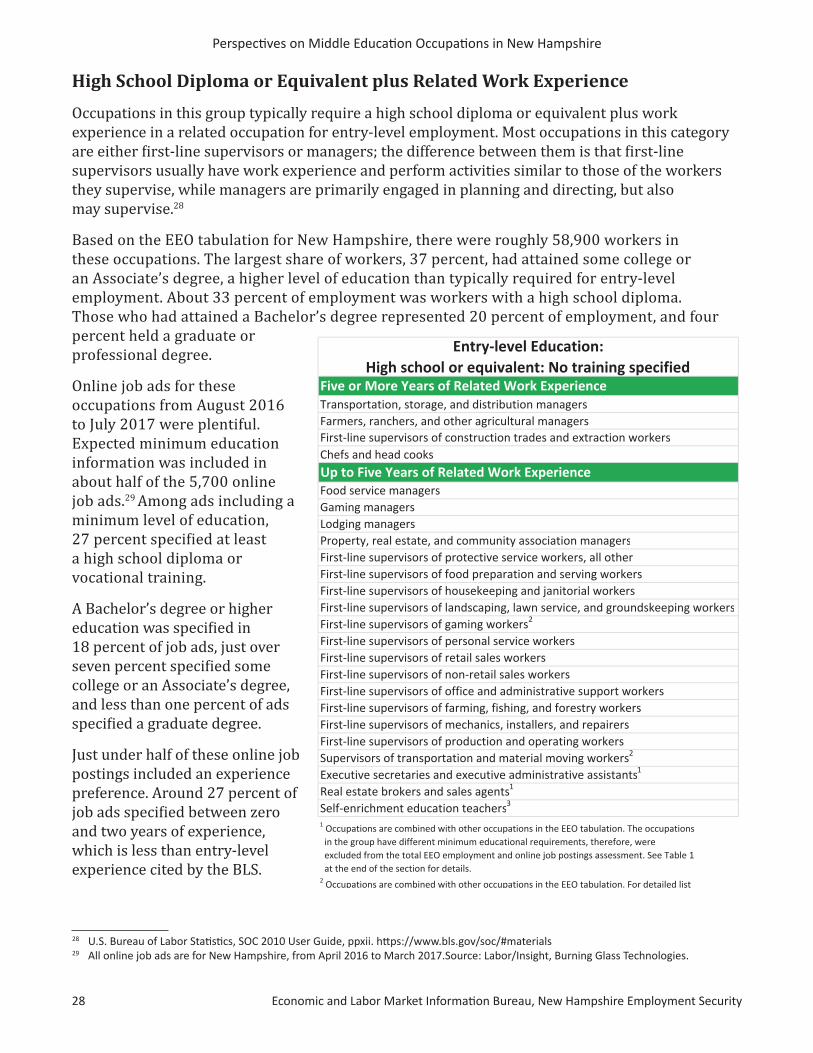
Occupations in this group typically require a high school diploma or equivalent plus work experience in a related occupation for entry-level employment. Most occupations in this category are either first-line supervisors or managers; the difference between them is that first-line supervisors usually have work experience and perform activities similar to those of the workers they supervise, while managers are primarily engaged in planning and directing, but also may supervise.28
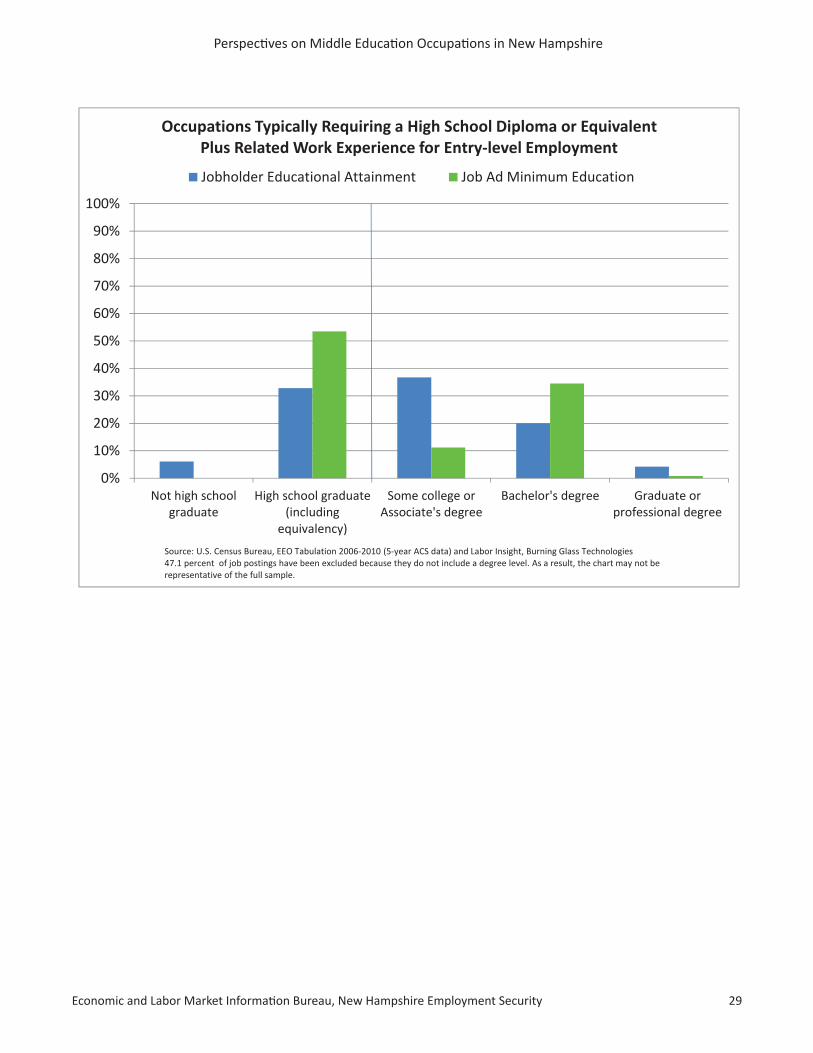
Based on the EEO tabulation for New Hampshire, there were roughly 58,900 workers in these occupations. The largest share of workers, 37 percent, had attained some college or an Associate’s degree, a higher level of education than typically required for entry-level employment. About 33 percent of employment was workers with a high school diploma. Those who had attained a Bachelor’s degree represented 20 percent of employment, and four percent held a graduate or professional degree.
Online job ads for these occupations from August 2016 to July 2017 were plentiful. Expected minimum education information was included in about half of the 5,700 online job ads.29 Among ads including a minimum level of education, 27 percent specified at least a high school diploma or vocational training.
A Bachelor’s degree or higher education was specified in 18 percent of job ads, just over seven percent specified some college or an Associate’s degree, and less than one percent of ads specified a graduate degree.
Just under half of these online job postings included an experience preference. Around 27 percent of job ads specified between zero and two years of experience, which is less than entry-level experience cited by the BLS.
28 U.S. Bureau of Labor Stati sti cs, SOC 2010 User Guide, ppxii. htt ps://www.bls.gov/soc/#materials 29 All online job ads are for New Hampshire, from April 2016 to March 2017.Source: Labor/Insight, Burning Glass Technologies.
Five or More Years of Related Work Experience Transportation, storage, and distribution managersFarmers, ranchers, and other agricultural managersFirst-line supervisors of construction trades and extraction workersChefs and head cooksUp to Five Years of Related Work Experience Food service managersGaming managersLodging managersProperty, real estate, and community association managersFirst-line supervisors of protective service workers, all otherFirst-line supervisors of food preparation and serving workersFirst-line supervisors of housekeeping and janitorial workersFirst-line supervisors of landscaping, lawn service, and groundskeeping workersFirst-line supervisors of gaming workers2
First-line supervisors of personal service workersFirst-line supervisors of retail sales workersFirst-line supervisors of non-retail sales workersFirst-line supervisors of office and administrative support workersFirst-line supervisors of farming, fishing, and forestry workersFirst-line supervisors of mechanics, installers, and repairersFirst-line supervisors of production and operating workersSupervisors of transportation and material moving workers2
Executive secretaries and executive administrative assistants1
Real estate brokers and sales agents1
Self-enrichment education teachers3
1 Occupations are combined with other occupations in the EEO tabulation. The occupations in the group have different minimum educational requirements, therefore, were excluded from the total EEO employment and online job postings assessment. See Table 1 at the end of the section for details. 2 Occupations are combined with other occupations in the EEO tabulation. For detailed list
Entry-level Education: High school or equivalent: No training specified
Economic and Labor Market Informati on Bureau, New Hampshire Employment Security 29
Perspecti ves on Middle Educati on Occupati ons in New Hampshire
0%
10%
20%
30%
40%
50%
60%
70%
80%
90%
100%
Not high schoolgraduate
High school graduate(including
equivalency)
Some college orAssociate's degree
Bachelor's degree Graduate orprofessional degree
Source: U.S. Census Bureau, EEO Tabulation 2006-2010 (5-year ACS data) and Labor Insight, Burning Glass Technologies 47.1 percent of job postings have been excluded because they do not include a degree level. As a result, the chart may not be representative of the full sample.
Occupations Typically Requiring a High School Diploma or Equivalent Plus Related Work Experience for Entry-level Employment
Jobholder Educational Attainment Job Ad Minimum Education

Perspecti ves on Middle Educati on Occupati ons in New Hampshire
30 Economic and Labor Market Informati on Bureau, New Hampshire Employment Security
30 U.S. Bureau of Labor Stati sti cs, Employment Projecti ons Occupati onal Data Defi niti ons. htt ps://www.bls.gov/emp/ep_nem_defi niti ons.htm#educati on.
High School Diploma or Equivalent, Related Work Experience, and Moderate-Term On-the-Job Training
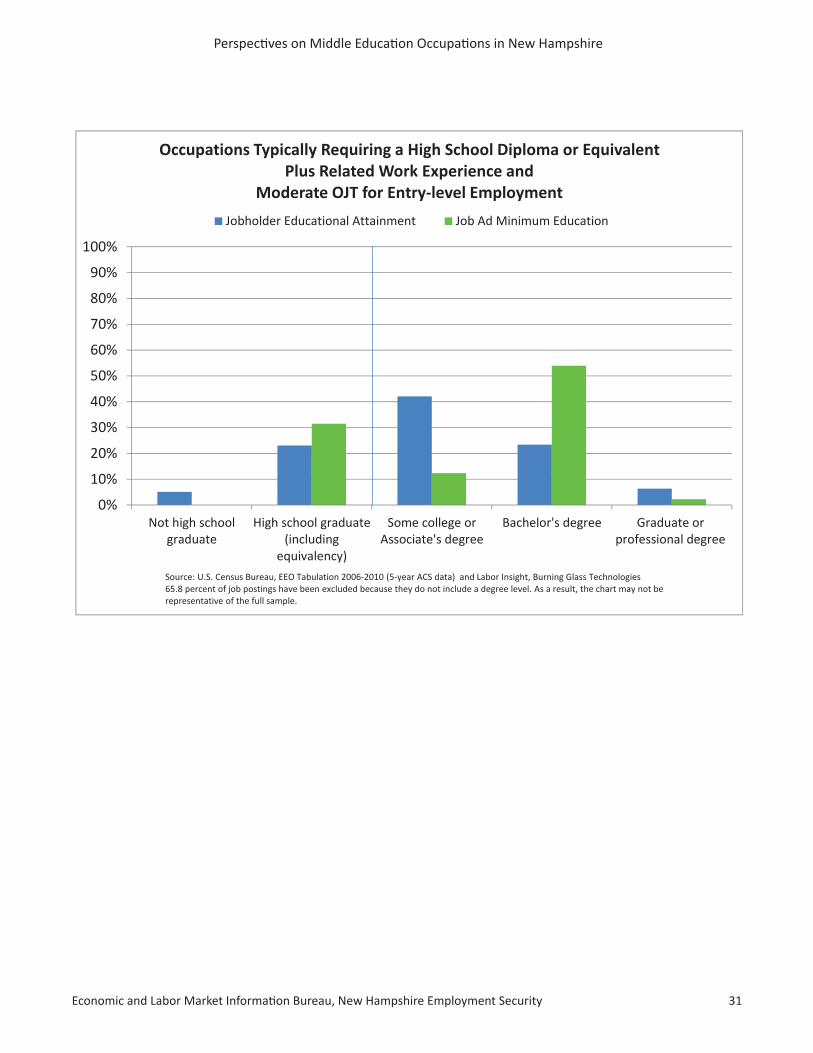
Occupations in this group require a high school diploma, one to 12 months of combined on-the-job experience and informal training, and related work experience of either up to five years or five years or more. Skills learned in on-the-job training are mostly transferable skills associated with the occupation, as opposed to job specific.30 This education and training group includes occupations such as heavy machinery operators, crime investigators, and flight attendants.
Based on the EEO tabulation, slightly more than 2,400 individuals were employed in these occupations in New Hampshire. Almost one-quarter of individuals held the entry-level education of a high school diploma. The largest share of individuals working in these jobs, over 40 percent, had some college or an Associate’s degree. Another 30 percent had attained a Bachelor’s degree or higher education.
Just over one-third of the 234 jobs ads from August 2016 through July 2017 included a preferred level of education from the employer. More than half of job ads including an educational preference specified a Bachelor’s degree or higher, while just over 30 percent indicated a high school diploma or vocational training. Most job ads indicated a preference for more than the entry-level education cited by the BLS, and may indicate a mismatch between the educational levels for which employers advertise compared to typical entry-level education identified by the BLS. Employers may have difficulty filling these positions if expecting workers to have this level of educational attainment.
Among job ads including a preferred experience level, 31 percent of job ads specified zero to two years of experience, and 42 percent specified three to five years of experience, both within the entry-level experience range identified by the BLS.
Up to Five Years of Related Work ExperienceFirst-line supervisors of correctional officersFirst-line supervisors of police and detectivesDetectives and criminal investigatorsPrivate detectives and investigatorsForest fire inspectors and prevention specialists1
Flight attendantsLocomotive engineers and operators2
Crane and tower operatorsDredge, excavating, and loading machine operators2
Postmasters and mail superintendents3
Five or More Years of Related Work Experience Construction and building inspectors1 Occupations are combined with other occupations in the EEO tabulation. The occupations in the group have different minimum educational requirements, therefore, were excluded from the total EEO employment and online job postings assessment. See Table 1 at the end of the section for details. 2 Occupations are combined with other occupations in the EEO tabulation. For detailed list of occupations in the combinations, see Table 2 at the end of this section.3 Occupations not listed separately in the EEO tabulation.
Entry-level Education: High school or equivalent plus Moderate-term on-the-job training
Economic and Labor Market Informati on Bureau, New Hampshire Employment Security 31
Perspecti ves on Middle Educati on Occupati ons in New Hampshire
0%
10%
20%
30%
40%
50%
60%
70%
80%
90%
100%
Not high schoolgraduate
High school graduate(including
equivalency)
Some college orAssociate's degree
Bachelor's degree Graduate orprofessional degree
Source: U.S. Census Bureau, EEO Tabulation 2006-2010 (5-year ACS data) and Labor Insight, Burning Glass Technologies65.8 percent of job postings have been excluded because they do not include a degree level. As a result, the chart may not berepresentative of the full sample.
Occupations Typically Requiring a High School Diploma or Equivalent Plus Related Work Experience and
Moderate OJT for Entry-level Employment
Jobholder Educational Attainment Job Ad Minimum Education
Perspecti ves on Middle Educati on Occupati ons in New Hampshire
32 Economic and Labor Market Informati on Bureau, New Hampshire Employment Security
31 U.S. Bureau of Labor Stati sti cs, Employment Projecti ons. op. cit.
High School Diploma or Equivalent and Long-Term On-the-Job Training
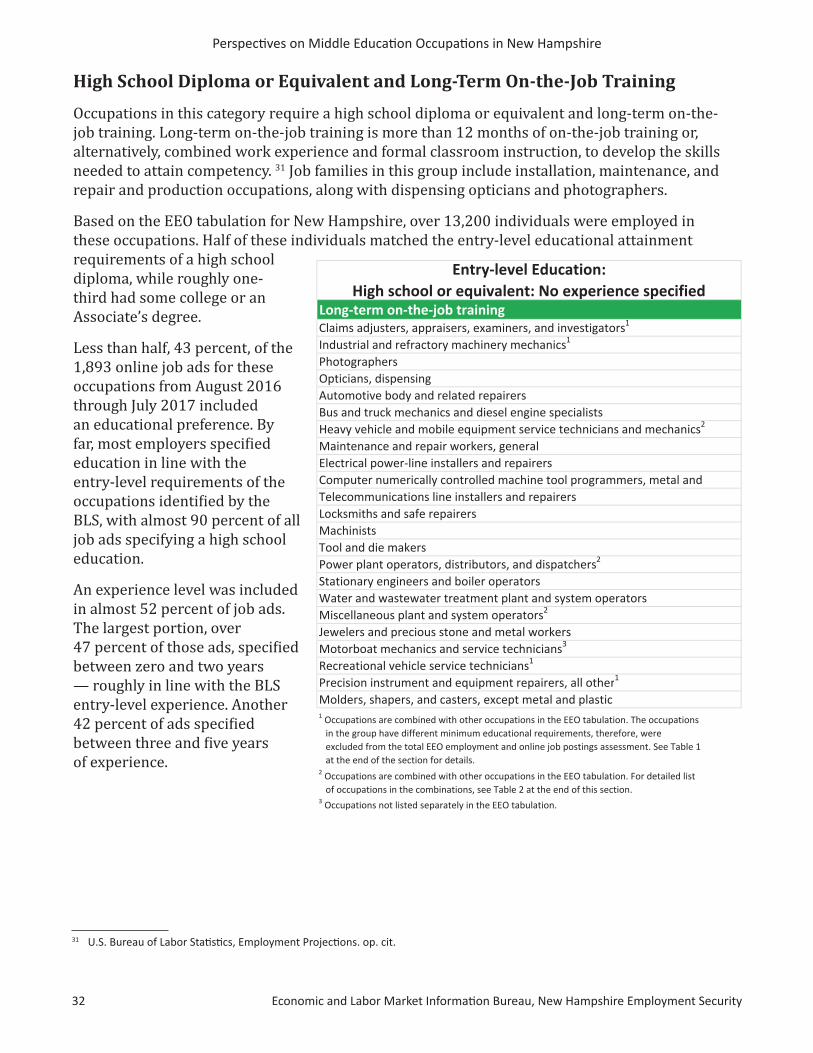
Occupations in this category require a high school diploma or equivalent and long-term on-the-job training. Long-term on-the-job training is more than 12 months of on-the-job training or, alternatively, combined work experience and formal classroom instruction, to develop the skills needed to attain competency. 31 Job families in this group include installation, maintenance, and repair and production occupations, along with dispensing opticians and photographers.
Based on the EEO tabulation for New Hampshire, over 13,200 individuals were employed in these occupations. Half of these individuals matched the entry-level educational attainment requirements of a high school diploma, while roughly one-third had some college or an Associate’s degree.
Less than half, 43 percent, of the 1,893 online job ads for these occupations from August 2016 through July 2017 included an educational preference. By far, most employers specified education in line with the entry-level requirements of the occupations identified by the BLS, with almost 90 percent of all job ads specifying a high school education.
An experience level was included in almost 52 percent of job ads. The largest portion, over 47 percent of those ads, specified between zero and two years — roughly in line with the BLS entry-level experience. Another 42 percent of ads specified between three and five years of experience.
Long-term on-the-job training Claims adjusters, appraisers, examiners, and investigators1
Industrial and refractory machinery mechanics1
PhotographersOpticians, dispensingAutomotive body and related repairersBus and truck mechanics and diesel engine specialistsHeavy vehicle and mobile equipment service technicians and mechanics2
Maintenance and repair workers, generalElectrical power-line installers and repairersComputer numerically controlled machine tool programmers, metal and Telecommunications line installers and repairersLocksmiths and safe repairersMachinistsTool and die makersPower plant operators, distributors, and dispatchers2
Stationary engineers and boiler operatorsWater and wastewater treatment plant and system operatorsMiscellaneous plant and system operators2
Jewelers and precious stone and metal workersMotorboat mechanics and service technicians3
Recreational vehicle service technicians1
Precision instrument and equipment repairers, all other1
Molders, shapers, and casters, except metal and plastic1 Occupations are combined with other occupations in the EEO tabulation. The occupations in the group have different minimum educational requirements, therefore, were excluded from the total EEO employment and online job postings assessment. See Table 1 at the end of the section for details. 2 Occupations are combined with other occupations in the EEO tabulation. For detailed list of occupations in the combinations, see Table 2 at the end of this section.3 Occupations not listed separately in the EEO tabulation.
Entry-level Education: High school or equivalent: No experience specified

Economic and Labor Market Informati on Bureau, New Hampshire Employment Security 33
Perspecti ves on Middle Educati on Occupati ons in New Hampshire
0%
10%
20%
30%
40%
50%
60%
70%
80%
90%
100%
Not high schoolgraduate
High school graduate(including
equivalency)
Some college orAssociate's degree
Bachelor's degree Graduate orprofessional degree
Source: U.S. Census Bureau, EEO Tabulation 2006-2010 (5-year ACS data) and Labor Insight, Burning Glass Technologies57.0 percent of job postings have been excluded because they do not include a degree level. As a result, the chart may not be representative of the full sample.
Occupations Typically Requiring a High School Diploma or Equivalent Plus Long-Term OJT for Entry-level Employment
Jobholder Educational Attainment Job Ad Minimum Education
Perspecti ves on Middle Educati on Occupati ons in New Hampshire
34 Economic and Labor Market Informati on Bureau, New Hampshire Employment Security
High School Diploma or Equivalent and Apprenticeship
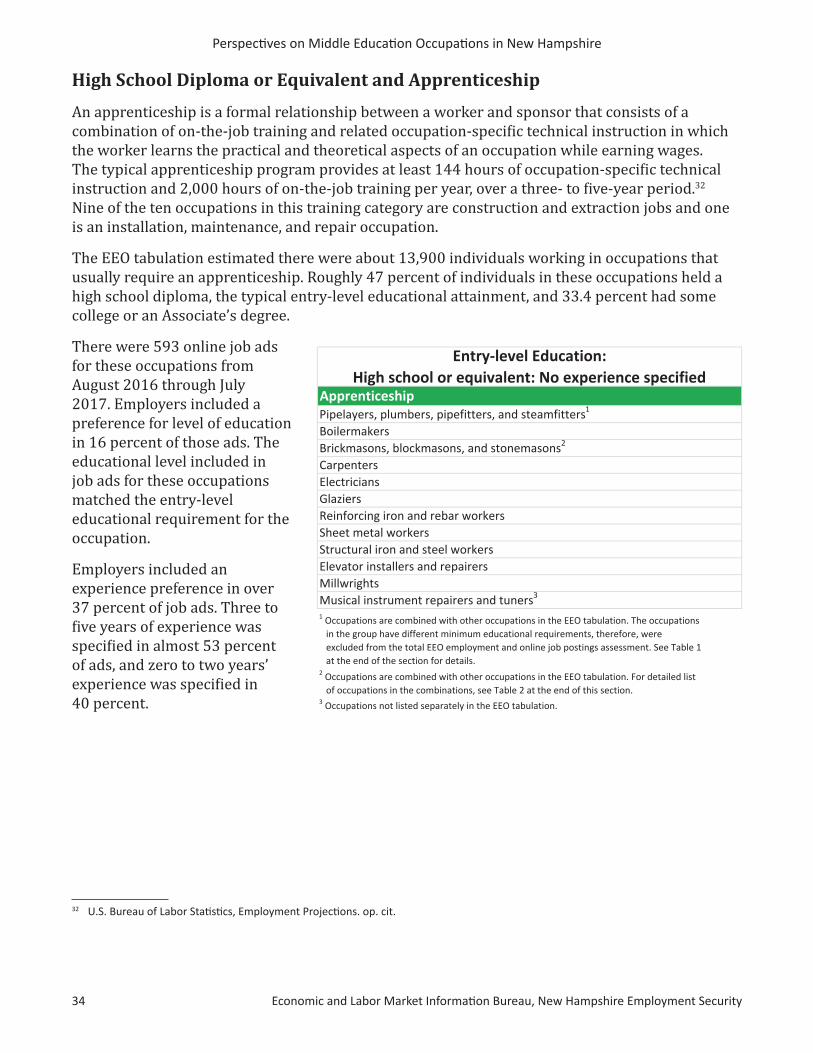
An apprenticeship is a formal relationship between a worker and sponsor that consists of a combination of on-the-job training and related occupation-specific technical instruction in which the worker learns the practical and theoretical aspects of an occupation while earning wages. The typical apprenticeship program provides at least 144 hours of occupation-specific technical instruction and 2,000 hours of on-the-job training per year, over a three- to five-year period.32 Nine of the ten occupations in this training category are construction and extraction jobs and one is an installation, maintenance, and repair occupation.
The EEO tabulation estimated there were about 13,900 individuals working in occupations that usually require an apprenticeship. Roughly 47 percent of individuals in these occupations held a high school diploma, the typical entry-level educational attainment, and 33.4 percent had some college or an Associate’s degree.
There were 593 online job ads for these occupations from August 2016 through July 2017. Employers included a preference for level of education in 16 percent of those ads. The educational level included in job ads for these occupations matched the entry-level educational requirement for the occupation.
Employers included an experience preference in over 37 percent of job ads. Three to five years of experience was specified in almost 53 percent of ads, and zero to two years’ experience was specified in 40 percent.
32 U.S. Bureau of Labor Stati sti cs, Employment Projecti ons. op. cit.
ApprenticeshipPipelayers, plumbers, pipefitters, and steamfitters1
BoilermakersBrickmasons, blockmasons, and stonemasons2
CarpentersElectriciansGlaziersReinforcing iron and rebar workersSheet metal workersStructural iron and steel workersElevator installers and repairersMillwrightsMusical instrument repairers and tuners3
1 Occupations are combined with other occupations in the EEO tabulation. The occupations in the group have different minimum educational requirements, therefore, were excluded from the total EEO employment and online job postings assessment. See Table 1 at the end of the section for details. 2 Occupations are combined with other occupations in the EEO tabulation. For detailed list of occupations in the combinations, see Table 2 at the end of this section.3 Occupations not listed separately in the EEO tabulation.
Entry-level Education: High school or equivalent: No experience specified

Economic and Labor Market Informati on Bureau, New Hampshire Employment Security 35
Perspecti ves on Middle Educati on Occupati ons in New Hampshire
0%
10%
20%
30%
40%
50%
60%
70%
80%
90%
100%
Not high schoolgraduate
High school graduate(including
equivalency)
Some college orAssociate's degree
Bachelor's degree Graduate orprofessional degree
Source: U.S. Census Bureau, EEO Tabulation 2006-2010 (5-year ACS data) and Labor Insight, Burning Glass Technologies84.4 percent of job postings have been excluded because they do not include a degree level. As a result, the chart may not berepresentative of the full sample.
Occupations Typically Requiring a High School Diploma or Equivalent Plus an Apprenticeship for Entry-level Employment
Jobholder Educational Attainment Job Ad Minimum Education
Perspecti ves on Middle Educati on Occupati ons in New Hampshire
36 Economic and Labor Market Informati on Bureau, New Hampshire Employment Security
Postsecondary Certificate
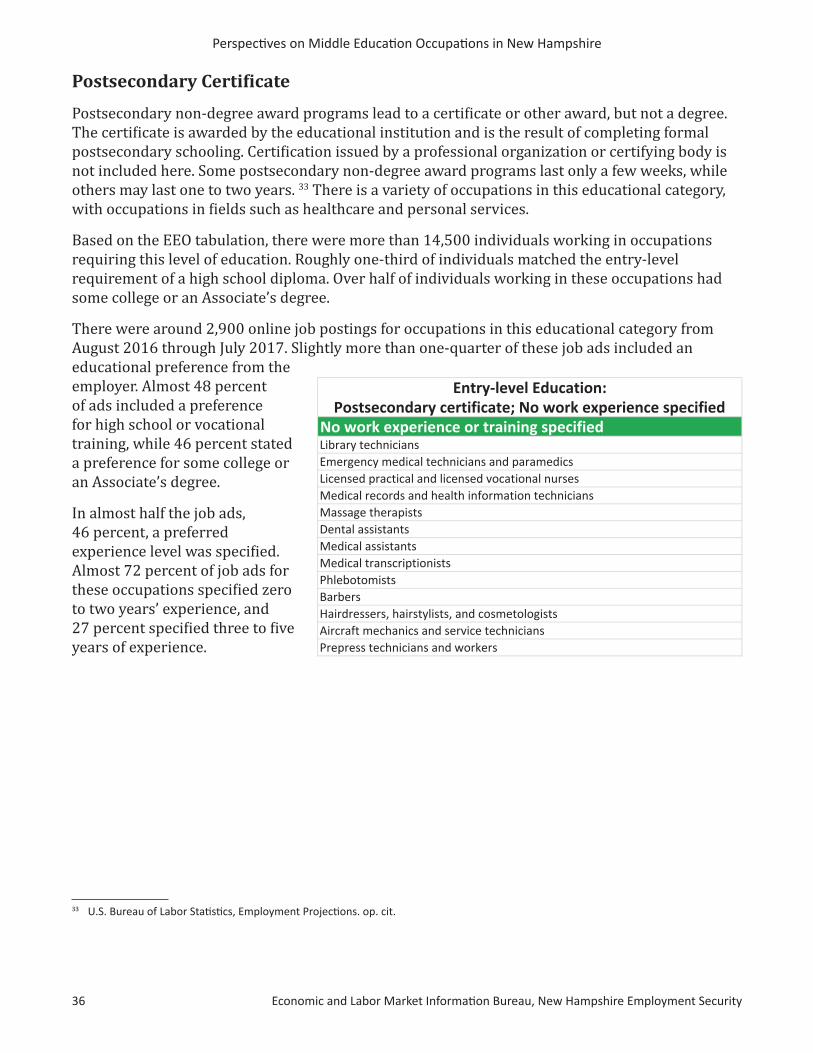
Postsecondary non-degree award programs lead to a certificate or other award, but not a degree. The certificate is awarded by the educational institution and is the result of completing formal postsecondary schooling. Certification issued by a professional organization or certifying body is not included here. Some postsecondary non-degree award programs last only a few weeks, while others may last one to two years. 33 There is a variety of occupations in this educational category, with occupations in fields such as healthcare and personal services.
Based on the EEO tabulation, there were more than 14,500 individuals working in occupations requiring this level of education. Roughly one-third of individuals matched the entry-level requirement of a high school diploma. Over half of individuals working in these occupations had some college or an Associate’s degree.
There were around 2,900 online job postings for occupations in this educational category from August 2016 through July 2017. Slightly more than one-quarter of these job ads included an educational preference from the employer. Almost 48 percent of ads included a preference for high school or vocational training, while 46 percent stated a preference for some college or an Associate’s degree.
In almost half the job ads, 46 percent, a preferred experience level was specified. Almost 72 percent of job ads for these occupations specified zero to two years’ experience, and 27 percent specified three to five years of experience.
33 U.S. Bureau of Labor Stati sti cs, Employment Projecti ons. op. cit.
Entry-level Education:Postsecondary certificate; No work experience specified
No work experience or training specifiedLibrary techniciansEmergency medical technicians and paramedicsLicensed practical and licensed vocational nursesMedical records and health information techniciansMassage therapistsDental assistantsMedical assistantsMedical transcriptionistsPhlebotomistsBarbersHairdressers, hairstylists, and cosmetologistsAircraft mechanics and service techniciansPrepress technicians and workers

Economic and Labor Market Informati on Bureau, New Hampshire Employment Security 37
Perspecti ves on Middle Educati on Occupati ons in New Hampshire
0%
10%
20%
30%
40%
50%
60%
70%
80%
90%
100%
Not high schoolgraduate
High school graduate(including
equivalency)
Some college orAssociate's degree
Bachelor's degree Graduate orprofessional degree
Source: U.S. Census Bureau, EEO Tabulation 2006-2010 (5-year ACS data) and Labor Insight, Burning Glass Technologies72.4 percent of job postings have been excluded because they do not include a degree level. As a result, the chart may not be representative of the full sample.
Occupations Typically Requiring a Postsecondary Certificatefor Entry-level Employment
Jobholder Educational Attainment Job Ad Minimum Education
Perspecti ves on Middle Educati on Occupati ons in New Hampshire
38 Economic and Labor Market Informati on Bureau, New Hampshire Employment Security
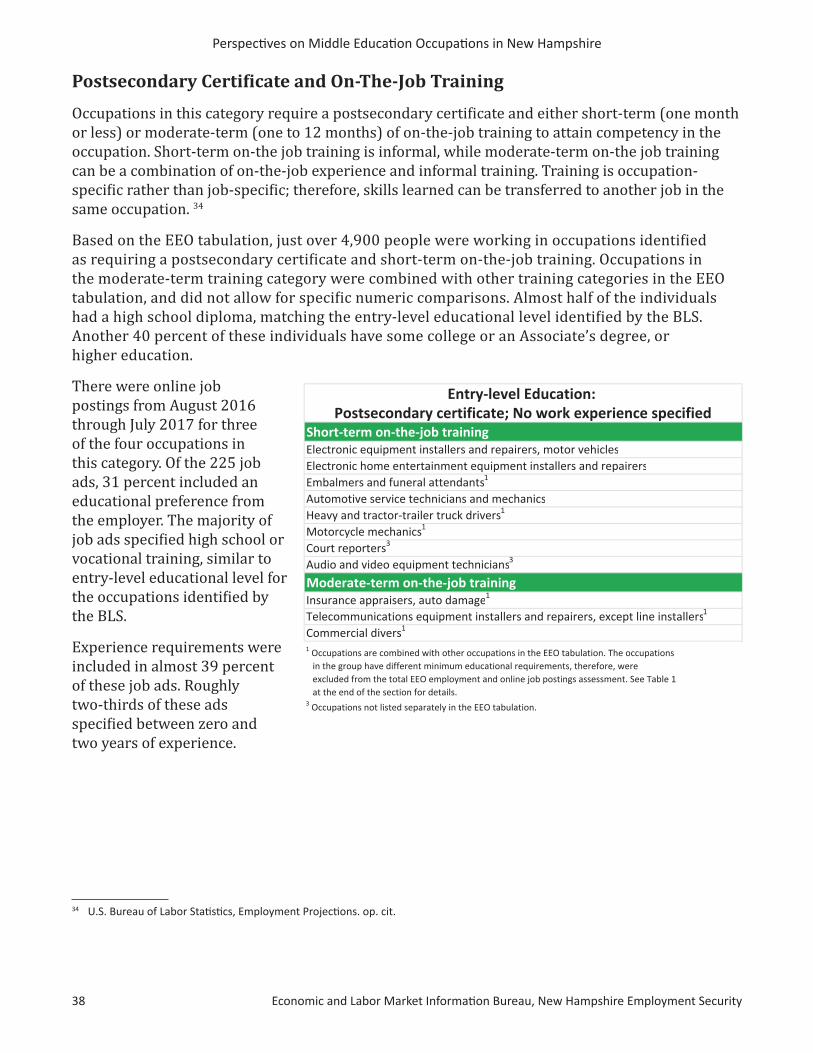
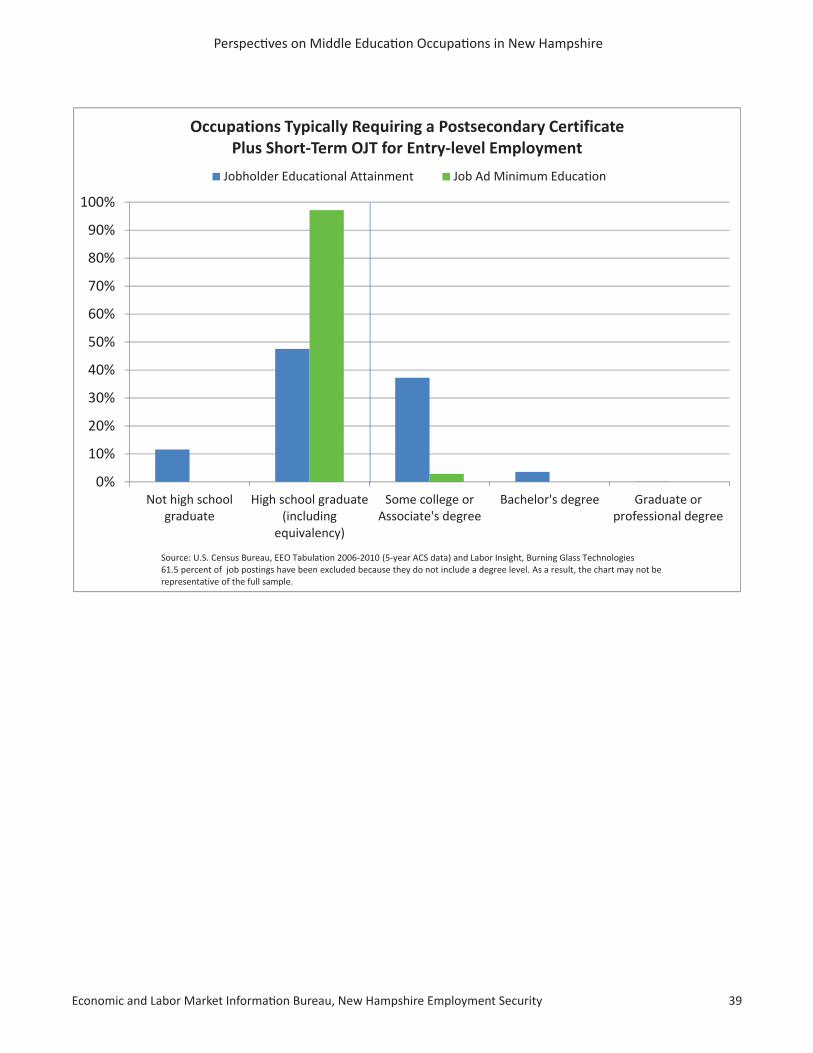
Postsecondary Certificate and On-The-Job Training
Occupations in this category require a postsecondary certificate and either short-term (one month or less) or moderate-term (one to 12 months) of on-the-job training to attain competency in the occupation. Short-term on-the job training is informal, while moderate-term on-the job training can be a combination of on-the-job experience and informal training. Training is occupation-specific rather than job-specific; therefore, skills learned can be transferred to another job in the same occupation. 34
Based on the EEO tabulation, just over 4,900 people were working in occupations identified as requiring a postsecondary certificate and short-term on-the-job training. Occupations in the moderate-term training category were combined with other training categories in the EEO tabulation, and did not allow for specific numeric comparisons. Almost half of the individuals had a high school diploma, matching the entry-level educational level identified by the BLS. Another 40 percent of these individuals have some college or an Associate’s degree, or higher education.
There were online job postings from August 2016 through July 2017 for three of the four occupations in this category. Of the 225 job ads, 31 percent included an educational preference from the employer. The majority of job ads specified high school or vocational training, similar to entry-level educational level for the occupations identified by the BLS.
Experience requirements were included in almost 39 percent of these job ads. Roughly two-thirds of these ads specified between zero and two years of experience.
34 U.S. Bureau of Labor Stati sti cs, Employment Projecti ons. op. cit.
Entry-level Education: Postsecondary certificate; No work experience specified
Short-term on-the-job training Electronic equipment installers and repairers, motor vehiclesElectronic home entertainment equipment installers and repairersEmbalmers and funeral attendants1
Automotive service technicians and mechanicsHeavy and tractor-trailer truck drivers1
Motorcycle mechanics1
Court reporters3
Audio and video equipment technicians3
Moderate-term on-the-job training Insurance appraisers, auto damage1
Telecommunications equipment installers and repairers, except line installers1
Commercial divers1
1 Occupations are combined with other occupations in the EEO tabulation. The occupations in the group have different minimum educational requirements, therefore, were excluded from the total EEO employment and online job postings assessment. See Table 1 at the end of the section for details. 3 Occupations not listed separately in the EEO tabulation.
Economic and Labor Market Informati on Bureau, New Hampshire Employment Security 39
Perspecti ves on Middle Educati on Occupati ons in New Hampshire
0%
10%
20%
30%
40%
50%
60%
70%
80%
90%
100%
Not high schoolgraduate
High school graduate(including
equivalency)
Some college orAssociate's degree
Bachelor's degree Graduate orprofessional degree
Source: U.S. Census Bureau, EEO Tabulation 2006-2010 (5-year ACS data) and Labor Insight, Burning Glass Technologies61.5 percent of job postings have been excluded because they do not include a degree level. As a result, the chart may not be representative of the full sample.
Occupations Typically Requiring a Postsecondary Certificate Plus Short-Term OJT for Entry-level Employment
Jobholder Educational Attainment Job Ad Minimum Education

Perspecti ves on Middle Educati on Occupati ons in New Hampshire
40 Economic and Labor Market Informati on Bureau, New Hampshire Employment Security
Postsecondary Certificate and Long-Term On-The-Job Training
These occupations require a postsecondary non-degree certificate along with additional on-the-job training period of 12-months or more to become proficient in the job.
Based on the EEO tabulation for New Hampshire, almost 3,000 people worked in these occupations. Roughly one-third of these individuals had a high school diploma, while more than one-half of workers in these occupations had some college or an Associate’s degree.
Of the 184 job ads from August 2016 through July 2017 for this group, about one-third specified an educational level. Over 75 percent of ads specified high school or vocational training. Experience was specified in 37 percent of job ads; 18 percent specified three to five years, while 12 percent specified two years or less.
0%
10%
20%
30%
40%
50%
60%
70%
80%
90%
100%
Not high schoolgraduate
High school graduate(including
equivalency)
Some college orAssociate's degree
Bachelor's degree Graduate orprofessional degree
Source: U.S. Census Bureau, EEO Tabulation 2006-2010 (5-year ACS data) and Labor Insight, Burning Glass Technologies69.8 percent of job postings have been excluded because they do not include a degree level. As a result, the chart may not be representative of the full sample.
Occupations Typically Requiring a Postsecondary Certificate PlusLong-Term OJT for Entry-level Employment
Jobholder Educational Attainment Job Ad Minimum Education
Long-term on-the-job training Firefighters Electric motor, power tool, and related repairersElectrical and electronics repairers, transportation equipment, and industrial
and utility1
Heating, air conditioning, and refrigeration mechanics and installers1 Occupations are combined with other occupations in the EEO tabulation. The occupations in the group have different minimum educational requirements, therefore, were excluded from the total EEO employment and online job postings assessment. See Table 1 at the end of the section for details.
Entry-level Education:Postsecondary certificate; No work experience specified
Economic and Labor Market Informati on Bureau, New Hampshire Employment Security 41
Perspecti ves on Middle Educati on Occupati ons in New Hampshire
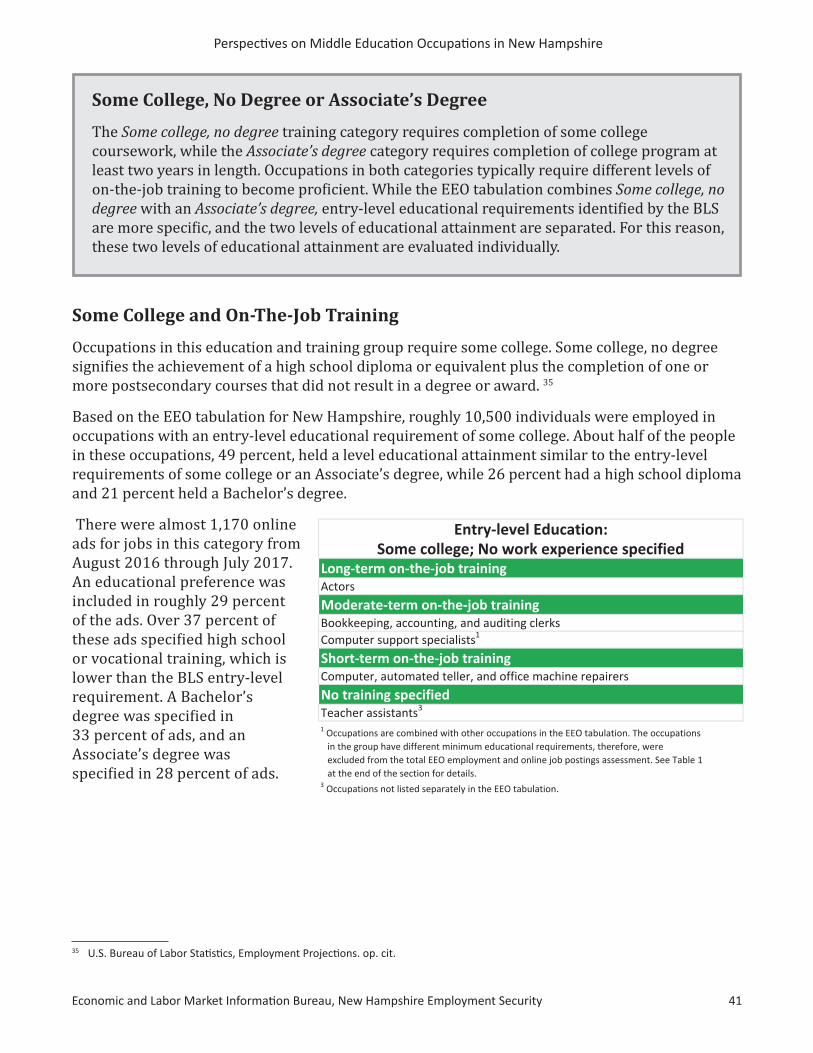
Some College and On-The-Job Training
Occupations in this education and training group require some college. Some college, no degree signifies the achievement of a high school diploma or equivalent plus the completion of one or more postsecondary courses that did not result in a degree or award. 35
Based on the EEO tabulation for New Hampshire, roughly 10,500 individuals were employed in occupations with an entry-level educational requirement of some college. About half of the people in these occupations, 49 percent, held a level educational attainment similar to the entry-level requirements of some college or an Associate’s degree, while 26 percent had a high school diploma and 21 percent held a Bachelor’s degree.
There were almost 1,170 online ads for jobs in this category from August 2016 through July 2017. An educational preference was included in roughly 29 percent of the ads. Over 37 percent of these ads specified high school or vocational training, which is lower than the BLS entry-level requirement. A Bachelor’s degree was specified in 33 percent of ads, and an Associate’s degree was specified in 28 percent of ads.
Some College, No Degree or Associate’s Degree
The Some college, no degree training category requires completion of some college coursework, while the Associate’s degree category requires completion of college program at least two years in length. Occupations in both categories typically require different levels of on-the-job training to become proficient. While the EEO tabulation combines Some college, no degree with an Associate’s degree, entry-level educational requirements identified by the BLS are more specific, and the two levels of educational attainment are separated. For this reason, these two levels of educational attainment are evaluated individually.
35 U.S. Bureau of Labor Stati sti cs, Employment Projecti ons. op. cit.
Entry-level Education:Some college; No work experience specified
Long-term on-the-job training Actors
Moderate-term on-the-job training Bookkeeping, accounting, and auditing clerksComputer support specialists1
Short-term on-the-job training Computer, automated teller, and office machine repairers
No training specifiedTeacher assistants3
1 Occupations are combined with other occupations in the EEO tabulation. The occupations in the group have different minimum educational requirements, therefore, were excluded from the total EEO employment and online job postings assessment. See Table 1 at the end of the section for details. 3 Occupations not listed separately in the EEO tabulation.

Perspecti ves on Middle Educati on Occupati ons in New Hampshire
42 Economic and Labor Market Informati on Bureau, New Hampshire Employment Security
0%
10%
20%
30%
40%
50%
60%
70%
80%
90%
100%
Not high schoolgraduate
High school graduate(including
equivalency)
Some college orAssociate's degree
Bachelor's degree Graduate orprofessional degree
Source: U.S. Census Bureau, EEO Tabulation 2006-2010 (5-year ACS data) and Labor Insight, Burning Glass Technologies74.5 percent of job postings have been excluded because they do not include a degree level. As a result, the chart may not be representative of the full sample.
Occupations Typically Requiring Some College and OJT for Entry-level Employment
Jobholder Educational Attainment Job Ad Minimum Education
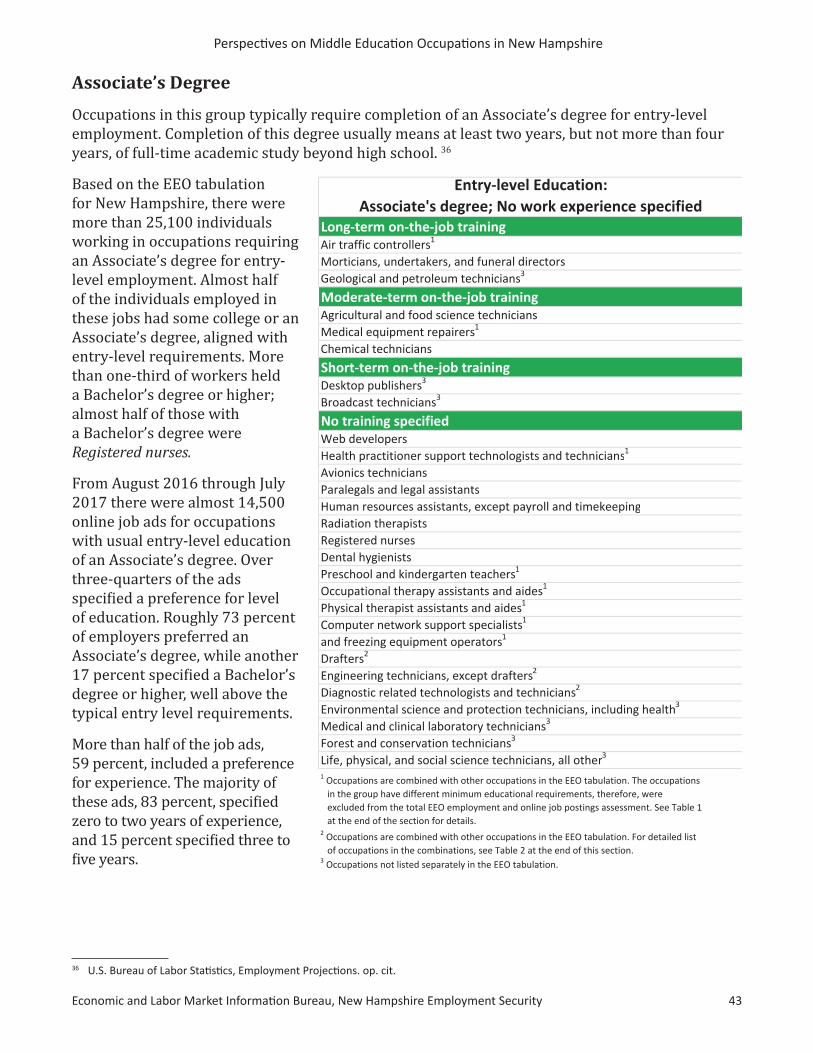
Economic and Labor Market Informati on Bureau, New Hampshire Employment Security 43
Perspecti ves on Middle Educati on Occupati ons in New Hampshire
Associate’s Degree
Occupations in this group typically require completion of an Associate’s degree for entry-level employment. Completion of this degree usually means at least two years, but not more than four years, of full-time academic study beyond high school. 36
Based on the EEO tabulation for New Hampshire, there were more than 25,100 individuals working in occupations requiring an Associate’s degree for entry-level employment. Almost half of the individuals employed in these jobs had some college or an Associate’s degree, aligned with entry-level requirements. More than one-third of workers held a Bachelor’s degree or higher; almost half of those with a Bachelor’s degree were Registered nurses.
From August 2016 through July 2017 there were almost 14,500 online job ads for occupations with usual entry-level education of an Associate’s degree. Over three-quarters of the ads specified a preference for level of education. Roughly 73 percent of employers preferred an Associate’s degree, while another 17 percent specified a Bachelor’s degree or higher, well above the typical entry level requirements.
More than half of the job ads, 59 percent, included a preference for experience. The majority of these ads, 83 percent, specified zero to two years of experience, and 15 percent specified three to five years.
36 U.S. Bureau of Labor Stati sti cs, Employment Projecti ons. op. cit.
Long-term on-the-job training Air traffic controllers1
Morticians, undertakers, and funeral directorsGeological and petroleum technicians3
Moderate-term on-the-job training Agricultural and food science techniciansMedical equipment repairers1
Chemical technicians
Short-term on-the-job training Desktop publishers3
Broadcast technicians3
No training specified Web developersHealth practitioner support technologists and technicians1
Avionics techniciansParalegals and legal assistantsHuman resources assistants, except payroll and timekeepingRadiation therapistsRegistered nursesDental hygienistsPreschool and kindergarten teachers1
Occupational therapy assistants and aides1
Physical therapist assistants and aides1
Computer network support specialists1
and freezing equipment operators1
Drafters2
Engineering technicians, except drafters2
Diagnostic related technologists and technicians2
Environmental science and protection technicians, including health3
Medical and clinical laboratory technicians3
Forest and conservation technicians3
Life, physical, and social science technicians, all other3
1 Occupations are combined with other occupations in the EEO tabulation. The occupations in the group have different minimum educational requirements, therefore, were excluded from the total EEO employment and online job postings assessment. See Table 1 at the end of the section for details. 2 Occupations are combined with other occupations in the EEO tabulation. For detailed list of occupations in the combinations, see Table 2 at the end of this section.3 Occupations not listed separately in the EEO tabulation.
Entry-level Education:Associate's degree; No work experience specified
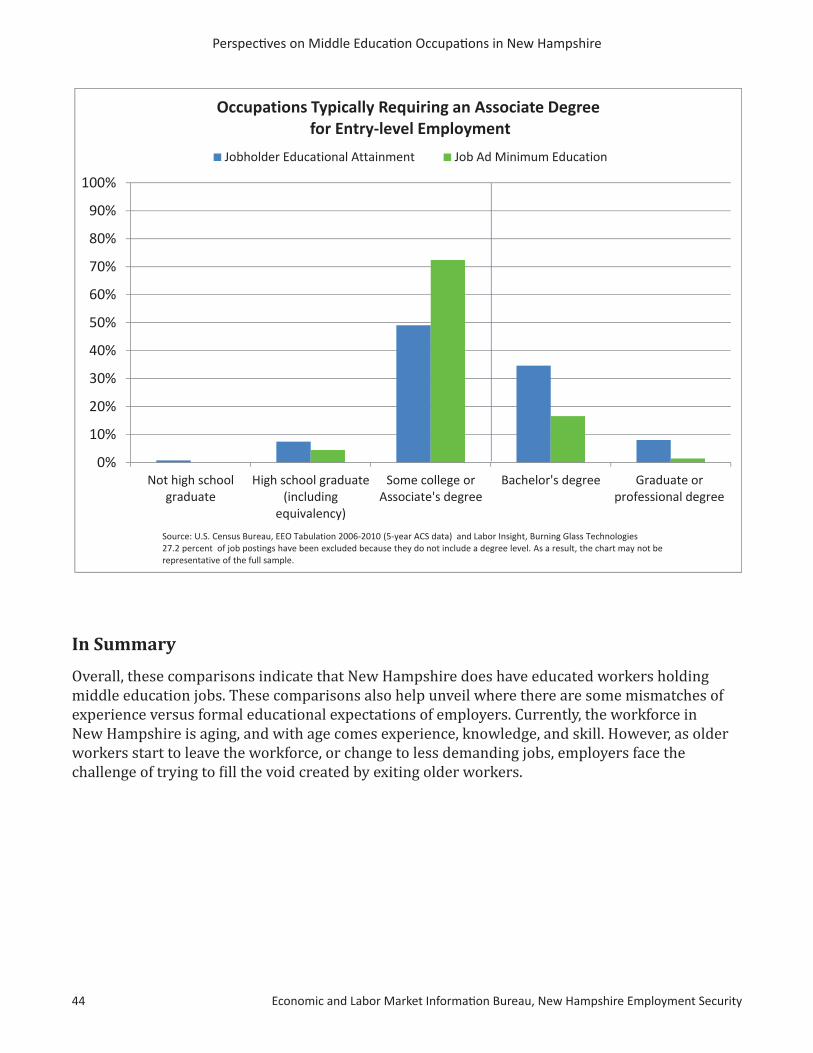
Perspecti ves on Middle Educati on Occupati ons in New Hampshire
44 Economic and Labor Market Informati on Bureau, New Hampshire Employment Security
0%
10%
20%
30%
40%
50%
60%
70%
80%
90%
100%
Not high schoolgraduate
High school graduate(including
equivalency)
Some college orAssociate's degree
Bachelor's degree Graduate orprofessional degree
Source: U.S. Census Bureau, EEO Tabulation 2006-2010 (5-year ACS data) and Labor Insight, Burning Glass Technologies27.2 percent of job postings have been excluded because they do not include a degree level. As a result, the chart may not be representative of the full sample.
Occupations Typically Requiring an Associate Degreefor Entry-level Employment
Jobholder Educational Attainment Job Ad Minimum Education
In Summary
Overall, these comparisons indicate that New Hampshire does have educated workers holding middle education jobs. These comparisons also help unveil where there are some mismatches of experience versus formal educational expectations of employers. Currently, the workforce in New Hampshire is aging, and with age comes experience, knowledge, and skill. However, as older workers start to leave the workforce, or change to less demanding jobs, employers face the challenge of trying to fill the void created by exiting older workers.
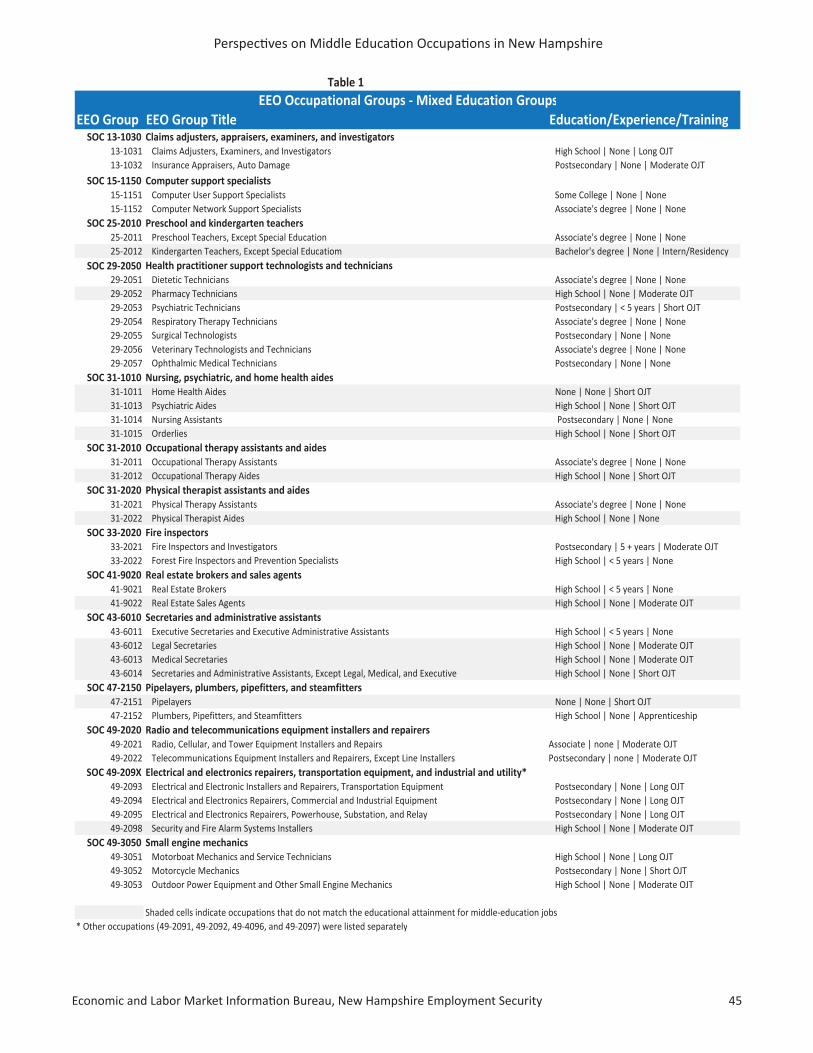
Economic and Labor Market Informati on Bureau, New Hampshire Employment Security 45
Perspecti ves on Middle Educati on Occupati ons in New Hampshire
Table 1
EEO Group EEO Group Title Education/Experience/TrainingSOC 13-1030 Claims adjusters, appraisers, examiners, and investigators
13-1031 Claims Adjusters, Examiners, and Investigators High School | None | Long OJT13-1032 Insurance Appraisers, Auto Damage Postsecondary | None | Moderate OJT
SOC 15-1150 Computer support specialists 15-1151 Computer User Support Specialists Some College | None | None15-1152 Computer Network Support Specialists Associate's degree | None | None
SOC 25-2010 Preschool and kindergarten teachers25-2011 Preschool Teachers, Except Special Education Associate's degree | None | None25-2012 Kindergarten Teachers, Except Special Educatiom Bachelor's degree | None | Intern/Residency
SOC 29-2050 Health practitioner support technologists and technicians29-2051 Dietetic Technicians Associate's degree | None | None29-2052 Pharmacy Technicians High School | None | Moderate OJT29-2053 Psychiatric Technicians Postsecondary | < 5 years | Short OJT29-2054 Respiratory Therapy Technicians Associate's degree | None | None29-2055 Surgical Technologists Postsecondary | None | None29-2056 Veterinary Technologists and Technicians Associate's degree | None | None29-2057 Ophthalmic Medical Technicians Postsecondary | None | None
SOC 31-1010 Nursing, psychiatric, and home health aides31-1011 Home Health Aides None | None | Short OJT31-1013 Psychiatric Aides High School | None | Short OJT31-1014 Nursing Assistants Postsecondary | None | None31-1015 Orderlies High School | None | Short OJT
SOC 31-2010 Occupational therapy assistants and aides31-2011 Occupational Therapy Assistants Associate's degree | None | None31-2012 Occupational Therapy Aides High School | None | Short OJT
SOC 31-2020 Physical therapist assistants and aides 31-2021 Physical Therapy Assistants Associate's degree | None | None31-2022 Physical Therapist Aides High School | None | None
SOC 33-2020 Fire inspectors 33-2021 Fire Inspectors and Investigators Postsecondary | 5 + years | Moderate OJT33-2022 Forest Fire Inspectors and Prevention Specialists High School | < 5 years | None
SOC 41-9020 Real estate brokers and sales agents41-9021 Real Estate Brokers High School | < 5 years | None41-9022 Real Estate Sales Agents High School | None | Moderate OJT
SOC 43-6010 Secretaries and administrative assistants43-6011 Executive Secretaries and Executive Administrative Assistants High School | < 5 years | None43-6012 Legal Secretaries High School | None | Moderate OJT43-6013 Medical Secretaries High School | None | Moderate OJT43-6014 Secretaries and Administrative Assistants, Except Legal, Medical, and Executive High School | None | Short OJT
SOC 47-2150 Pipelayers, plumbers, pipefitters, and steamfitters47-2151 Pipelayers None | None | Short OJT 47-2152 Plumbers, Pipefitters, and Steamfitters High School | None | Apprenticeship
SOC 49-2020 Radio and telecommunications equipment installers and repairers49-2021 Radio, Cellular, and Tower Equipment Installers and Repairs Associate | none | Moderate OJT49-2022 Telecommunications Equipment Installers and Repairers, Except Line Installers Postsecondary | none | Moderate OJT
SOC 49-209X Electrical and electronics repairers, transportation equipment, and industrial and utility*49-2093 Electrical and Electronic Installers and Repairers, Transportation Equipment Postsecondary | None | Long OJT49-2094 Electrical and Electronics Repairers, Commercial and Industrial Equipment Postsecondary | None | Long OJT49-2095 Electrical and Electronics Repairers, Powerhouse, Substation, and Relay Postsecondary | None | Long OJT49-2098 Security and Fire Alarm Systems Installers High School | None | Moderate OJT
SOC 49-3050 Small engine mechanics49-3051 Motorboat Mechanics and Service Technicians High School | None | Long OJT 49-3052 Motorcycle Mechanics Postsecondary | None | Short OJT49-3053 Outdoor Power Equipment and Other Small Engine Mechanics High School | None | Moderate OJT
Shaded cells indicate occupations that do not match the educational attainment for middle-education jobs* Other occupations (49-2091, 49-2092, 49-4096, and 49-2097) were listed separately
EEO Occupational Groups - Mixed Education Groups
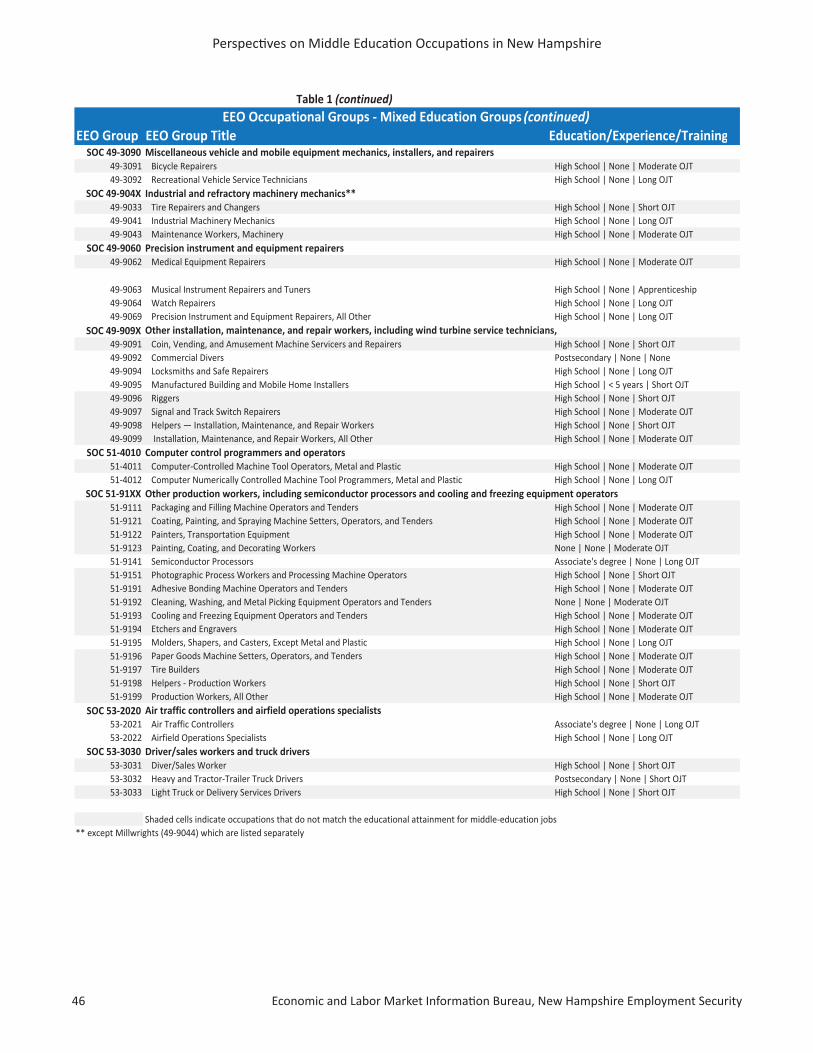
Perspecti ves on Middle Educati on Occupati ons in New Hampshire
46 Economic and Labor Market Informati on Bureau, New Hampshire Employment Security
Table 1 (continued)
EEO Group EEO Group Title Education/Experience/TrainingSOC 49-3090 Miscellaneous vehicle and mobile equipment mechanics, installers, and repairers
49-3091 Bicycle Repairers High School | None | Moderate OJT49-3092 Recreational Vehicle Service Technicians High School | None | Long OJT
SOC 49-904X Industrial and refractory machinery mechanics**49-9033 Tire Repairers and Changers High School | None | Short OJT49-9041 Industrial Machinery Mechanics High School | None | Long OJT 49-9043 Maintenance Workers, Machinery High School | None | Moderate OJT
SOC 49-9060 Precision instrument and equipment repairers49-9062 Medical Equipment Repairers High School | None | Moderate OJT
49-9063 Musical Instrument Repairers and Tuners High School | None | Apprenticeship49-9064 Watch Repairers High School | None | Long OJT49-9069 Precision Instrument and Equipment Repairers, All Other High School | None | Long OJT
SOC 49-909X49-9091 Coin, Vending, and Amusement Machine Servicers and Repairers High School | None | Short OJT49-9092 Commercial Divers Postsecondary | None | None49-9094 Locksmiths and Safe Repairers High School | None | Long OJT49-9095 Manufactured Building and Mobile Home Installers High School | < 5 years | Short OJT49-9096 Riggers High School | None | Short OJT49-9097 Signal and Track Switch Repairers High School | None | Moderate OJT49-9098 Helpers — Installation, Maintenance, and Repair Workers High School | None | Short OJT49-9099 Installation, Maintenance, and Repair Workers, All Other High School | None | Moderate OJT
SOC 51-4010 Computer control programmers and operators51-4011 Computer-Controlled Machine Tool Operators, Metal and Plastic High School | None | Moderate OJT51-4012 Computer Numerically Controlled Machine Tool Programmers, Metal and Plastic High School | None | Long OJT
SOC 51-91XX Other production workers, including semiconductor processors and cooling and freezing equipment operators51-9111 Packaging and Filling Machine Operators and Tenders High School | None | Moderate OJT51-9121 Coating, Painting, and Spraying Machine Setters, Operators, and Tenders High School | None | Moderate OJT51-9122 Painters, Transportation Equipment High School | None | Moderate OJT51-9123 Painting, Coating, and Decorating Workers None | None | Moderate OJT51-9141 Semiconductor Processors Associate's degree | None | Long OJT51-9151 Photographic Process Workers and Processing Machine Operators High School | None | Short OJT51-9191 Adhesive Bonding Machine Operators and Tenders High School | None | Moderate OJT51-9192 Cleaning, Washing, and Metal Picking Equipment Operators and Tenders None | None | Moderate OJT51-9193 Cooling and Freezing Equipment Operators and Tenders High School | None | Moderate OJT51-9194 Etchers and Engravers High School | None | Moderate OJT51-9195 Molders, Shapers, and Casters, Except Metal and Plastic High School | None | Long OJT51-9196 Paper Goods Machine Setters, Operators, and Tenders High School | None | Moderate OJT51-9197 Tire Builders High School | None | Moderate OJT51-9198 Helpers - Production Workers High School | None | Short OJT51-9199 Production Workers, All Other High School | None | Moderate OJT
SOC 53-2020 Air traffic controllers and airfield operations specialists 53-2021 Air Traffic Controllers Associate's degree | None | Long OJT53-2022 Airfield Operations Specialists High School | None | Long OJT
SOC 53-3030 Driver/sales workers and truck drivers53-3031 Diver/Sales Worker High School | None | Short OJT53-3032 Heavy and Tractor-Trailer Truck Drivers Postsecondary | None | Short OJT53-3033 Light Truck or Delivery Services Drivers High School | None | Short OJT
Shaded cells indicate occupations that do not match the educational attainment for middle-education jobs** except Millwrights (49-9044) which are listed separately
Other installation, maintenance, and repair workers, including wind turbine service technicians,
EEO Occupational Groups - Mixed Education Groups (continued)
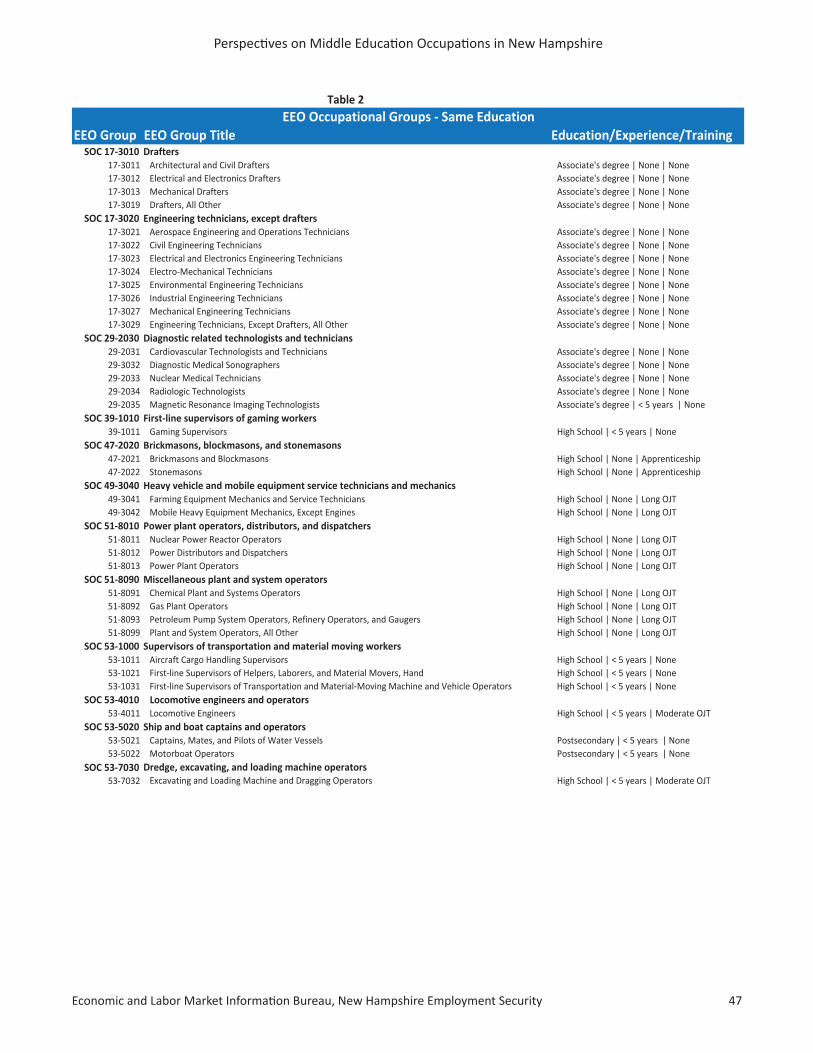
Economic and Labor Market Informati on Bureau, New Hampshire Employment Security 47
Perspecti ves on Middle Educati on Occupati ons in New Hampshire
Table 2
EEO Group EEO Group Title Education/Experience/TrainingSOC 17-3010 Drafters
17-3011 Architectural and Civil Drafters Associate's degree | None | None17-3012 Electrical and Electronics Drafters Associate's degree | None | None17-3013 Mechanical Drafters Associate's degree | None | None17-3019 Drafters, All Other Associate's degree | None | None
SOC 17-3020 Engineering technicians, except drafters17-3021 Aerospace Engineering and Operations Technicians Associate's degree | None | None17-3022 Civil Engineering Technicians Associate's degree | None | None17-3023 Electrical and Electronics Engineering Technicians Associate's degree | None | None17-3024 Electro-Mechanical Technicians Associate's degree | None | None17-3025 Environmental Engineering Technicians Associate's degree | None | None17-3026 Industrial Engineering Technicians Associate's degree | None | None17-3027 Mechanical Engineering Technicians Associate's degree | None | None17-3029 Engineering Technicians, Except Drafters, All Other Associate's degree | None | None
SOC 29-2030 Diagnostic related technologists and technicians29-2031 Cardiovascular Technologists and Technicians Associate's degree | None | None29-3032 Diagnostic Medical Sonographers Associate's degree | None | None29-2033 Nuclear Medical Technicians Associate's degree | None | None29-2034 Radiologic Technologists Associate's degree | None | None29-2035 Magnetic Resonance Imaging Technologists Associate's degree | < 5 years | None
SOC 39-1010 First-line supervisors of gaming workers39-1011 Gaming Supervisors High School | < 5 years | None
SOC 47-2020 Brickmasons, blockmasons, and stonemasons47-2021 Brickmasons and Blockmasons High School | None | Apprenticeship47-2022 Stonemasons High School | None | Apprenticeship
SOC 49-3040 Heavy vehicle and mobile equipment service technicians and mechanics49-3041 Farming Equipment Mechanics and Service Technicians High School | None | Long OJT49-3042 Mobile Heavy Equipment Mechanics, Except Engines High School | None | Long OJT
SOC 51-8010 Power plant operators, distributors, and dispatchers51-8011 Nuclear Power Reactor Operators High School | None | Long OJT51-8012 Power Distributors and Dispatchers High School | None | Long OJT51-8013 Power Plant Operators High School | None | Long OJT
SOC 51-8090 Miscellaneous plant and system operators51-8091 Chemical Plant and Systems Operators High School | None | Long OJT51-8092 Gas Plant Operators High School | None | Long OJT51-8093 Petroleum Pump System Operators, Refinery Operators, and Gaugers High School | None | Long OJT51-8099 Plant and System Operators, All Other High School | None | Long OJT
SOC 53-1000 Supervisors of transportation and material moving workers53-1011 Aircraft Cargo Handling Supervisors High School | < 5 years | None53-1021 First-line Supervisors of Helpers, Laborers, and Material Movers, Hand High School | < 5 years | None53-1031 First-line Supervisors of Transportation and Material-Moving Machine and Vehicle Operators High School | < 5 years | None
SOC 53-4010 Locomotive engineers and operators53-4011 Locomotive Engineers High School | < 5 years | Moderate OJT
SOC 53-5020 Ship and boat captains and operators53-5021 Captains, Mates, and Pilots of Water Vessels Postsecondary | < 5 years | None53-5022 Motorboat Operators Postsecondary | < 5 years | None
SOC 53-7030 Dredge, excavating, and loading machine operators53-7032 Excavating and Loading Machine and Dragging Operators High School | < 5 years | Moderate OJT
EEO Occupational Groups - Same Education

Perspecti ves on Middle Educati on Occupati ons in New Hampshire
48 Economic and Labor Market Informati on Bureau, New Hampshire Employment Security
Economic and Labor Market Informati on Bureau, New Hampshire Employment Security 49
Perspecti ves on Middle Educati on Occupati ons in New Hampshire
Among employers and workforce professionals and strategists, there is a conti nuing discussion about the existence of a skills mismatch in the labor market. There can be large diff erences between the levels of skill that an employer wants workers to have, as opposed to what level of skill is required to do the job. In order to get a bett er understanding of what skills are required in a given occupati on, in comparison to the level of the current workforce employed in the occupati on, data on current occupati onal workforce by educati onal att ainment was analyzed. In additi on, a comparison was made of the educati onal and training entry requirements for the New Hampshire labor market between 2004 and 2014.
Author: Annett e Nielsen, Economist
Workforce Upskilling - Fact or Myth?

Perspecti ves on Middle Educati on Occupati ons in New Hampshire
50 Economic and Labor Market Informati on Bureau, New Hampshire Employment Security
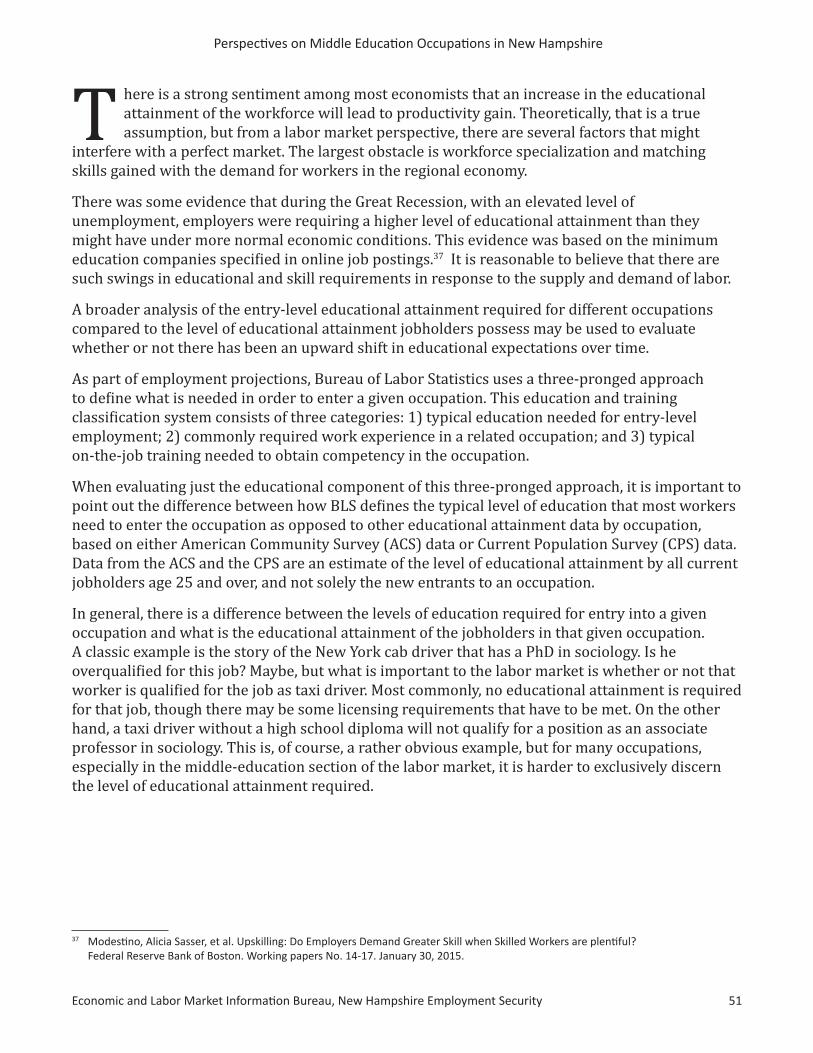
Economic and Labor Market Informati on Bureau, New Hampshire Employment Security 51
Perspecti ves on Middle Educati on Occupati ons in New Hampshire
here is a strong sentiment among most economists that an increase in the educational attainment of the workforce will lead to productivity gain. Theoretically, that is a true assumption, but from a labor market perspective, there are several factors that might
interfere with a perfect market. The largest obstacle is workforce specialization and matching skills gained with the demand for workers in the regional economy.
There was some evidence that during the Great Recession, with an elevated level of unemployment, employers were requiring a higher level of educational attainment than they might have under more normal economic conditions. This evidence was based on the minimum education companies specified in online job postings.37 It is reasonable to believe that there are such swings in educational and skill requirements in response to the supply and demand of labor.
A broader analysis of the entry-level educational attainment required for different occupations compared to the level of educational attainment jobholders possess may be used to evaluate whether or not there has been an upward shift in educational expectations over time.
As part of employment projections, Bureau of Labor Statistics uses a three-pronged approach to define what is needed in order to enter a given occupation. This education and training classification system consists of three categories: 1) typical education needed for entry-level employment; 2) commonly required work experience in a related occupation; and 3) typical on-the-job training needed to obtain competency in the occupation.
When evaluating just the educational component of this three-pronged approach, it is important to point out the difference between how BLS defines the typical level of education that most workers need to enter the occupation as opposed to other educational attainment data by occupation, based on either American Community Survey (ACS) data or Current Population Survey (CPS) data. Data from the ACS and the CPS are an estimate of the level of educational attainment by all current jobholders age 25 and over, and not solely the new entrants to an occupation.
In general, there is a difference between the levels of education required for entry into a given occupation and what is the educational attainment of the jobholders in that given occupation. A classic example is the story of the New York cab driver that has a PhD in sociology. Is he overqualified for this job? Maybe, but what is important to the labor market is whether or not that worker is qualified for the job as taxi driver. Most commonly, no educational attainment is required for that job, though there may be some licensing requirements that have to be met. On the other hand, a taxi driver without a high school diploma will not qualify for a position as an associate professor in sociology. This is, of course, a rather obvious example, but for many occupations, especially in the middle-education section of the labor market, it is harder to exclusively discern the level of educational attainment required.
T
37 Modesti no, Alicia Sasser, et al. Upskilling: Do Employers Demand Greater Skill when Skilled Workers are plenti ful? Federal Reserve Bank of Boston. Working papers No. 14-17. January 30, 2015.
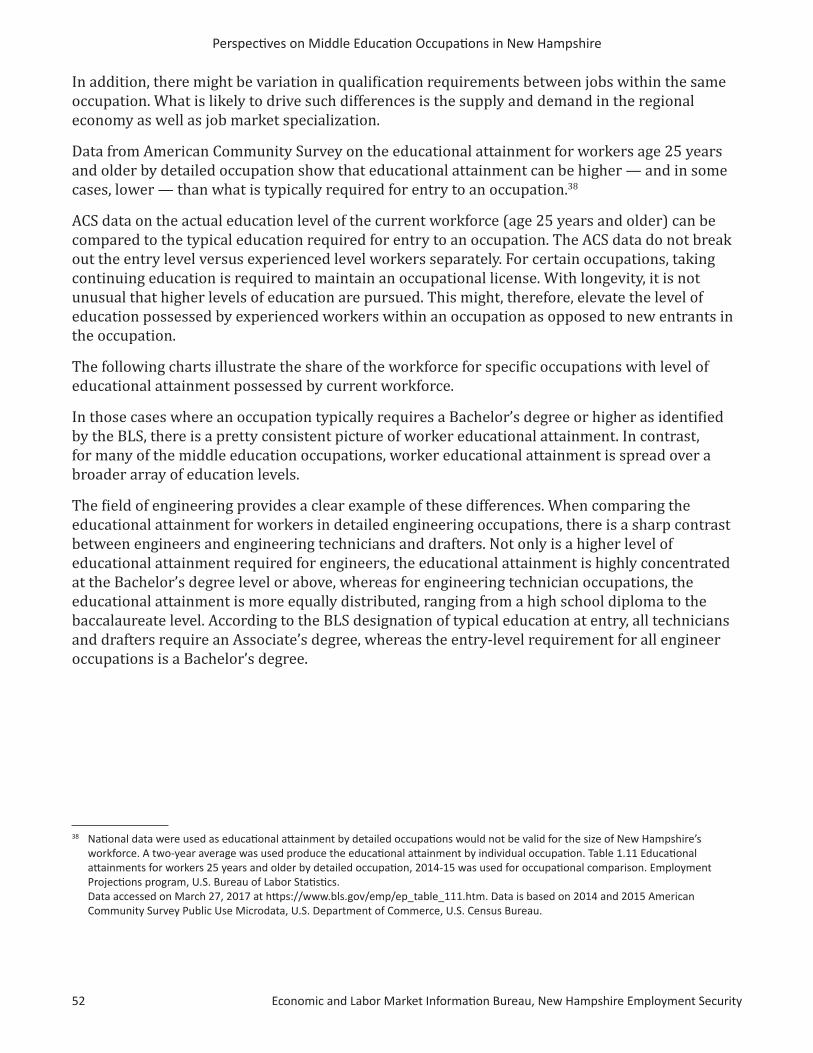
Perspecti ves on Middle Educati on Occupati ons in New Hampshire
52 Economic and Labor Market Informati on Bureau, New Hampshire Employment Security
In addition, there might be variation in qualification requirements between jobs within the same occupation. What is likely to drive such differences is the supply and demand in the regional economy as well as job market specialization.
Data from American Community Survey on the educational attainment for workers age 25 years and older by detailed occupation show that educational attainment can be higher — and in some cases, lower — than what is typically required for entry to an occupation.38
ACS data on the actual education level of the current workforce (age 25 years and older) can be compared to the typical education required for entry to an occupation. The ACS data do not break out the entry level versus experienced level workers separately. For certain occupations, taking continuing education is required to maintain an occupational license. With longevity, it is not unusual that higher levels of education are pursued. This might, therefore, elevate the level of education possessed by experienced workers within an occupation as opposed to new entrants in the occupation.
The following charts illustrate the share of the workforce for specific occupations with level of educational attainment possessed by current workforce.
In those cases where an occupation typically requires a Bachelor’s degree or higher as identified by the BLS, there is a pretty consistent picture of worker educational attainment. In contrast, for many of the middle education occupations, worker educational attainment is spread over a broader array of education levels.
The field of engineering provides a clear example of these differences. When comparing the educational attainment for workers in detailed engineering occupations, there is a sharp contrast between engineers and engineering technicians and drafters. Not only is a higher level of educational attainment required for engineers, the educational attainment is highly concentrated at the Bachelor’s degree level or above, whereas for engineering technician occupations, the educational attainment is more equally distributed, ranging from a high school diploma to the baccalaureate level. According to the BLS designation of typical education at entry, all technicians and drafters require an Associate’s degree, whereas the entry-level requirement for all engineer occupations is a Bachelor’s degree.
38 Nati onal data were used as educati onal att ainment by detailed occupati ons would not be valid for the size of New Hampshire’s workforce. A two-year average was used produce the educati onal att ainment by individual occupati on. Table 1.11 Educati onal att ainments for workers 25 years and older by detailed occupati on, 2014-15 was used for occupati onal comparison. Employment Projecti ons program, U.S. Bureau of Labor Stati sti cs. Data accessed on March 27, 2017 at htt ps://www.bls.gov/emp/ep_table_111.htm. Data is based on 2014 and 2015 American Community Survey Public Use Microdata, U.S. Department of Commerce, U.S. Census Bureau.
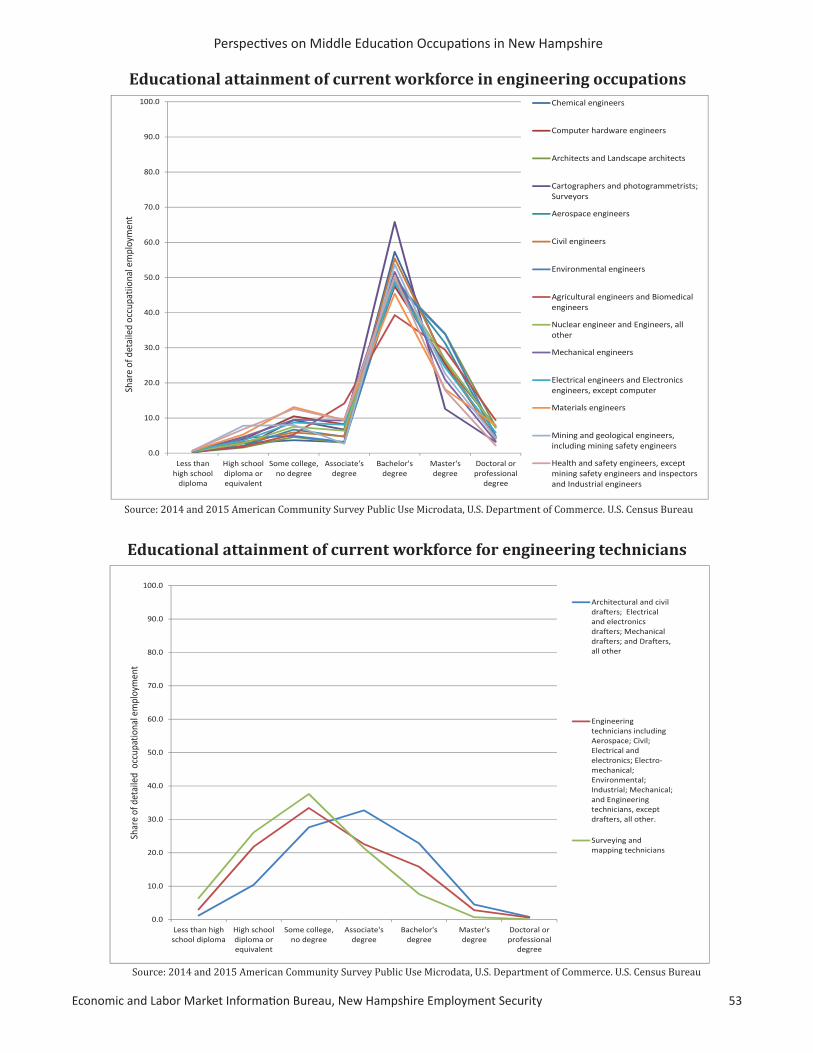
Economic and Labor Market Informati on Bureau, New Hampshire Employment Security 53
Perspecti ves on Middle Educati on Occupati ons in New Hampshire
0.0
10.0
20.0
30.0
40.0
50.0
60.0
70.0
80.0
90.0
100.0
Less thanhigh school
diploma
High schooldiploma orequivalent
Some college,no degree
Associate'sdegree
Bachelor'sdegree
Master'sdegree
Doctoral orprofessional
degree
Shar
e of
det
aile
d oc
cupa
tiion
al e
mpl
oym
ent
Chemical engineers
Computer hardware engineers
Architects and Landscape architects
Cartographers and photogrammetrists;Surveyors
Aerospace engineers
Civil engineers
Environmental engineers
Agricultural engineers and Biomedicalengineers
Nuclear engineer and Engineers, allother
Mechanical engineers
Electrical engineers and Electronicsengineers, except computer
Materials engineers
Mining and geological engineers,including mining safety engineers
Health and safety engineers, exceptmining safety engineers and inspectorsand Industrial engineers
Educational attainment of current workforce for engineering technicians
Source: 2014 and 2015 American Community Survey Public Use Microdata, U.S. Department of Commerce. U.S. Census Bureau
Educational attainment of current workforce in engineering occupations
Source: 2014 and 2015 American Community Survey Public Use Microdata, U.S. Department of Commerce. U.S. Census Bureau
0.0
10.0
20.0
30.0
40.0
50.0
60.0
70.0
80.0
90.0
100.0
Less than highschool diploma
High schooldiploma orequivalent
Some college,no degree
Associate'sdegree
Bachelor'sdegree
Master'sdegree
Doctoral orprofessional
degree
Shar
e of
det
aile
d o
ccup
atio
nal e
mpl
oym
ent
Architectural and civildrafters; Electricaland electronicsdrafters; Mechanicaldrafters; and Drafters,all other
Engineeringtechnicians includingAerospace; Civil;Electrical andelectronics; Electro-mechanical;Environmental;Industrial; Mechanical;and Engineeringtechnicians, exceptdrafters, all other.
Surveying andmapping technicians
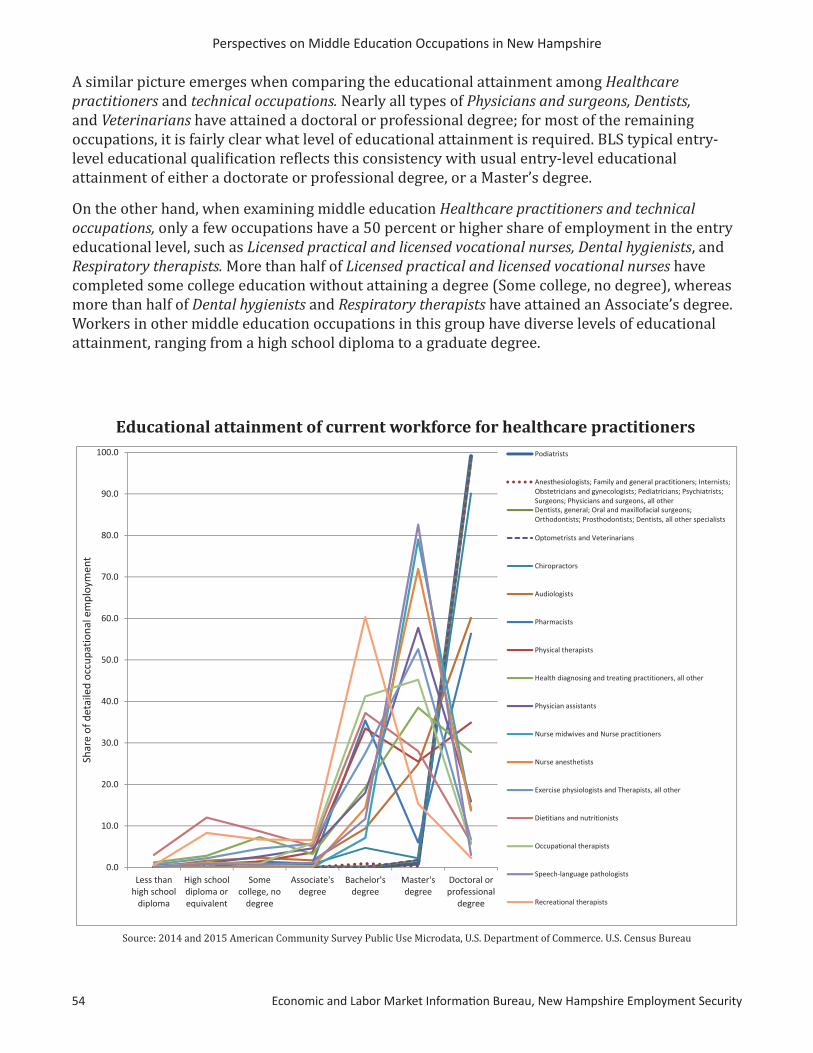
Perspecti ves on Middle Educati on Occupati ons in New Hampshire
54 Economic and Labor Market Informati on Bureau, New Hampshire Employment Security
0.0
10.0
20.0
30.0
40.0
50.0
60.0
70.0
80.0
90.0
100.0
Less thanhigh school
diploma
High schooldiploma orequivalent
Somecollege, no
degree
Associate'sdegree
Bachelor'sdegree
Master'sdegree
Doctoral orprofessional
degree
Shar
e of
det
aile
d oc
cupa
tiona
l em
ploy
men
t
Podiatrists
Anesthesiologists; Family and general practitioners; Internists;Obstetricians and gynecologists; Pediatricians; Psychiatrists;Surgeons; Physicians and surgeons, all otherDentists, general; Oral and maxillofacial surgeons;Orthodontists; Prosthodontists; Dentists, all other specialists
Optometrists and Veterinarians
Chiropractors
Audiologists
Pharmacists
Physical therapists
Health diagnosing and treating practitioners, all other
Physician assistants
Nurse midwives and Nurse practitioners
Nurse anesthetists
Exercise physiologists and Therapists, all other
Dietitians and nutritionists
Occupational therapists
Speech-language pathologists
Recreational therapists
Educational attainment of current workforce for healthcare practitioners
Source: 2014 and 2015 American Community Survey Public Use Microdata, U.S. Department of Commerce. U.S. Census Bureau
A similar picture emerges when comparing the educational attainment among Healthcare practitioners and technical occupations. Nearly all types of Physicians and surgeons, Dentists, and Veterinarians have attained a doctoral or professional degree; for most of the remaining occupations, it is fairly clear what level of educational attainment is required. BLS typical entry-level educational qualification reflects this consistency with usual entry-level educational attainment of either a doctorate or professional degree, or a Master’s degree.
On the other hand, when examining middle education Healthcare practitioners and technical occupations, only a few occupations have a 50 percent or higher share of employment in the entry educational level, such as Licensed practical and licensed vocational nurses, Dental hygienists, and Respiratory therapists. More than half of Licensed practical and licensed vocational nurses have completed some college education without attaining a degree (Some college, no degree), whereas more than half of Dental hygienists and Respiratory therapists have attained an Associate’s degree. Workers in other middle education occupations in this group have diverse levels of educational attainment, ranging from a high school diploma to a graduate degree.
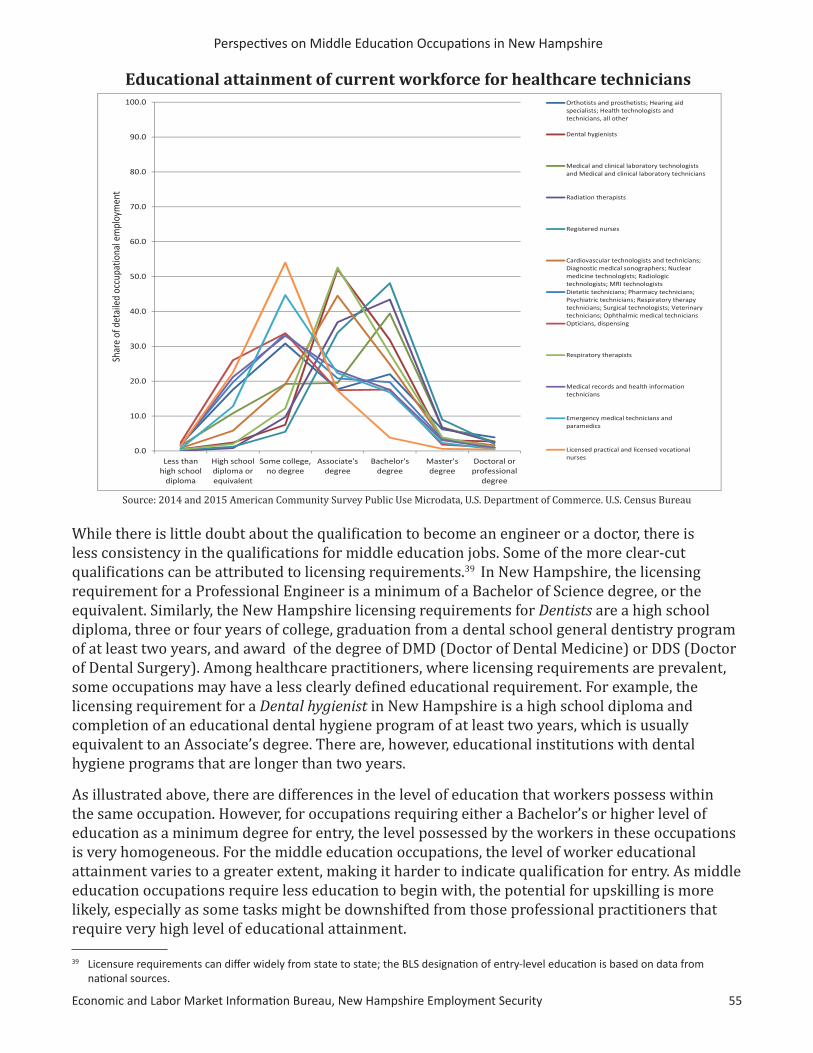
Economic and Labor Market Informati on Bureau, New Hampshire Employment Security 55
Perspecti ves on Middle Educati on Occupati ons in New Hampshire
39 Licensure requirements can diff er widely from state to state; the BLS designati on of entry-level educati on is based on data from nati onal sources.
Educational attainment of current workforce for healthcare technicians
Source: 2014 and 2015 American Community Survey Public Use Microdata, U.S. Department of Commerce. U.S. Census Bureau
While there is little doubt about the qualification to become an engineer or a doctor, there is less consistency in the qualifications for middle education jobs. Some of the more clear-cut qualifications can be attributed to licensing requirements.39 In New Hampshire, the licensing requirement for a Professional Engineer is a minimum of a Bachelor of Science degree, or the equivalent. Similarly, the New Hampshire licensing requirements for Dentists are a high school diploma, three or four years of college, graduation from a dental school general dentistry program of at least two years, and award of the degree of DMD (Doctor of Dental Medicine) or DDS (Doctor of Dental Surgery). Among healthcare practitioners, where licensing requirements are prevalent, some occupations may have a less clearly defined educational requirement. For example, the licensing requirement for a Dental hygienist in New Hampshire is a high school diploma and completion of an educational dental hygiene program of at least two years, which is usually equivalent to an Associate’s degree. There are, however, educational institutions with dental hygiene programs that are longer than two years.
As illustrated above, there are differences in the level of education that workers possess within the same occupation. However, for occupations requiring either a Bachelor’s or higher level of education as a minimum degree for entry, the level possessed by the workers in these occupations is very homogeneous. For the middle education occupations, the level of worker educational attainment varies to a greater extent, making it harder to indicate qualification for entry. As middle education occupations require less education to begin with, the potential for upskilling is more likely, especially as some tasks might be downshifted from those professional practitioners that require very high level of educational attainment.
0.0
10.0
20.0
30.0
40.0
50.0
60.0
70.0
80.0
90.0
100.0
Less thanhigh school
diploma
High schooldiploma orequivalent
Some college,no degree
Associate'sdegree
Bachelor'sdegree
Master'sdegree
Doctoral orprofessional
degree
Shar
e of
det
aile
d oc
cupa
tiona
l em
ploy
men
tOrthotists and prosthetists; Hearing aidspecialists; Health technologists andtechnicians, all other
Dental hygienists
Medical and clinical laboratory technologistsand Medical and clinical laboratory technicians
Radiation therapists
Registered nurses
Cardiovascular technologists and technicians;Diagnostic medical sonographers; Nuclearmedicine technologists; Radiologictechnologists; MRI technologistsDietetic technicians; Pharmacy technicians;Psychiatric technicians; Respiratory therapytechnicians; Surgical technologists; Veterinarytechnicians; Ophthalmic medical techniciansOpticians, dispensing
Respiratory therapists
Medical records and health informationtechnicians
Emergency medical technicians andparamedics
Licensed practical and licensed vocationalnurses

Perspecti ves on Middle Educati on Occupati ons in New Hampshire
56 Economic and Labor Market Informati on Bureau, New Hampshire Employment Security
40 American Associati on of Nurse Anestheti sts, Become a CRNA. Accessed on March 15, 2017 on htt p://www.aana.com/ceandeducati on/becomeacrna/Pages/default.aspx.
41 The occupati onal employment level is based on esti mates derived from a survey (Occupati onal Employment Stati sti cs) and there can be large variati ons from year to year. Using the employment level for the major occupati onal groups create a more robust comparison.
Changes in the laws and administrative rules that govern licensed occupations can contribute to educational upskilling. In addition, other labor market factors may drive changes to entry-level educational requirements. Over time, there are two dynamics going on simultaneously that can impact upskilling:
1) One is changes in the job itself. As job tasks change over time, there might be an increased level of educational attainment required to do the job. Specialization and an increased level of job responsibilities can lead to a spin-off into a new occupation. Nurse Anesthetist is an example of an occupation for which an advanced degree certification was established on top of the educational requirements for a Registered Nurse.40 The occupation of Nurse Anesthetist was added to the Standard Occupational Classification (SOC) taxonomy in 2010.
2) At the same time, the composition of the labor market is constantly changing. As industries grow and decline over time, some new jobs are created while others are eliminated. In the mix of the structural change of the labor market, jobs being added tend to require more education.
Has there been an upward shift in educational requirements over time?In an attempt to evaluate if there has been inflation in the level of education typically required for entry to an occupation, two sets of long-term occupational projections were compared. The base year data from the 2004 to 2014 occupational projections were compared to base year data from the 2014 to 2024 occupational projections. This allows comparison of data from two different years, ten years apart. For this comparison, the major occupational groups were used instead of comparing employment change at the detailed occupational level. As mentioned earlier, new occupations emerge over time and some of these new occupations are broken apart from the original detailed occupation, which can eliminate the ability to make a strict comparison over time for a particular detailed occupation. The major occupational groups defined by the Standard Occupational Classification system have not changed over this ten-year period.41
Over the last ten years, occupational upskilling has largely been impacted by the change in occupational composition, meaning the effects of job gains and losses in the major occupational groups. From the perspective of the major occupational group level, jobs in Healthcare practitioners and technical occupations and Business and financial operations occupations have been growing, whereas jobs have been lost in Construction and extraction occupations, Sales and related occupations, and Production occupations.
With few exceptions, Healthcare practitioners and technical occupations and Business and financial operations occupations require more than a high school diploma.42 Actually, the majority of occupations in these two groups require a Doctorate or professional degree, Master’s degree, or Bachelor’s degree. Examples of detailed occupations in these two major occupational groups are: Surgeons, Physical therapists and Nurse practitioners, as well as Accountants, Management analysts, and Personal financial advisors. There are, though, also many Healthcare practitioners and technical occupations, such as Dental hygienists, Radiologic technologists, and Medical and clinical laboratory technologists, that require an Associate’s degree.

Economic and Labor Market Informati on Bureau, New Hampshire Employment Security 57
Perspecti ves on Middle Educati on Occupati ons in New Hampshire
42 Bureau of Labor Stati sti cs revised the Occupati onal Educati on and Training categories in 2010. From 1995 to 2008, a one-part, 11-category defi niti on of educati on and training was used. This one-part defi niti on was replaced with a three-pronged approach listi ng educati on, experience, and training in separate categories.
Major Occupational Groups with Growing Employment from 2004 to 2014
Source: 2014 and 2015 American Community Survey Public Use Microdata, U.S. Department of Commerce. U.S. Census Bureau
0 20,000 40,000 60,000 80,000 100,000 120,000
Food Preparation and Serving Related
Building and Grounds Cleaning andMaintenance
Computer and Mathematical
Education, Training, and Library
Personal Care and Service
Healthcare Support
Business and Financial Operations
Healthcare Practitioners and Technical
Employment
2004
2014
Conversely, among occupations in the three large declining major occupational groups, only a handful of jobs require a Bachelor’s degree or higher. Production occupations typically require a high school diploma and long or moderate on-the-job training. Examples of occupations that are still expected to grow in this major occupational group are Machinists and Computer-controlled machine tool operators, metal and plastic. Construction and extraction occupations typically require either a high school diploma and apprenticeship or no formal educational credential and only short- or moderate on-the-job training. Despite the decline in the occupational employment within this major occupational group, the outlook for Electricians and Plumbers, pipefitters, and steamfitters is very favorable — both occupations require completion of an apprenticeship.
In addition, for some of the other major occupational groups that gained employment over the last ten years, such as Healthcare support occupations and Personal care and service occupations, the educational attainment requirements for all occupations in the group are below the Bachelor’s degree level, yet some of these occupations require more than a high school diploma. Examples of growing occupations within these two major occupational groups are Nursing assistants and Medical assistants, as well as Hairdressers, hairstylists, and cosmetologists.
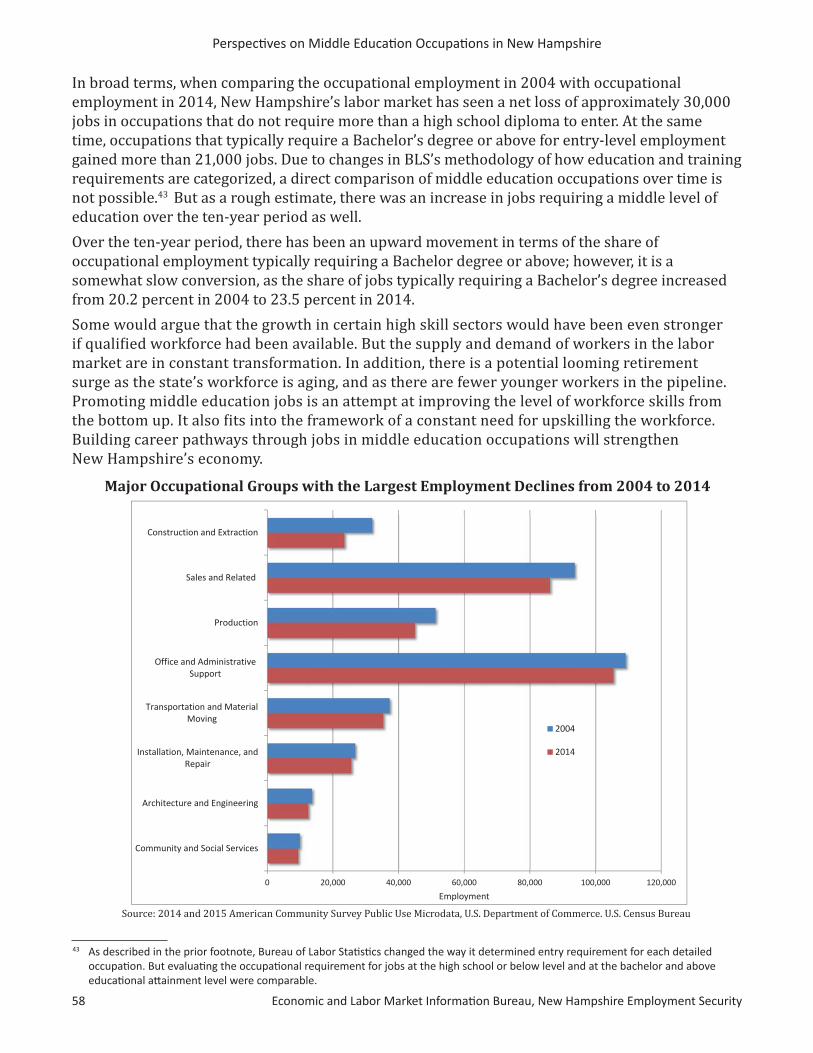
Perspecti ves on Middle Educati on Occupati ons in New Hampshire
58 Economic and Labor Market Informati on Bureau, New Hampshire Employment Security
Major Occupational Groups with the Largest Employment Declines from 2004 to 2014
Source: 2014 and 2015 American Community Survey Public Use Microdata, U.S. Department of Commerce. U.S. Census Bureau
43 As described in the prior footnote, Bureau of Labor Stati sti cs changed the way it determined entry requirement for each detailed occupati on. But evaluati ng the occupati onal requirement for jobs at the high school or below level and at the bachelor and above educati onal att ainment level were comparable.
In broad terms, when comparing the occupational employment in 2004 with occupational employment in 2014, New Hampshire’s labor market has seen a net loss of approximately 30,000 jobs in occupations that do not require more than a high school diploma to enter. At the same time, occupations that typically require a Bachelor’s degree or above for entry-level employment gained more than 21,000 jobs. Due to changes in BLS’s methodology of how education and training requirements are categorized, a direct comparison of middle education occupations over time is not possible.43 But as a rough estimate, there was an increase in jobs requiring a middle level of education over the ten-year period as well. Over the ten-year period, there has been an upward movement in terms of the share of occupational employment typically requiring a Bachelor degree or above; however, it is a somewhat slow conversion, as the share of jobs typically requiring a Bachelor’s degree increased from 20.2 percent in 2004 to 23.5 percent in 2014. Some would argue that the growth in certain high skill sectors would have been even stronger if qualified workforce had been available. But the supply and demand of workers in the labor market are in constant transformation. In addition, there is a potential looming retirement surge as the state’s workforce is aging, and as there are fewer younger workers in the pipeline. Promoting middle education jobs is an attempt at improving the level of workforce skills from the bottom up. It also fits into the framework of a constant need for upskilling the workforce. Building career pathways through jobs in middle education occupations will strengthen New Hampshire’s economy.
0 20,000 40,000 60,000 80,000 100,000 120,000
Community and Social Services
Architecture and Engineering
Installation, Maintenance, andRepair
Transportation and MaterialMoving
Office and AdministrativeSupport
Production
Sales and Related
Construction and Extraction
Employment
2004
2014

Economic and Labor Market Informati on Bureau, New Hampshire Employment Security 59
Perspecti ves on Middle Educati on Occupati ons in New Hampshire
The apprenti ceship learn-as-you-earn model has been around for a long ti me, and is a viable opti on for more than half of the occupati ons defi ned as middle educati on. Explore how the apprenti ceship model works, and how apprenti ceship in New Hampshire has evolved over the last ten years.
Author: Annett e Nielsen, Economist
Apprenti ceable Occupati ons - Exploring the Learning While Earning Model

Perspecti ves on Middle Educati on Occupati ons in New Hampshire
60 Economic and Labor Market Informati on Bureau, New Hampshire Employment Security
Economic and Labor Market Informati on Bureau, New Hampshire Employment Security 61
Perspecti ves on Middle Educati on Occupati ons in New Hampshire
44 Apprenti ceshipUSA, Employment and Training Administrati on, U.S. Department of Labor. Accessed April 24, 2017 www.doleta.gov/OA/bul16/Buleti n_2016-28_Att achment1.pdf. Revised March 2016.
45 About O*Net, O*Net Resource Center, www.onetcenter.org/overview.html. Note: O*Net-SOC codes are based on the Standard Occupati onal Classifi cati on (SOC), but adds occupati onal specifi cati on by adding two digits to the SOC code.
46 For purposes of comparison, RAPIDS occupati ons were crosswalked and consolidated to SOC codes.47 New Hampshire Employment Projecti ons by Industry and Occupati on, 2014-2024, Economic and Labor Market
Informati on Bureau, New Hampshire Employment Security.
ver the next ten years, an increasing number of workers will reach retirement age. Most employers are aware of the looming loss of skills-based and institutional knowledge. How will companies transfer knowledge and skills from the current workforce to the next
generation of workers? Apprenticeship can help in recruiting, training, retraining, and retaining a quality workforce.
Apprenticeship is an earn-while-you-learn training model that benefits both employers and workers. Employers may use apprenticeship to train new workers or incumbent workers, providing a pipeline of workers with quality training specific to their business. Workers receive hands-on training, and are employed before starting their training, with pay from day one. Apprenticeship is a natural career pathway — as the apprentice continues to learn and expand their knowledge and ability, the rate of pay increases.
Apprenticeable Occupations
The Office of Apprenticeship, U.S. Department of Labor, annually publishes a List of Occupations Officially Recognized as Apprenticeable, which includes more than 1,300 individual occupational titles.44 These occupational titles are classified using Registered Apprenticeship Partners Information Data System (RAPIDS) codes. In this list, RAPIDS codes are crosswalked to O*Net-SOC codes; many of the occupational titles fall within the same O*Net-SOC classification.45 Using the O*Net-SOC code, the Standard Occupational Classification (SOC) may be identified.46
Overall, there were 341 apprenticeable SOC occupations. In New Hampshire, out of the 769 occupations for which employment projections are available,47 apprenticeship is a training option for 323 — about two out of every five. Among the 180 occupations defined as middle education, apprenticeship is a training option for 112 occupations — three out of every five. This shows a strong connection between middle education occupations and apprenticeship.
A majority of occupations on the official list are in one of three occupational groups:
• Production occupations (443 occupational titles),
• Construction and extraction occupations (249 occupational titles), and
• Installation, maintenance, and repair occupations (245 occupational titles).
Among middle education occupations in New Hampshire, there are a dozen for which apprenticeship is the usual on-the-job training method of achieving competency for entry-level employment. Nearly all of these occupations are in the Construction and extraction occupations group. However, apprenticeship can be an option for any middle education occupation, and is currently used by employers in manufacturing, protective services, healthcare, transportation, information technology, and hospitality as well as construction.
O

Perspecti ves on Middle Educati on Occupati ons in New Hampshire
62 Economic and Labor Market Informati on Bureau, New Hampshire Employment Security
Source: U.S. Department of Labor - Offi ce of Apprenti ceship, Registered Apprenti ceship Informati on System (RAIS), Report Time Period 02/01/2007 to 02/01/2017
Production Occupations33.0%
Construction and Extraction Occupations
18.6%Installation, Maintenance,
and Repair Occupations18.3%
Architecture and Engineering Occupations
6.7%
Healthcare Support Occupations
2.6%
Protective Service Occupations
2.3%
Arts, Design, Entertainment, Sports, and Media Occupations
2.2%
Healthcare Practitioners and Technical Occupations
2.2%
Transportation and Material Moving
Occupations2.2%
All Other 12.0%
2016 New Hampshire Registered Apprenticeships by Occupational Group
Economic and Labor Market Informati on Bureau, New Hampshire Employment Security 63
Perspecti ves on Middle Educati on Occupati ons in New Hampshire
48 Apprenti ceshipUSA, Employment and Training Administrati on, U.S. Department of Labor. htt ps://www.doleta.gov/OA/occupati ons.cfm
Broadening the Perspective of Job Training Available Through Apprenticeship
Because of differences in occupational coding, a single SOC code frequently is representative of multiple apprenticeable occupations in the RAPIDS coding structure. These differences present a chance to broaden the perspective of available job training opportunities, as training guidelines exist for jobs more specifically defined than using an SOC description.
For example, SOC code 17-3029, Engineering Technicians, Except Drafters, All Other, is defined as “all engineering technicians, except drafters, not listed separately.” This generic description is of very little help to an employer who needs a worker with a specific set of skills. Based on RAPIDS coding, however, there are 34 different occupational titles that are classified as SOC 17-3029, such as Laboratory assistant, metallurgical; Non-destructive tester, magnetic particle tech; Non-destructive tester, ultrasonic tech; and Non-destructive tester, thermal infrared tech.48 Occupational titles classified under a single SOC code may differ in type or length of training, specific materials used, level of specialization, or industry. These more specialized occupational titles provide employers much more variety in finding an apprenticeship that fits their needs.
Apprenticeships for occupations on the official list have already been developed, but training may be developed for almost any occupation. The apprenticeships that have previously been developed can be used as a starting point to develop apprenticeships in other occupations.
Apprenticeship Program Design
There are three types of apprenticeships, offering flexibility in program design: time-based, competency-based, and hybrid, which combines time and competency achievement.
• Time-based apprenticeships require that the apprentice complete a specific number of hours in related instruction and in on-the-job training.
o Example: Machinist, requiring 8,000 hours of combined instruction and on-the-job training.
• Competency-based apprenticeships allow the apprentice to progress at their own pace by demonstrating competency through assessments in skills and knowledge proficiency.
o Example: Pharmacy Service Associate, who must achieve specific competencies in eight different work areas in a minimum number of hours.
• Hybrid apprenticeships are a combination of specific hours in related instruction and on-the-job training along with demonstration of competency through assessments of proficiency.
o Example: Industrial Manufacturing Technician, which requires 3,000 hours of related instruction and on-the-job training, combined with demonstration of achievement in eleven competencies, each of which require a specific number of training hours.
Perspecti ves on Middle Educati on Occupati ons in New Hampshire
64 Economic and Labor Market Informati on Bureau, New Hampshire Employment Security
In addition to demonstrating competency in work processes and working, apprentices must complete related postsecondary instructional programs. Courses may be offered by a community college, a proprietary school, or the employer; some coursework may be available on-line. Many programs of related instruction result in an educational certification, such as an advanced manufacturing certification or an electrical technology certificate. Related instructional programs can also be an apprentice’s stepping stone to future educational opportunities such as attaining a degree, boosting the apprentice up a career ladder.
Registered Apprenticeship. While employers and workers may utilize apprenticeship training that is not registered with the U.S. Department of Labor, there are distinct benefits to registration.49 For the apprentice, completers of a registered apprenticeship receive a national, industry-recognized credential. This is confirmation that the apprentice has graduated from a program that has met national and independent standards for quality and rigor. This credential is recognized throughout the United States. For the employer, a registered apprenticeship provides technical assistance and support, a quality standard of training, and access to federal resources.
Where to Begin: A Quick Start Toolkit 50
The U.S. Department of Labor’s Office of Apprenticeship has created a tool kit to educate employers about registered apprenticeships. The tool kit provides guidance on how apprenticeship works, a step-by-step process for establishing an apprenticeship, and highlights the benefits of apprenticeship for both the employer and the apprentice.
For more information about apprenticeship, becoming a sponsor or partner, registering a program, or becoming an apprentice, contact the New Hampshire State Director, Office of Apprenticeship at (603) 225-1444 or visit the U.S. Department of Labor, Office of Apprenticeship online at www.dol.gov/apprenticeship.
49 Frequently Asked Questi ons, Apprenti ceship USA Toolkit, U.S. Department of Labor htt ps://www.dol.gov/apprenti ceship/toolkit/toolkitf aq.htm
50 A Quick-Start Tool Kit: Building Registered Apprenti ceship Programs. U.S. Department of Labor, Offi ce of Apprenti ceship. htt ps://www.doleta.gov/oa/employers/apprenti ceship_toolkit.pdf
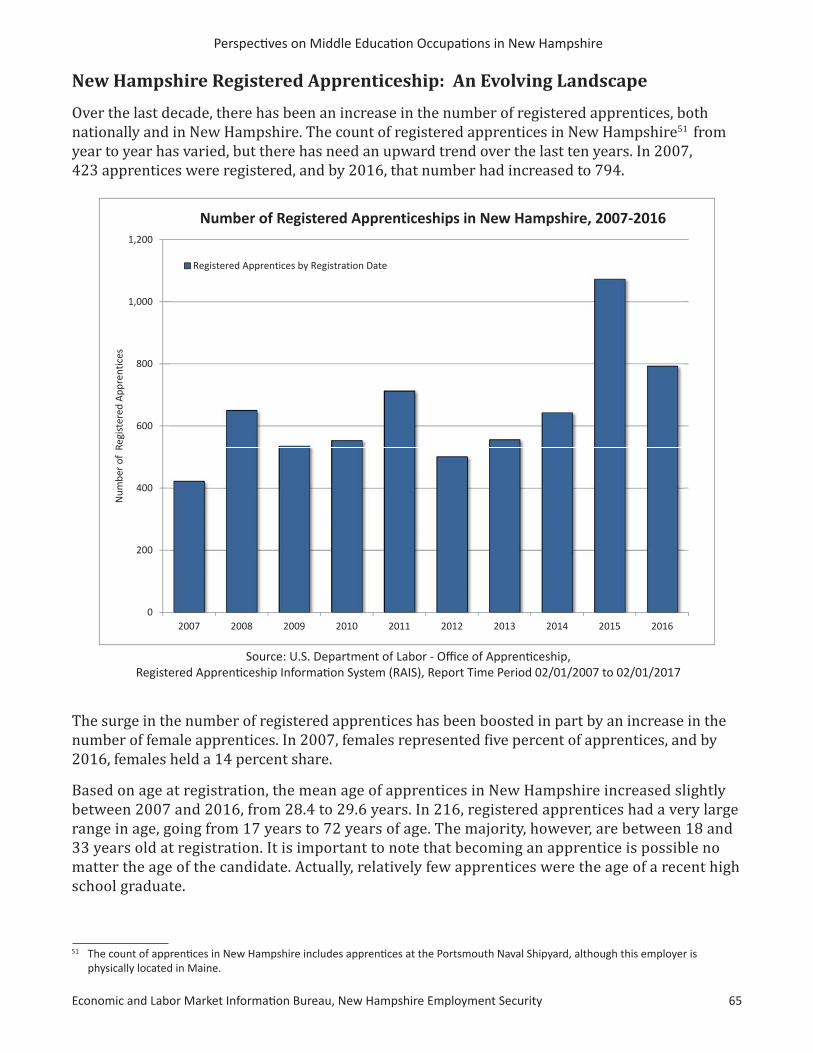
Economic and Labor Market Informati on Bureau, New Hampshire Employment Security 65
Perspecti ves on Middle Educati on Occupati ons in New Hampshire
51 The count of apprenti ces in New Hampshire includes apprenti ces at the Portsmouth Naval Shipyard, although this employer is physically located in Maine.
Source: U.S. Department of Labor - Offi ce of Apprenti ceship, Registered Apprenti ceship Informati on System (RAIS), Report Time Period 02/01/2007 to 02/01/2017
New Hampshire Registered Apprenticeship: An Evolving Landscape
Over the last decade, there has been an increase in the number of registered apprentices, both nationally and in New Hampshire. The count of registered apprentices in New Hampshire51 from year to year has varied, but there has need an upward trend over the last ten years. In 2007, 423 apprentices were registered, and by 2016, that number had increased to 794.
0
200
400
600
800
1,000
1,200
2007 2008 2009 2010 2011 2012 2013 2014 2015 2016
Num
ber
of R
egis
tere
d A
ppre
ntic
es
Number of Registered Apprenticeships in New Hampshire, 2007-2016
Registered Apprentices by Registration Date
The surge in the number of registered apprentices has been boosted in part by an increase in the number of female apprentices. In 2007, females represented five percent of apprentices, and by 2016, females held a 14 percent share.
Based on age at registration, the mean age of apprentices in New Hampshire increased slightly between 2007 and 2016, from 28.4 to 29.6 years. In 216, registered apprentices had a very large range in age, going from 17 years to 72 years of age. The majority, however, are between 18 and 33 years old at registration. It is important to note that becoming an apprentice is possible no matter the age of the candidate. Actually, relatively few apprentices were the age of a recent high school graduate.
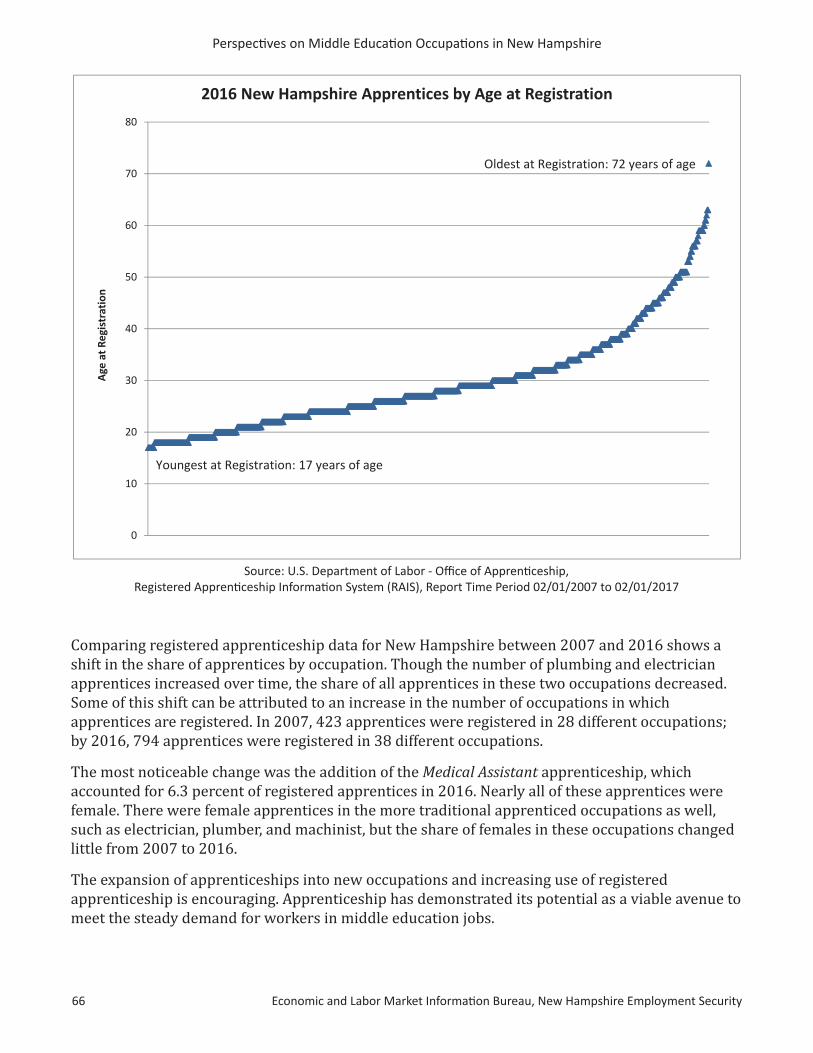
Perspecti ves on Middle Educati on Occupati ons in New Hampshire
66 Economic and Labor Market Informati on Bureau, New Hampshire Employment Security
Source: U.S. Department of Labor - Offi ce of Apprenti ceship, Registered Apprenti ceship Informati on System (RAIS), Report Time Period 02/01/2007 to 02/01/2017
0
10
20
30
40
50
60
70
80
Age
at R
egis
trat
ion
2016 New Hampshire Apprentices by Age at Registration
Youngest at Registration: 17 years of age
Oldest at Registration: 72 years of age
Comparing registered apprenticeship data for New Hampshire between 2007 and 2016 shows a shift in the share of apprentices by occupation. Though the number of plumbing and electrician apprentices increased over time, the share of all apprentices in these two occupations decreased. Some of this shift can be attributed to an increase in the number of occupations in which apprentices are registered. In 2007, 423 apprentices were registered in 28 different occupations; by 2016, 794 apprentices were registered in 38 different occupations.
The most noticeable change was the addition of the Medical Assistant apprenticeship, which accounted for 6.3 percent of registered apprentices in 2016. Nearly all of these apprentices were female. There were female apprentices in the more traditional apprenticed occupations as well, such as electrician, plumber, and machinist, but the share of females in these occupations changed little from 2007 to 2016.
The expansion of apprenticeships into new occupations and increasing use of registered apprenticeship is encouraging. Apprenticeship has demonstrated its potential as a viable avenue to meet the steady demand for workers in middle education jobs.

Economic and Labor Market Informati on Bureau, New Hampshire Employment Security 67
Perspecti ves on Middle Educati on Occupati ons in New Hampshire
Source: U.S. Department of Labor - Offi ce of Apprenti ceship, Registered Apprenti ceship Informati on System (RAIS), Report Time Period 02/01/2007 to 02/01/2017
Plumber , 35.3%
Electrician , 23.2%Pipe Fitter, 7.6%
Construction Craft Laborer, 3.6%
Painter (Constuction), 3.1%
Shipfitter (Ship & Boat), Total, 2.8%
Welder, Combination, 2.6%
Sheet Metal Worker, 1.9%
Carpenter, 1.7%
Direct Support Specialist, 1.7%
Electronics Mechanic, 1.7%
Numerical Control Machine Operator , 1.7%
Refrigeration Mechanic (Equip), 1.7%
All Other, 11.6%
Number of Registered Apprentices by Occupation, 2007
Plumber, 20.2%
Electrician, 18.6%
Painter (Construction), 8.3%Pipe Fitter (Construction),
8.1%
Medical Assistant, 6.3%
Shipfitter (Ship & Boat), Total, 2.8%Non-Destructive Tester,
3.4%
Numerical Control Machine Operator, 2.9%
Electronics Mechanic, 2.6%
Direct Support Specialist1.7%
Line Maintainer, 2.1%
Machinist, 2.1%
Welder, Combination, 2.1%
Plastics Fabricator, 2.0%
Sheet Metal Worker, 1.5%
Heating & Air-Conditioning Install-Service, 1.4%
Insulation Worker, 1.3%
Pipe Fitter - Sprinkler Fitter, 1.3%
Pharmacy Support Staff, 1.1%
Shipfitter, 1.1% Rigger, 1.0% All Other, 4.8%
Number of Registered Apprentices by Occupation, 2016

Perspecti ves on Middle Educati on Occupati ons in New Hampshire
68 Economic and Labor Market Informati on Bureau, New Hampshire Employment Security
Economic and Labor Market Informati on Bureau, New Hampshire Employment Security 69
Perspecti ves on Middle Educati on Occupati ons in New Hampshire
Modeling the Economic Impact of Jobs in Middle Educati on Occupati ons
Jobs in middle educati on occupati ons make a signifi cant contributi on to New Hampshire’s economy. Employment, populati on, and producti vity are just some of the measures that would be aff ected if these jobs were no longer in the economy. The magnitude of these eff ects can be esti mated by the use of economic modeling soft ware and the creati on of a ‘counterfactual’ scenario that shows interdependencies throughout the economy.
Author: Michael Argiropolis, Labor Market Analyst

Perspecti ves on Middle Educati on Occupati ons in New Hampshire
70 Economic and Labor Market Informati on Bureau, New Hampshire Employment Security
Economic and Labor Market Informati on Bureau, New Hampshire Employment Security 71
Perspecti ves on Middle Educati on Occupati ons in New Hampshire
M
52 For example, some electricians typically work for specialty trade contractors, but not all electricians work in that industry. Some are employed by colleges and universiti es, fabricated metal product manufacturers, hospitals, or government.
Based on staffi ng patt erns, employment is allocated proporti onally to those industries that employ electricians. Once employment of all middle educati on workers was allocated to the respecti ve industries, the employment values were summed to provide a value of industry employment for these workers. These industry employment values were entered into the REMI model. However, the result illustrates the value of middle educati on workers to the New Hampshire economy.
iddle education occupations have a significant economic effect in New Hampshire, impacting employment, population, and gross domestic product. Workers in each middle education job earn wages, creating demand for products and services. This demand
generates the need for additional jobs, as other workers provide these products and services, and the workers in those jobs earn wages and demand products and services of their own. Economic activity in turn impacts the state’s gross domestic product.
What is the value of jobs in middle education occupations to the New Hampshire economy? Is it possible to attach a dollar figure to it? What industries would be the most affected? These questions were answered through a detailed analysis using REMI Policy Insight, proprietary economic modeling software developed by Regional Economic Models, Inc.
Modeling the effect of middle education occupations presents a challenge in that the analysis required is not a real economic event, but a “counterfactual simulation,” that is, assuming something that has not happened or is not the case. In effect, the model is asked ‘what if ’ these occupations were removed from the economy. By design, the REMI model assesses employment by industry only, and not by occupation.
To assess the impact of jobs in middle education occupations, industry staffing patterns are used to allocate occupational employment to the industries that typically employ workers in those occupations.52 The resulting employment numbers were then deducted from baseline employment in the 70 industry sectors in the REMI model. This method was used to isolate the value of middle education jobs on the New Hampshire economy.
Out of 700 occupations for which employment in New Hampshire was projected, 180 occupations were identified as having a middle education requirement, defined as: a high school diploma or equivalent plus related work experience, post-hire training of at least 12 months, or an apprenticeship; an Associate’s degree; some college education (no degree); or a non-degree postsecondary certificate. Overall, these occupations totaled 171,400 workers in the base year of 2014.
Perspecti ves on Middle Educati on Occupati ons in New Hampshire
72 Economic and Labor Market Informati on Bureau, New Hampshire Employment Security
About the REMI Model
REMI is a quanti tati ve model that shows interdependencies throughout the economy. As an example, a small manufacturing fi rm that produces chairs would need to purchase wood, metal, supplies, and energy, as well as hire people to produce the product and provide administrati ve support. These expenditures provide profi ts to their suppliers and wages to their employees, who in turn, purchase other goods and services in the economy, to conti nue the cycle. The model replicates these transacti ons on a macroeconomic scale for the enti re state.
REMI contains a baseline forecast extending far into the future, up to 2060. In additi on to employment, REMI provides forecasts for populati on, gross domesti c product, labor force, output, personal income, and many other economic variables. Forecasts are driven by an input/output matrix that accounts for the raw materials and labor used by an industry to produce a product or provide a service. The model works under the assumpti on that fi rms strive to maximize profi ts and will allocate their resources — labor and capital — accordingly, and that consumers will seek to maximize their uti lity (get the most value for their money).
By modifying a baseline forecast, the economic eff ect of a change in policy by governments such as a cut in property taxes, or a signifi cant change to the economy such as a plant closing or a new major constructi on proposal can be esti mated. In the case of a tax cut, the eff ect can be modeled by decreasing government revenues while simultaneously increasing disposable income. For plant closings and economic development projects, a standard way to model the eff ect is to directly add or subtract employment in the aff ected industries. In this way, a forecaster can introduce a ‘shock’ or in other words, propose an alternati ve scenario and generate an enti rely new forecast. Such a process is also known as a simulati on.
Impact of Middle Education Occupations on Industry Sector Employment
To measure the value of jobs in middle education occupations, 171,000 workers were “removed” from the employment in related industries. This “removal” of workers was set to a point in time - 2017 - to assess the value over time. By measuring the resulting changes in economic indicators, an estimate of the value of these jobs is produced. The total impact of jobs in middle education occupations would be felt in all industry sectors, some more than others, either directly as an occupation designated as middle education, or secondarily as a job other than one in a middle education occupation that will be induced by economic activity created by the direct job.
Over the 14-year period of the simulation, jobs in middle education occupations would create an impact on the New Hampshire economy, starting with 294,020 jobs in 2017. By 2030, the impact would increase to 300,000 jobs. This indicates that the original 171,000 jobs in middle education occupations have an employment multiplier effect of 1.7 jobs, meaning that for each job, an additional 0.7 jobs are created.

Economic and Labor Market Informati on Bureau, New Hampshire Employment Security 73
Perspecti ves on Middle Educati on Occupati ons in New Hampshire
Source: REMI PI+ 70-sector 1-region version 2.0.3 of New Hampshire
The value of jobs in middle education occupations to industry employment in New Hampshire can be assessed by the initial (2017) impact of “removing” direct and secondary jobs from the economy. Direct jobs are those in middle education occupations, while secondary impact jobs may be of any educational level.
The economic impact on employment in the Health care and social assistance sector would be 47,300 jobs initially, 37,300 direct jobs and an additional 10,000 secondary jobs (of all education levels) induced by jobs in middle education occupations. Occupations predominant in this sector include First-line supervisors of office and administrative support workers, Registered nurses, Radiologic technicians, Nursing assistants, and Dental hygienists.
Construction employment would account for 39,900 jobs in the first year, with 13,800 direct jobs and an additional 26,200 secondary jobs. Occupations predominant in this sector include Carpenters; Electricians; Plumbers, pipefitters, and steamfitters; Heavy and tractor-trailer truck drivers; and First-line supervisors of construction trades and extraction workers.
0 5 10 15 20 25 30 35 40 45 50
Healthcare and Social Assistance
Construction
Retail Trade
Other Services, ex. Public Administration
Manufacturing
Professional, Scientific, and Technical
Accommodation and Food Services
Educational Services
Administrative and Waste Management
Wholesale Trade
Finance and Insurance
Real Estate and Rental and Leasing
Transportation and Warehousing
Information
Thousands
Direct and induced secondary impact by industry sector
Direct
Secondary
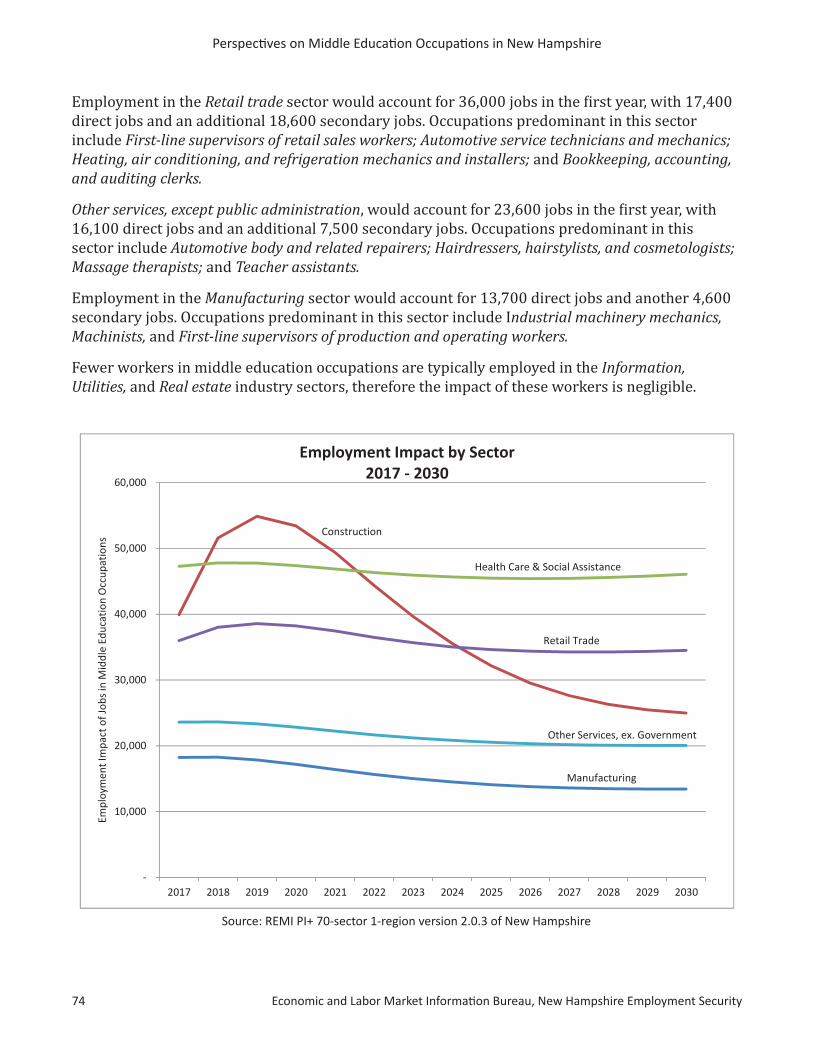
Perspecti ves on Middle Educati on Occupati ons in New Hampshire
74 Economic and Labor Market Informati on Bureau, New Hampshire Employment Security
Source: REMI PI+ 70-sector 1-region version 2.0.3 of New Hampshire
Employment in the Retail trade sector would account for 36,000 jobs in the first year, with 17,400 direct jobs and an additional 18,600 secondary jobs. Occupations predominant in this sector include First-line supervisors of retail sales workers; Automotive service technicians and mechanics; Heating, air conditioning, and refrigeration mechanics and installers; and Bookkeeping, accounting, and auditing clerks.
Other services, except public administration, would account for 23,600 jobs in the first year, with 16,100 direct jobs and an additional 7,500 secondary jobs. Occupations predominant in this sector include Automotive body and related repairers; Hairdressers, hairstylists, and cosmetologists; Massage therapists; and Teacher assistants.
Employment in the Manufacturing sector would account for 13,700 direct jobs and another 4,600 secondary jobs. Occupations predominant in this sector include Industrial machinery mechanics, Machinists, and First-line supervisors of production and operating workers.
Fewer workers in middle education occupations are typically employed in the Information, Utilities, and Real estate industry sectors, therefore the impact of these workers is negligible.
-
10,000
20,000
30,000
40,000
50,000
60,000
2017 2018 2019 2020 2021 2022 2023 2024 2025 2026 2027 2028 2029 2030
Empl
oym
ent I
mpa
ct o
f Job
s in
Mid
dle
Educ
atio
n O
ccup
atio
ns
Employment Impact by Sector 2017 - 2030
Construction
Health Care & Social Assistance
Retail Trade
Manufacturing
Other Services, ex. Government
Economic and Labor Market Informati on Bureau, New Hampshire Employment Security 75
Perspecti ves on Middle Educati on Occupati ons in New Hampshire
Impact of Middle Education Occupations through 2030
If the jobs in middle education occupations were “removed” from the economy, there would be a significant impact on several industry sectors, with five sectors affected by over 18,000 jobs in the initial year. The value of goods and services provided by jobs in these occupations flows through the economy and provides wages for workers and profits for businesses. Productivity would decline without jobs in middle occupations in the economy, and demand for goods and services would eventually be reduced, causing further declines.
Sectors respond to economic shock in various ways, often depending on the mix of inputs used, in terms of labor and capital. Construction, for example, requires capital expenditures such as heavy machinery, along with labor. Within the first two years, the greatest impact from the “removal” of jobs in middle education occupations would be in the Construction sector. Initially, the impact would be 40,000 jobs, direct and secondary, reaching 60,000 jobs two years later. The reason for the immediate impact is that regardless of fewer workers in the economy, there is a continuing need for infrastructure, such as new housing and commercial buildings, and road construction. After a few years, the impact on Construction jobs would be reduced as the economy adjusts, and firms and individuals find substitutes for business services unavailable in the local area, such as obtaining services from other states.
The other sectors would react in a similar fashion, with the initial employment impact tailing off over time, as businesses and individuals either leave the area or seek services from outside the local area.
Effect on the New Hampshire Economy
Middle education occupations are a vital part of New Hampshire’s economy; consequently the impact of “removing” 171,000 jobs with that educational level would reverberate throughout the economy. The impact on the economy can be measured by: employment, population, and gross domestic product.
The effect of jobs in middle education occupations on the New Hampshire economy can be seen in the gap between the baseline and the REMI simulation. The baseline for each measure represents the total estimated economic value in New Hampshire without change, while the REMI simulation line represents a simulated economic value resulting from the “removal” of jobs in middle education occupations, plus secondary jobs. The gap between the two lines is the estimated impact of jobs in middle education occupations on the New Hampshire economy.
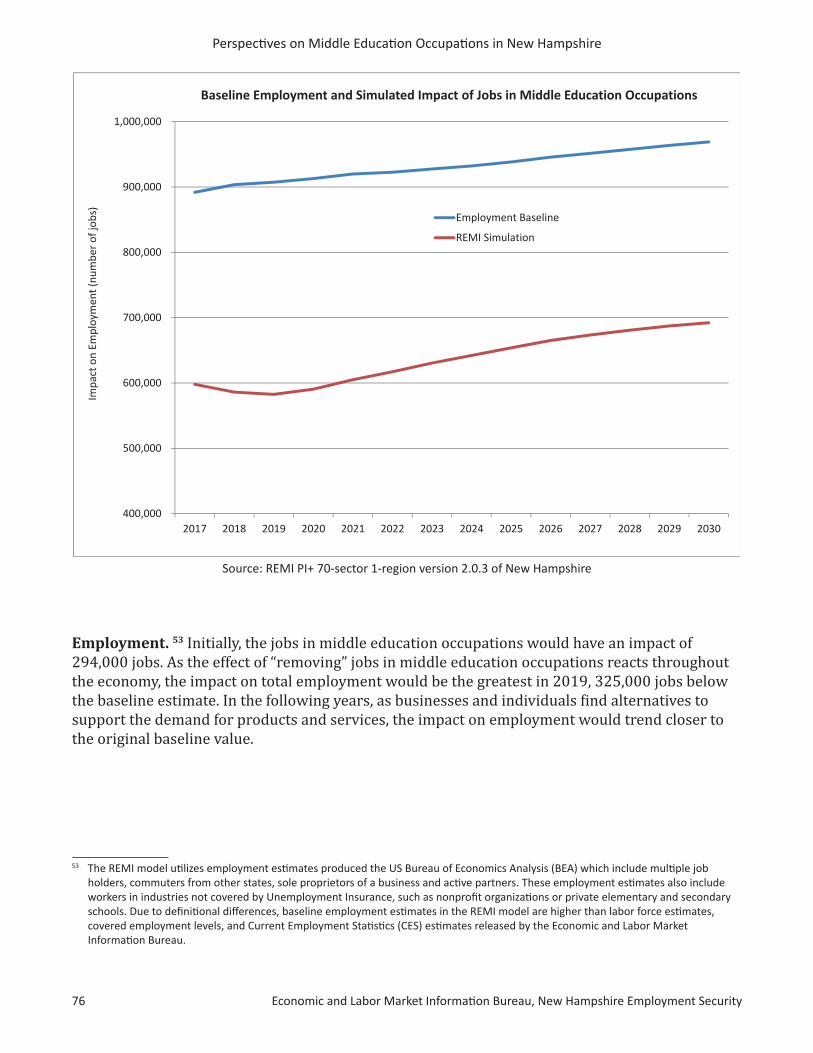
Perspecti ves on Middle Educati on Occupati ons in New Hampshire
76 Economic and Labor Market Informati on Bureau, New Hampshire Employment Security
Employment. 53 Initially, the jobs in middle education occupations would have an impact of 294,000 jobs. As the effect of “removing” jobs in middle education occupations reacts throughout the economy, the impact on total employment would be the greatest in 2019, 325,000 jobs below the baseline estimate. In the following years, as businesses and individuals find alternatives to support the demand for products and services, the impact on employment would trend closer to the original baseline value.
400,000
500,000
600,000
700,000
800,000
900,000
1,000,000
2017 2018 2019 2020 2021 2022 2023 2024 2025 2026 2027 2028 2029 2030
Impa
ct o
n Em
ploy
men
t (nu
mbe
r of j
obs)
Baseline Employment and Simulated Impact of Jobs in Middle Education Occupations
Employment Baseline
REMI Simulation
Source: REMI PI+ 70-sector 1-region version 2.0.3 of New Hampshire
53 The REMI model uti lizes employment esti mates produced the US Bureau of Economics Analysis (BEA) which include multi ple job holders, commuters from other states, sole proprietors of a business and acti ve partners. These employment esti mates also include workers in industries not covered by Unemployment Insurance, such as nonprofi t organizati ons or private elementary and secondary schools. Due to defi niti onal diff erences, baseline employment esti mates in the REMI model are higher than labor force esti mates, covered employment levels, and Current Employment Stati sti cs (CES) esti mates released by the Economic and Labor Market Informati on Bureau.
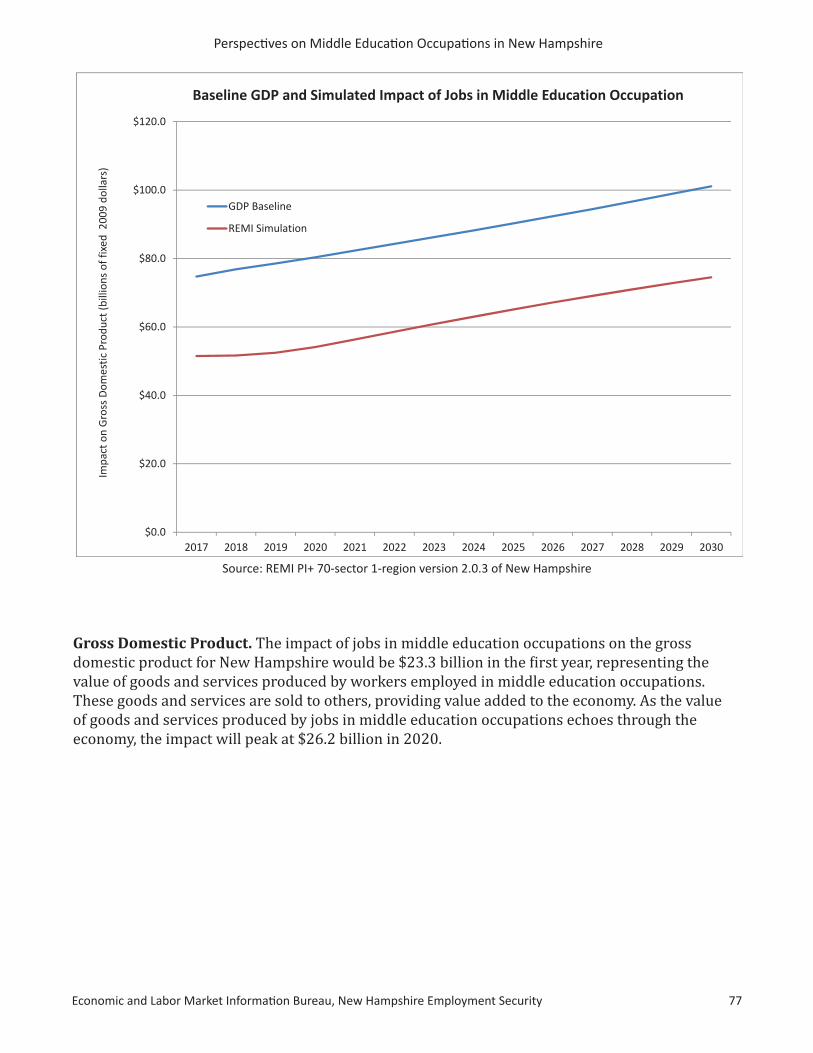
Economic and Labor Market Informati on Bureau, New Hampshire Employment Security 77
Perspecti ves on Middle Educati on Occupati ons in New Hampshire
Source: REMI PI+ 70-sector 1-region version 2.0.3 of New Hampshire
$0.0
$20.0
$40.0
$60.0
$80.0
$100.0
$120.0
2017 2018 2019 2020 2021 2022 2023 2024 2025 2026 2027 2028 2029 2030
Impa
ct o
n G
ross
Dom
estic
Pro
duct
(bill
ions
of f
ixed
200
9 do
llars
)Baseline GDP and Simulated Impact of Jobs in Middle Education Occupation
GDP Baseline
REMI Simulation
Gross Domestic Product. The impact of jobs in middle education occupations on the gross domestic product for New Hampshire would be $23.3 billion in the first year, representing the value of goods and services produced by workers employed in middle education occupations. These goods and services are sold to others, providing value added to the economy. As the value of goods and services produced by jobs in middle education occupations echoes through the economy, the impact will peak at $26.2 billion in 2020.
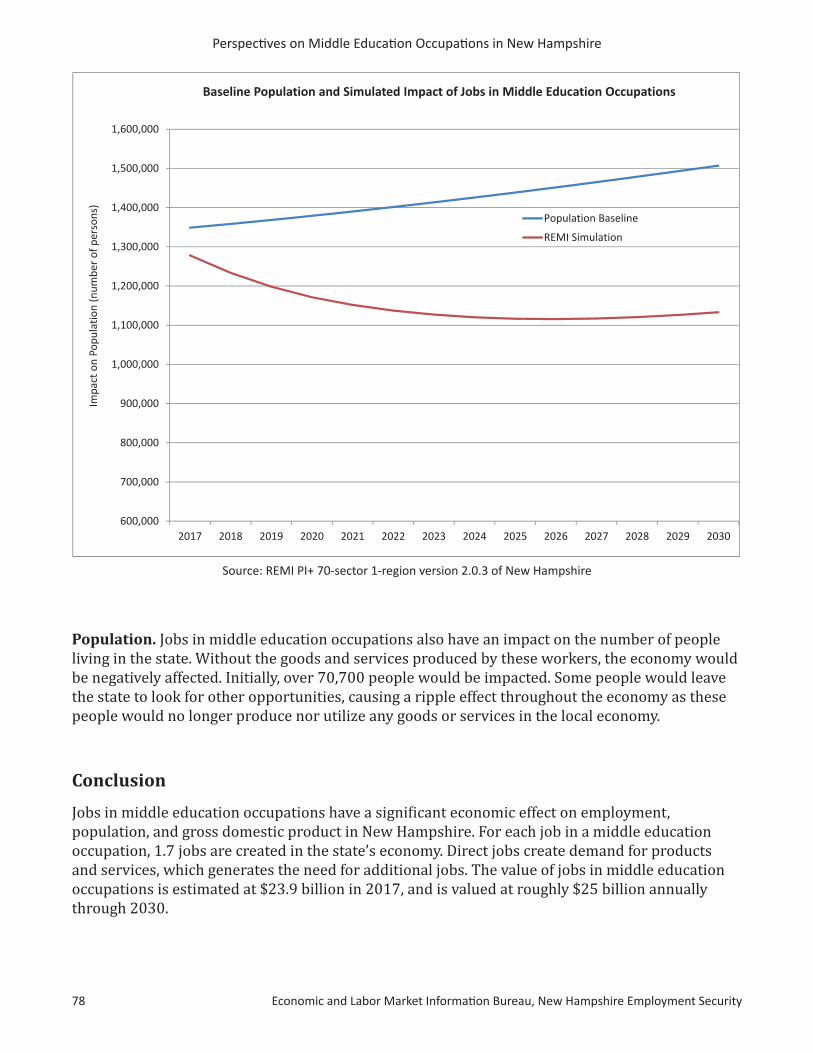
Perspecti ves on Middle Educati on Occupati ons in New Hampshire
78 Economic and Labor Market Informati on Bureau, New Hampshire Employment Security
Source: REMI PI+ 70-sector 1-region version 2.0.3 of New Hampshire
Population. Jobs in middle education occupations also have an impact on the number of people living in the state. Without the goods and services produced by these workers, the economy would be negatively affected. Initially, over 70,700 people would be impacted. Some people would leave the state to look for other opportunities, causing a ripple effect throughout the economy as these people would no longer produce nor utilize any goods or services in the local economy.
Conclusion
Jobs in middle education occupations have a significant economic effect on employment, population, and gross domestic product in New Hampshire. For each job in a middle education occupation, 1.7 jobs are created in the state’s economy. Direct jobs create demand for products and services, which generates the need for additional jobs. The value of jobs in middle education occupations is estimated at $23.9 billion in 2017, and is valued at roughly $25 billion annually through 2030.
600,000
700,000
800,000
900,000
1,000,000
1,100,000
1,200,000
1,300,000
1,400,000
1,500,000
1,600,000
2017 2018 2019 2020 2021 2022 2023 2024 2025 2026 2027 2028 2029 2030
Impa
ct o
n Po
pula
tion
(num
ber
of p
erso
ns)
Baseline Population and Simulated Impact of Jobs in Middle Education Occupations
Population Baseline
REMI Simulation

Economic and Labor Market Informati on Bureau, New Hampshire Employment Security 79
Perspecti ves on Middle Educati on Occupati ons in New Hampshire
Appendices

Perspecti ves on Middle Educati on Occupati ons in New Hampshire
80 Economic and Labor Market Informati on Bureau, New Hampshire Employment Security

Economic and Labor Market Informati on Bureau, New Hampshire Employment Security 81
Perspecti ves on Middle Educati on Occupati ons in New Hampshire
54 U.S. Bureau of Labor Stati sti cs, Occupati onal Data Defi niti ons, April 2016. htt ps://www.bls.gov/emp/ep_nem_defi niti ons.htm
Appendix A. Education and Training Definitions
The U.S. Bureau of Labor Statistics, Employment Projections Program, has established entry-level education and training needs for all occupations.54 Each occupation is assigned typical education needed for entry, work experience in a related occupation, and typical on-the-job training needed to attain competency.
Typical Education Needed for Entry
Identifies the usual education workers need for entry-level employment. There are eight educational levels.
• Doctoral or professional degree: A Doctoral degree is an academic award requiring at least three years of study beyond a baccalaureate, resulting in a Ph.D., or a professional practice doctorate, which requires at least six years of academic study beyond a baccalaureate.
• Master’s degree: An academic award requiring one to two years of academic study beyond a baccalaureate.
• Bachelor’s degree: A baccalaureate is an academic award requiring at least four, but not more than five, years of full-time equivalent college-level work.
• Associate’s degree: An academic award requiring at least two, but not more than four, years of full-time equivalent college-level work.
• Postsecondary non-degree award: Formal postsecondary schooling leading to an award but not a degree which may last from a few weeks up to two years.
• Some college, no degree: Achievement of a high school diploma or equivalent plus one or more postsecondary courses that did not result in a degree or award.
• High school diploma or equivalent: Completion of a high school diploma or equivalent credential.
• No formal educational credential: Entry into the occupations typically does not need any formal credentials issued by an educational institution, such as a high school diploma or postsecondary certificate.
Work Experience in a Related Occupation
Identifies related work experience typically needed for entry-level employment.
• Five years or more: Occupations requiring five years or more work experience in a related occupation.
• Less than five years: Occupations requiring work experience of less than five years.
• None: Related work experience is not typically needed for entry-level employment.
Perspecti ves on Middle Educati on Occupati ons in New Hampshire
82 Economic and Labor Market Informati on Bureau, New Hampshire Employment Security
Typical On-the-Job Training Needed to Attain Competency in the Occupation
Identifies training typically needed after hire to attain competency in the skills needed in the occupation. Training is occupation-specific, and can easily be transferred to another job in the same occupation.
• Internship/Residency: Preparation in a field such as teaching or medicine, generally under supervision in a professional setting.
• Apprenticeship: A formal relationship between a worker and sponsor that combines on-the-job training and related occupation-specific technical instruction, lasting three to five years on average.
• Long-Term On-the-Job Training: More than 12 months of on-the-job training; may combine experience and classroom instruction.
• Moderate-Term On-the-Job Training: Between one and 12 months of on-the-job experience and informal training.
• Short-Term On-the-Job Training: One month or less on-the-job experience and informal training.
• None: Additional on-the-job training or experience typically is not needed to attain competency.

Economic and Labor Market Informati on Bureau, New Hampshire Employment Security 83
Perspecti ves on Middle Educati on Occupati ons in New Hampshire
SOC 2014 2024 Numeric Percent Work Post HireCode Occupation Title Estimated Projected Change Change Growth Replacement Total Experience Training
Entry Level Education of an Associate's Degree17 3021 Aerospace Engineering and Operations Technicians n n n n n n n None None19 4011 Agricultural and Food Science Technicians n n n n n n n None Moderate OJT53 2021 Air Traffic Controllers 447 437 10 2.2% 0 14 14 None Long term OJT17 3011 Architectural and Civil Drafters 503 488 15 3.0% 0 6 6 None None49 2091 Avionics Technicians 89 89 0 0.0% 0 2 2 None None27 4012 Broadcast Technicians 137 150 13 9.5% 1 3 4 None Short term OJT29 2031 Cardiovascular Technologists and Technicians 185 218 33 17.8% 3 4 7 None None19 4031 Chemical Technicians 150 158 8 5.3% 1 4 5 None Moderate OJT17 3022 Civil Engineering Technicians 156 165 9 5.8% 1 4 5 None None15 1152 Computer Network Support Specialists 512 560 48 9.4% 5 7 12 None None29 2021 Dental Hygienists 1,176 1,347 171 14.5% 17 19 36 None None43 9031 Desktop Publishers 68 57 11 16.2% 0 2 2 None Short term OJT29 2032 Diagnostic Medical Sonographers 200 237 37 18.5% 4 4 8 None None29 2051 Dietetic Technicians 122 138 16 13.1% 2 1 3 None None17 3019 Drafters, All Other 191 181 10 5.2% 0 2 2 None None17 3012 Electrical and Electronics Drafters 154 161 7 4.5% 1 2 3 None None17 3023 Electrical and Electronics Engineering Technicians 1,078 1,078 0 0.0% 0 26 26 None None17 3024 Electro Mechanical Technicians 158 163 5 3.2% 0 4 4 None None17 3029 Engineering Technicians, Except Drafters, All Other 559 569 10 1.8% 1 14 15 None None17 3025 Environmental Engineering Technicians n n n n n n n None None19 4091 Environmental Science and Protection Technicians,
Including Health 237 265 28 11.8% 3 10 13 None None19 4093 Forest and Conservation Technicians 67 65 2 3.0% 0 3 3 None None11 9061 Funeral Service Managers n n n n n n n < 5 years None19 4041 Geological and Petroleum Technicians 25 28 3 12.0% 0 1 1 None Moderate OJT43 4161 Human Resources Assistants, Except Payroll and
Timekeeping 546 531 15 2.7% 0 6 6 None None17 3026 Industrial Engineering Technicians 419 425 6 1.4% 1 10 11 None None19 4099 Life, Physical, and Social Science Technicians, All Other 184 199 15 8.2% 2 8 10 None None29 2035 Magnetic Resonance Imaging Technologists 111 111 0 0.0% 0 2 2 < 5 years None17 3013 Mechanical Drafters 287 269 18 6.3% 0 3 3 None None17 3027 Mechanical Engineering Technicians 375 406 31 8.3% 3 9 12 None None29 2012 Medical and Clinical Laboratory Technicians 480 524 44 9.2% 4 12 16 None None49 9062 Medical Equipment Repairers 147 158 11 7.5% 1 3 4 None Moderate OJT39 4031 Morticians, Undertakers, and Funeral Directors 93 99 6 6.5% 1 2 3 None Long term OJT29 2033 Nuclear Medicine Technologists 52 51 1 1.9% 0 1 1 None None19 4051 Nuclear Technicians n n n n n n n None Moderate OJT31 2011 Occupational Therapy Assistants 175 225 50 28.6% 5 5 10 None None23 2011 Paralegals and Legal Assistants 1,265 1,317 52 4.1% 5 28 33 None None31 2021 Physical Therapist Assistants 515 699 184 35.7% 18 15 33 None None25 2011 Preschool Teachers, Except Special Education 2,854 3,001 147 5.2% 15 84 99 None None29 1124 Radiation Therapists 116 125 9 7.8% 1 3 4 None None49 2021 Radio, Cellular, and Tower Equipment Installers and
Repairers n n n n n n n None Moderate OJT29 2034 Radiologic Technologists 773 803 30 3.9% 3 15 18 None None29 1141 Registered Nurses 12,592 14,528 1,936 15.4% 194 297 491 None None29 1126 Respiratory Therapists 372 412 40 10.8% 4 9 13 None None29 2054 Respiratory Therapy Technicians n n n n n n n None None51 9141 Semiconductor Processors 115 113 2 1.7% 0 2 2 None Moderate OJT29 2056 Veterinary Technologists and Technicians 721 872 151 20.9% 15 7 22 None None15 1134 Web Developers 907 1,172 265 29.2% 26 12 38 None None
n = data do not meet disclosure standards Source: Economic and Labor Market Information Bureau, New Hampshire Employment Security
Appendix B. New Hampshire Occupational Employment Projections, 2014 2024Middle Education Occupations by Entry Level Educational Requirements
Average Annual Openings
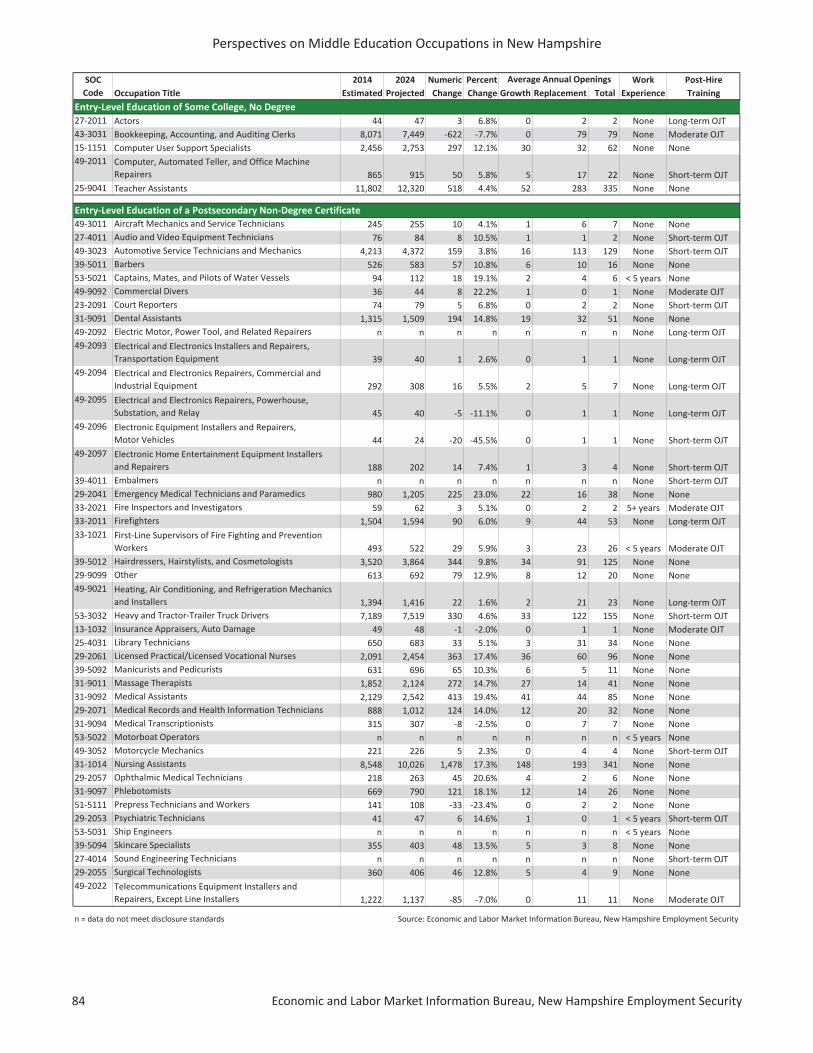
Perspecti ves on Middle Educati on Occupati ons in New Hampshire
84 Economic and Labor Market Informati on Bureau, New Hampshire Employment Security
SOC 2014 2024 Numeric Percent Work Post HireCode Occupation Title Estimated Projected Change Change Growth Replacement Total Experience Training
27 2011 Actors 44 47 3 6.8% 0 2 2 None Long term OJT43 3031 Bookkeeping, Accounting, and Auditing Clerks 8,071 7,449 622 7.7% 0 79 79 None Moderate OJT15 1151 Computer User Support Specialists 2,456 2,753 297 12.1% 30 32 62 None None49 2011 Computer, Automated Teller, and Office Machine
Repairers 865 915 50 5.8% 5 17 22 None Short term OJT25 9041 Teacher Assistants 11,802 12,320 518 4.4% 52 283 335 None None
49 3011 Aircraft Mechanics and Service Technicians 245 255 10 4.1% 1 6 7 None None27 4011 Audio and Video Equipment Technicians 76 84 8 10.5% 1 1 2 None Short term OJT49 3023 Automotive Service Technicians and Mechanics 4,213 4,372 159 3.8% 16 113 129 None Short term OJT39 5011 Barbers 526 583 57 10.8% 6 10 16 None None53 5021 Captains, Mates, and Pilots of Water Vessels 94 112 18 19.1% 2 4 6 < 5 years None49 9092 Commercial Divers 36 44 8 22.2% 1 0 1 None Moderate OJT23 2091 Court Reporters 74 79 5 6.8% 0 2 2 None Short term OJT31 9091 Dental Assistants 1,315 1,509 194 14.8% 19 32 51 None None49 2092 Electric Motor, Power Tool, and Related Repairers n n n n n n n None Long term OJT49 2093 Electrical and Electronics Installers and Repairers,
Transportation Equipment 39 40 1 2.6% 0 1 1 None Long term OJT49 2094 Electrical and Electronics Repairers, Commercial and
Industrial Equipment 292 308 16 5.5% 2 5 7 None Long term OJT49 2095 Electrical and Electronics Repairers, Powerhouse,
Substation, and Relay 45 40 5 11.1% 0 1 1 None Long term OJT49 2096 Electronic Equipment Installers and Repairers,
Motor Vehicles 44 24 20 45.5% 0 1 1 None Short term OJT49 2097 Electronic Home Entertainment Equipment Installers
and Repairers 188 202 14 7.4% 1 3 4 None Short term OJT39 4011 Embalmers n n n n n n n None Short term OJT29 2041 Emergency Medical Technicians and Paramedics 980 1,205 225 23.0% 22 16 38 None None33 2021 Fire Inspectors and Investigators 59 62 3 5.1% 0 2 2 5+ years Moderate OJT33 2011 Firefighters 1,504 1,594 90 6.0% 9 44 53 None Long term OJT33 1021 First Line Supervisors of Fire Fighting and Prevention
Workers 493 522 29 5.9% 3 23 26 < 5 years Moderate OJT39 5012 Hairdressers, Hairstylists, and Cosmetologists 3,520 3,864 344 9.8% 34 91 125 None None29 9099 Other 613 692 79 12.9% 8 12 20 None None49 9021 Heating, Air Conditioning, and Refrigeration Mechanics
and Installers 1,394 1,416 22 1.6% 2 21 23 None Long term OJT53 3032 Heavy and Tractor Trailer Truck Drivers 7,189 7,519 330 4.6% 33 122 155 None Short term OJT13 1032 Insurance Appraisers, Auto Damage 49 48 1 2.0% 0 1 1 None Moderate OJT25 4031 Library Technicians 650 683 33 5.1% 3 31 34 None None29 2061 Licensed Practical/Licensed Vocational Nurses 2,091 2,454 363 17.4% 36 60 96 None None39 5092 Manicurists and Pedicurists 631 696 65 10.3% 6 5 11 None None31 9011 Massage Therapists 1,852 2,124 272 14.7% 27 14 41 None None31 9092 Medical Assistants 2,129 2,542 413 19.4% 41 44 85 None None29 2071 Medical Records and Health Information Technicians 888 1,012 124 14.0% 12 20 32 None None31 9094 Medical Transcriptionists 315 307 8 2.5% 0 7 7 None None53 5022 Motorboat Operators n n n n n n n < 5 years None49 3052 Motorcycle Mechanics 221 226 5 2.3% 0 4 4 None Short term OJT31 1014 Nursing Assistants 8,548 10,026 1,478 17.3% 148 193 341 None None29 2057 Ophthalmic Medical Technicians 218 263 45 20.6% 4 2 6 None None31 9097 Phlebotomists 669 790 121 18.1% 12 14 26 None None51 5111 Prepress Technicians and Workers 141 108 33 23.4% 0 2 2 None None29 2053 Psychiatric Technicians 41 47 6 14.6% 1 0 1 < 5 years Short term OJT53 5031 Ship Engineers n n n n n n n < 5 years None39 5094 Skincare Specialists 355 403 48 13.5% 5 3 8 None None27 4014 Sound Engineering Technicians n n n n n n n None Short term OJT29 2055 Surgical Technologists 360 406 46 12.8% 5 4 9 None None49 2022 Telecommunications Equipment Installers and
Repairers, Except Line Installers 1,222 1,137 85 7.0% 0 11 11 None Moderate OJT
n = data do not meet disclosure standards Source: Economic and Labor Market Information Bureau, New Hampshire Employment Security
Entry Level Education of Some College, No Degree
Entry Level Education of a Postsecondary Non Degree Certificate
Average Annual Openings

Economic and Labor Market Informati on Bureau, New Hampshire Employment Security 85
Perspecti ves on Middle Educati on Occupati ons in New Hampshire
SOC 2014 2024 Numeric Percent Work Post HireCode Occupation Title Estimated Projected Change Change Growth Replacement Total Experience Training
53 1011 Aircraft Cargo Handling Supervisors n n n n n n n < 5 years None53 2022 Airfield Operations Specialists n n n n n n n None Long term OJT49 3021 Automotive Body and Related Repairers 758 814 56 7.4% 6 17 23 None Long term OJT47 2011 Boilermakers 193 210 17 8.8% 2 3 5 None Apprenticeship47 2021 Brickmasons and Blockmasons 364 418 54 14.8% 5 3 8 None Apprenticeship49 3031 Bus and Truck Mechanics and Diesel Engine Specialists 844 963 119 14.1% 12 14 26 None Long term OJT47 2031 Carpenters 4,138 4,353 215 5.2% 22 48 70 None Apprenticeship35 1011 Chefs and Head Cooks 759 831 72 9.5% 7 11 18 5+ years None51 8091 Chemical Plant and System Operators n n n n n n n None Long term OJT27 2032 Choreographers n n n n n n n 5+ years Long term OJT13 1031 Claims Adjusters, Examiners, and Investigators 1,372 1,432 60 4.4% 6 34 40 None Long term OJT51 4012 Computer Numerically Controlled Machine Tool
Programmers, Metal and Plastic 159 199 40 25.2% 4 5 9 None Long term OJT47 4011 Construction and Building Inspectors 322 346 24 7.5% 2 9 11 5+ years Moderate OJT53 7021 Crane and Tower Operators n n n n n n n < 5 years Moderate OJT33 3021 Detectives and Criminal Investigators 324 339 15 4.6% 2 8 10 < 5 years Moderate OJT49 9051 Electrical Power Line Installers and Repairers 804 838 34 4.2% 3 32 35 None Long term OJT47 2111 Electricians 2,323 2,575 252 10.8% 25 36 61 None Apprenticeship47 4021 Elevator Installers and Repairers n n n n n n n None Apprenticeship53 7032 Excavating and Loading Machine and Dragline Operators 454 475 21 4.6% 2 5 7 < 5 years Moderate OJT43 6011 Executive Secretaries and Executive Administrative
Assistants 1,610 1,523 87 5.4% 0 17 17 < 5 years None47 5031 Explosives Workers, Ordnance Handling Experts, and
Blasters n n n n n n n < 5 years Long term OJT49 3041 Farm Equipment Mechanics and Service Technicians 79 84 5 6.3% 0 2 2 None Long term OJT11 9013 Farmers, Ranchers, and Other Agricultural Managers 3,955 4,030 75 1.9% 8 67 75 5+ years None47 1011 First Line Supervisors of Construction Trades and
Extraction Workers 2,467 2,620 153 6.2% 15 20 35 5+ years None33 1011 First Line Supervisors of Correctional Officers 112 116 4 3.6% 0 3 3 < 5 years Moderate OJT45 1011 First Line Supervisors of Farming, Fishing, and Forestry
Workers 106 103 3 2.8% 0 3 3 < 5 years None35 1012 First Line Supervisors of Food Preparation and Serving
Workers 3,266 3,622 356 10.9% 36 97 133 < 5 years None53 1021 First Line Supervisors of Helpers, Laborers, and Material
Movers, Hand 465 486 21 4.5% 2 15 17 < 5 years None37 1011 First Line Supervisors of Housekeeping and Janitorial
Workers 1,046 1,127 81 7.7% 8 16 24 < 5 years None37 1012 First Line Supervisors of Landscaping, Lawn Service, and
Groundskeeping Workers 988 1,061 73 7.4% 7 16 23 < 5 years None49 1011 First Line Supervisors of Mechanics, Installers, and
Repairers 2,026 2,109 83 4.1% 8 40 48 < 5 years None41 1012 First Line Supervisors of Non Retail Sales Workers 2,415 2,566 151 6.3% 15 28 43 < 5 years None43 1011 First Line Supervisors of Office and Administrative
Support Workers 6,905 7,532 627 9.1% 63 104 167 < 5 years None39 1021 First Line Supervisors of Personal Service Workers 1,013 1,131 118 11.6% 12 19 31 < 5 years None33 1012 First Line Supervisors of Police and Detectives 488 515 27 5.5% 3 17 20 < 5 years Moderate OJT51 1011 First Line Supervisors of Production/Operating Workers 2,792 2,816 24 0.9% 2 44 46 < 5 years None33 1099 First Line Supervisors of Protective Service Workers,
All Other 259 280 21 8.1% 2 7 9 < 5 years None41 1011 First Line Supervisors of Retail Sales Workers 9,184 9,565 381 4.1% 38 205 243 < 5 years None53 1031 First Line Supervisors of Transportation and Material
Moving Machine/Vehicle Operators 691 721 30 4.3% 3 22 25 < 5 years None53 2031 Flight Attendants n n n n n n n < 5 years Moderate OJT11 9051 Food Service Managers 1,559 1,658 99 6.4% 10 31 41 < 5 years None33 2022 Forest Fire Inspectors and Prevention Specialists 184 213 29 15.8% 3 5 8 < 5 years Moderate OJT11 9071 Gaming Managers n n n n n n n < 5 years None39 1011 Gaming Supervisors 48 52 4 8.3% 0 2 2 < 5 years None
n = data do not meet disclosure standards Source: Economic and Labor Market Information Bureau, New Hampshire Employment Security
Entry Level Education of a High School Diploma or Equivalent Plus Experience, Apprenticeship, or Long Term (12+ months) On the Job Training
Average Annual Openings
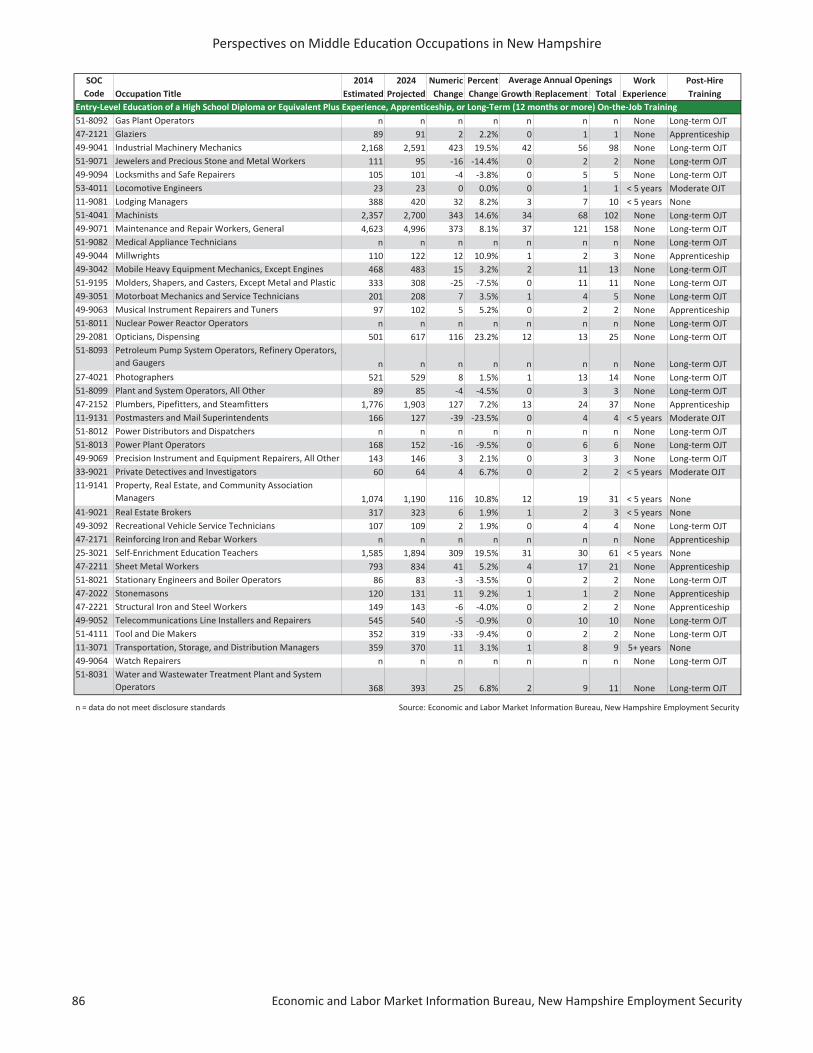
Perspecti ves on Middle Educati on Occupati ons in New Hampshire
86 Economic and Labor Market Informati on Bureau, New Hampshire Employment Security
SOC 2014 2024 Numeric Percent Work Post HireCode Occupation Title Estimated Projected Change Change Growth Replacement Total Experience Training
51 8092 Gas Plant Operators n n n n n n n None Long term OJT47 2121 Glaziers 89 91 2 2.2% 0 1 1 None Apprenticeship49 9041 Industrial Machinery Mechanics 2,168 2,591 423 19.5% 42 56 98 None Long term OJT51 9071 Jewelers and Precious Stone and Metal Workers 111 95 16 14.4% 0 2 2 None Long term OJT49 9094 Locksmiths and Safe Repairers 105 101 4 3.8% 0 5 5 None Long term OJT53 4011 Locomotive Engineers 23 23 0 0.0% 0 1 1 < 5 years Moderate OJT11 9081 Lodging Managers 388 420 32 8.2% 3 7 10 < 5 years None51 4041 Machinists 2,357 2,700 343 14.6% 34 68 102 None Long term OJT49 9071 Maintenance and Repair Workers, General 4,623 4,996 373 8.1% 37 121 158 None Long term OJT51 9082 Medical Appliance Technicians n n n n n n n None Long term OJT49 9044 Millwrights 110 122 12 10.9% 1 2 3 None Apprenticeship49 3042 Mobile Heavy Equipment Mechanics, Except Engines 468 483 15 3.2% 2 11 13 None Long term OJT51 9195 Molders, Shapers, and Casters, Except Metal and Plastic 333 308 25 7.5% 0 11 11 None Long term OJT49 3051 Motorboat Mechanics and Service Technicians 201 208 7 3.5% 1 4 5 None Long term OJT49 9063 Musical Instrument Repairers and Tuners 97 102 5 5.2% 0 2 2 None Apprenticeship51 8011 Nuclear Power Reactor Operators n n n n n n n None Long term OJT29 2081 Opticians, Dispensing 501 617 116 23.2% 12 13 25 None Long term OJT51 8093 Petroleum Pump System Operators, Refinery Operators,
and Gaugers n n n n n n n None Long term OJT27 4021 Photographers 521 529 8 1.5% 1 13 14 None Long term OJT51 8099 Plant and System Operators, All Other 89 85 4 4.5% 0 3 3 None Long term OJT47 2152 Plumbers, Pipefitters, and Steamfitters 1,776 1,903 127 7.2% 13 24 37 None Apprenticeship11 9131 Postmasters and Mail Superintendents 166 127 39 23.5% 0 4 4 < 5 years Moderate OJT51 8012 Power Distributors and Dispatchers n n n n n n n None Long term OJT51 8013 Power Plant Operators 168 152 16 9.5% 0 6 6 None Long term OJT49 9069 Precision Instrument and Equipment Repairers, All Other 143 146 3 2.1% 0 3 3 None Long term OJT33 9021 Private Detectives and Investigators 60 64 4 6.7% 0 2 2 < 5 years Moderate OJT11 9141 Property, Real Estate, and Community Association
Managers 1,074 1,190 116 10.8% 12 19 31 < 5 years None41 9021 Real Estate Brokers 317 323 6 1.9% 1 2 3 < 5 years None49 3092 Recreational Vehicle Service Technicians 107 109 2 1.9% 0 4 4 None Long term OJT47 2171 Reinforcing Iron and Rebar Workers n n n n n n n None Apprenticeship25 3021 Self Enrichment Education Teachers 1,585 1,894 309 19.5% 31 30 61 < 5 years None47 2211 Sheet Metal Workers 793 834 41 5.2% 4 17 21 None Apprenticeship51 8021 Stationary Engineers and Boiler Operators 86 83 3 3.5% 0 2 2 None Long term OJT47 2022 Stonemasons 120 131 11 9.2% 1 1 2 None Apprenticeship47 2221 Structural Iron and Steel Workers 149 143 6 4.0% 0 2 2 None Apprenticeship49 9052 Telecommunications Line Installers and Repairers 545 540 5 0.9% 0 10 10 None Long term OJT51 4111 Tool and Die Makers 352 319 33 9.4% 0 2 2 None Long term OJT11 3071 Transportation, Storage, and Distribution Managers 359 370 11 3.1% 1 8 9 5+ years None49 9064 Watch Repairers n n n n n n n None Long term OJT51 8031 Water and Wastewater Treatment Plant and System
Operators 368 393 25 6.8% 2 9 11 None Long term OJT
n = data do not meet disclosure standards Source: Economic and Labor Market Information Bureau, New Hampshire Employment Security
Entry Level Education of a High School Diploma or Equivalent Plus Experience, Apprenticeship, or Long Term (12 months or more) On the Job Training
Average Annual Openings
Other publications from the Economic and Labor Market Information Bureau available online at www.nhes.nh.gov/elmi
Community ProfilesEconomic Analysis ReportsEconomic Impact Scenarios (REMI Model) Hospital Construction Projects in New Hampshire What if the Shipyard Closed? Childcare in New Hampshire Industry Sector Analysis Health Care Workers in New Hampshire Information Technology Occupations in New Hampshire Positively Productive The Hospitality Industry Cluster in New Hampshire Work in Progress: Construction in New HampshireJob Outlook and Locator: Occupations by IndustryLicensed, Certified, and Registered Occupations in New HampshireLocal Employment Dynamics/OnTheMap Analysis The Upper Valley – OnTheMap Sullivan County: A Workforce StudyManufacturing in New Hampshire Fact SheetNew Hampshire Economic Conditions New Hampshire Occupational Employment and WagesReal-Time Labor Market Information/Online Job Ads Analysis New Hampshire Online Job Ads Summary Staffing Agency Job Ads in New Hampshire Truckers: Keep Goods Moving Nursing Job Postings in New Hampshire New Hampshire Computer and Information Technology Job PostingsSTEM in New Hampshire: A Labor Demand-Supply AnalysisVeterans in New HampshireVital Signs, New Hampshire Economic and Social IndicatorsWorkforce and Career Information User’s Guide
New Hampshire Employment Security is a proud member
of America’s Workforce Network and NH WORKS. NHES
is an Equal Opportunity Employer and complies with the
Americans with Disabilities Act. Auxiliary aids and services
are available upon request to individuals with disabilities.
TDD Access: Relay NH 1-800-735-2964
The products and services of the NHES Economic and Labor Market Information Bureau result from the cooperation and teamwork of the entire ELMI Bureau staff: Michael Argiropolis, Robert Cote, Gregory David, Bruce DeMay, Deborah Dunn, Katrina Evans, Eleanor Goodbread, Debra Jodoin, Anita Josten, Donald Kelley, Annette Nielsen, Bruce Olinsky, Martin Page, Peter Sgrulloni, and James Smith.
For the latest information on the New Hampshire economy subscribe to ELMI E-lerts, a free subscription service providing notices about release of the monthly unemployment rate, updated economic and labor force statistics, new reports and publications, and announcements about new and updated career resources. To subscribe, go to www.nhes.nh.gov/elmi and click on Subscribe to ELMI E-lerts.