midwest residential heating fuel use...
TRANSCRIPT

Midwest Residential Heating Fuel Use Assessment
Fred Iutzi1, Xiaolan Liu1, & David Ripplinger2
Heating the Midwest Conference & Expo Apr. 24-26, 2013 • Carlton, MN
1. Illinois Institute for Rural Affairs at Western Illinois University 2. Dept. of Agribusiness & Appl. Economics, North Dakota State University
• Pete Aube, Potlatch Corp.
• Steve Bertjens, USDA
• Stuart Birrell, ISU
• Cara Carper, SW Badger RC&D
• Mike Curci, Andritz Inc.
• Al Doering, AURI
• Nate Dorr, NWMF
• Mary Eaton, Idea Circle
• Lindberg Ekoka, MFRC
• Rod Enberg, Enberg Logging Sup.
• Jill Euken, ISU
• Cam Fanfulik, NWRDC
• Dave Fiebelkorn, Woodshed Ren.
• Joel Haskard, UMN
• Steve Hubbard, State of WI
• Scott Hull, State of WI
• Fred Iutzi, IIRA
• Steve John, AWI
• Bill Johnson, BCS
• Kevin Kephart, SDSU
• Kimberly Korbecki, State of MI
• Joe Kramer, Energy Ctr. of WI
• Nan Larson, AURI
• Gail Leverson, Cass Co., MN
• Mark Lindquist, State of MN
• Xiaolan Liu, IIRA
• Thein Maung, NDSU
• Amanda Mott, State of WI
• Steve Olson, Fond du Lac Res.
• Lissa Pawlisch, UMN
• Don Peterson, Ren. Res. Solutions
• Becky Philipp, AURI
• Mike Polzin, MN Power
• Gary Radloff, UW
• Chris Reynolds, Phoenix Recycling
• Steve Richter, TNC
• Dave Ripplinger, NDSU
• Scott Robinson, CVAE
• Dean Sedgwick, Itasca Power
• Wade Stomgren, RMS
• Doug Tiffany, UMN
• Kevin Triemstra, MN Biomass Exch.
• Mike Troge, Oneida Nation
• Bruno Zagar, Fond du Lac Res.
• Diomedes Zamora, UMN
HTM Biomass Resources & Demographics Action Team
Team leadership Becky Philipp & Al Doering
Study authors Fred Iutzi, Xiaolan Liu, & David Ripplinger

Residential heating: The low-hanging fruit of biomass development
Iutzi et al., 2013
$-
$5.00
$10.00
$15.00
$20.00
$25.00
$30.00
$35.00
$40.00
$45.00
$50.00
De
c-1
99
5
Jun
-19
96
De
c-1
99
6
Jun
-19
97
De
c-1
99
7
Jun
-19
98
De
c-1
99
8
Jun
-19
99
De
c-1
99
9
Jun
-20
00
De
c-2
00
0
Jun
-20
01
De
c-2
00
1
Jun
-20
02
De
c-2
00
2
Jun
-20
03
De
c-2
00
3
Jun
-20
04
De
c-2
00
4
Jun
-20
05
De
c-2
00
5
Jun
-20
06
Dec
-200
6
Jun
-20
07
Dec
-200
7
Jun
-20
08
De
c-2
00
8
Jun
-20
09
De
c-2
00
9
Jun
-20
10
De
c-2
01
0
Jun
-20
11
De
c-2
01
1
Jun
-20
12
De
c-2
01
2
Dollars per Million BTU
Electric Resistance Heat
Propane (Residential)
#2 heating oil
Natural Gas (Residential)
Pellets - Bulk Delivery
source: EIA, regional sources, FutureMetrics
Strauss, 2013
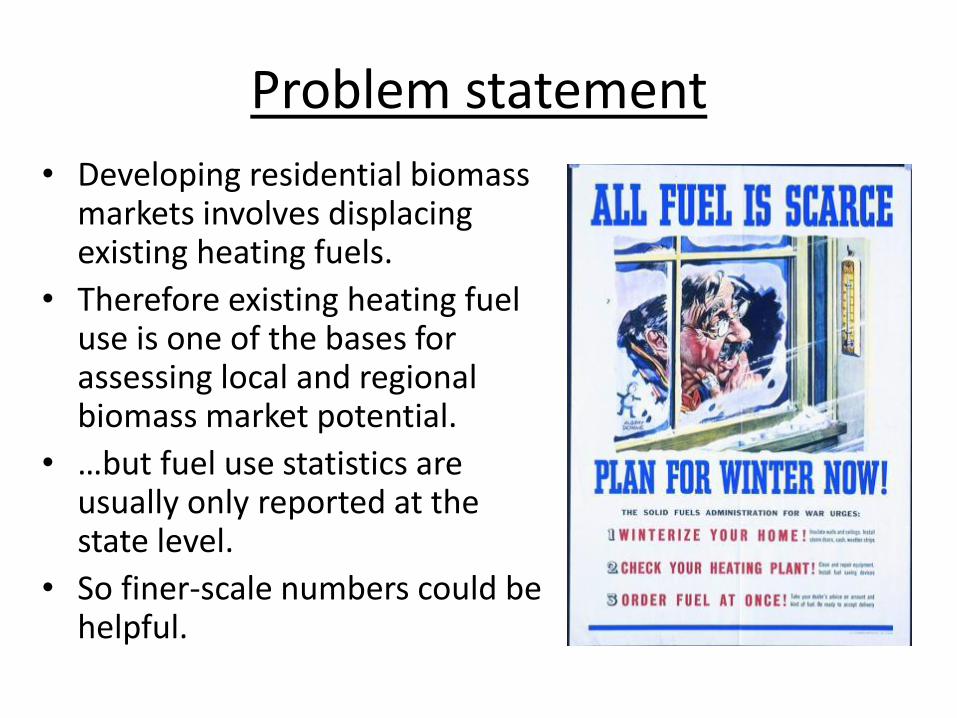
Problem statement
• Developing residential biomass markets involves displacing existing heating fuels.
• Therefore existing heating fuel use is one of the bases for assessing local and regional biomass market potential.
• …but fuel use statistics are usually only reported at the state level.
• So finer-scale numbers could be helpful.

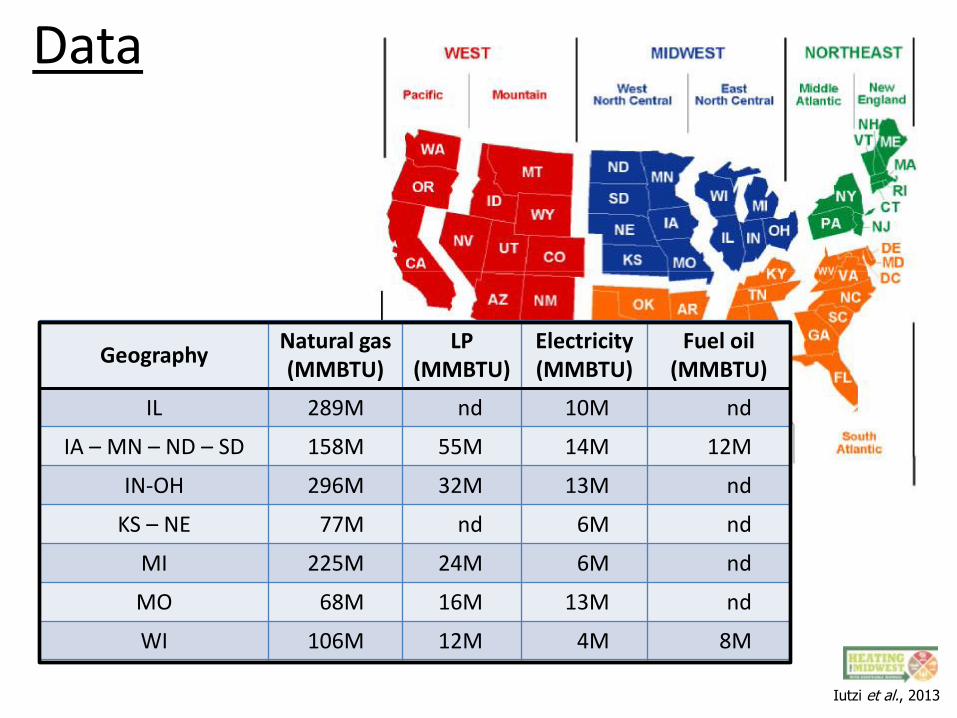
Data
Geography Natural gas (MMBTU)
LP (MMBTU)
Electricity (MMBTU)
Fuel oil (MMBTU)
IL 289M nd 10M nd
IA – MN – ND – SD 158M 55M 14M 12M
IN-OH 296M 32M 13M nd
KS – NE 77M nd 6M nd
MI 225M 24M 6M nd
MO 68M 16M 13M nd
WI 106M 12M 4M 8M
Residential Energy Consumption Survey (RECS) provides estimates of energy used for residential heating broken down by fuel.
Used 2009 data. (Most recent available.)
Iutzi et al., 2013
Data
Geography Natural gas (MMBTU)
LP (MMBTU)
Electricity (MMBTU)
Fuel oil (MMBTU)
IL 289M nd 10M nd
IA – MN – ND – SD 158M 55M 14M 12M
IN-OH 296M 32M 13M nd
KS – NE 77M nd 6M nd
MI 225M 24M 6M nd
MO 68M 16M 13M nd
WI 106M 12M 4M 8M
Iutzi et al., 2013

County-level estimates of number of households using each heating fuel.
Used five-year average, 2007-2011.
Data
Iutzi et al., 2013

Data
Natural gas Iutzi et al., 2013

Data
LP Iutzi et al., 2013

Data
Electricity Iutzi et al., 2013

Data
Fuel Oil Iutzi et al., 2013

Data
Total Households Iutzi et al., 2013

Data
NOAA National Climatic Data Center (NCDC) data set TR-9640 provides annual heating degree day accumulation by climate division.
Calculated a ten-year average, 2001-2010. Imputed division averages to counties. Calculated statewide averages.
Iutzi et al., 2013

Data
HDD Iutzi et al., 2013

Iutzi et al., 2013
Methods 1. For each state or multi-state
grouping, calculated fuel consumption in MMBTU per household per HDD. Repeated for each fuel.
2. For each county, multiplied corresponding state consumption factor by total households and annual HDD. Repeated for each fuel.
3. For each county, calculated hypothetical biomass demand under scenarios of 10% & 25% displacement of LP + electricity.
MMBTU / household / HDD =
consumption factor
• IA - MN - ND - SD
• IL • IN - OH • MI • MO • WI
consumption factor x
total households x
annual HDDs =
fuel consumption MMBTU
Each of: • 305 co. • 102 co. • 180 co. • 83 co. • 115 co. • 72 co.
(LP MMBTU + Elec. MMBTU)
x % displacement
/ 16 MMBTU / t DM
• NG • LP • Elec.
• NG • LP • Elec.
Each of:
• 857 co.
• 10%
• 25%

Results
Natural gas Iutzi et al., 2013

Results
LP Iutzi et al., 2013

Results
Electricity Iutzi et al., 2013

Residential Heating
Biomass Demand From Replacement
of 10% of LP and Electricity Used for
10% Biomass Iutzi et al., 2013
Results

Residential Heating
Biomass Demand From Replacement
of 25% of LP and Electricity Used for
25% Biomass Iutzi et al., 2013
Results
Iutzi et al., 2013
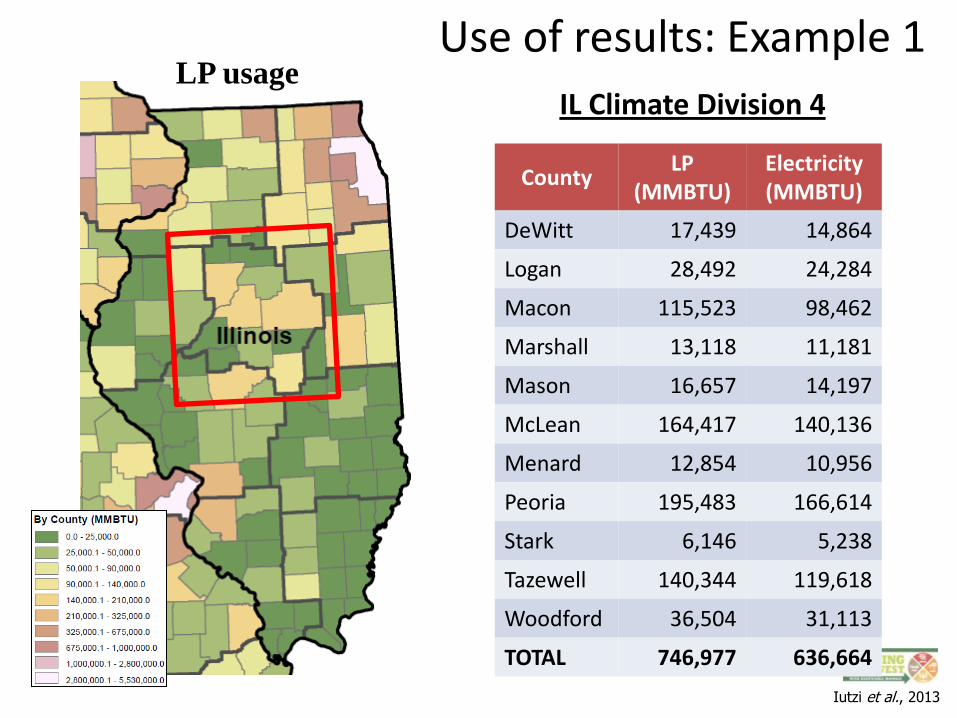
LP usage Use of results: Example 1
County LP
(MMBTU) Electricity (MMBTU)
DeWitt 17,439 14,864
Logan 28,492 24,284
Macon 115,523 98,462
Marshall 13,118 11,181
Mason 16,657 14,197
McLean 164,417 140,136
Menard 12,854 10,956
Peoria 195,483 166,614
Stark 6,146 5,238
Tazewell 140,344 119,618
Woodford 36,504 31,113
TOTAL 746,977 636,664
IL Climate Division 4

Use of results: Example 1
Fuel consumed MMBTU
Propane 747,000
Electricity 637,000
Total high- price fuels
1,380,000
10% scenario 138,000
15% scenario 207,000
Biomass demand t DM / yr*
10% scenario 8,620
25% scenario 12,900
* Assuming 16 MMBTU / t DM.
11 counties of IL Climate Division 4
Iutzi et al., 2013
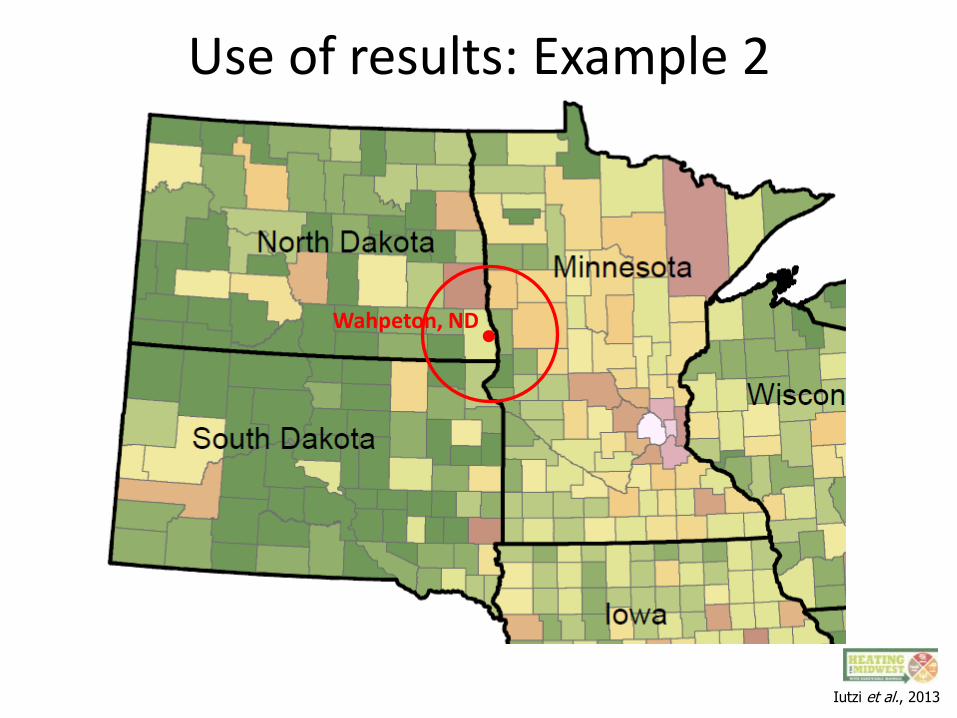
Use of results: Example 2
Wahpeton, ND
Iutzi et al., 2013

Iutzi et al., 2013
Fuel consumed MMBTU
Propane 2,160,000
Electricity 950,000
Total high-price fuels
2,710,000
10% scenario 270,000
25% scenario 680,000
Biomass demand* t DM / yr
10% scenario 17,000
25% scenario 42,500
* Assuming 16 MMBTU / t DM.
Use of results: Example 2
Wahpeton, ND region
• Clay, MN
• Grant, MN
• Otter Tail, MN
• Traverse, MN
• Wilkin, MN
• Cass, ND
• Ransom, ND
• Richland, ND
• Sargent, ND
• Marshall, SD
• Roberts, SD

Accessing the results
• Spreadsheet of county-level results to be posted with slides on HTM website.
• Report will be published later in 2013.
Deschaine (NACD), 2007
Iutzi et al., 2013
www.heatingthemidwest.org
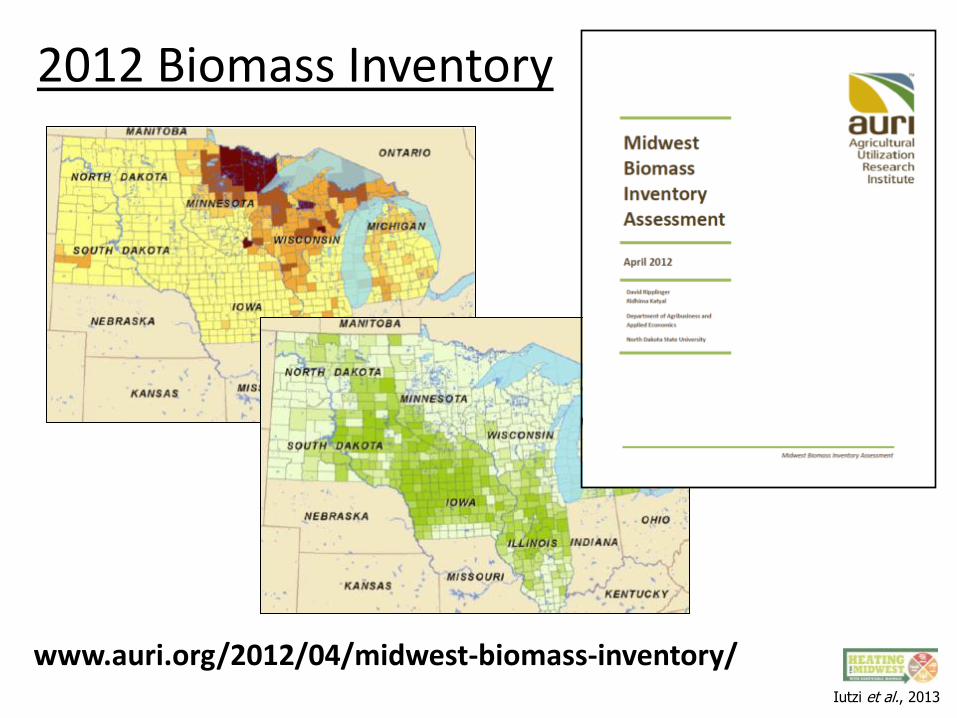
www.auri.org/2012/04/midwest-biomass-inventory/
2012 Biomass Inventory
Iutzi et al., 2013

Next directions
• Expand assessment to commercial & ag sectors
• Link consumer demographics to market behavior
• Integrate natural gas distribution infrastructure and price information into assessment
• Other directions? Deschaine (NACD), 2007

HTM Biomass Resources & Demographics Action Team
www.heatingthemidwest.org
Team contact Becky Philipp, AURI 218-280-8575 [email protected]
Author contacts Fred Iutzi, MS, IIRA at WIU [email protected], 309-298-1453 Xiaolan Liu, PhD, IIRA at WIU [email protected], 309-298-2526 David Ripplinger, PhD, NDSU [email protected], 701-231-5265